


Características


¿Tienes alguna pregunta?
Recomendar


2 diapositivas
Website UI Mockup Device Display Presentation
Showcase your website's interface with the Website UI Mockup Device Display slide. This professional and modern layout features a desktop screen to elegantly present your web design, user interface, or digital product. Perfect for designers, developers, and marketing presentations. Fully editable and compatible with PowerPoint, Keynote, and Google Slides.


20 diapositivas
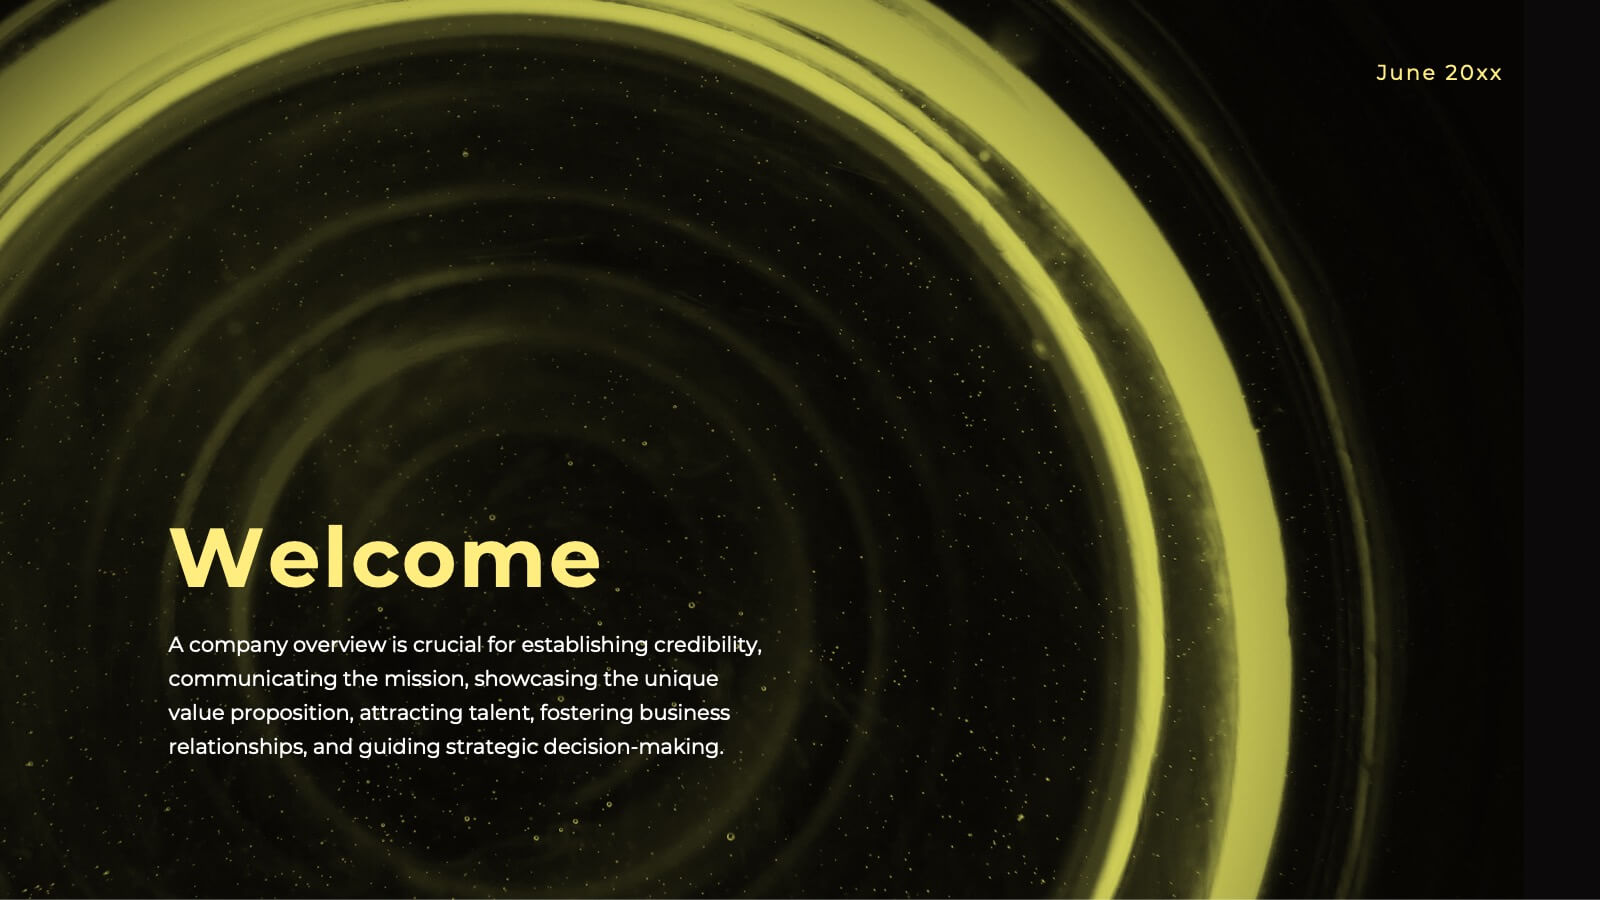
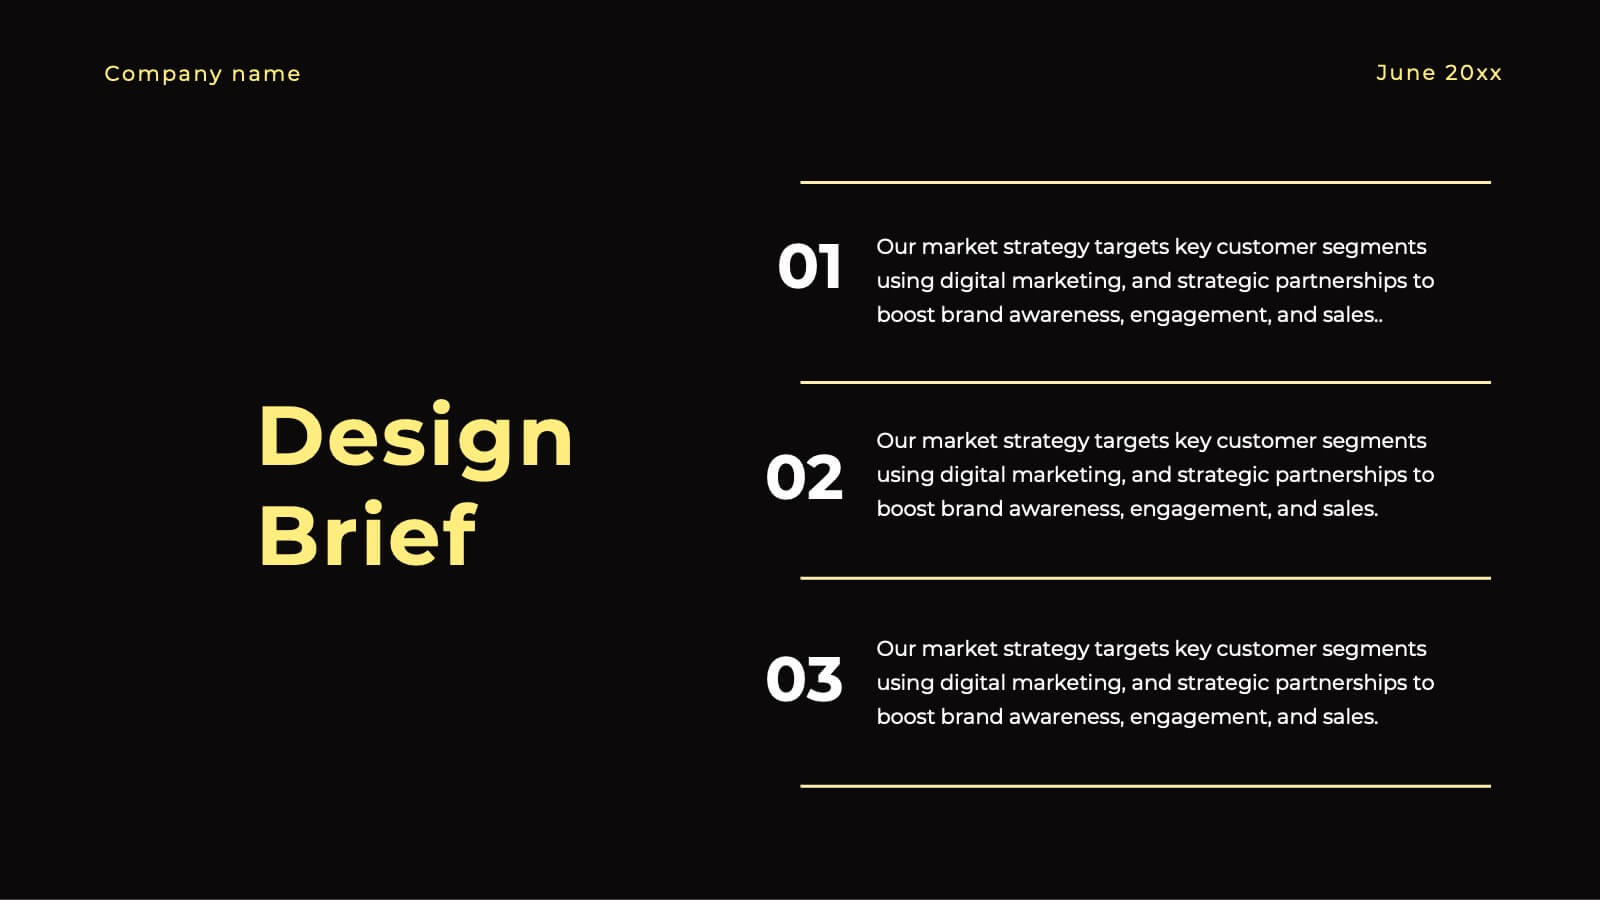
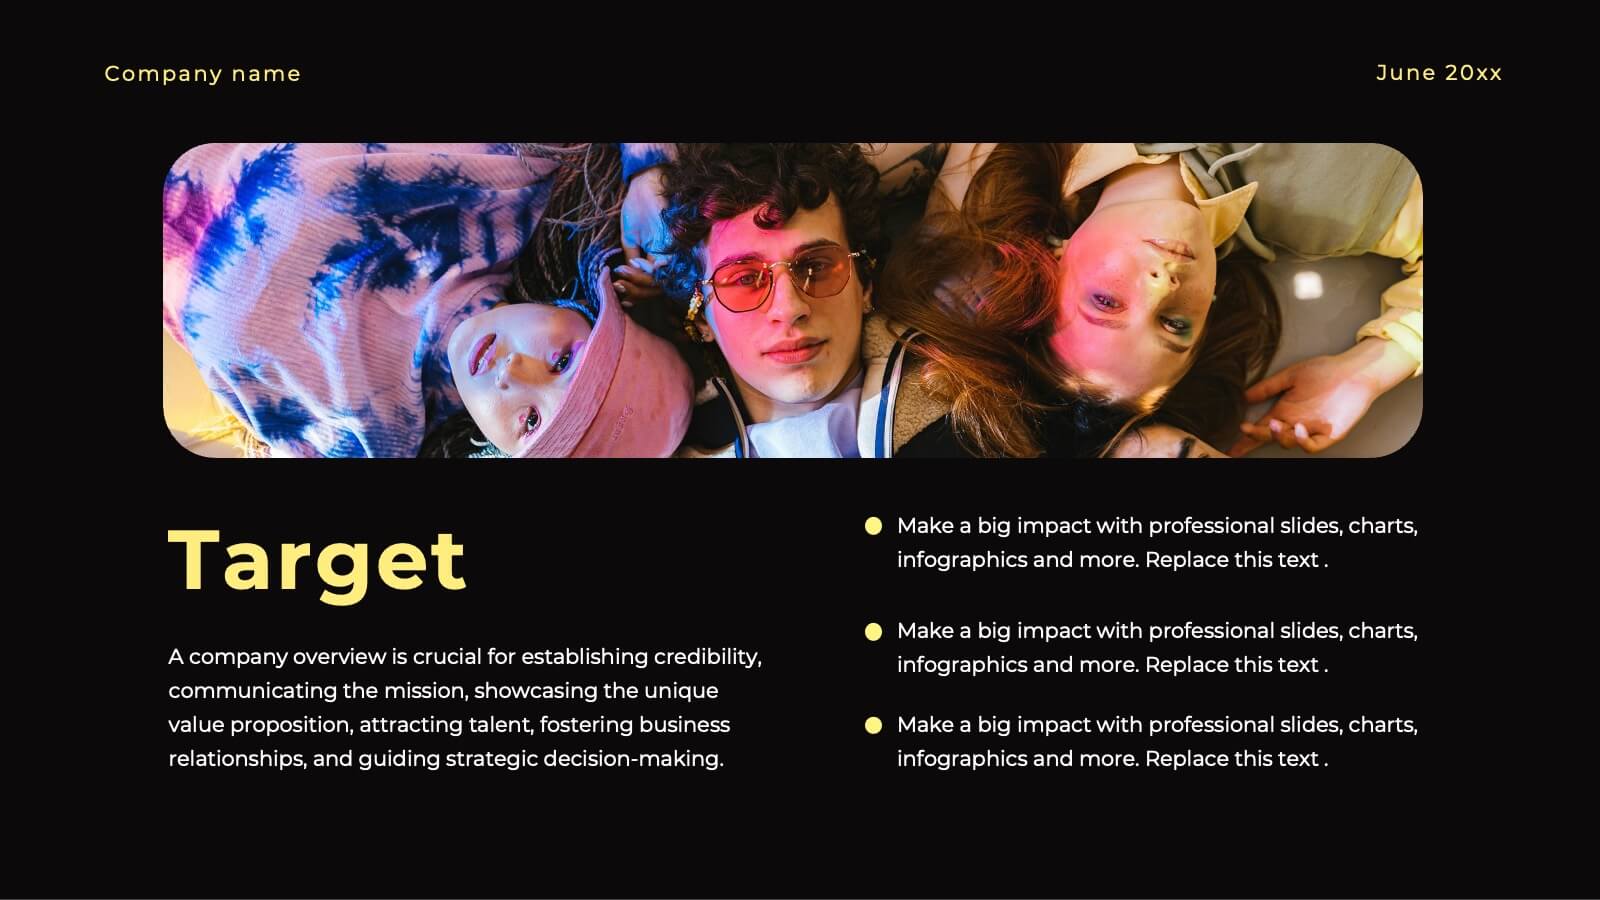
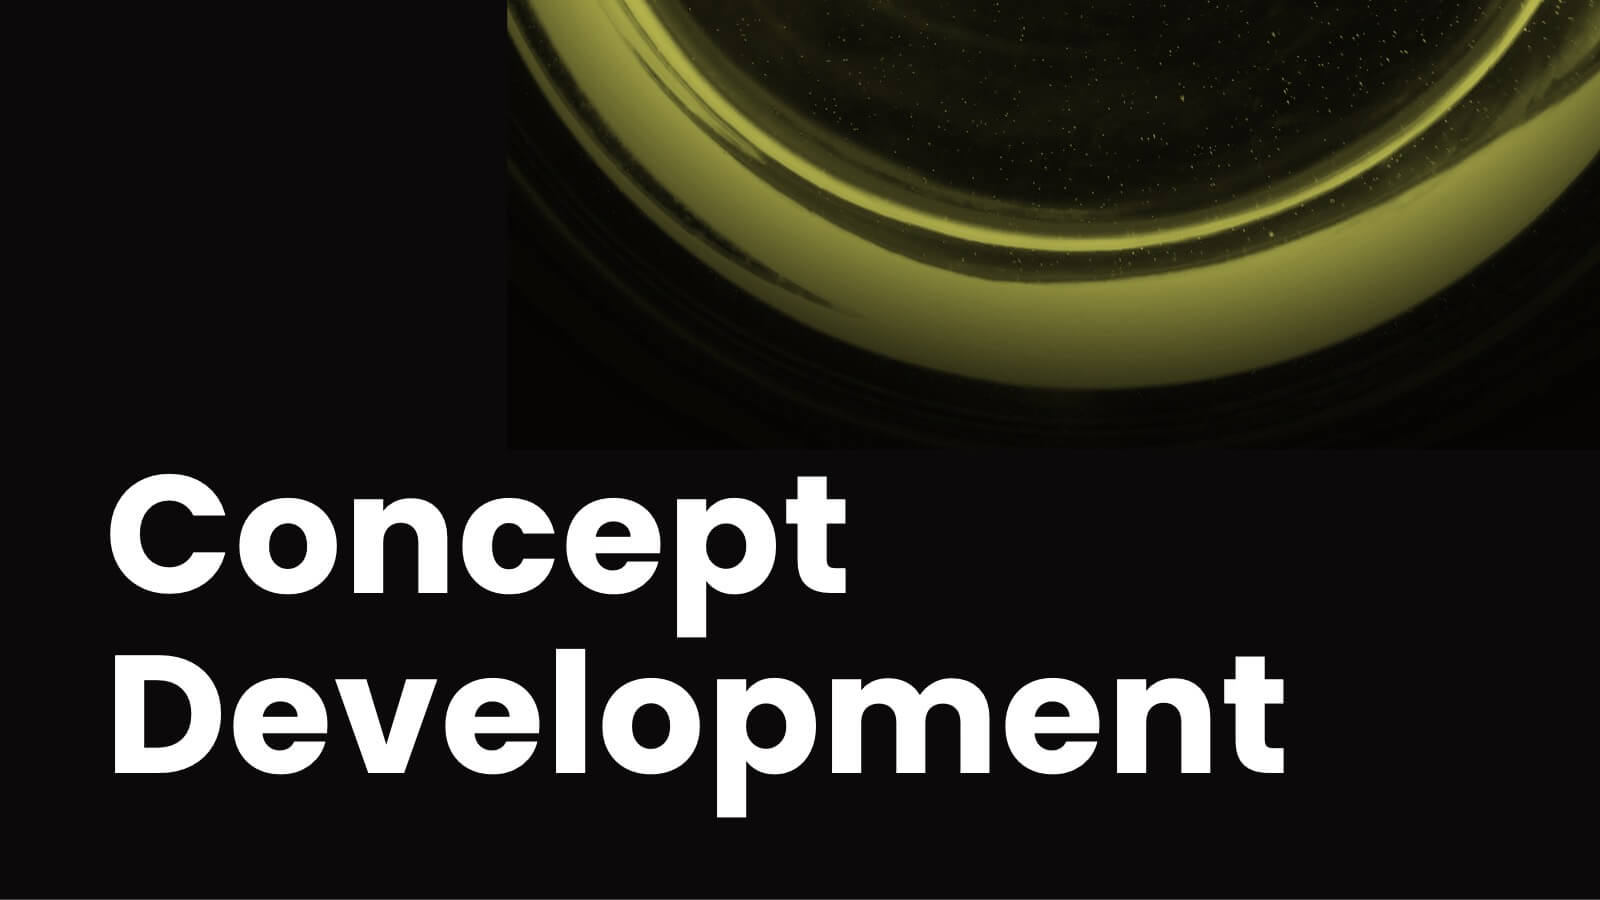
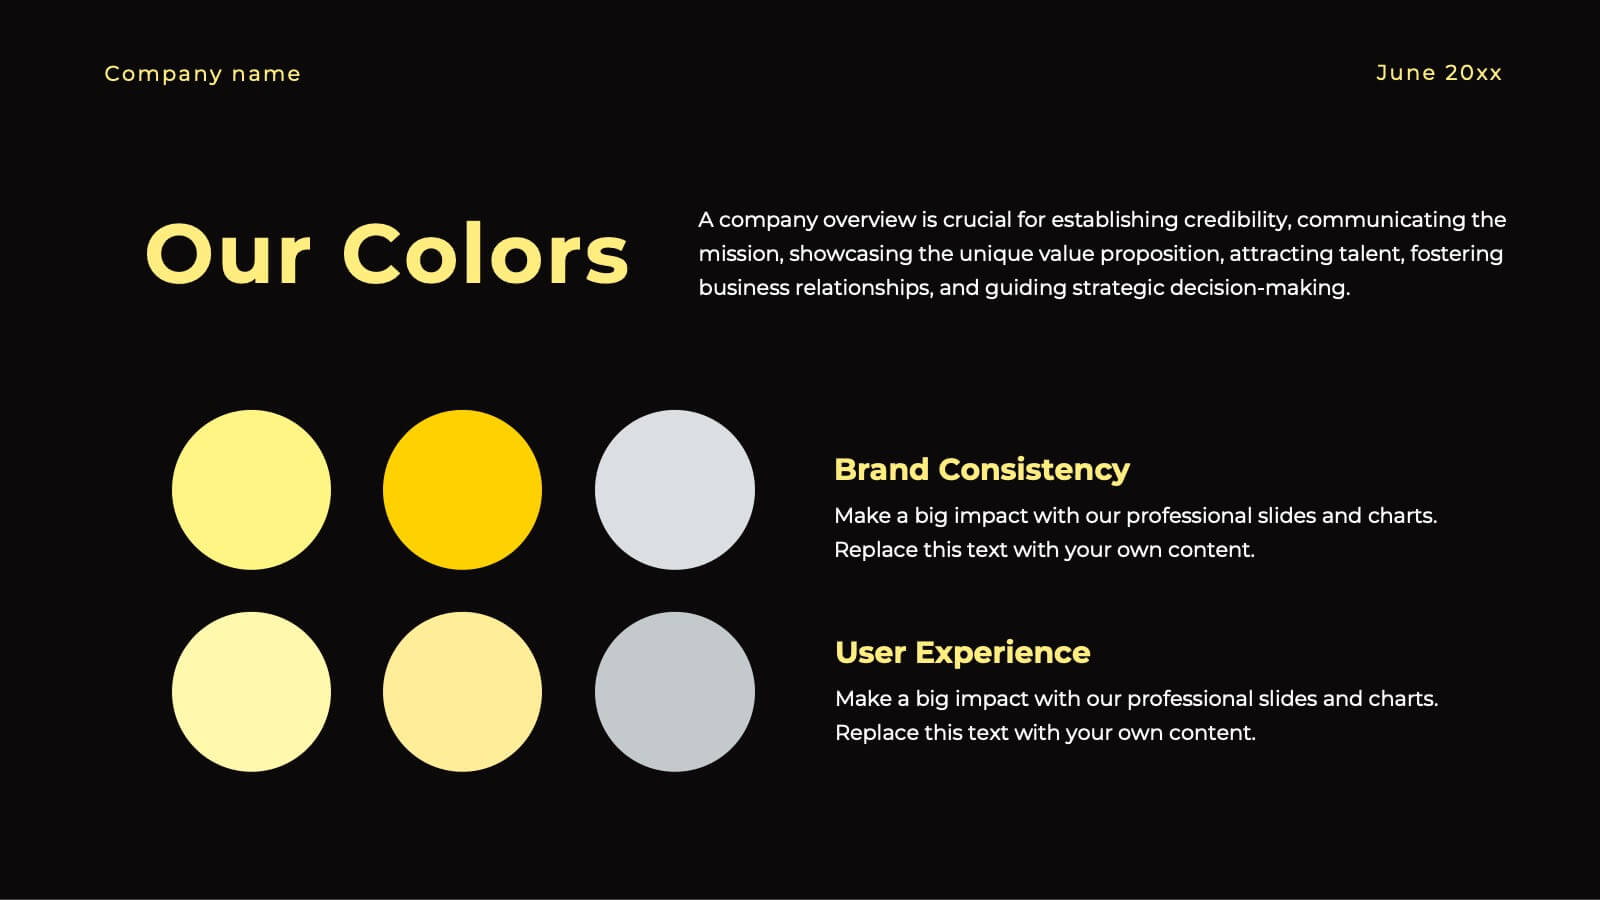
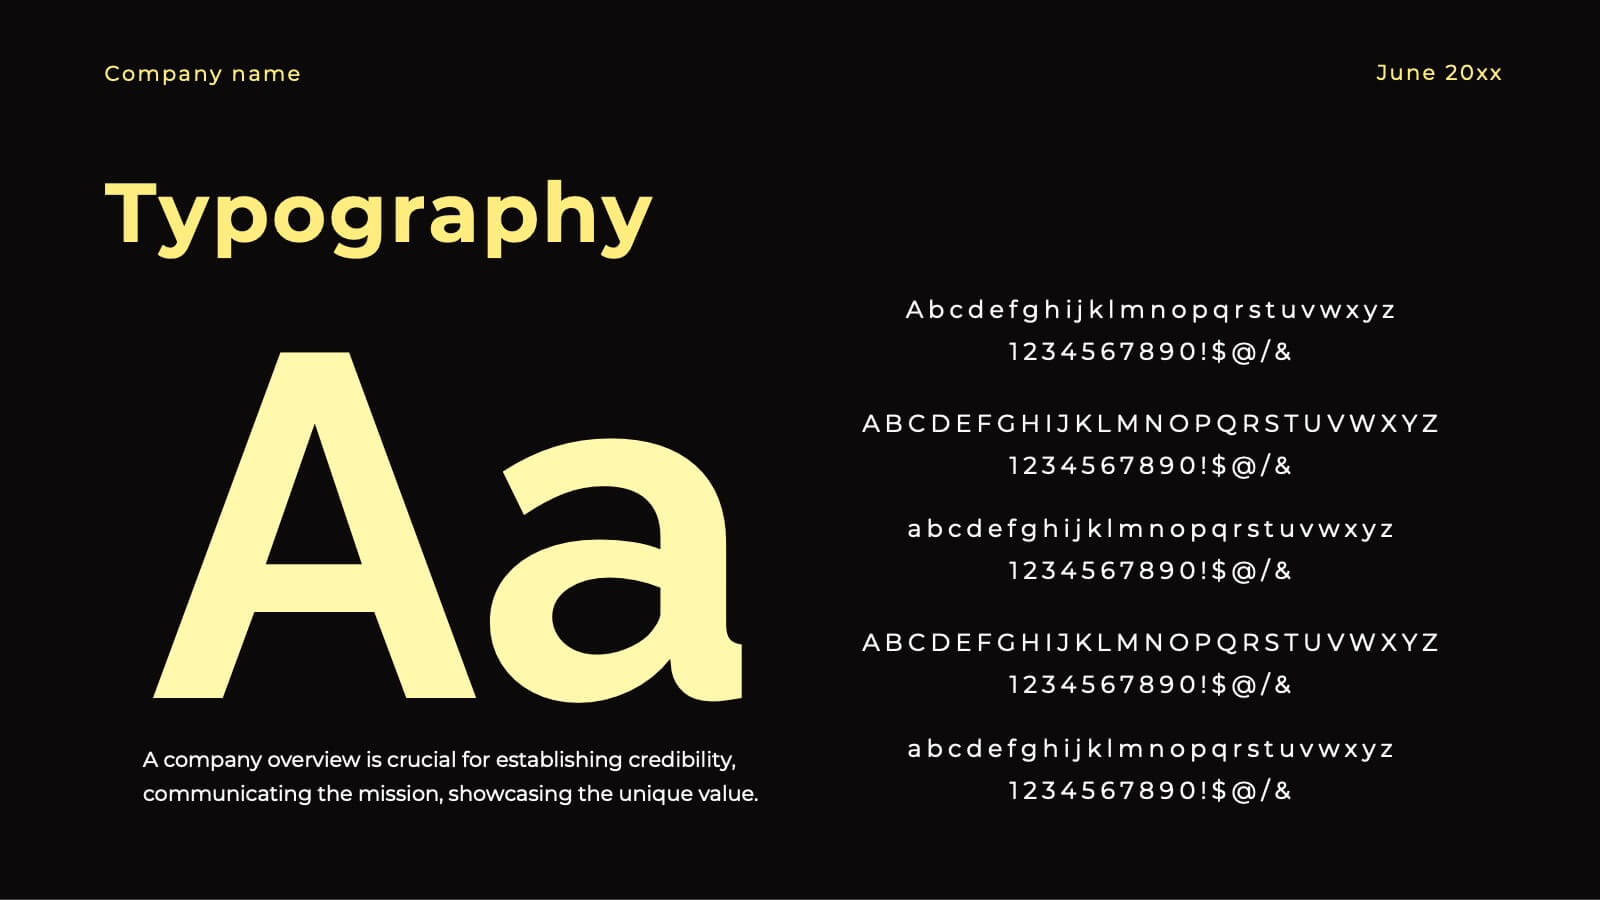
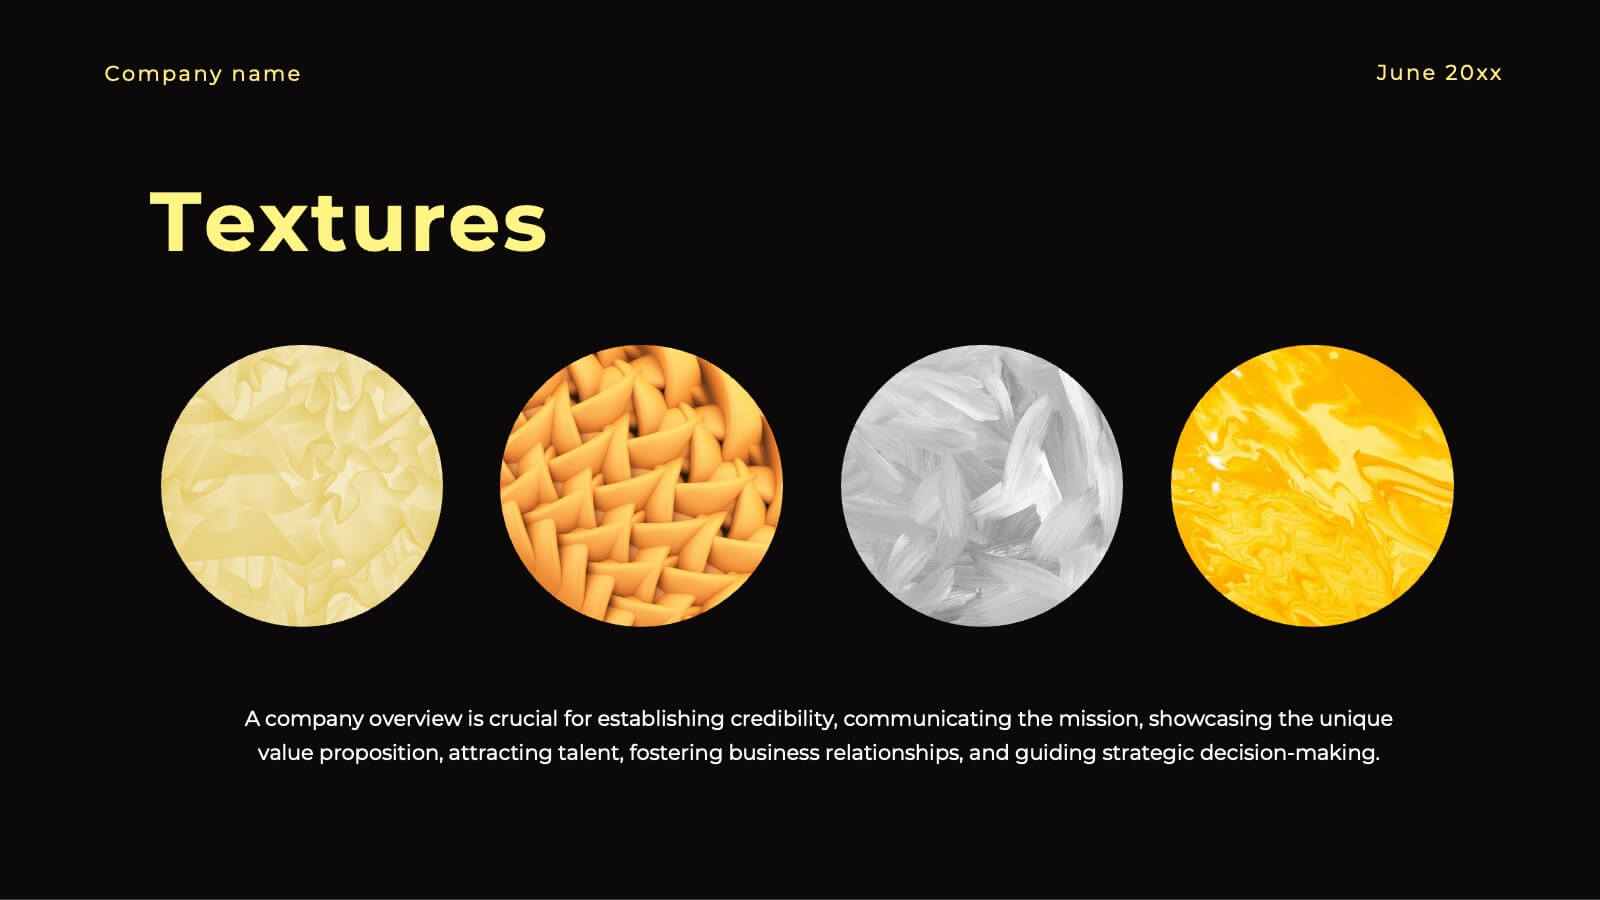
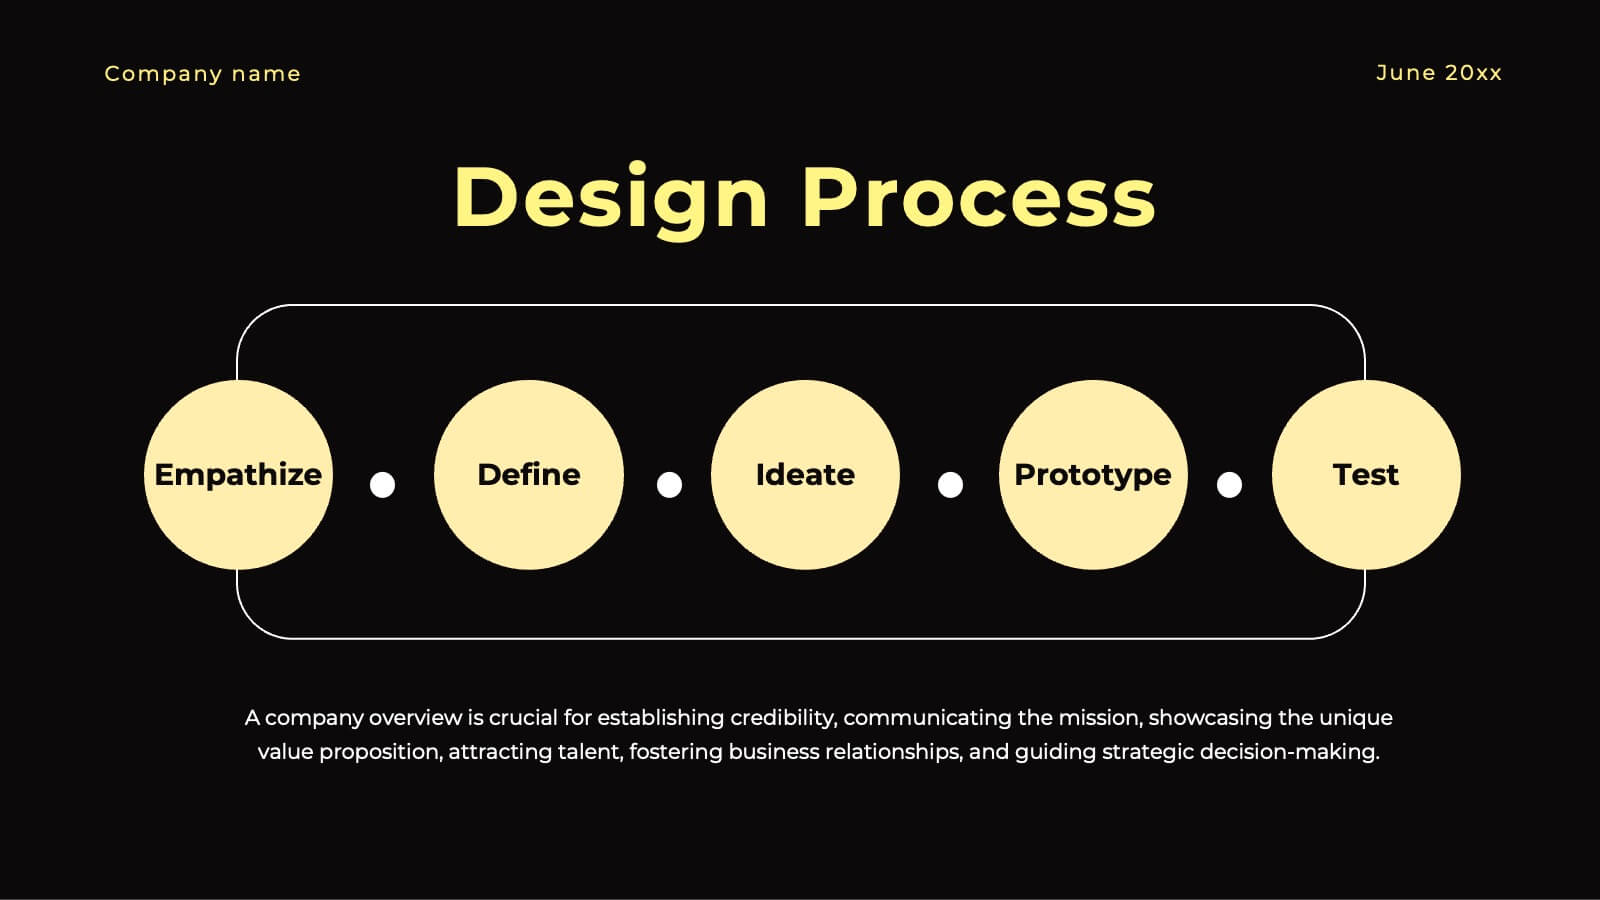
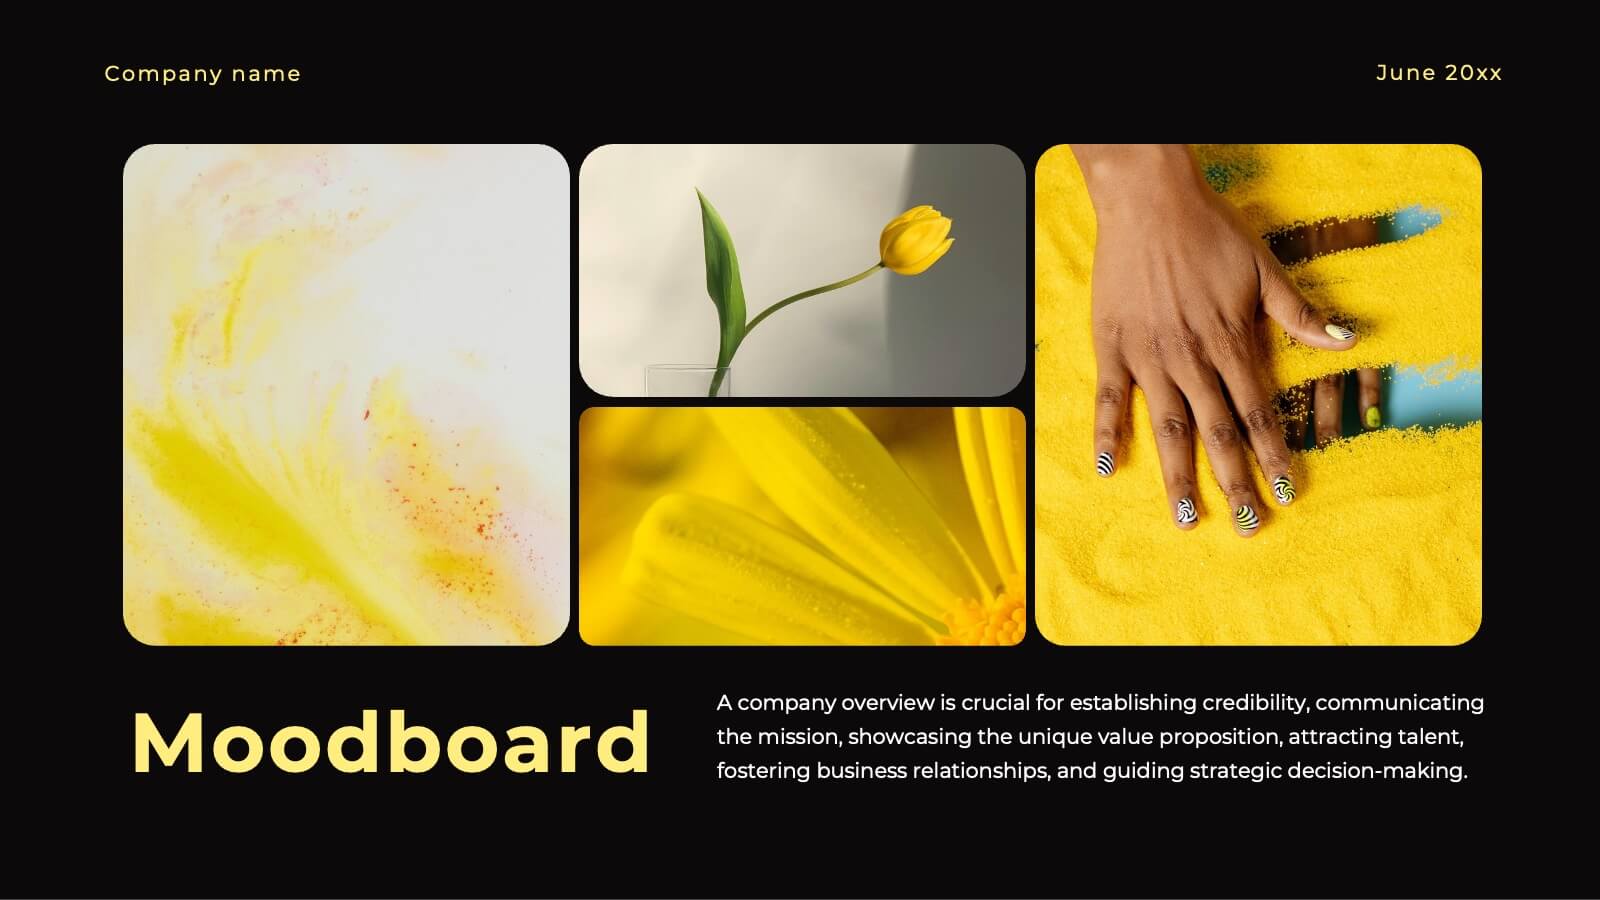
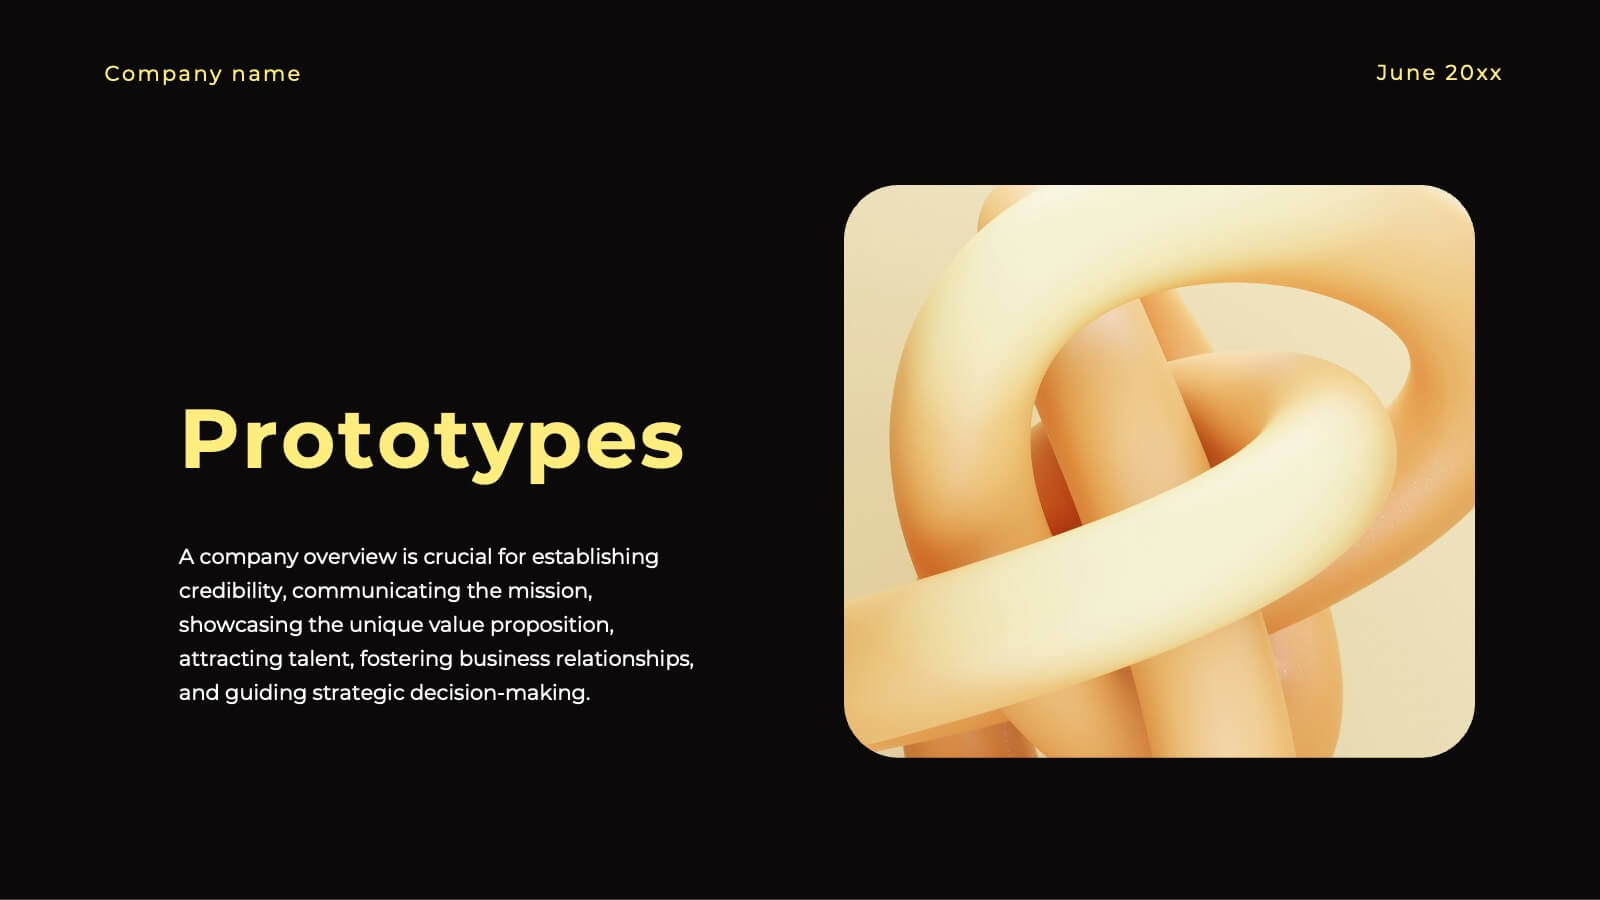
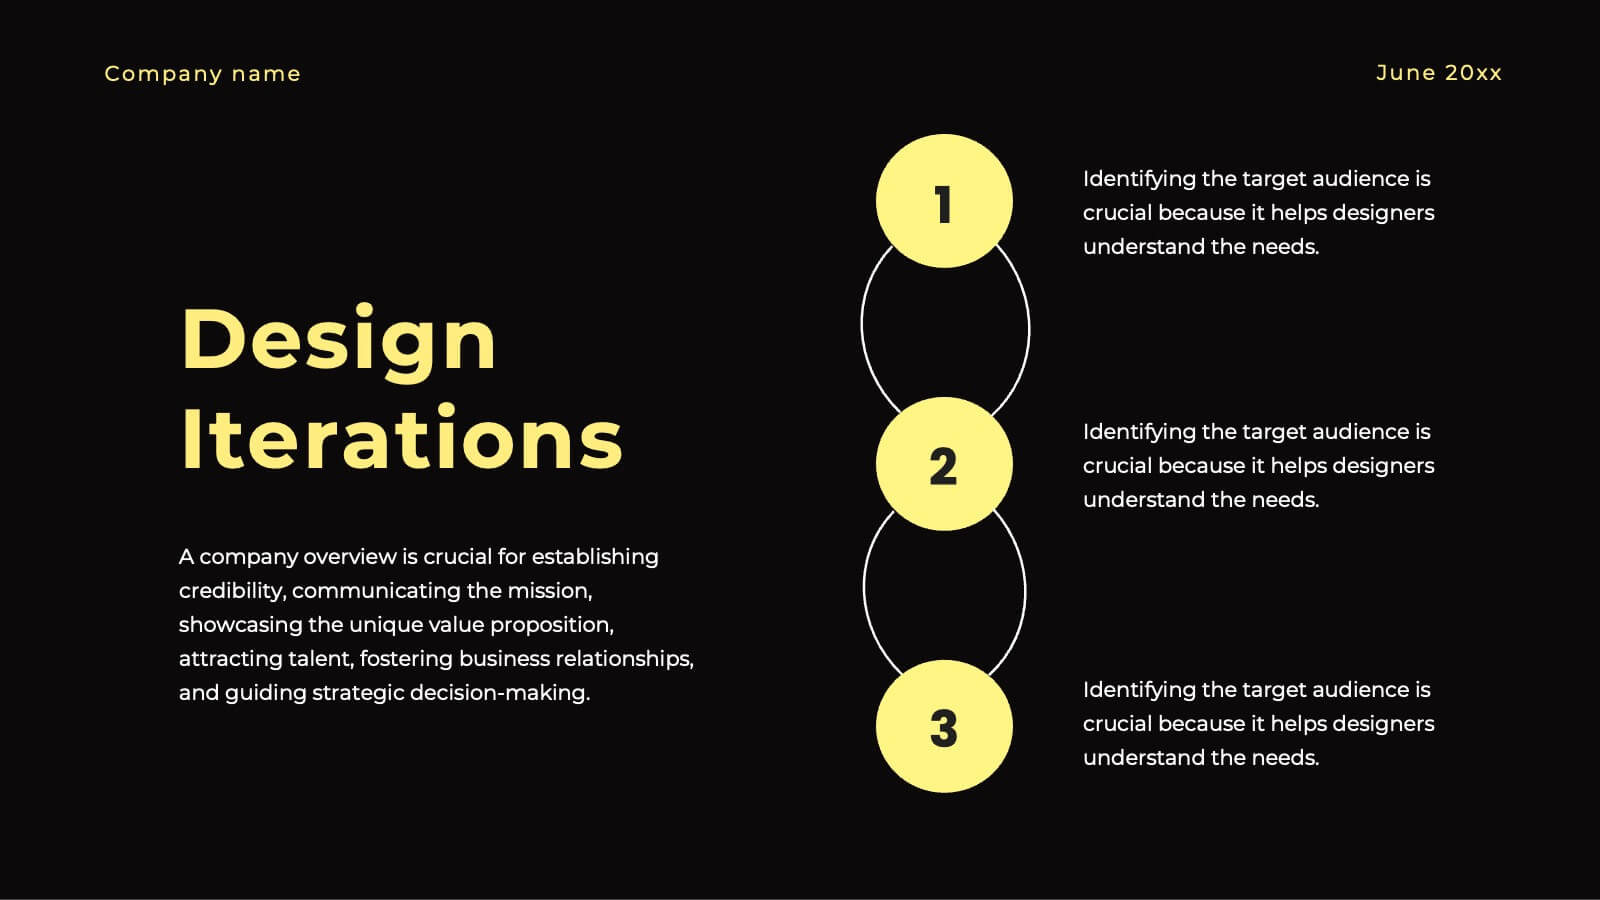
Ignite Creative Design Report Presentation
Unleash your creativity with this stunning design presentation template! Perfect for showcasing concept development, design processes, and final prototypes, it includes slides for typography, color palettes, and project timelines. Captivate your audience with sleek visuals and detailed content. Compatible with PowerPoint, Keynote, and Google Slides for seamless presentations on any platform.


8 diapositivas
Competitive Market Strategy Presentation
Stay Ahead in the Market with this Competitive Market Strategy Presentation template. This slide helps you analyze industry competition, market positioning, and strategic advantages with a clean, engaging circular layout. Ideal for business planning, marketing strategy meetings, and competitive analysis, this template allows you to highlight key differentiators and action steps clearly. Fully customizable and available for PowerPoint, Keynote, and Google Slides.


6 diapositivas
Bubble Diagram for Idea Development Presentation
Visualize your creative process with this Bubble Diagram for Idea Development template. Ideal for brainstorming sessions, project planning, and innovation strategies, this slide uses color-coded lightbulbs and numbered bubbles to illustrate key ideas and their relationships. Perfect for entrepreneurs, teams, and educators, it simplifies complex concepts into a clear, engaging format. Fully editable and compatible with PowerPoint, Keynote, and Google Slides for seamless customization.


2 diapositivas
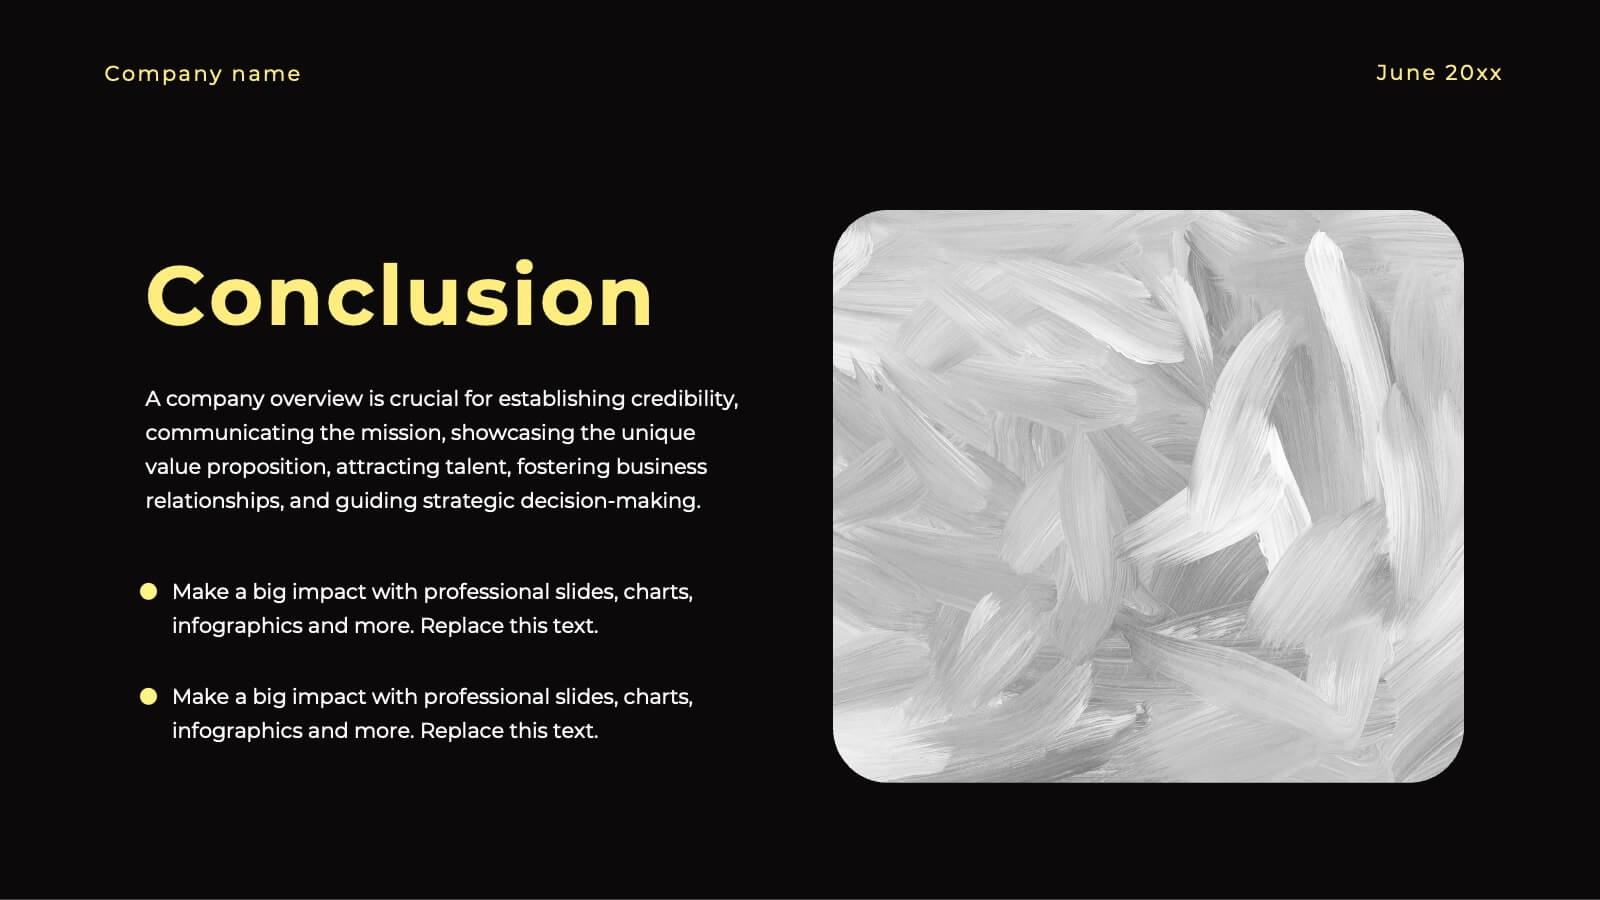
Professional Proposal for Project Approval Presentation
Impress stakeholders and decision-makers with the Professional Proposal for Project Approval Presentation. Designed to guide your audience through key objectives and visual justifications, this clean, image-rich layout is ideal for startups, teams, and consultants. Fully customizable in PowerPoint, Keynote, and Google Slides.


5 diapositivas
Climate Change Activism Infographics
Climate change activism refers to the efforts of individuals, organizations, and communities that are dedicated to raising awareness about the urgent need to address and mitigate the impacts of climate change. These vertical infographics are powerful and visually compelling presentations that aim to raise awareness about the pressing issue of climate change and inspire action towards a sustainable future. This template is ideal for environmental organizations, activists, educators, and anyone seeking to educate the public about climate change and the urgent need for collective action. Fully compatible with powerpoint, Keynote, and Google Slides.


5 diapositivas
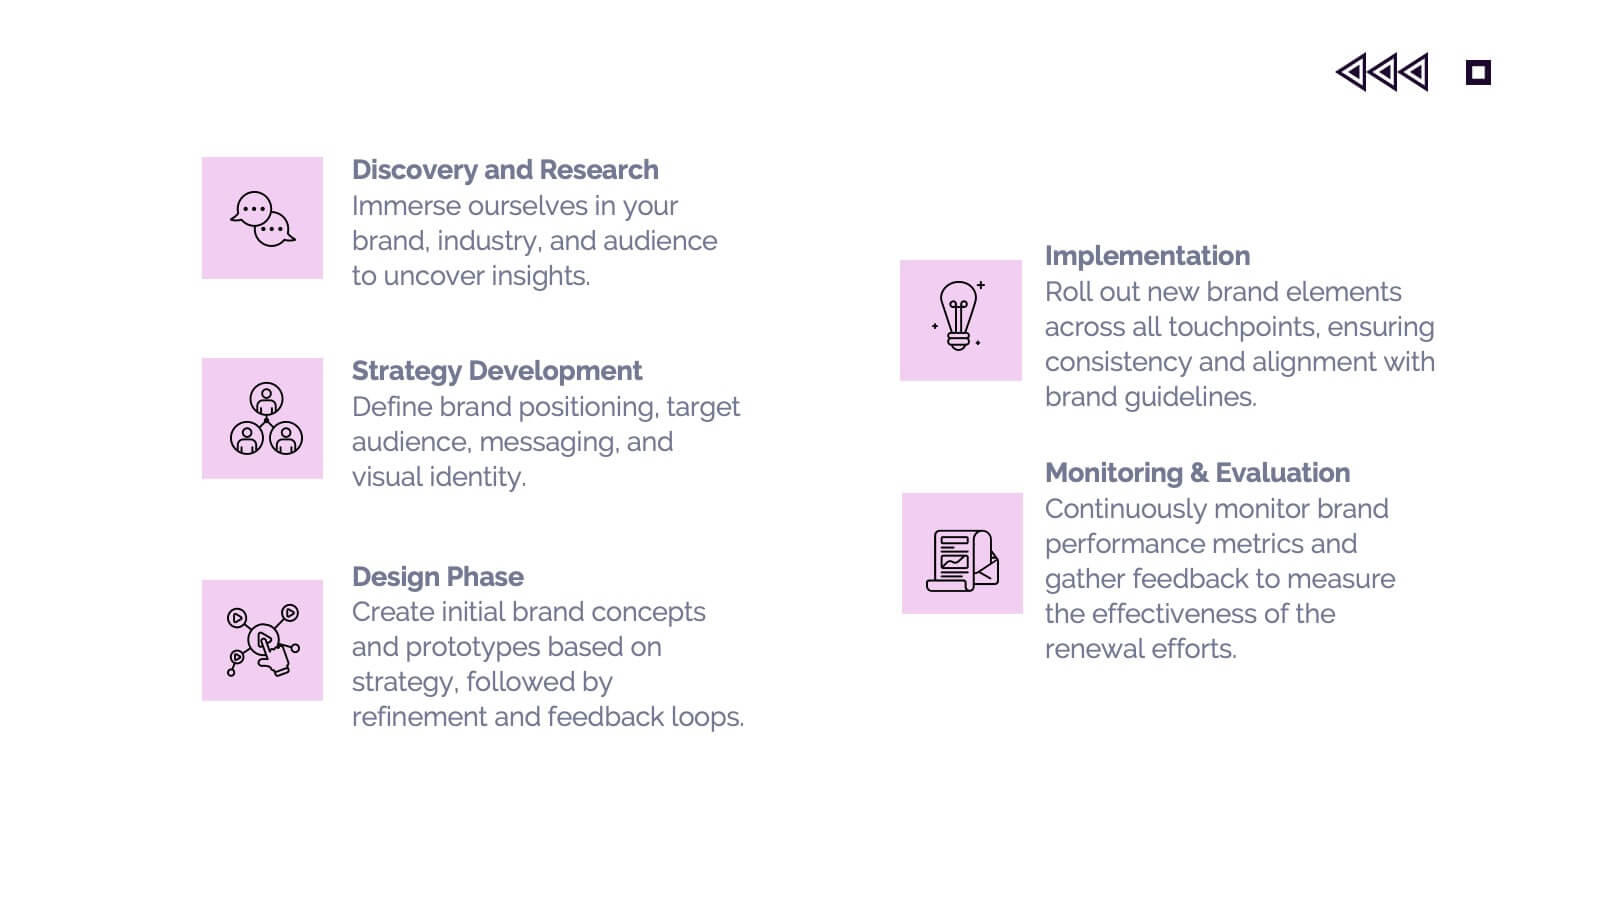
Multiphase Planning with Strategy Wheel Presentation
Visualize your project’s lifecycle with this five-part strategy wheel layout. Each labeled segment highlights a phase in your planning process, ideal for showcasing sequential steps or stages. Fully editable in PowerPoint, Keynote, and Google Slides, this template simplifies complex workflows while maintaining a clean, professional design for strategic presentations.


10 diapositivas
Brand Loyalty and Customer Retention Presentation
Strengthen your brand’s relationship with your audience using the "Brand Loyalty and Customer Retention" presentation template. This design effectively illustrates how strong branding strategies enhance customer loyalty and retention rates. Ideal for marketers and business strategists, this template is fully compatible with PowerPoint, Keynote, and Google Slides, making it perfect for presentations aimed at improving customer engagement and business growth.


23 diapositivas
Wendigo Agency Portfolio Presentation
This sleek agency portfolio template showcases your mission, services, and success stories with modern flair. From case studies and strategy development to campaign execution and client testimonials, it’s designed to highlight your agency’s strengths. Perfect for agency presentations across PowerPoint, Keynote, and Google Slides, this template makes your content shine effortlessly.


21 diapositivas
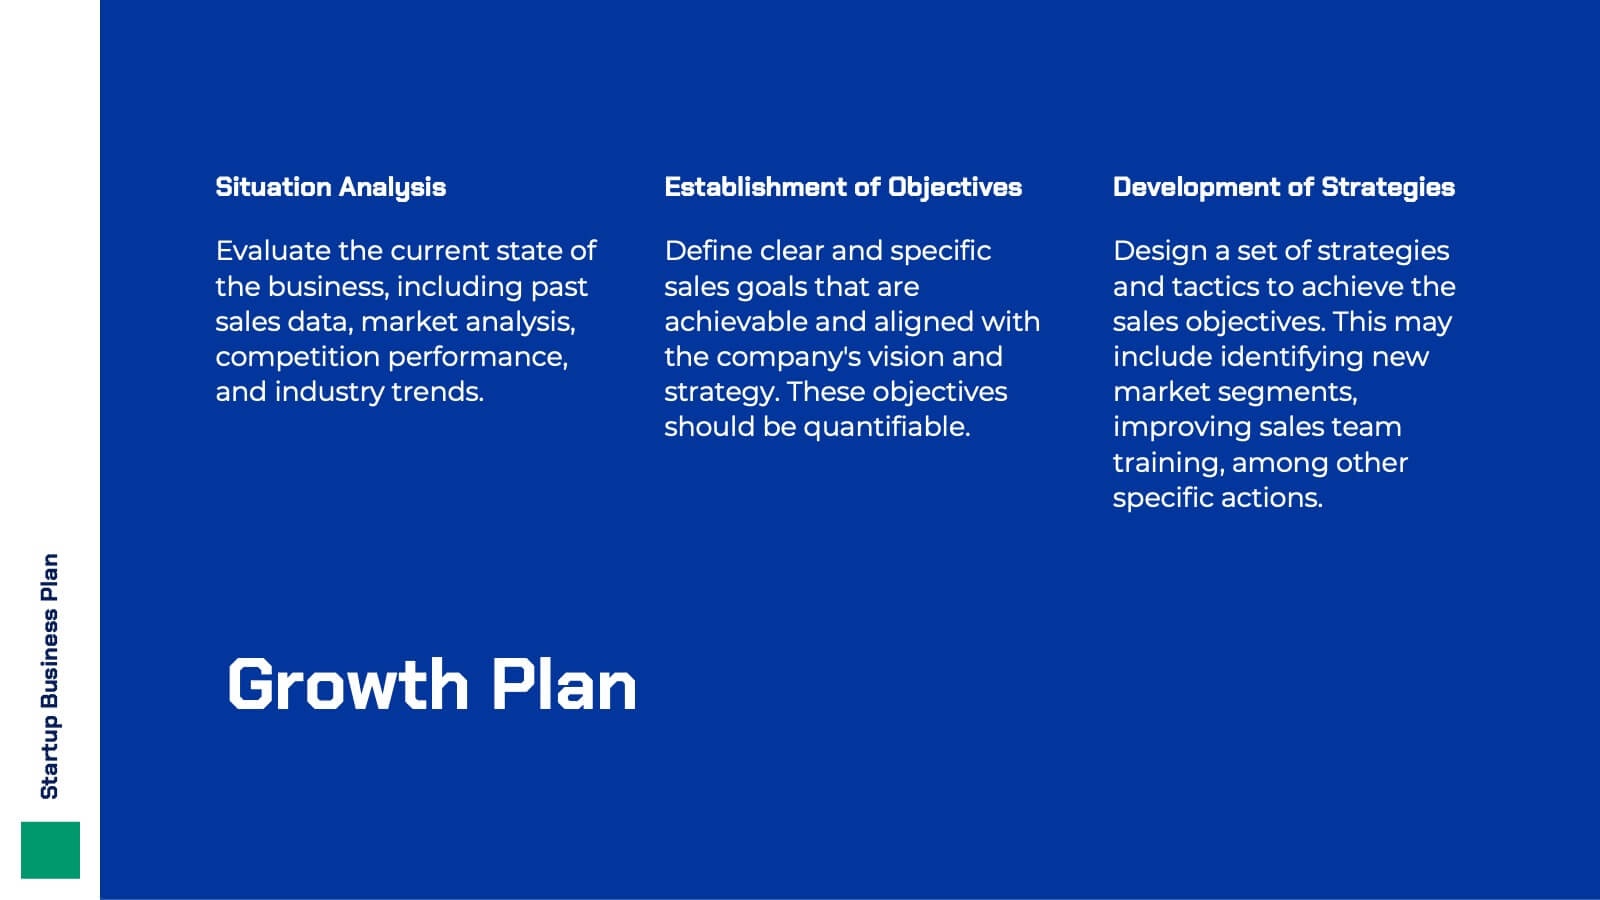
Hyperluma Startup Business Plan Presentation
Launch your vision with this startup business plan template, crafted to communicate your mission, market potential, and growth strategy with clarity and impact. Covering customer needs, unique value propositions, and financial projections, it’s ideal for entrepreneurs and founders. This template is compatible with PowerPoint, Keynote, and Google Slides, ready to fuel your startup’s journey.


5 diapositivas
Strategic Business Case Presentation
Make every proposal stand out with a clear, goal-focused design that simplifies your strategic narrative. Ideal for presenting initiatives, project justifications, or decision-making insights, this layout balances visual clarity with professionalism. Fully compatible with PowerPoint, Keynote, and Google Slides for effortless editing and polished presentations.


8 diapositivas
Business Data Analytics Dashboard
Monitor performance with clarity using this Business Data Analytics Dashboard. Featuring data bars, numeric highlights, and color-coded insights, this slide is perfect for quarterly updates, data reviews, or executive summaries. Clean and professional, it's fully editable in PowerPoint, Keynote, and Google Slides.


5 diapositivas
Strategic HR Planning with Skills Gap Analysis
Lead with insight. The Strategic HR Planning with Skills Gap Analysis slide is your go-to tool for aligning talent strategy with organizational needs. Ideal for showcasing workforce priorities, skill readiness, and actionable development plans—fully editable in PowerPoint, Keynote, and Google Slides.


6 diapositivas
Safety Department Infographics
Promote safety awareness with our Safety Department infographic template. This template is fully compatible with popular presentation software like PowerPoint, Keynote, and Google Slides, allowing you to easily customize it to illustrate and communicate the role and functions of a safety department within an organization. The Safety Department infographic template offers a visually engaging platform to highlight the responsibilities, goals, and initiatives of a safety department. Whether you're a safety officer, HR professional, business leader, or interested in workplace safety, this template provides a user-friendly canvas to create informative presentations and educational materials. Enhance safety practices and awareness with this SEO-optimized Safety Department infographic template, thoughtfully designed for clarity and ease of use. Customize it to showcase safety protocols, training programs, incident reporting, and the importance of a safety-focused culture, ensuring that your audience understands the critical role of the safety department. Start crafting your personalized infographic today to promote a safer work environment.


6 diapositivas
Effective Time Management Strategies
Master your productivity with this time-focused infographic template. Featuring a central clock illustration and six surrounding sections, it's perfect for showcasing time-blocking techniques, task prioritization, or team scheduling strategies. Customize each segment with your own insights in PowerPoint, Keynote, or Google Slides. Fully editable for any business use.


23 diapositivas
Volt Business Plan Presentation
The Business Plan Presentation Template offers 23 refined slides to convey goals, strategies, achievements, and action plans. Perfect for team updates, resource allocation, and collaboration opportunities. Designed for PowerPoint, Keynote, and Google Slides, its warm, professional layout ensures clarity while fostering effective communication for corporate or project presentations. Fully customizable.


20 diapositivas
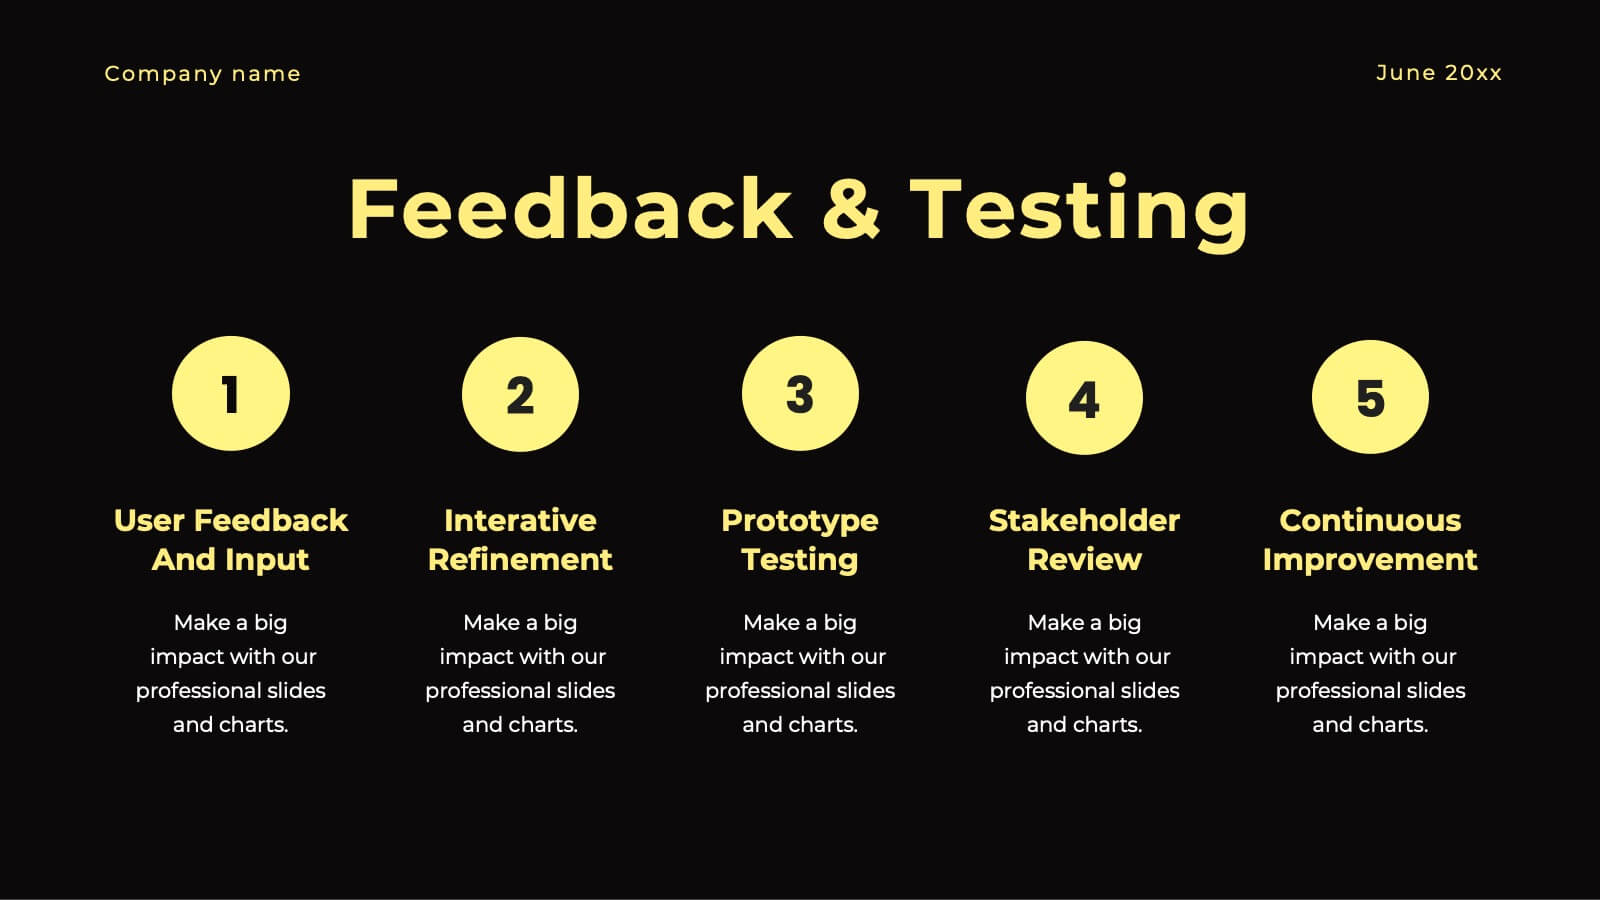
Vivid Product Development Plan Presentation
Develop your product with confidence using this detailed product development plan template! Perfect for outlining features, market analysis, and competitive advantages. Ideal for product managers and teams. Compatible with PowerPoint, Keynote, and Google Slides, this template ensures your plan is clear, professional, and comprehensive. Achieve product success today!