


Características


¿Tienes alguna pregunta?
Recomendar


5 diapositivas
A to Z Slide Concept Presentation
Bring your ideas to life with a bold, block-style visual that makes complex concepts feel simple and structured. This slide is perfect for breaking down processes, frameworks, or step-by-step explanations in a clear, memorable way. Fully editable and compatible with PowerPoint, Keynote, and Google Slides.


6 diapositivas
Business Milestone Timeline Presentation
Showcase key achievements and future goals with the Business Milestone Timeline Presentation. This visually engaging template allows you to highlight crucial company events, project phases, or strategic plans in a clear, structured format. Ideal for corporate reporting, business growth tracking, and investor presentations. Fully customizable and compatible with PowerPoint, Keynote, and Google Slides.


7 diapositivas
Psychology Infographic Presentation Template
Featuring our psychology infographic template made to provide you with a beautiful presentation that includes all the necessary elements for learning about psychology. Present your research and analysis in a clear, informative and engaging way with this template. Use the theme to highlight the most important concepts in psychology and explain each one with interesting facts, statistics and charts. Use this template to show information about the main topics or areas of psychology. This template is compatible with powerpoint and fully customizable to meet all your requirements!


6 diapositivas
Sales Associate Infographic
A sales associate, also known as a sales representative or salesperson, is an individual who is responsible for selling products or services to customers. This infographic template is designed to highlight the key roles, skills, and responsibilities of a sales associate. It provides an informative and engaging overview of the sales associate's role within a company or organization, showcasing their contribution to sales and customer satisfaction. This template is suitable for various industries and can be customized to fit specific company or organizational contexts. Compatible with Powerpoint, Keynote, and Google Slides, this is easily customizable.


5 diapositivas
Business Issue Root Cause Identification
Pinpoint the real reasons behind business challenges with this clear and visual layout. This root cause identification template breaks down effects and traces them back to their sources, making it easier to align your team and propose actionable solutions. Fully customizable in PowerPoint, Keynote, and Google Slides.


4 diapositivas
Human Resources KPI Dashboard Presentation
Bring your metrics to life with this clean and modern dashboard designed to highlight essential HR performance insights. It helps you present key indicators clearly, making data easy to compare and understand at a glance. Perfect for HR reviews or internal updates, and fully compatible with PowerPoint, Keynote, and Google Slides.


7 diapositivas
Break Even Sales Infographic
Break-even analysis is a financial tool used by businesses to determine the point at which total revenue equals total costs, resulting in neither profit nor loss. This infographic template breaks down the intricacies of break-even analysis, providing a powerful visual aid to understand when your venture turns profitable. Compatible with Powerpoint, Keynote, and Google Slides. Designed to illuminate the journey from cost recovery to profitability with clarity and boldness. This template showcases the break-even point graphically, representing the stage where total revenue equals total costs, and the venture moves from loss to gain.


6 diapositivas
5 Forces Market Strategy Framework Presentation
Visualize your competitive strategy with this 5 Forces Market Framework. Highlight key elements like Buyer, Supplier, New Entry, Substitutes, and Competitive Rivalry using a clean, circular layout. Ideal for strategic analysis, business planning, or investor pitches. Fully editable in PowerPoint, Keynote, and Google Slides for seamless customization.


4 diapositivas
Risk and Reality Iceberg Diagram Presentation
Reveal underlying threats with this Risk and Reality Iceberg Diagram presentation. Ideal for risk analysis, strategic planning, or operations mapping, this slide visualizes visible vs. hidden challenges in a business or project. Fully editable in Canva, PowerPoint, and Google Slides—perfect for impactful and professional presentations.


8 diapositivas
Brainstorming Visualization
Spark creativity with the Brainstorming Visualization Presentation—a dynamic diagram built to energize your ideation process. Featuring a lightning bolt cloud as the central symbol, this layout radiates out to four key thought nodes, each with space to highlight insights, solutions, or topics. Ideal for team ideation, strategic planning, or mind mapping. Fully editable in PowerPoint, Keynote, and Google Slides.


7 diapositivas
Top Question for Beginners Infographic
Captivate your audience and enhance interaction with our collection of slide templates, perfect for engaging beginners and prompting them to ask top questions. These templates feature inviting designs and dynamic layouts, making them ideal for educational sessions, workshops, or any presentation aimed at beginners. Each template employs bright colors and creative graphics to draw attention and stimulate curiosity. The designs are crafted to not only pose questions but also to invite thoughtful responses and active participation. Whether you are hosting a seminar, leading a training session, or facilitating a learning module, these slides provide a friendly and approachable way to encourage questions and discussions. Customize these templates to suit your specific session, adapting the text, colors, and images to fit the theme and audience. They are a fantastic tool for educators and trainers looking to create a more engaging and interactive learning environment.


5 diapositivas
Contracts and Law Capacity Infographics
In the context of contracts and law, "capacity" refers to a person's legal ability to enter into a contract and be bound by its terms. These colorful infographics are designed to simplify the complex concepts of contracts and law capacity for the audience. This infographic template aims to provide essential information about the legal aspects of contracts and the concept of capacity in a visually appealing manner. This section provides a clear definition of contracts and highlights the essential elements. The template incorporates engaging infographics, icons, and illustrations to visualize key concepts and make the information more memorable.


23 diapositivas
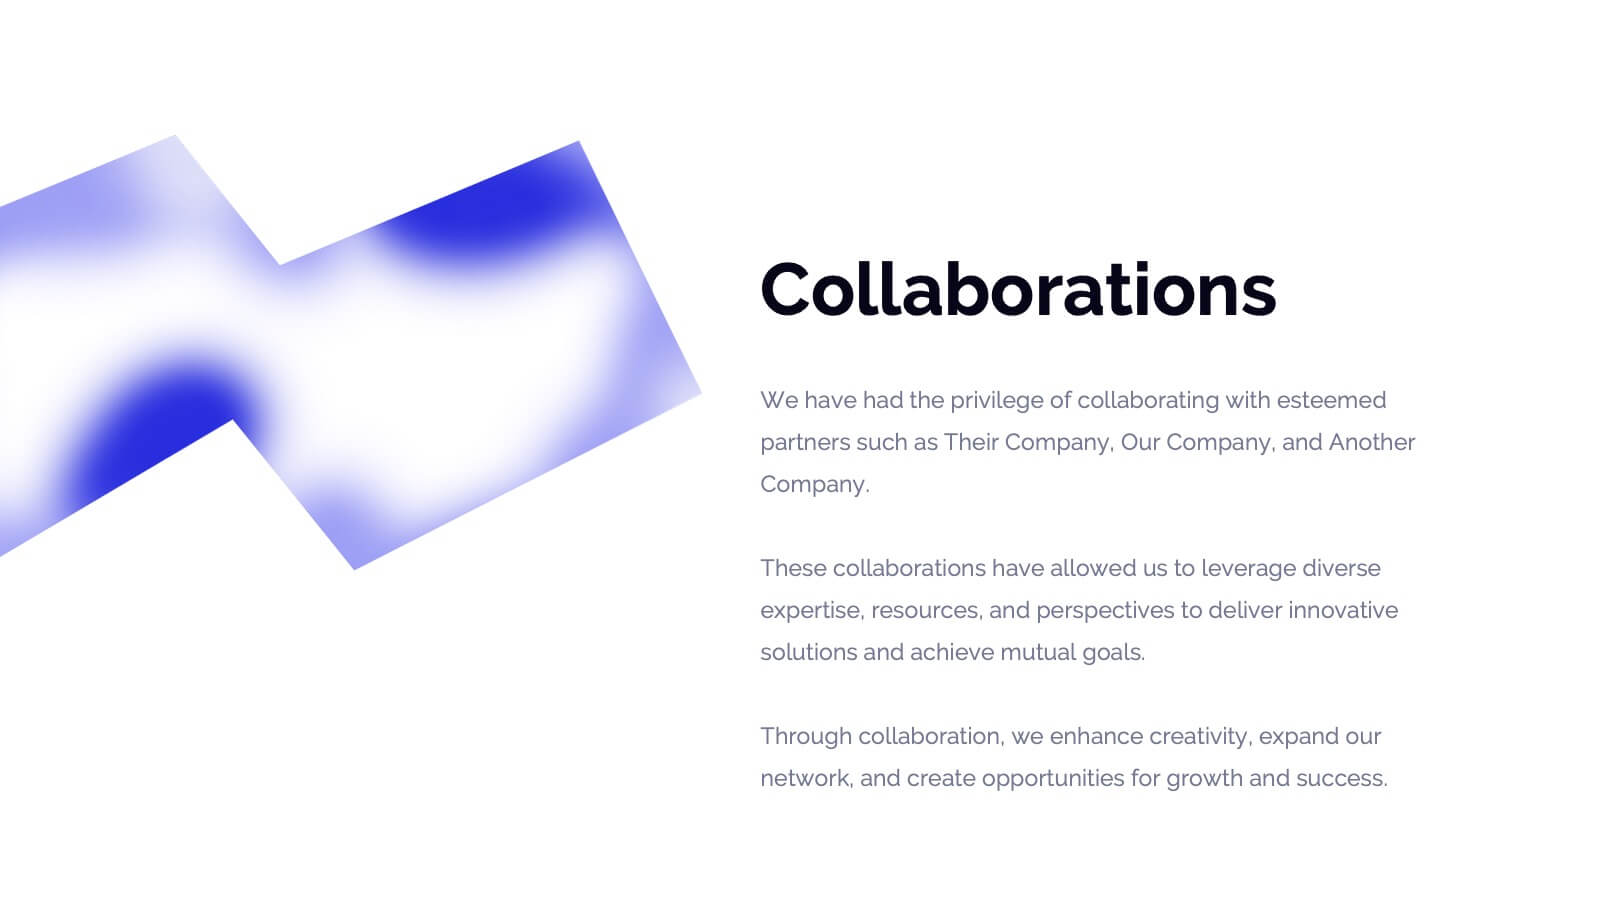
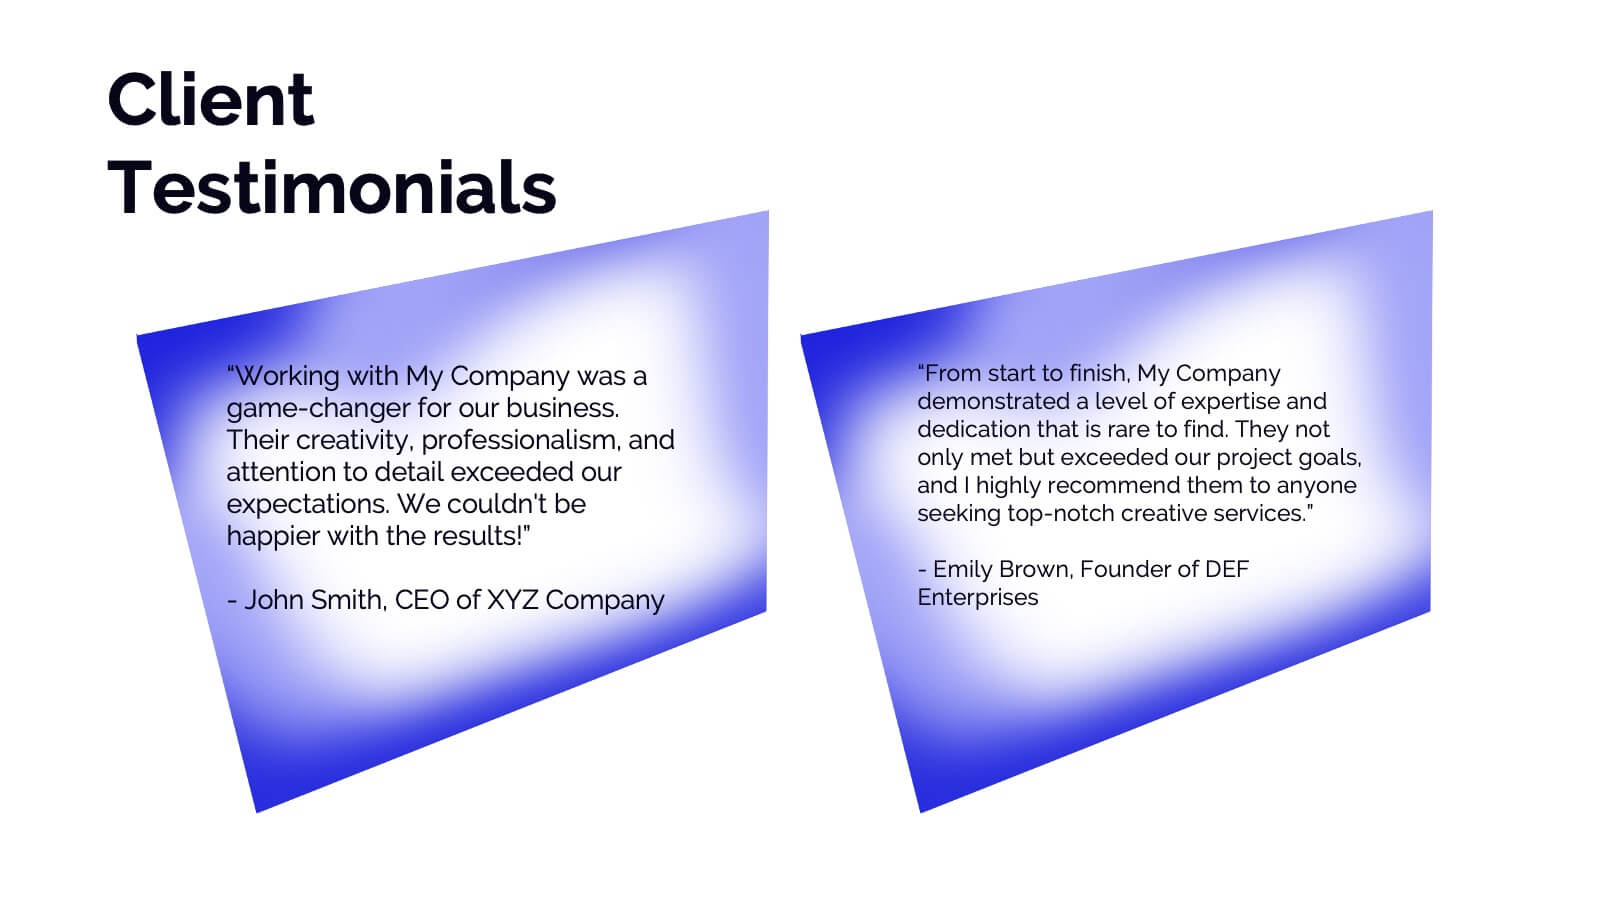
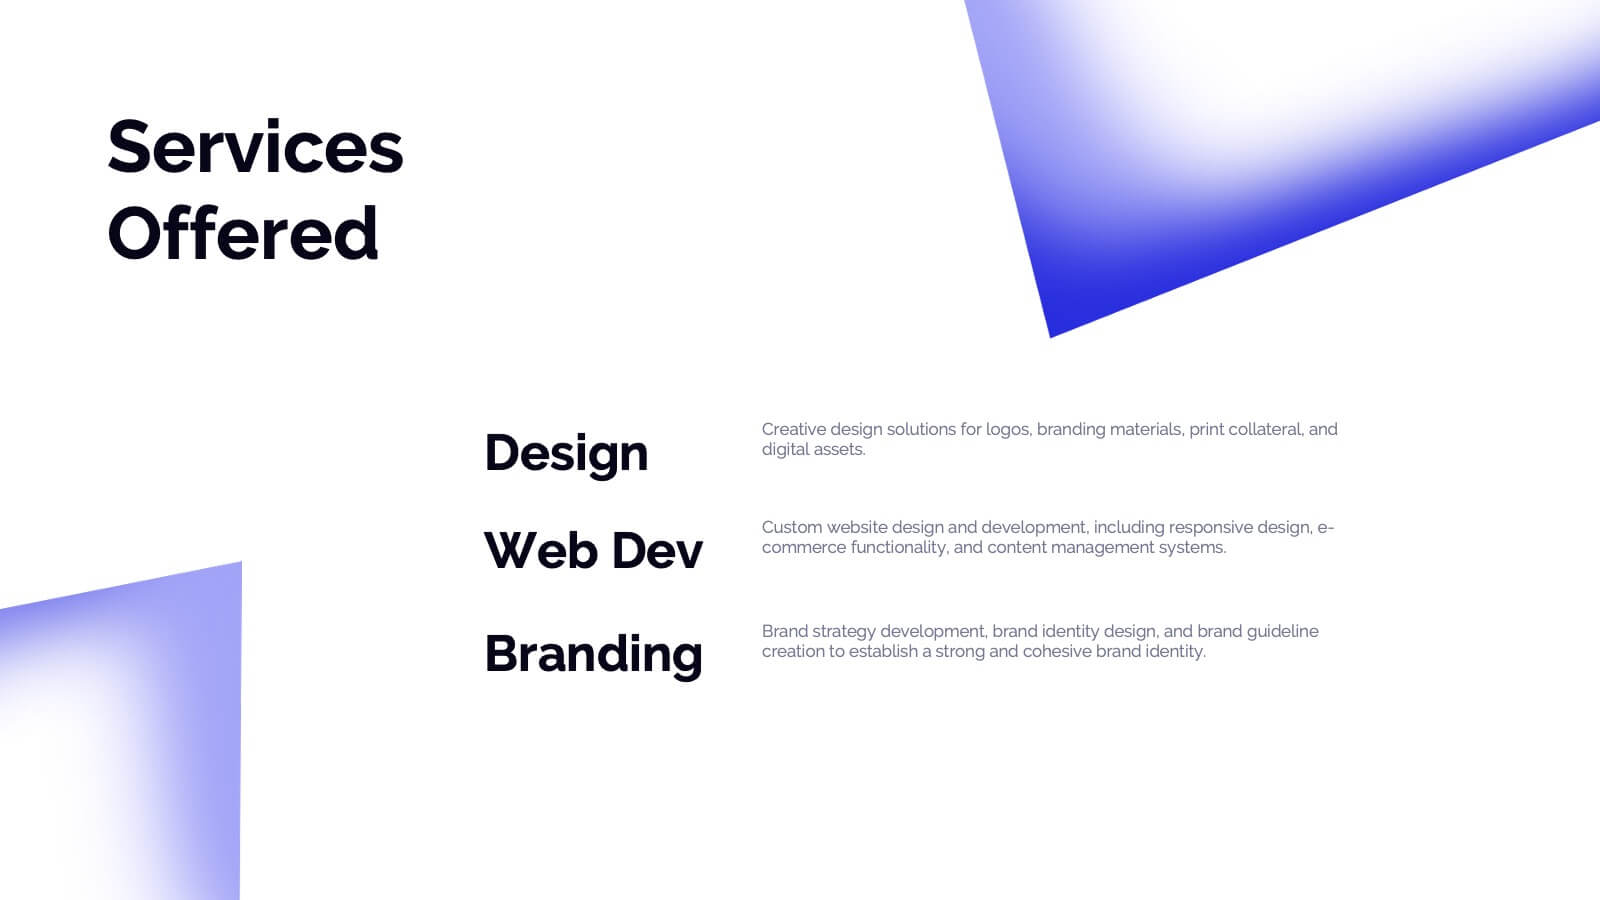
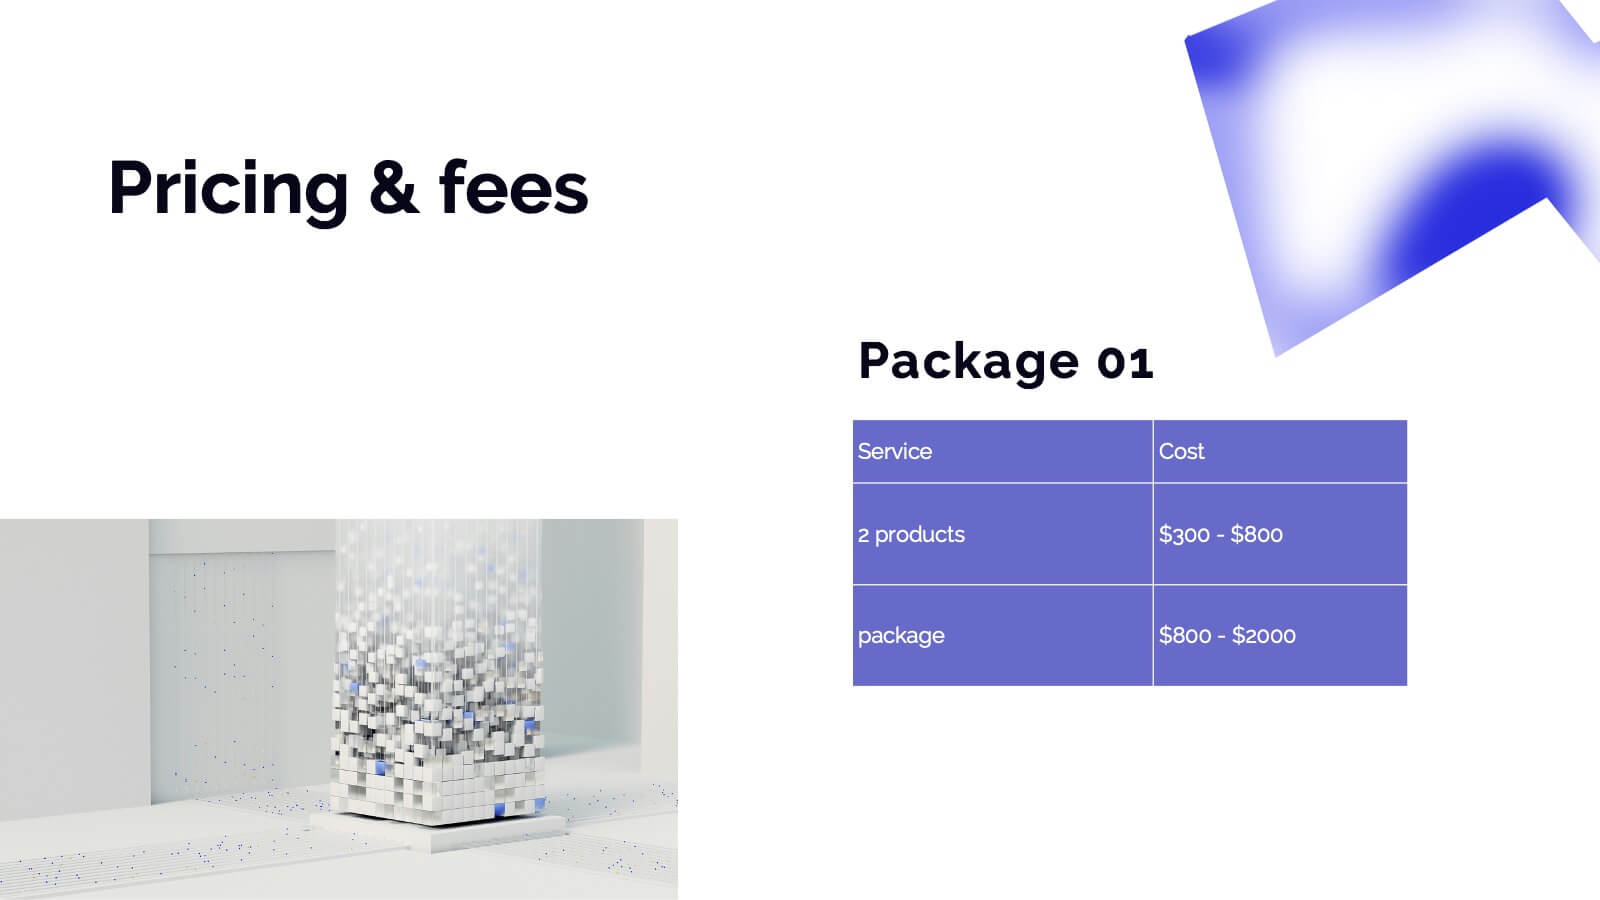
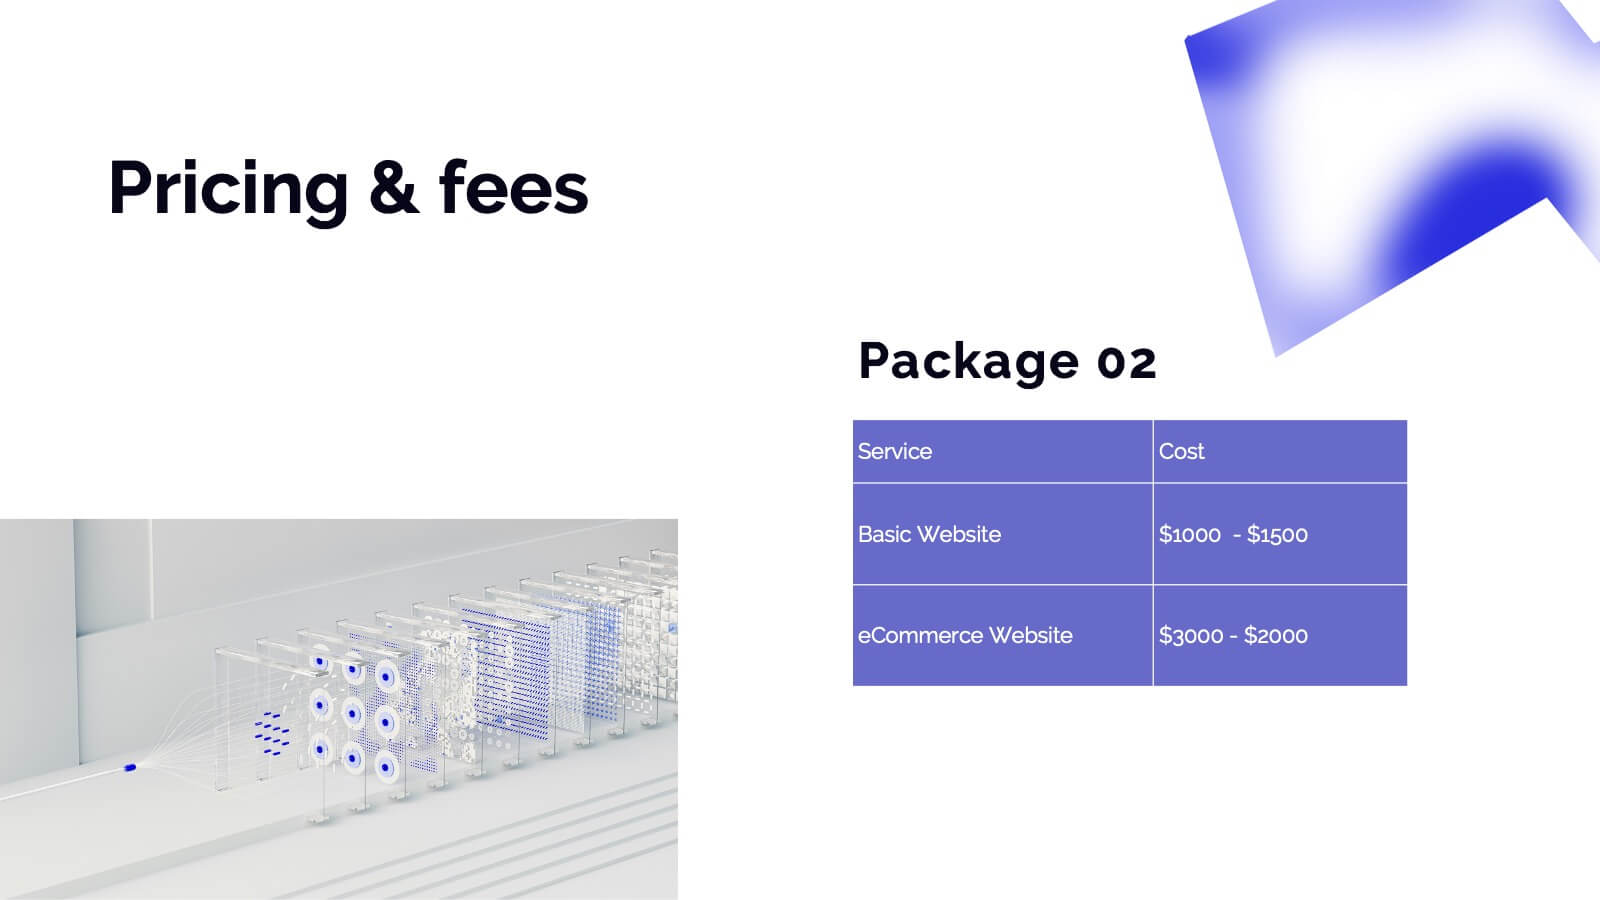
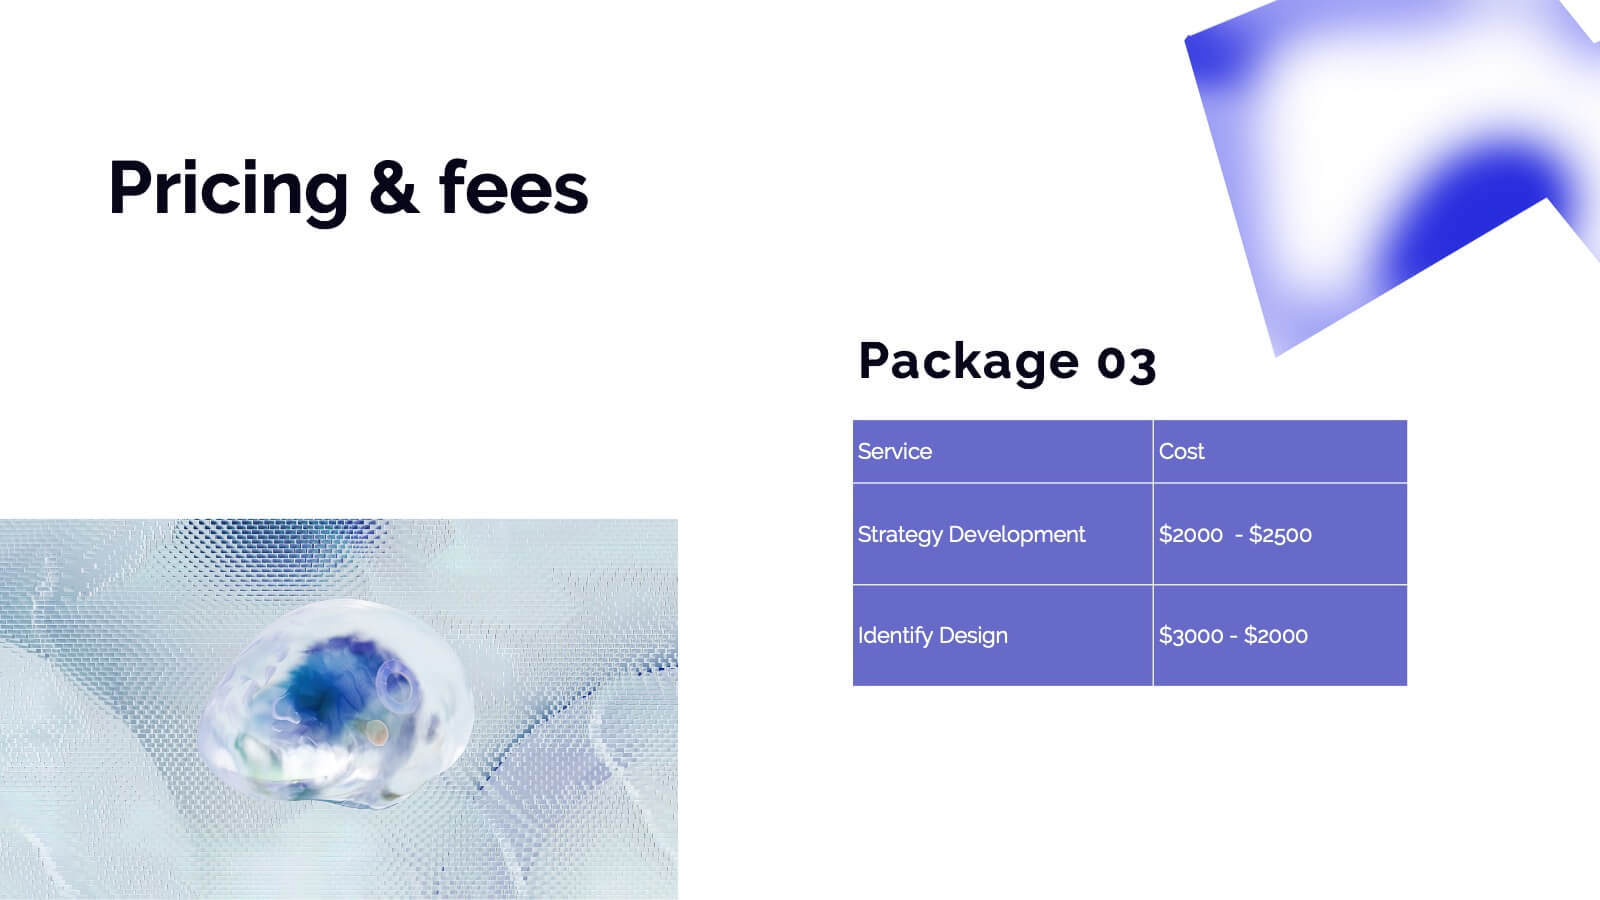
Dryad Photography Portfolio Template Presentation
Showcase your photography skills with this elegant and professional portfolio presentation template! Perfect for highlighting your projects, style, and creative process, this template covers everything from client testimonials to pricing and services offered. It’s ideal for photographers wanting to present their work with style and clarity. Compatible with PowerPoint, Keynote, and Google Slides for effortless sharing and presentations.


6 diapositivas
Onboarding 30-60-90 Day Roadmap Presentation
Get your team excited from day one with this colorful, easy-to-follow visual layout! This presentation template helps clearly map out onboarding goals and key activities across 30, 60, and 90 days. Perfect for HR professionals and team leads, it's fully editable and works with PowerPoint, Keynote, and Google Slides.


4 diapositivas
Corporate Finance and Expense Review Presentation
Visualize your company's financial structure with this Corporate Finance and Expense Review Presentation. Featuring a wallet-themed layout with three editable icons and text blocks, this slide helps you clearly present income sources, expenses, and budget allocations. Fully customizable in Canva, PowerPoint, and Google Slides.


6 diapositivas
5-Step SEO Marketing Funnel Presentation
Ignite your marketing story with a bold, flowing visual that makes every step feel purposeful and easy to follow. This presentation breaks down each stage of the SEO funnel, helping you explain strategy, performance, and conversion paths with clarity. Fully compatible with PowerPoint, Keynote, and Google Slides.


4 diapositivas
Business Growth in Numbers Presentation
Showcase business performance with the Business Growth in Numbers Presentation template. Designed for sales reports, financial reviews, and market analysis, this template includes visualized statistics, percentage comparisons, and trend graphs to highlight key growth metrics. Fully customizable and compatible with PowerPoint, Keynote, and Google Slides, it ensures clear and compelling data storytelling.