


Características


¿Tienes alguna pregunta?
Recomendar


7 diapositivas
Demographic Data Infographic
Demographic data refers to information that characterizes the composition of a population or a specific group based on various socio-economic factors. Our demographic data infographic is not just a graphic, this is a powerful visualization that explores society and empowers decision-makers to understand, connect, and prosper. Prepare for an exhilarating journey through demographics, where data transforms into meaningful insights. Compatible with Powerpoint, Keynote, and Google Slides. This can be used for a variety of purposes, including market research, targeted marketing, policy development, resource allocation, urban planning, and more.


7 diapositivas
Bowtie Risk Management Diagram Presentation
Visualize cause and consequence with a clean, symmetrical flow that simplifies complex risk scenarios. This presentation helps you illustrate threats, controls, and outcomes in one cohesive framework, making decision-making clear and impactful. Fully customizable and compatible with PowerPoint, Keynote, and Google Slides for professional risk analysis presentations.


5 diapositivas
Food Industry Trends Presentation
Stay ahead of the curve with this visual presentation designed to spotlight key developments in the food industry. Featuring a creative pie chart integrated with food icons and utensils, this layout is perfect for data storytelling, market insights, or trend analysis. Fully editable in PowerPoint, Keynote, and Google Slides.


4 diapositivas
Types of Insurance Policies Comparison Presentation
Highlight key differences between insurance policies using this shield-themed comparison slide. With space for six categories and clear icon-label pairs, it’s perfect for showcasing coverage types or plan tiers. Fully editable in PowerPoint, Keynote, and Google Slides—ideal for agents, brokers, or internal training on policy features.


7 diapositivas
Food Infographic Presentation Template
A Food Infographic is a visual representation of information and data related to food. It can be used to educate people on various aspects of food such as its nutritional value, cooking methods, and recipes. This template can be presented in a variety of ways, including charts, graphs, illustrations, and images you can customize with your information. The goal of this Food Infographic is to make complex information about food more accessible and easy to understand for the general public. This template works with Powerpoint, Keynote, and Google Slides, so you can use it on any device.


6 diapositivas
Business Ethics and Governance Presentation
Navigate the complexities of ethical decision-making with our Business Ethics and Governance Presentation template. This visually engaging tool highlights key aspects of corporate ethics and governance, ideal for workshops and training sessions. Compatible with PowerPoint, Keynote, and Google Slides, it's designed to facilitate clear and effective discussions.


4 diapositivas
Project Proposal Executive Summary Presentation
Optimize your project presentations with the 'Project Proposal Executive Summary' template. Crafted to clearly showcase your project’s most crucial elements, this template uses visuals and concise text to highlight objectives and deliverables effectively. Ideal for professionals preparing proposals in PowerPoint, Keynote, or Google Slides.


6 diapositivas
Corporate Foundation and Pillars Presentation
Highlight your company's core principles with this visually impactful pillar-style slide. Designed to illustrate business frameworks, strategies, or guiding values, this layout helps communicate stability and growth. Fully customizable in PowerPoint, Keynote, and Google Slides for seamless brand alignment.


4 diapositivas
Agricultural Business Strategy Presentation
Cultivate success in the field of agriculture with our dynamic Agricultural Business Strategy Presentation template. This visually appealing and easy-to-use template is perfect for showcasing innovative strategies that drive agricultural growth and efficiency. Each slide is thoughtfully designed to help you present crucial business insights and foster sustainable development in the farming sector. Ideal for agribusiness professionals seeking to make a meaningful impact, this template is fully compatible with PowerPoint, Keynote, and Google Slides, ensuring a smooth presentation experience across various platforms.


26 diapositivas
Aedele Presentation Template
We all know how important food is, it's the center of life. We plan our days around food, we travel to eat food and our emotions are often tied up in food. This template was designed for people who love food and know how important it is to stand out from the crowd when it comes to the culinary world. Whether you're an investor, a food critique, a restaurant owner or simply a foodie we have all the classy modern slides you need to really make an impact on your audience and make sure your message doesn't get lost amongst all the other exciting talks and presentations at your next pitch meeting.


2 diapositivas
Corporate Identity and Services Overview Presentation
Clearly showcase your company’s offerings with the Corporate Identity and Services Overview Presentation. This modern, minimalist layout is ideal for highlighting key services, team roles, or business pillars with clarity and visual appeal. Fully editable in Canva, PowerPoint, and Google Slides for quick customization and professional results.


5 diapositivas
Dynamic Pricing Strategies
Make pricing strategy look smart and data-driven with this bold, modern infographic template. Designed to explain how pricing evolves with demand, value, and profit margins, this slide visually guides viewers through key steps in your dynamic pricing model. Fully editable and compatible with PowerPoint, Keynote, and Google Slides for seamless use.


23 diapositivas
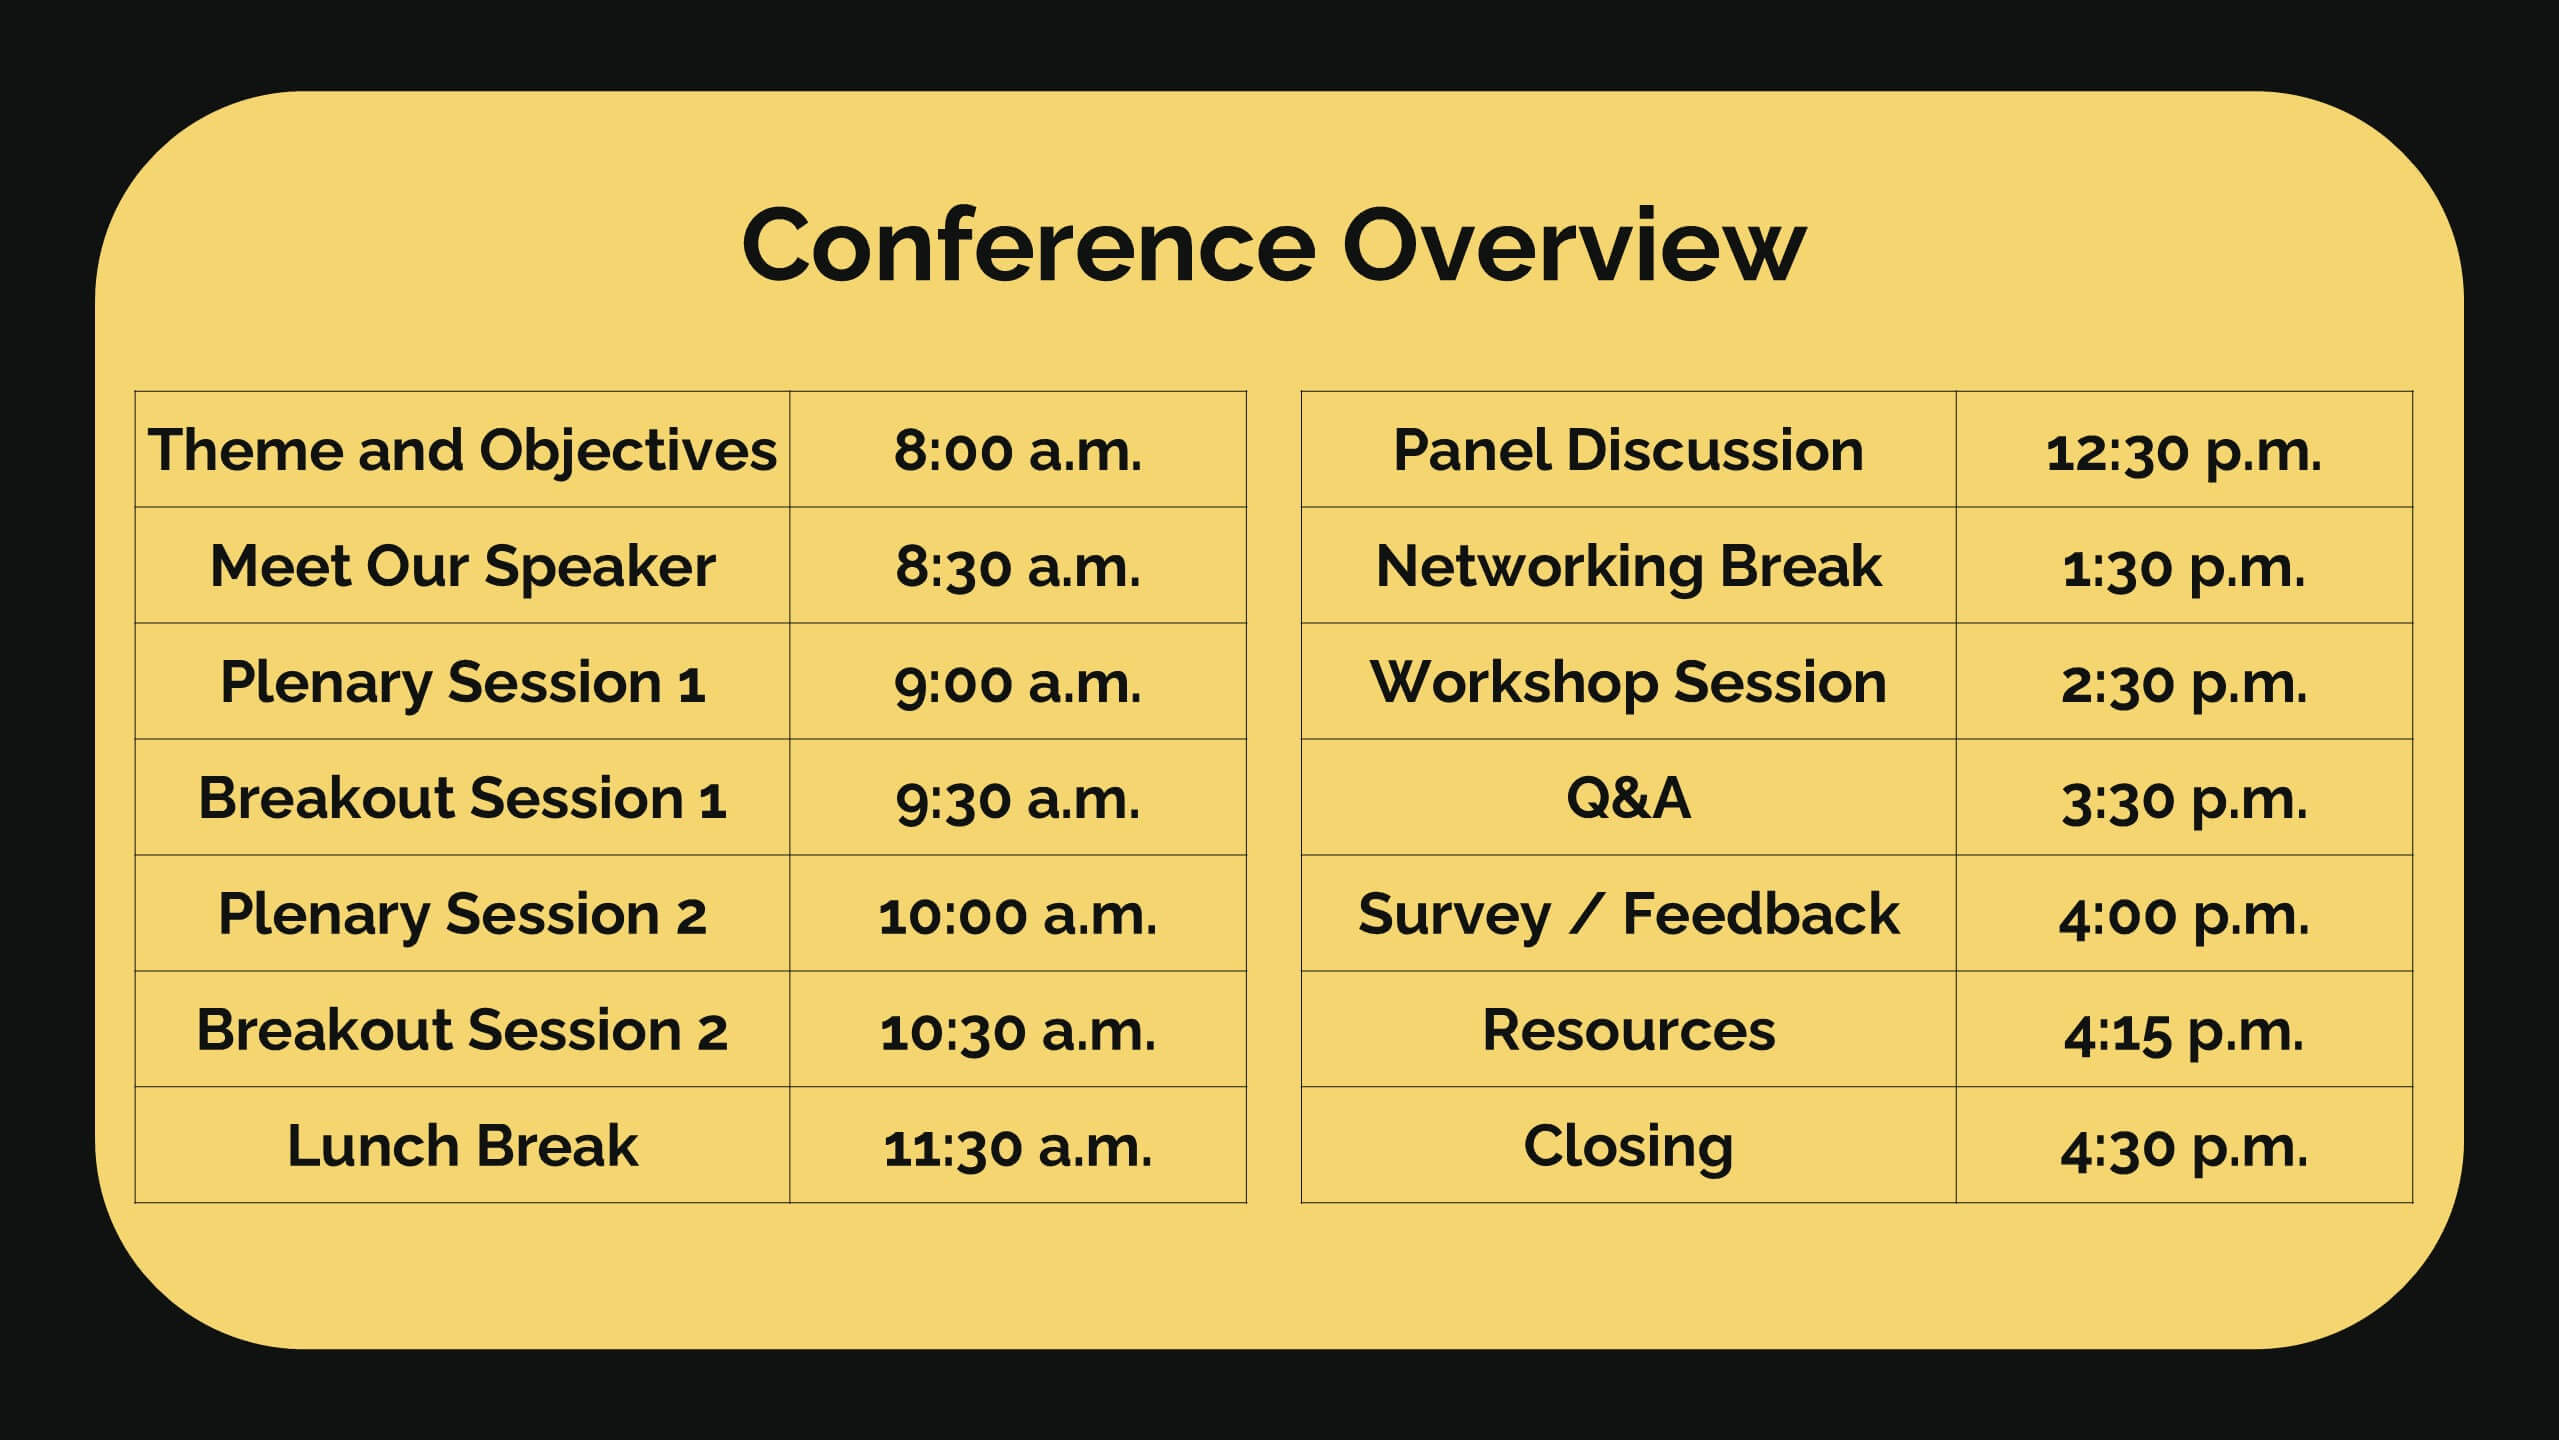
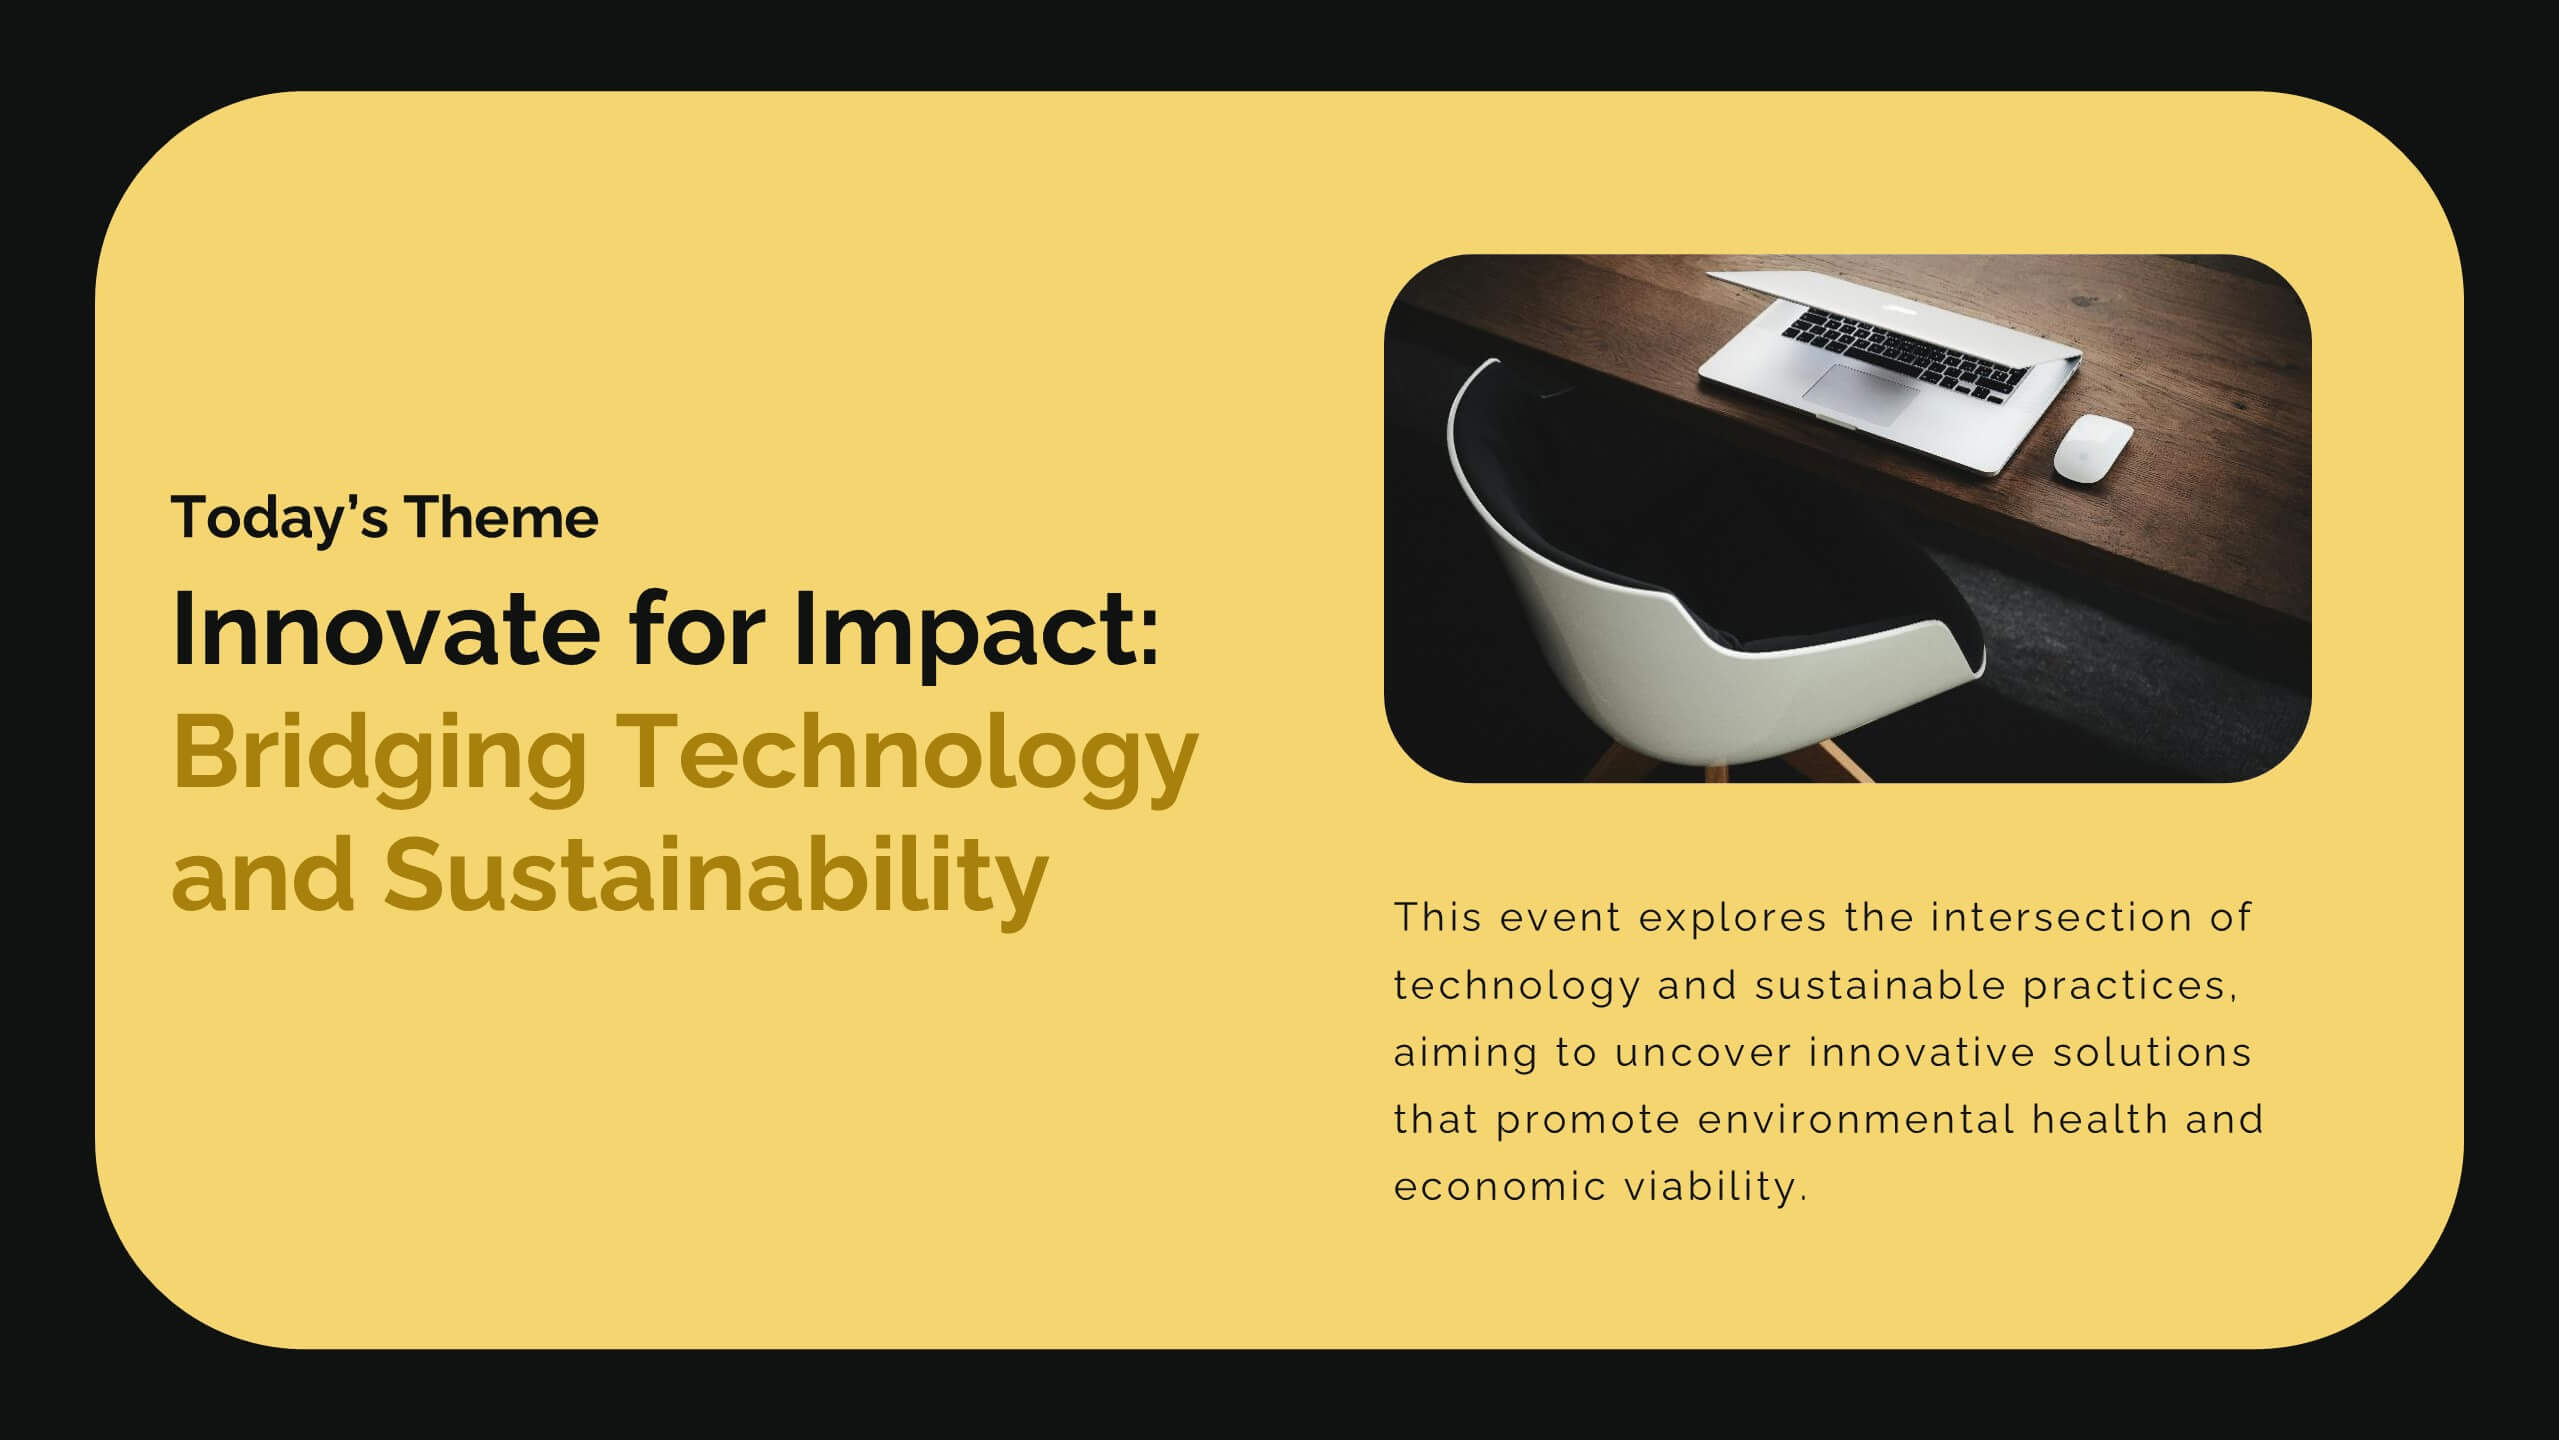
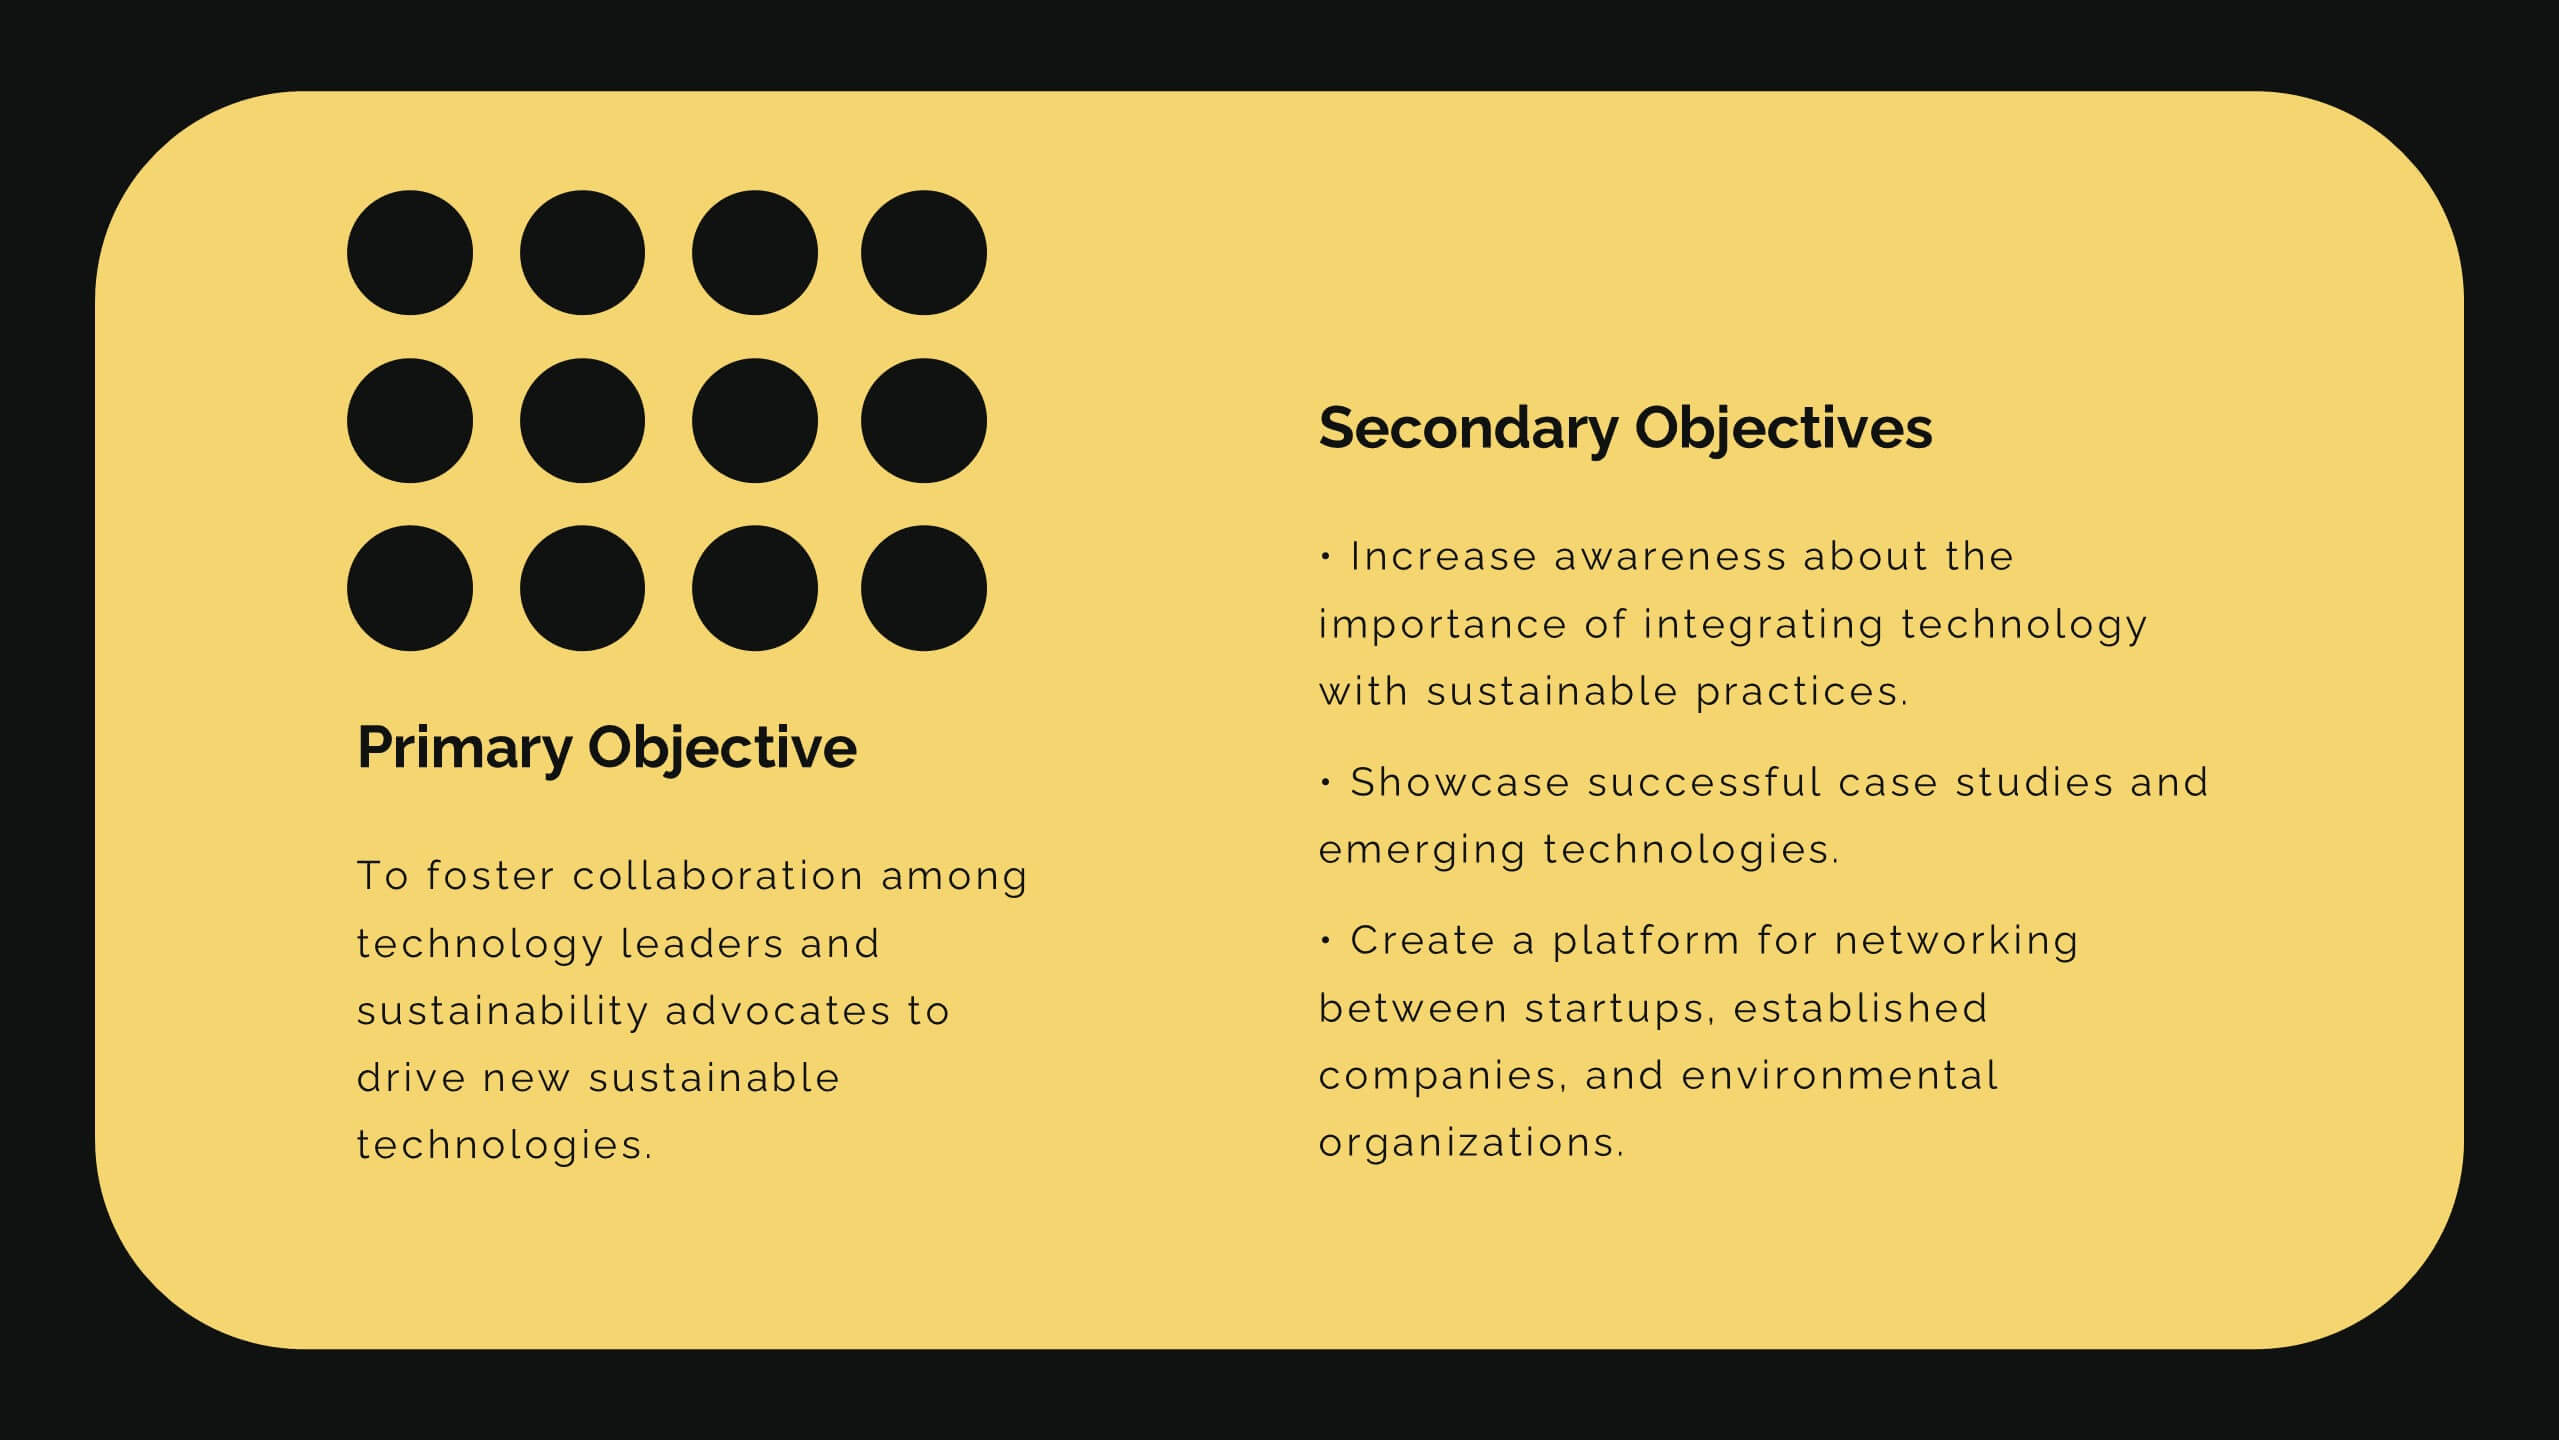
Diamond Business Development Proposal Presentation
Unlock the potential of your business proposals with this bold and engaging presentation template! Perfect for business development pitches, conferences, and workshops, it includes sections for speaker introductions, panel discussions, and session breakdowns. With its clean and professional design, this template ensures clarity and impact. Fully customizable and compatible with PowerPoint, Keynote, and Google Slides.


10 diapositivas
Digital Transformation Strategy Presentation
The "Digital Transformation Strategy Presentation" template is designed to clearly showcase the stages of digital transformation initiatives. It features a visually appealing layout with concentric circles or varying targets that focus on key elements of transformation strategy. This format is ideal for emphasizing the progression from planning to execution and monitoring of digital strategies. Each section is distinctly colored and provides a space for succinctly labeled titles and detailed descriptions, making it perfect for presenting strategic initiatives, technology implementation, or progress metrics in corporate settings. The template ensures that complex strategies are communicated in an understandable and visually engaging manner.


8 diapositivas
Workforce Skills Gap Analysis Presentation
Identify and Bridge Workforce Skill Gaps! This Workforce Skills Gap Analysis template provides a structured approach to assess, compare, and close competency gaps within an organization. Designed with interactive bar chart visuals, it enables HR professionals, managers, and training specialists to track employee skill levels, identify gaps, and align workforce development strategies. Fully customizable in PowerPoint, Keynote, and Google Slides, this template ensures a clear and data-driven approach to workforce planning and professional growth.


5 diapositivas
North American Business Overview and Map Presentation
Showcase regional performance data across North America with this clean, data-driven map slide. Highlight four key statistics using pinpoint markers and modern percentage indicators. Ideal for market overview, financial reporting, or strategic insights. Fully customizable and compatible with PowerPoint, Keynote, and Google Slides for seamless business presentations.

22 diapositivas
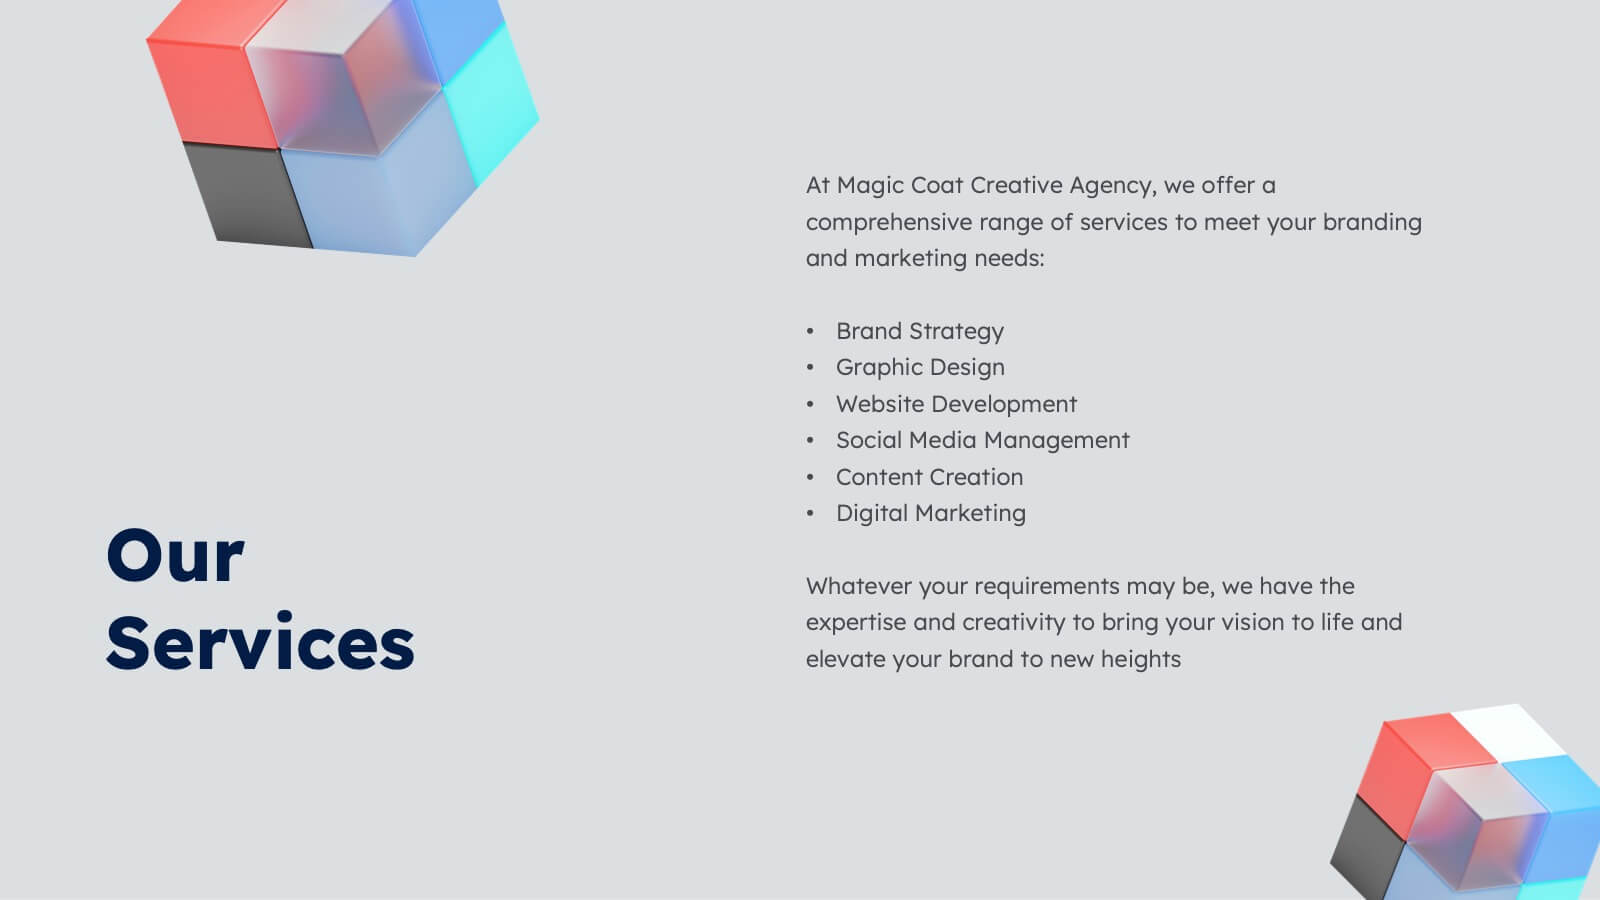
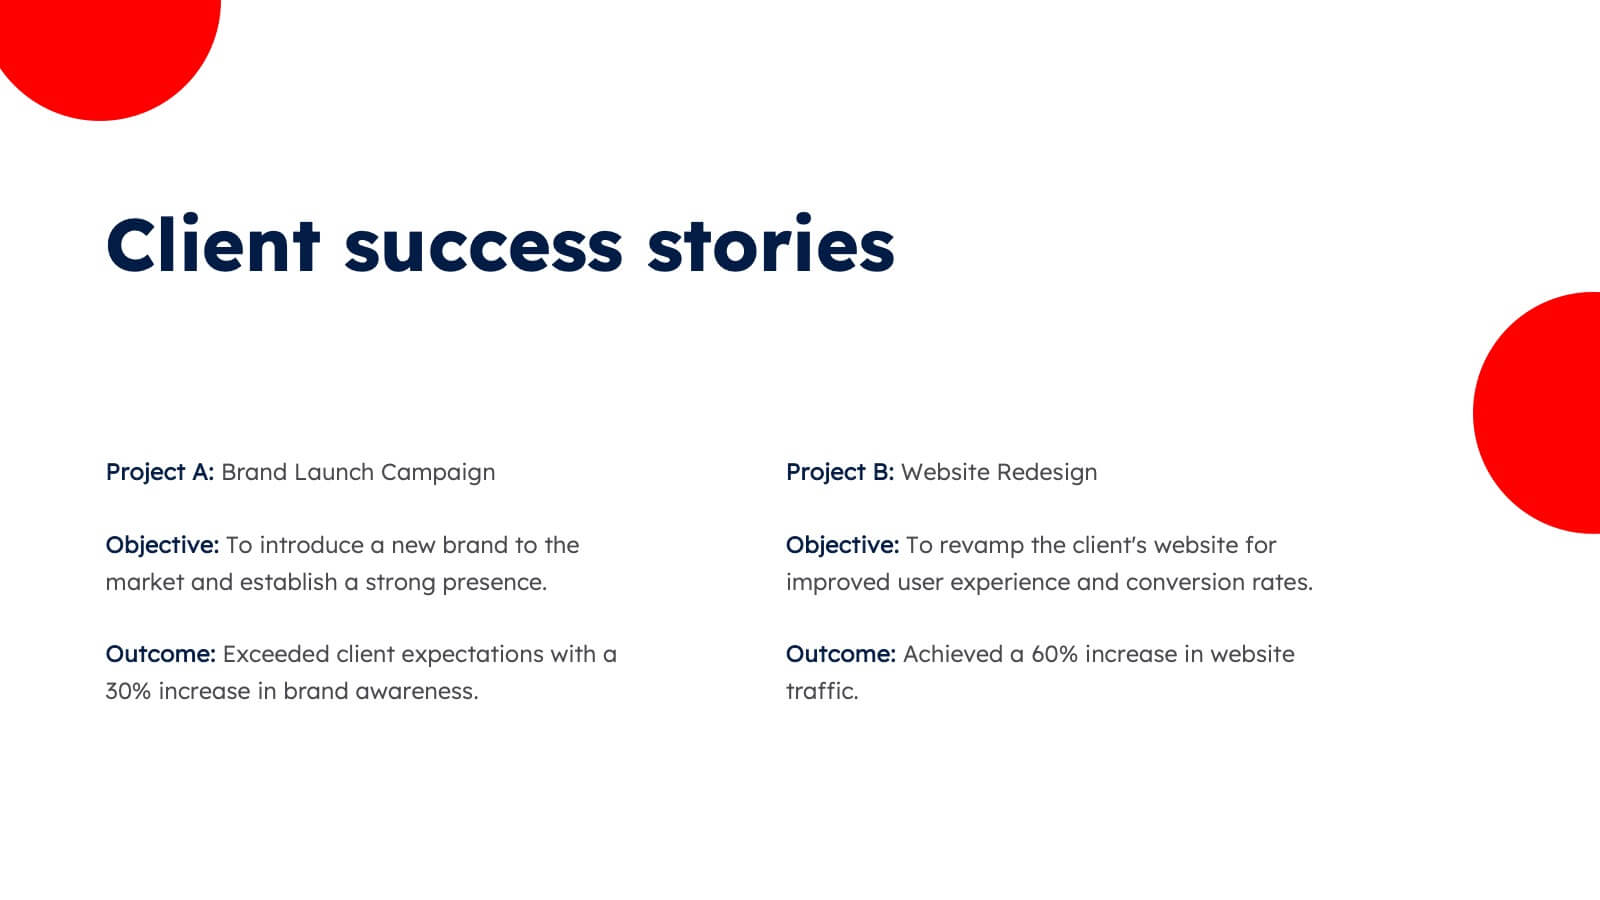
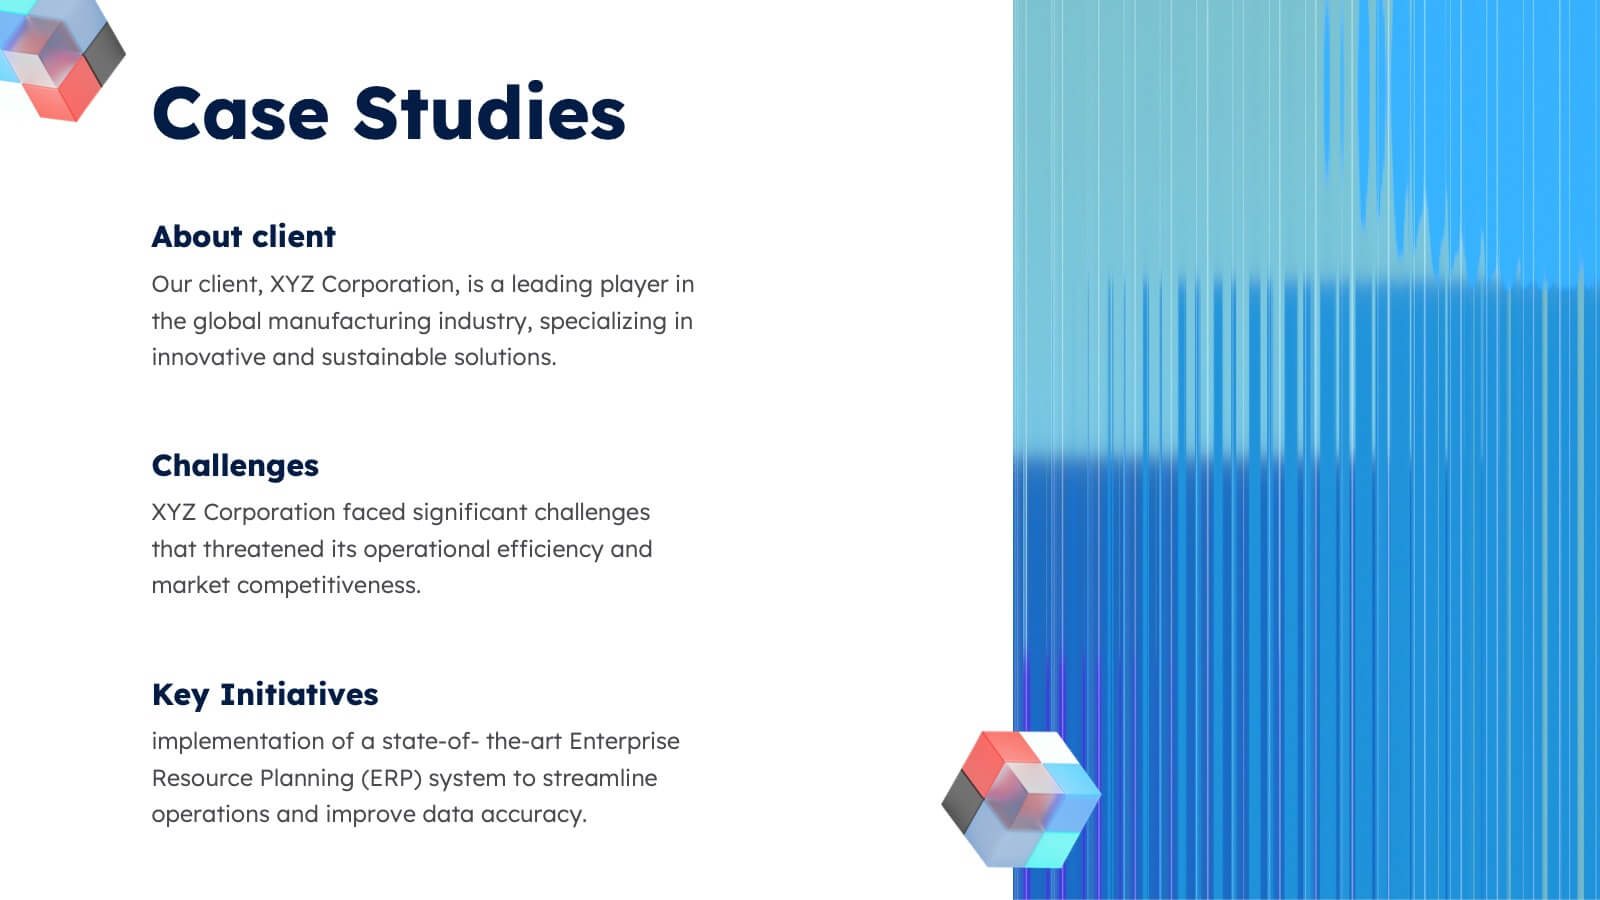
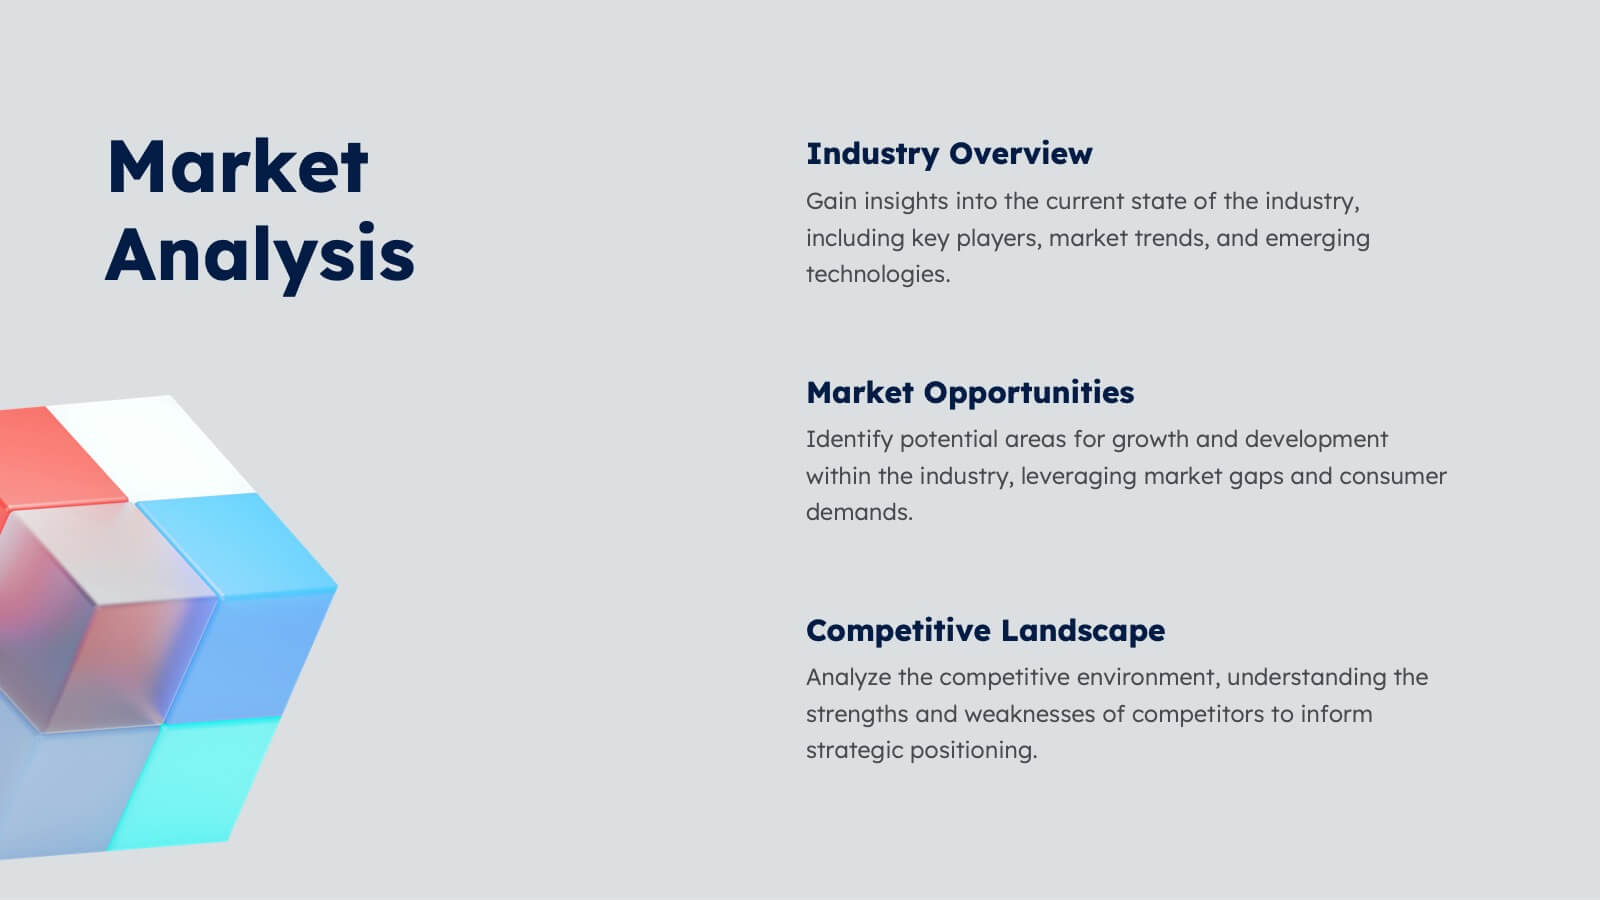
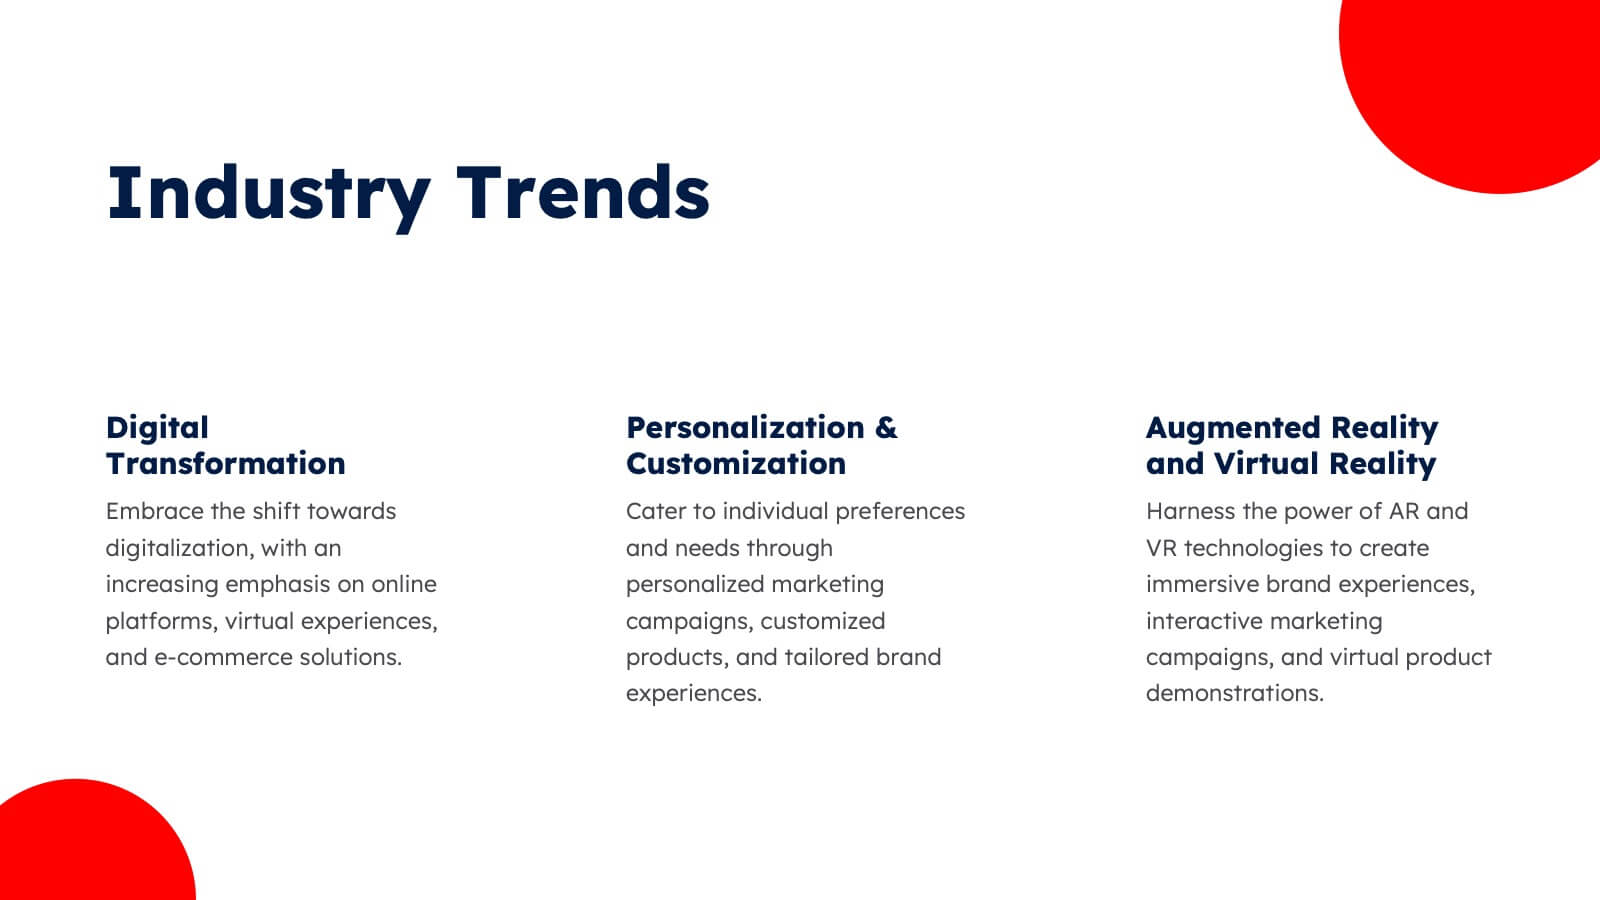
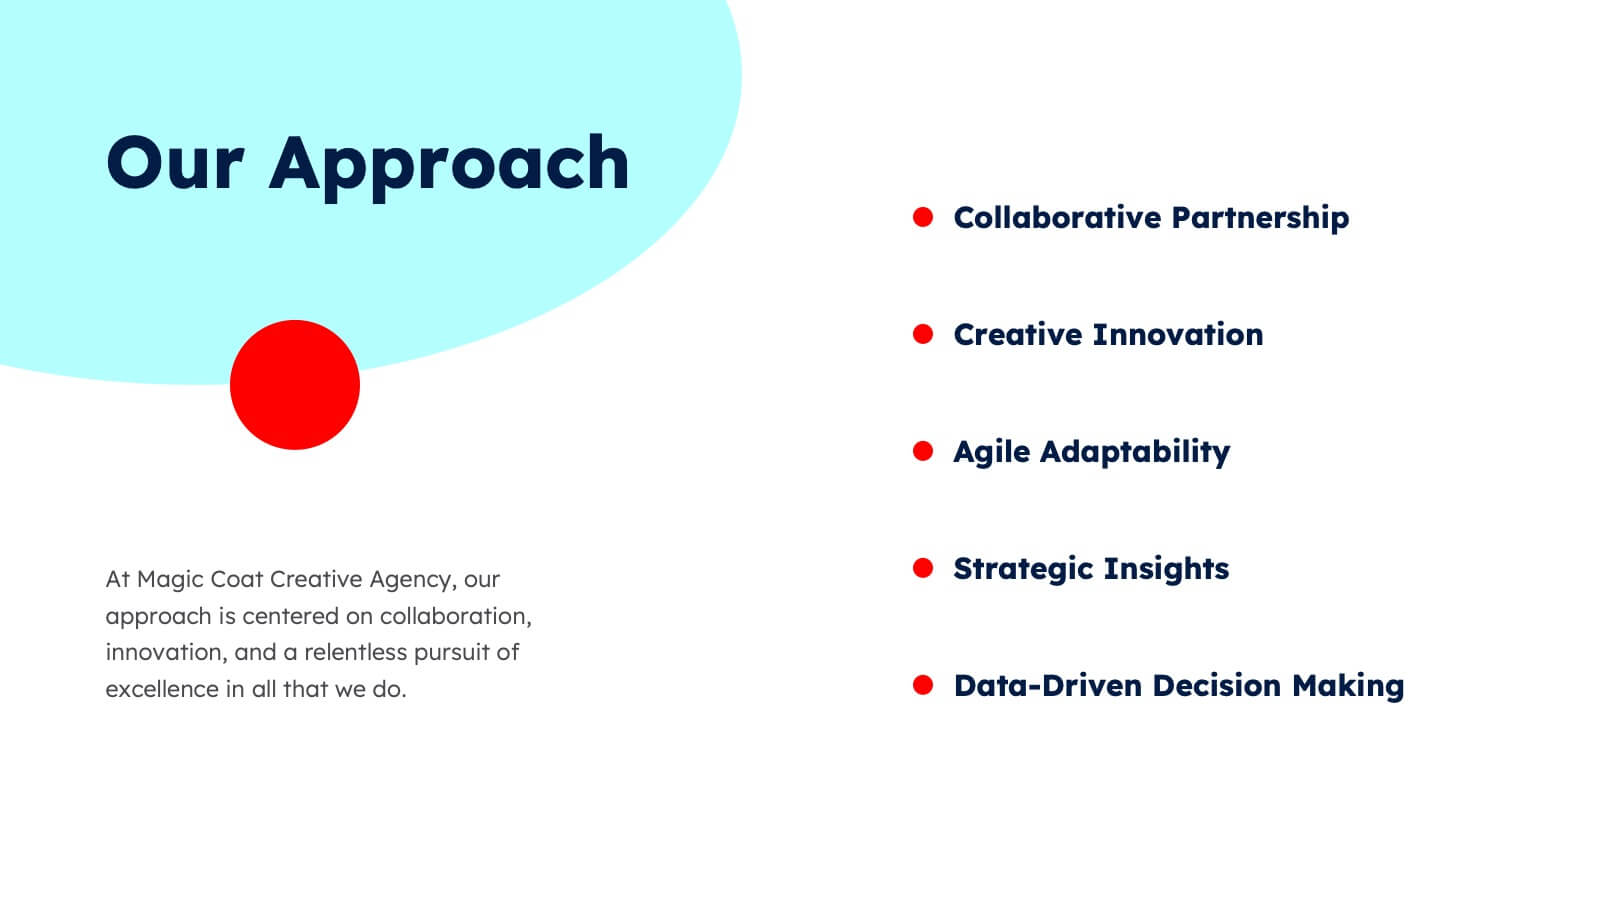
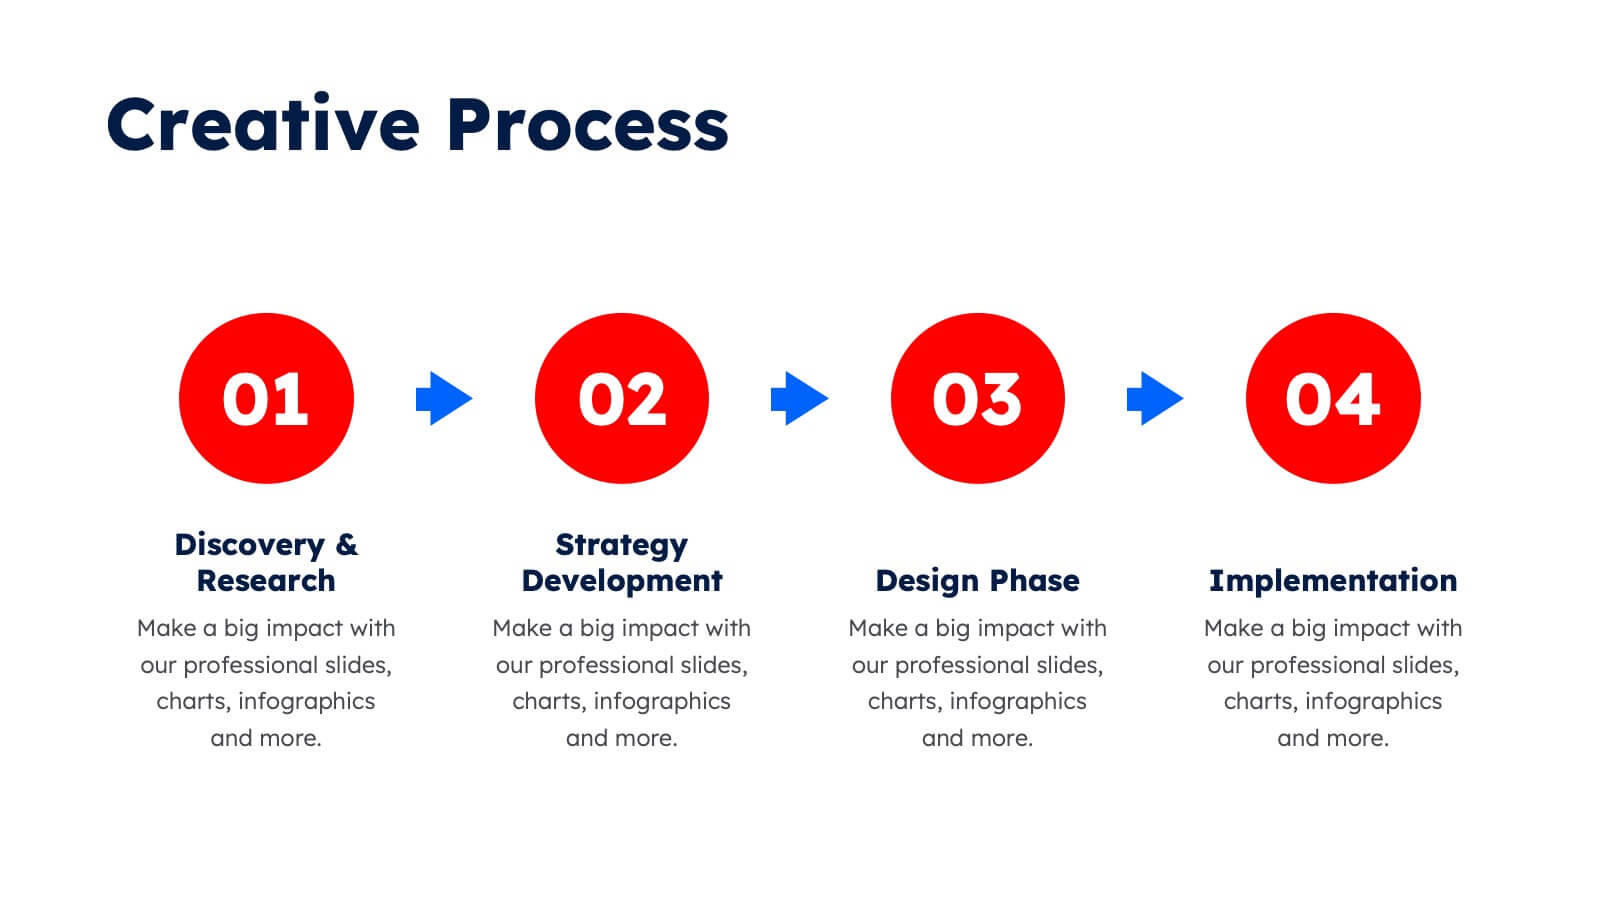
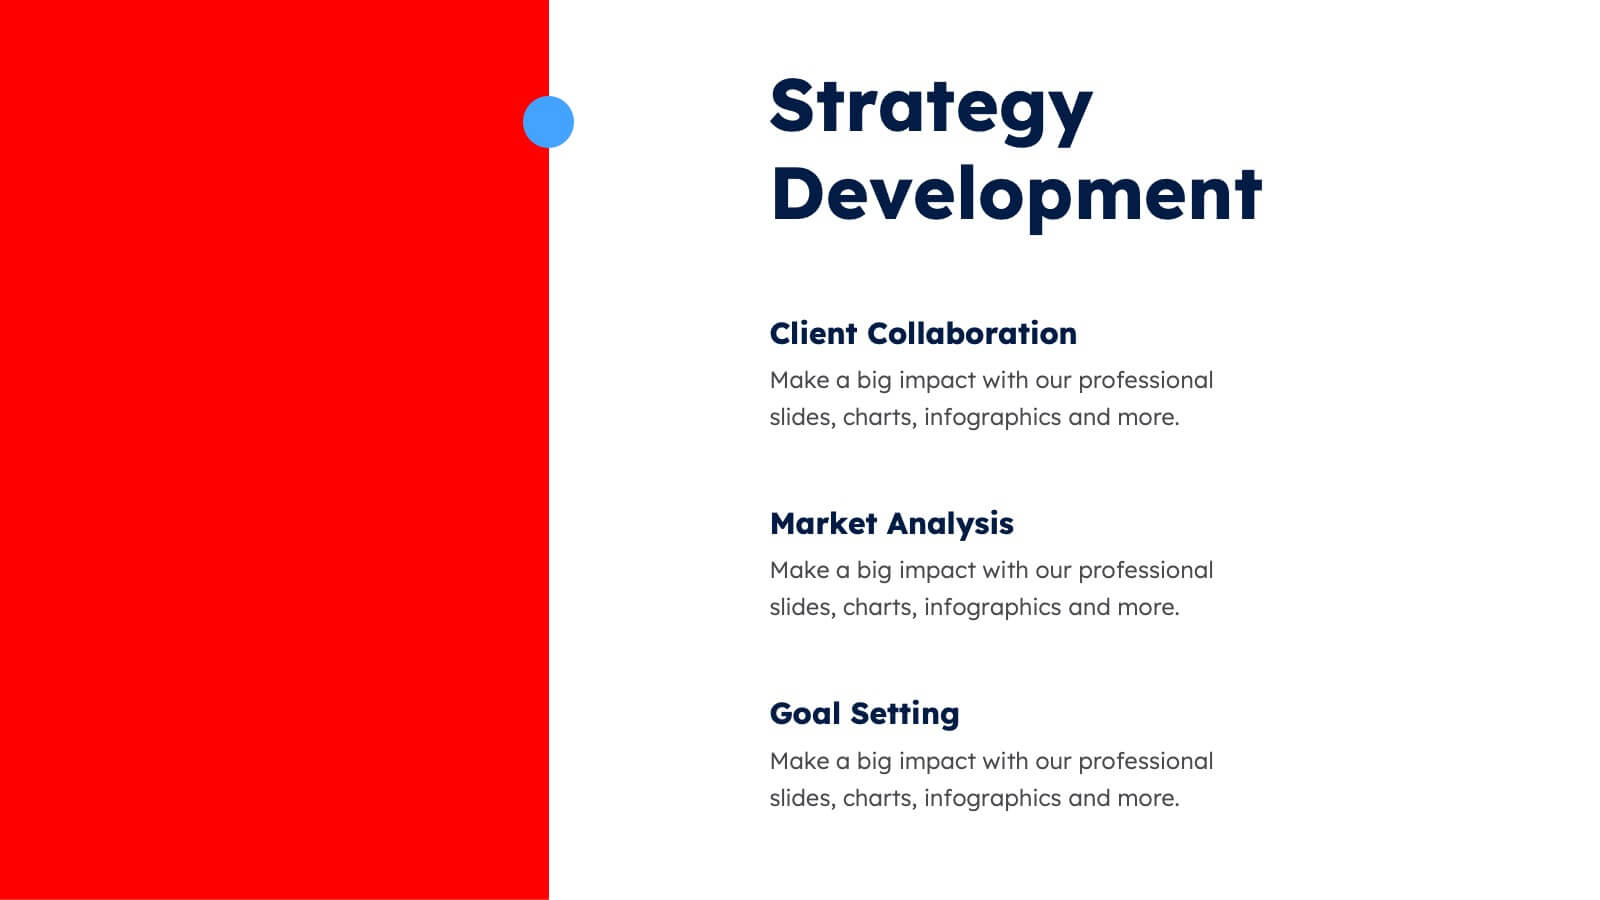
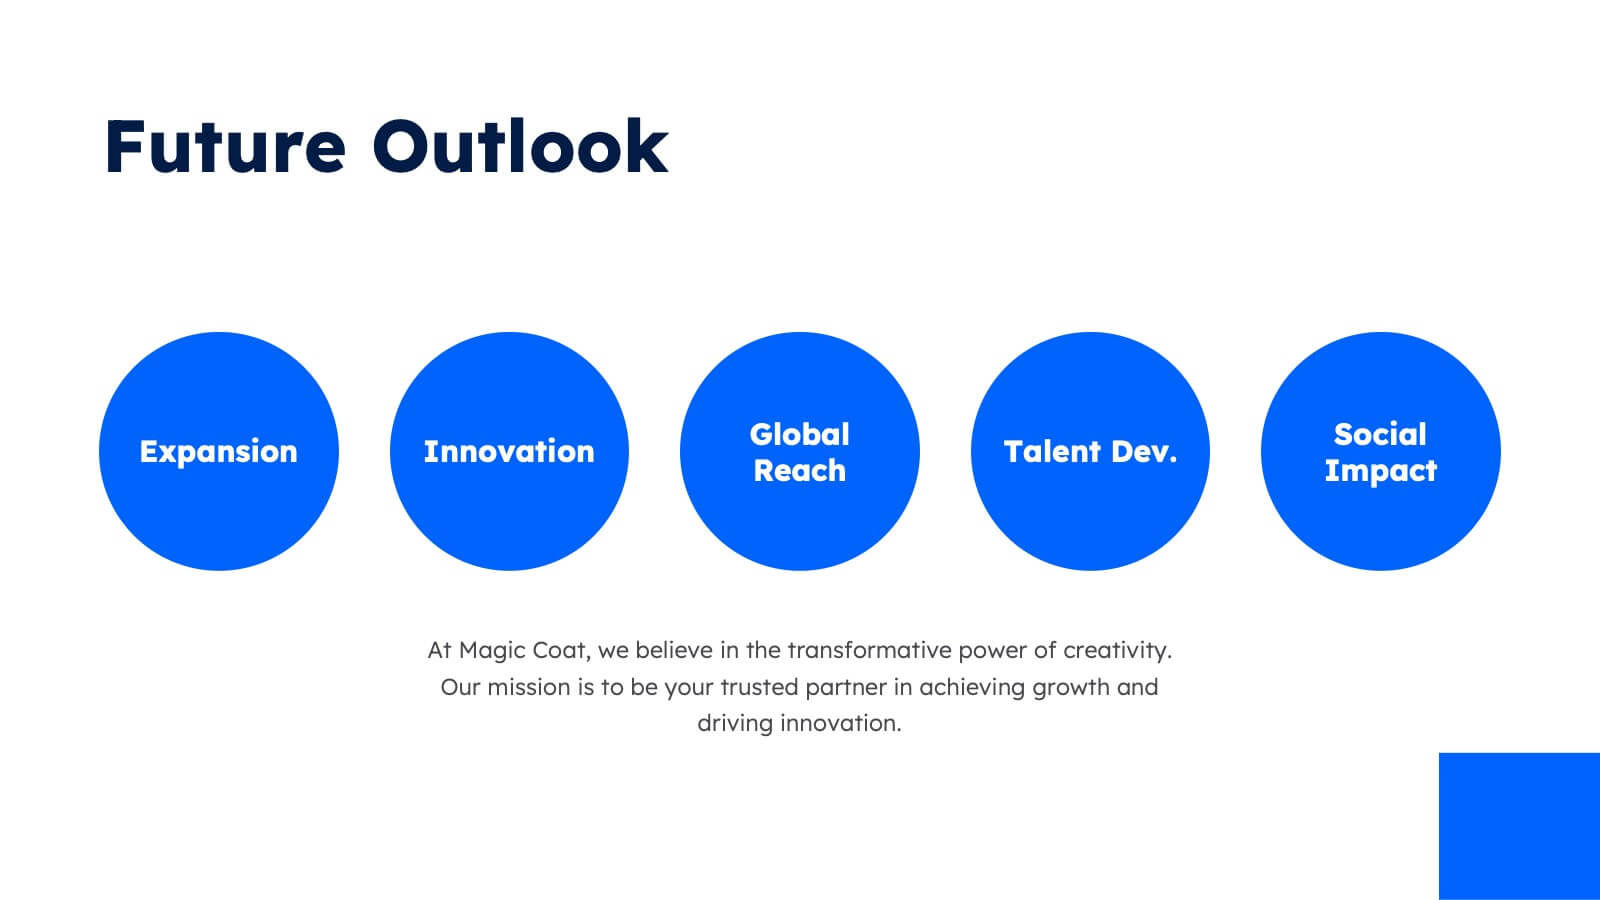
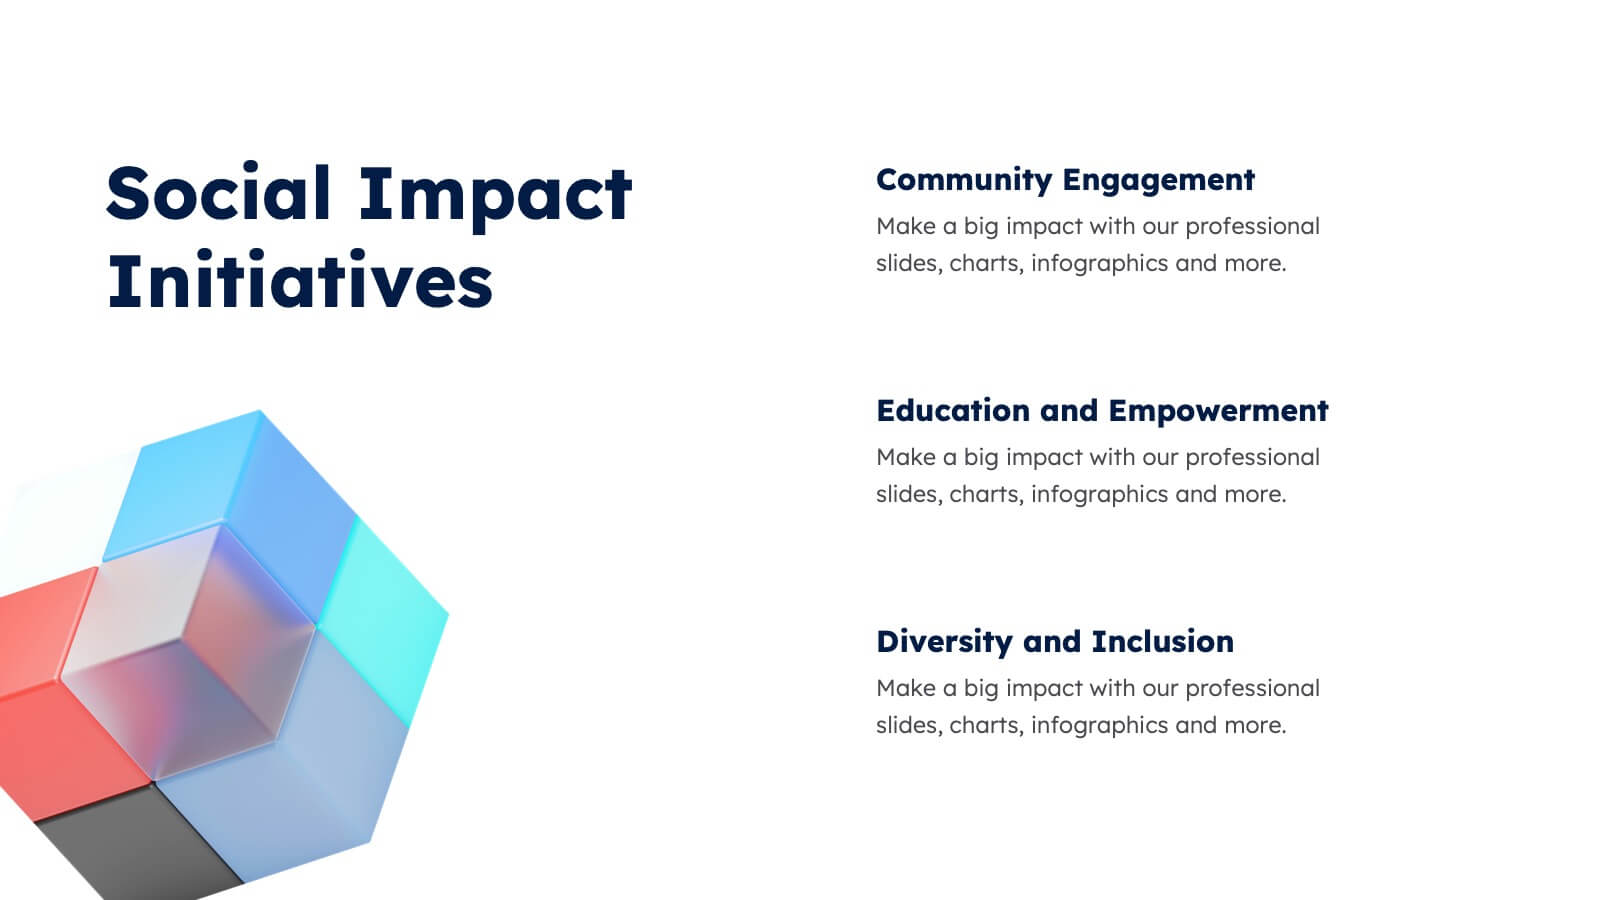
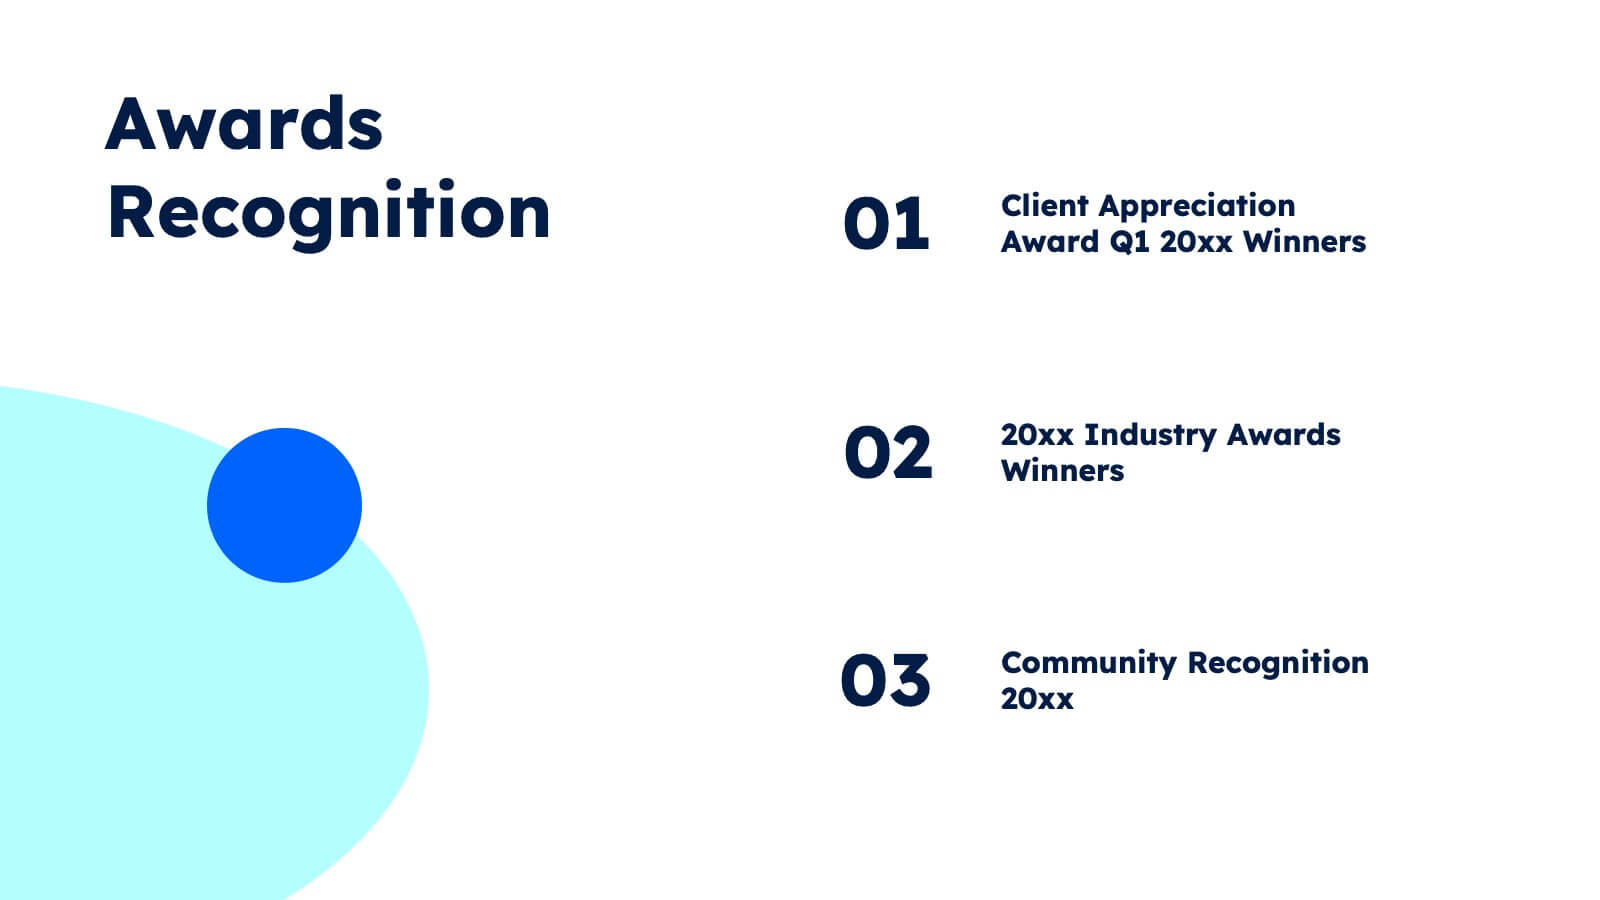
Aura Agency Portfolio Presentation
Showcase your agency's brilliance with this vibrant portfolio presentation template! Ideal for highlighting your mission, vision, case studies, and market analysis, it brings your achievements to life with colorful, engaging slides. Impress clients and partners with a well-structured, visually appealing narrative. Compatible with PowerPoint, Keynote, and Google Slides for easy use on any platform.