


Características


¿Tienes alguna pregunta?
Recomendar


5 diapositivas
Employee Benefits and Compensation Presentation
Effectively communicate your company’s value proposition with this Employee Benefits and Compensation Presentation. This clean and professional diagram highlights four key benefit categories in a circular flow, perfect for HR teams, onboarding materials, or internal strategy reviews. Easily editable in PowerPoint, Keynote, or Google Slides, it's ideal for showcasing wellness perks, bonuses, insurance, and more.


7 diapositivas
Pillar Points Infographic Presentation
A Pillar Infographic presents information on a specific topic or subject in a clear and organized manner. It consists of several sections or "pillars" that are interconnected and support the overall message of the infographic. In this template each pillar can be used to represent different aspects of the topic being discussed. Each section contains relevant data, statistics, and other information that illustrates the aspect. This can be used in marketing and advertising to promote products or services, as well as in education and journalism to explain complex ideas in a visually appealing way.


5 diapositivas
Market Economy Infographics
A market economy is an economic system where the production, distribution, and pricing of goods and services are determined by the interactions of individuals and businesses in the market. These vertical infographics are visually compelling design that explains the fundamental principles and characteristics of a market economy. This infographics is ideal for economists, business analysts, educators, and anyone looking to educate others about how market economies work and their impact on society. The infographics incorporate relevant statistics and data to support the information presented. Compatible with Powerpoint, Keynote, and Google Slides.


5 diapositivas
Agribusiness Market Strategy Overview
Showcase your market plan with the Agribusiness Market Strategy Overview Presentation. This engaging slide uses fresh produce illustrations to symbolize market growth, distribution, and agricultural planning. Perfect for farm business proposals, supply chain discussions, or food sector reports. Fully customizable and works seamlessly in PowerPoint, Keynote, and Google Slides.


6 diapositivas
Framework Diagram Layout Presentation
Bring structure to your ideas with this sleek and modern presentation layout designed for clarity and flow. Perfect for visualizing systems, workflows, and strategic processes, it helps audiences grasp relationships between concepts effortlessly. Fully editable and compatible with PowerPoint, Keynote, and Google Slides for smooth customization and professional results.


4 diapositivas
Team Planning and Event Calendar
Turn chaos into coordination with this visual-first layout that simplifies how your team plans, tracks, and communicates project milestones. Each calendar block highlights key players, deadlines, and status updates—perfect for keeping everyone aligned and informed at a glance. Fully compatible with PowerPoint, Keynote, and Google Slides.


24 diapositivas
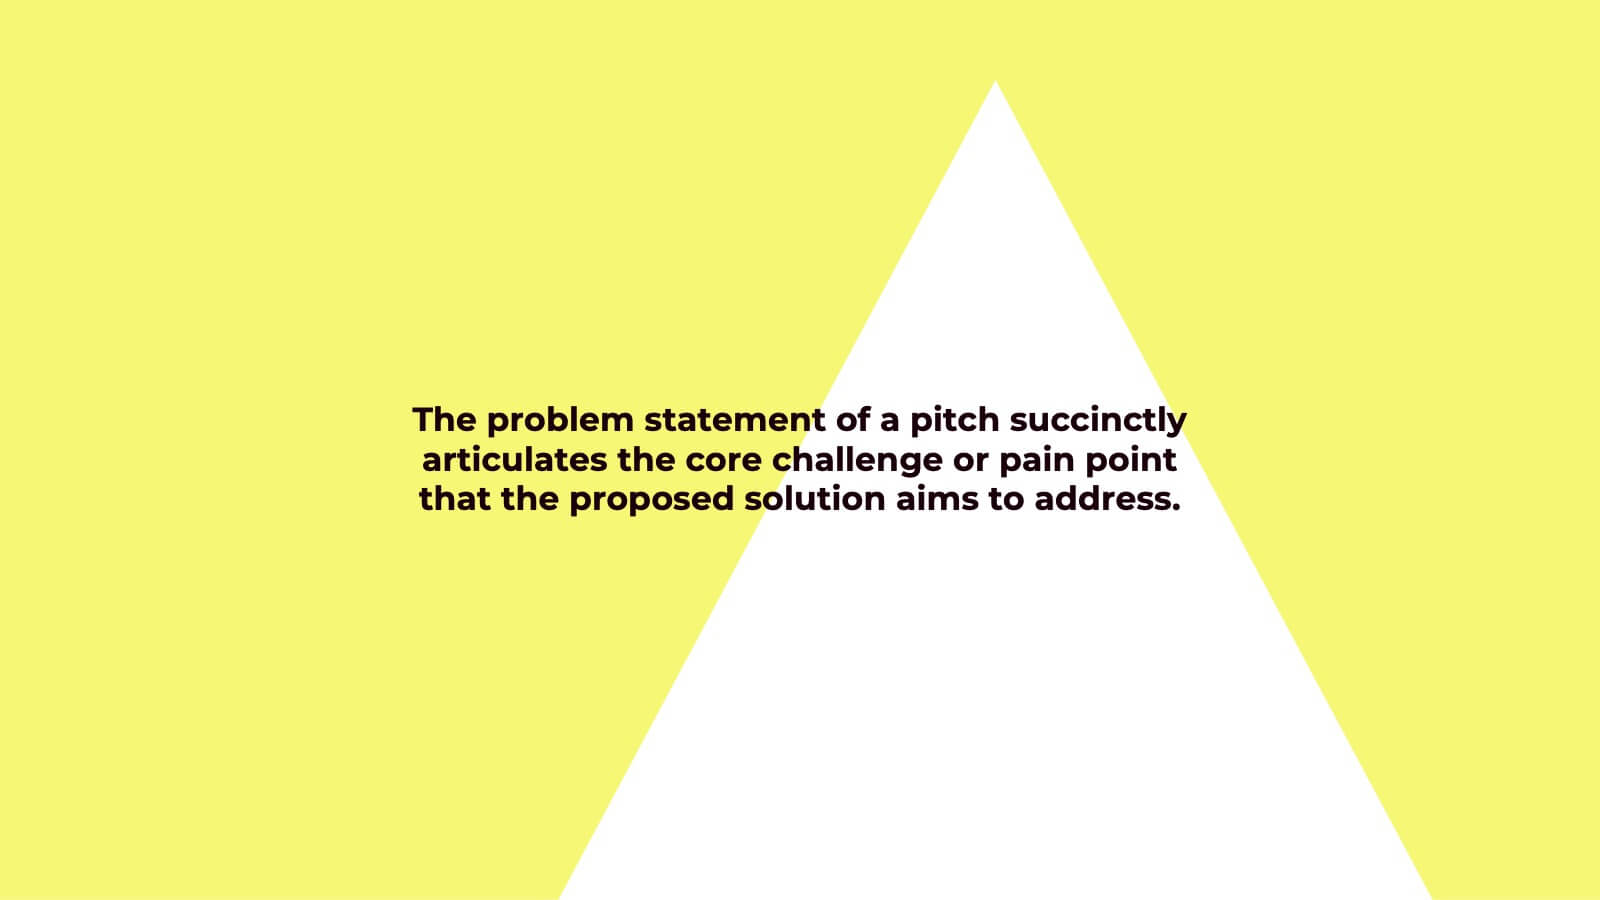
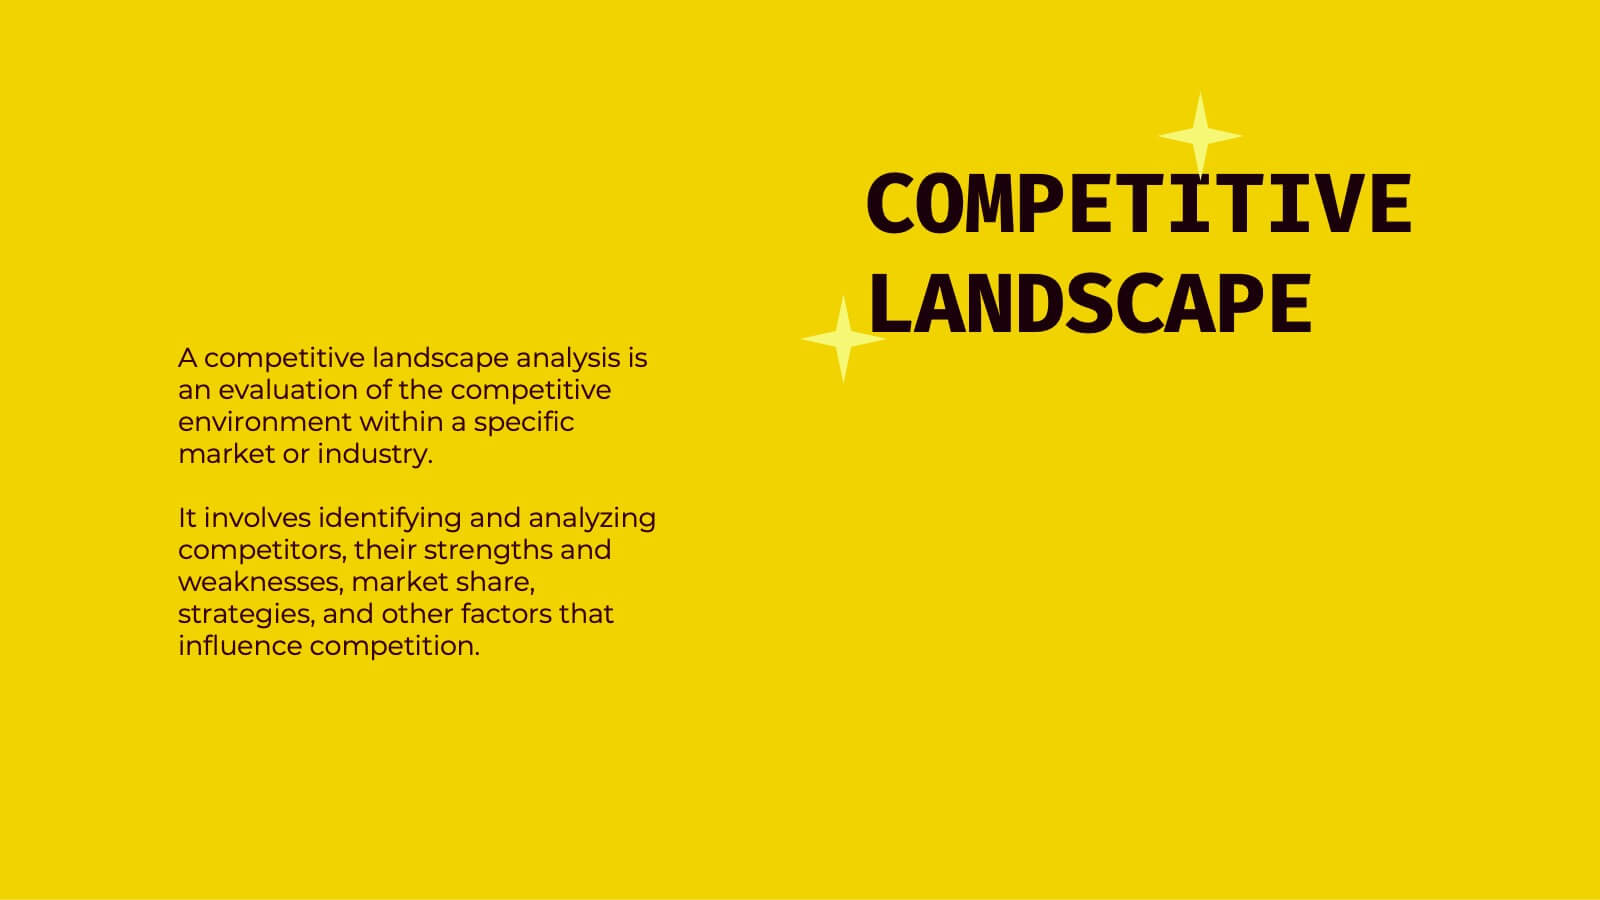
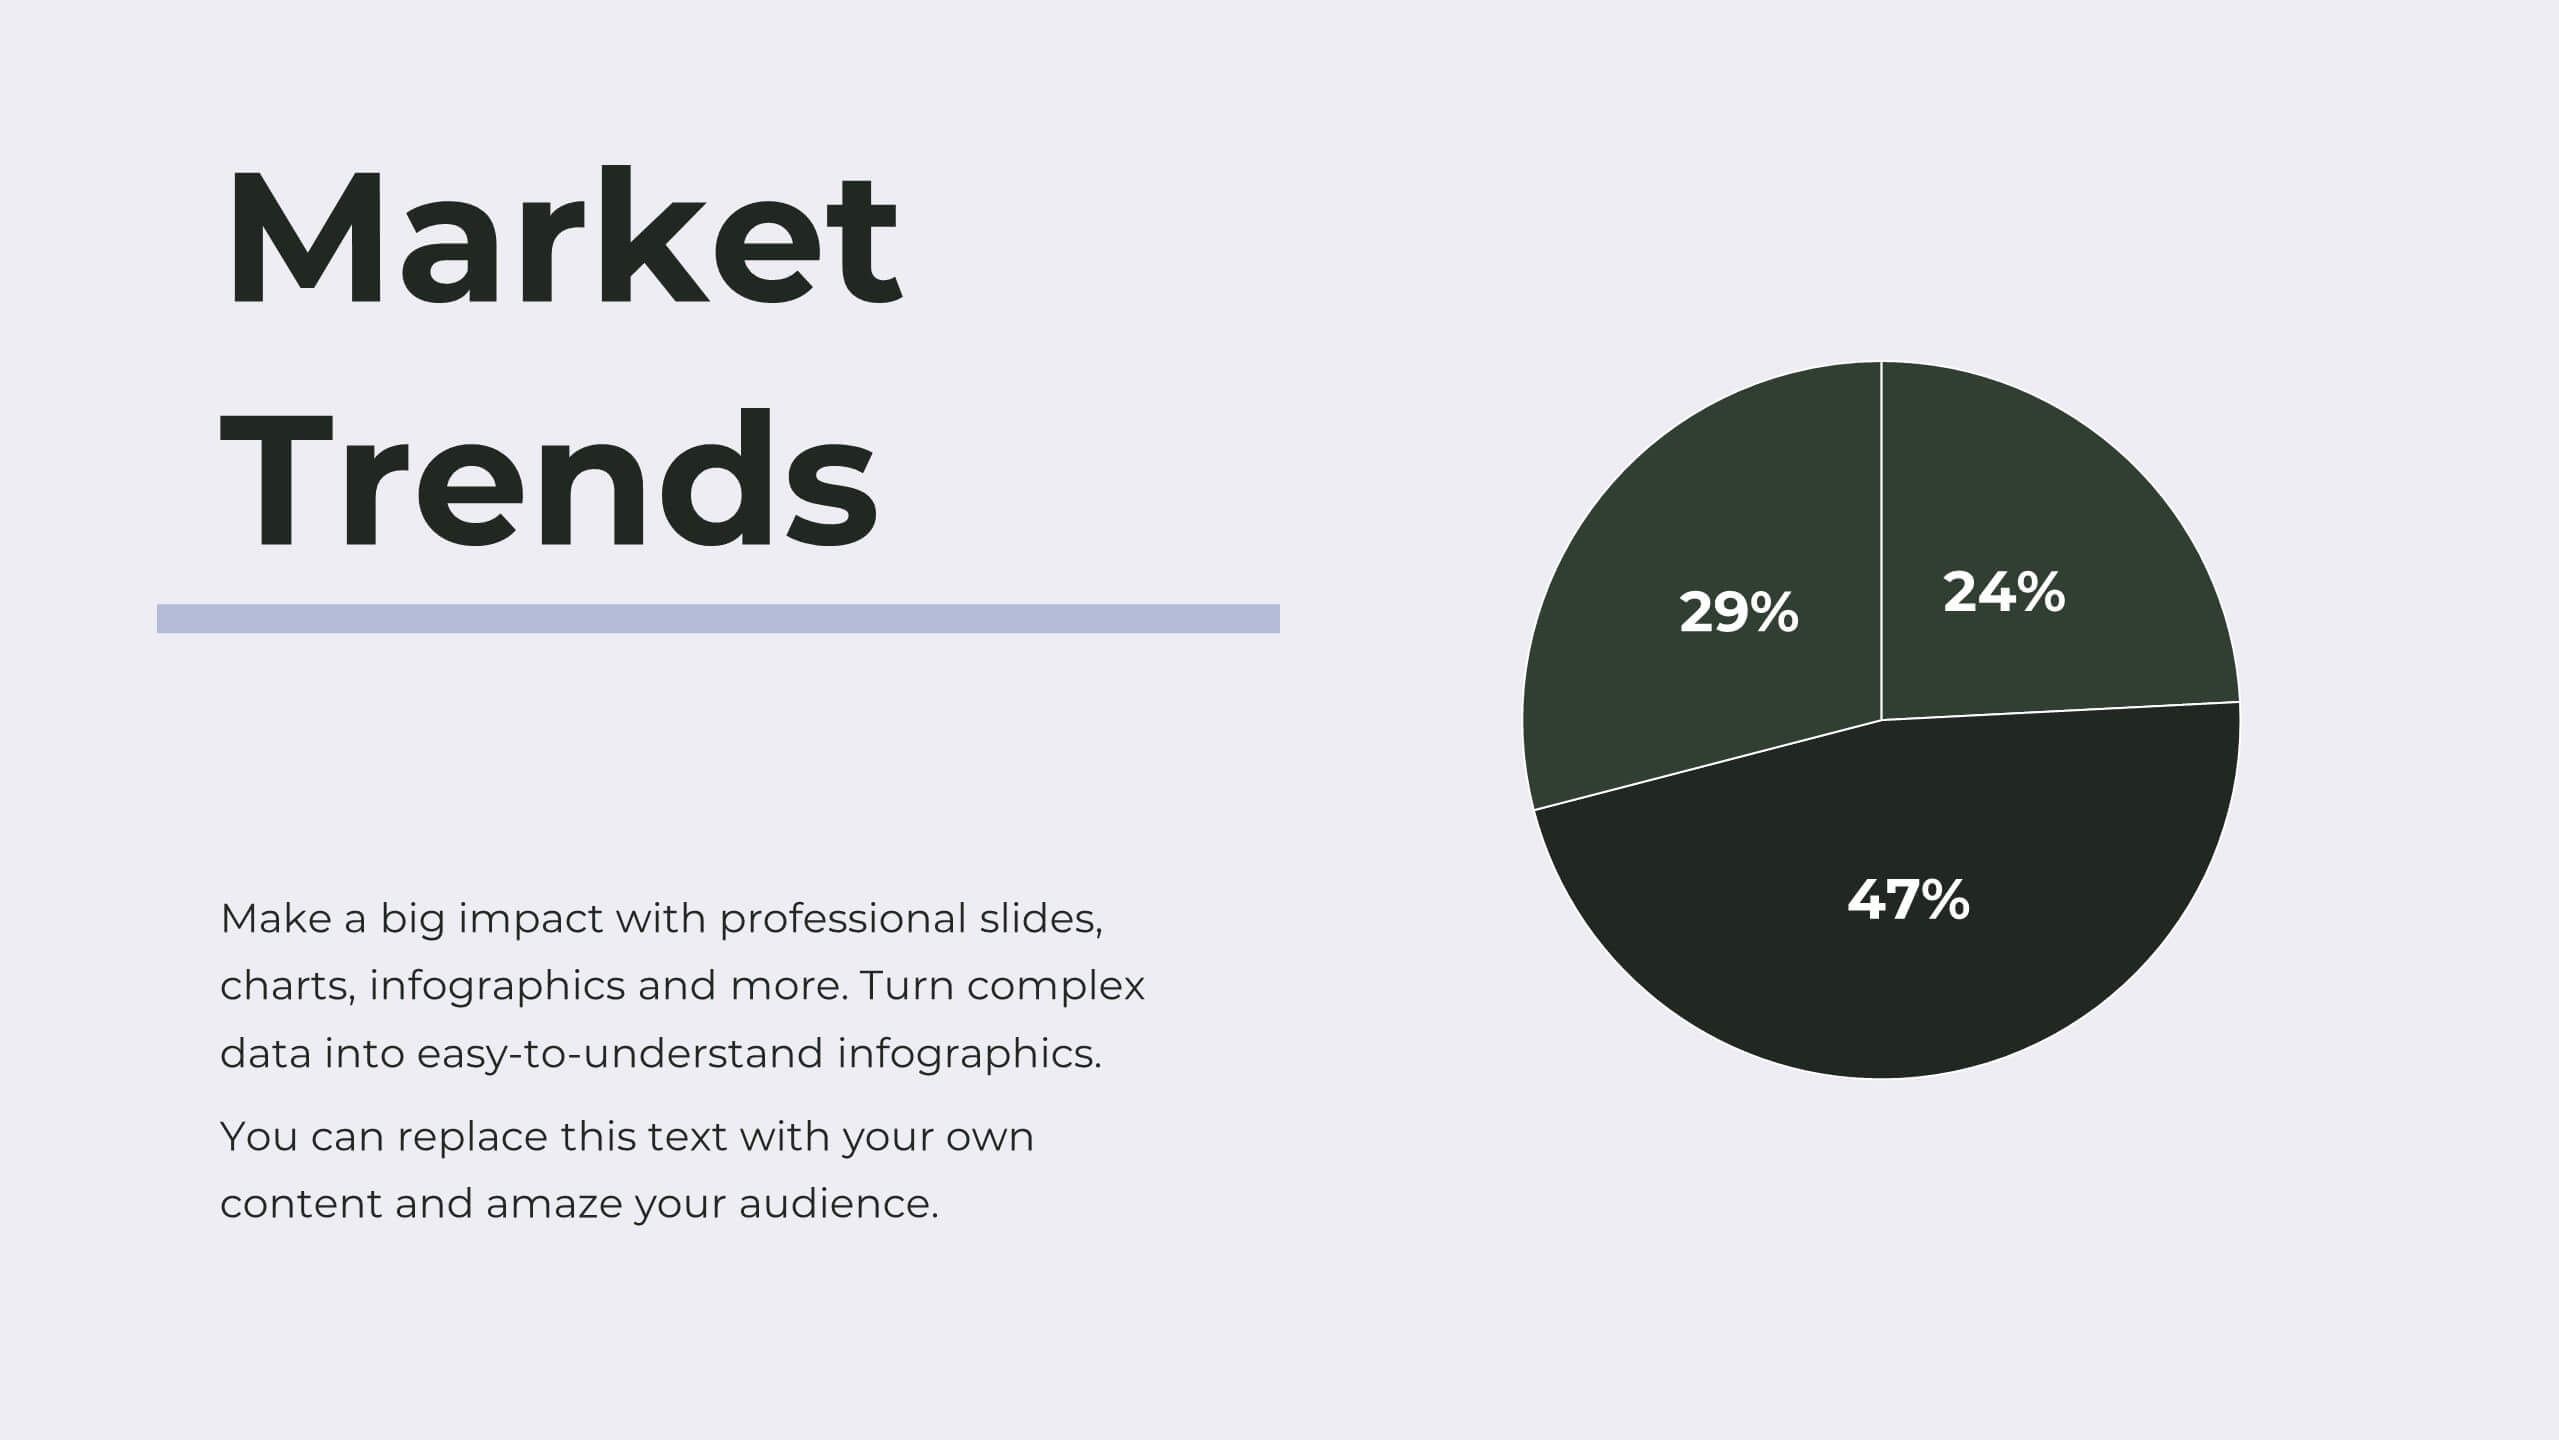
Kepler Investor Pitch Presentation
Impress potential investors with this thoughtfully crafted investor pitch presentation template. Its sleek design is tailored to captivate attention while delivering a clear and concise narrative about your business. Highlight key sections, including your company overview, problem statement, and innovative solutions, all designed to set you apart from the competition. Dive deep into your market opportunities, target audience, and revenue model, using visually engaging layouts and infographics. Showcase growth projections, financial overviews, and funding requirements with clarity and professionalism. Additionally, present your unique selling proposition, milestones, and risk analysis effectively. With dedicated slides for team introductions and a compelling close, this template is perfect for startups and established businesses alike. Fully customizable and compatible with PowerPoint, Google Slides, and Keynote, it ensures seamless branding and adaptability for any presentation. Engage your audience and secure the investment you need!


4 diapositivas
Breast Cancer Awareness Campaign Presentation
Raise awareness with impact using the Breast Cancer Awareness Campaign Presentation. This visually engaging design uses symbolic visuals to highlight key messages, educate audiences, and inspire action. Perfect for nonprofit initiatives, educational sessions, or health campaigns. Fully editable in PowerPoint, Google Slides, Keynote, and Canva for easy customization.


10 diapositivas
Innovation in Science Presentation
Showcase cutting-edge ideas with this Innovation in Science Presentation Template. Featuring a sleek lightbulb graphic with colorful horizontal bars, it's ideal for outlining research stages, technological breakthroughs, or futuristic concepts. Great for scientists, educators, and innovation teams. Easily customizable in PowerPoint, Keynote, and Google Slides.


5 diapositivas
Meeting Minutes and Notes Presentation
Keep every discussion organized and every detail accounted for with this clean and structured layout. Perfect for summarizing key decisions, attendees, and next steps, it helps teams capture essential meeting insights efficiently. This easy-to-edit template works flawlessly with PowerPoint, Keynote, and Google Slides for a polished professional presentation.


5 diapositivas
Decision Matrix Presentation
Make tough choices feel simple with this clear, color-coded layout designed to compare options side-by-side. This presentation helps you evaluate criteria, score alternatives, and present well-structured reasoning with confidence. Clean, intuitive, and fully editable. Compatible with PowerPoint, Keynote, and Google Slides.


6 diapositivas
Sustainability Goals and Metrics Presentation
Bring your eco-initiatives to life with a presentation that blends purpose and clarity. Ideal for showcasing environmental goals, progress metrics, and sustainability strategies, this clean design helps communicate impact with confidence. Fully editable and compatible with PowerPoint, Keynote, and Google Slides for seamless customization and professional results.


6 diapositivas
Sales Funnel Performance Presentation
Visualize your customer journey with this Sales Funnel Performance Presentation. The clean funnel diagram allows you to clearly represent each stage—awareness, interest, decision, and action—using vibrant, stacked layers. Customize the six labeled steps and supporting icons to fit your brand strategy. Perfect for showcasing conversion metrics or campaign insights in PowerPoint, Keynote, or Google Slides.


7 diapositivas
Schedule Infographics Presentation Template
Featuring our Schedule Infographic template, this is a great tool for business owners, students and others who need to create an impactful presentation. Using this template will ensure that your main point is emphasized and can be easily understood by all of your viewers. This template includes different colors and fonts that can be easily edited and changed. This will help you visualize your existing data and create a presentation that includes all of your points. Use this template to make a professional and smart looking schedule, and present your plan to others in an easy to understand way.


5 diapositivas
Business Overview and Highlights Summary
Summarize your company’s key milestones with this Business Overview and Highlights Summary slide. Featuring a clean layout with a bold briefcase visual and four spotlight areas, it’s ideal for showcasing achievements. Fully editable in PowerPoint, Keynote, and Google Slides.


4 diapositivas
High-Performance Team Collaboration Presentation
Showcase teamwork, trust, and synergy with this bold, interconnected arms graphic. Ideal for illustrating roles, partnerships, or team frameworks, this infographic is perfect for leadership, HR, or corporate strategy slides. Fully customizable in PowerPoint, Keynote, and Google Slides.
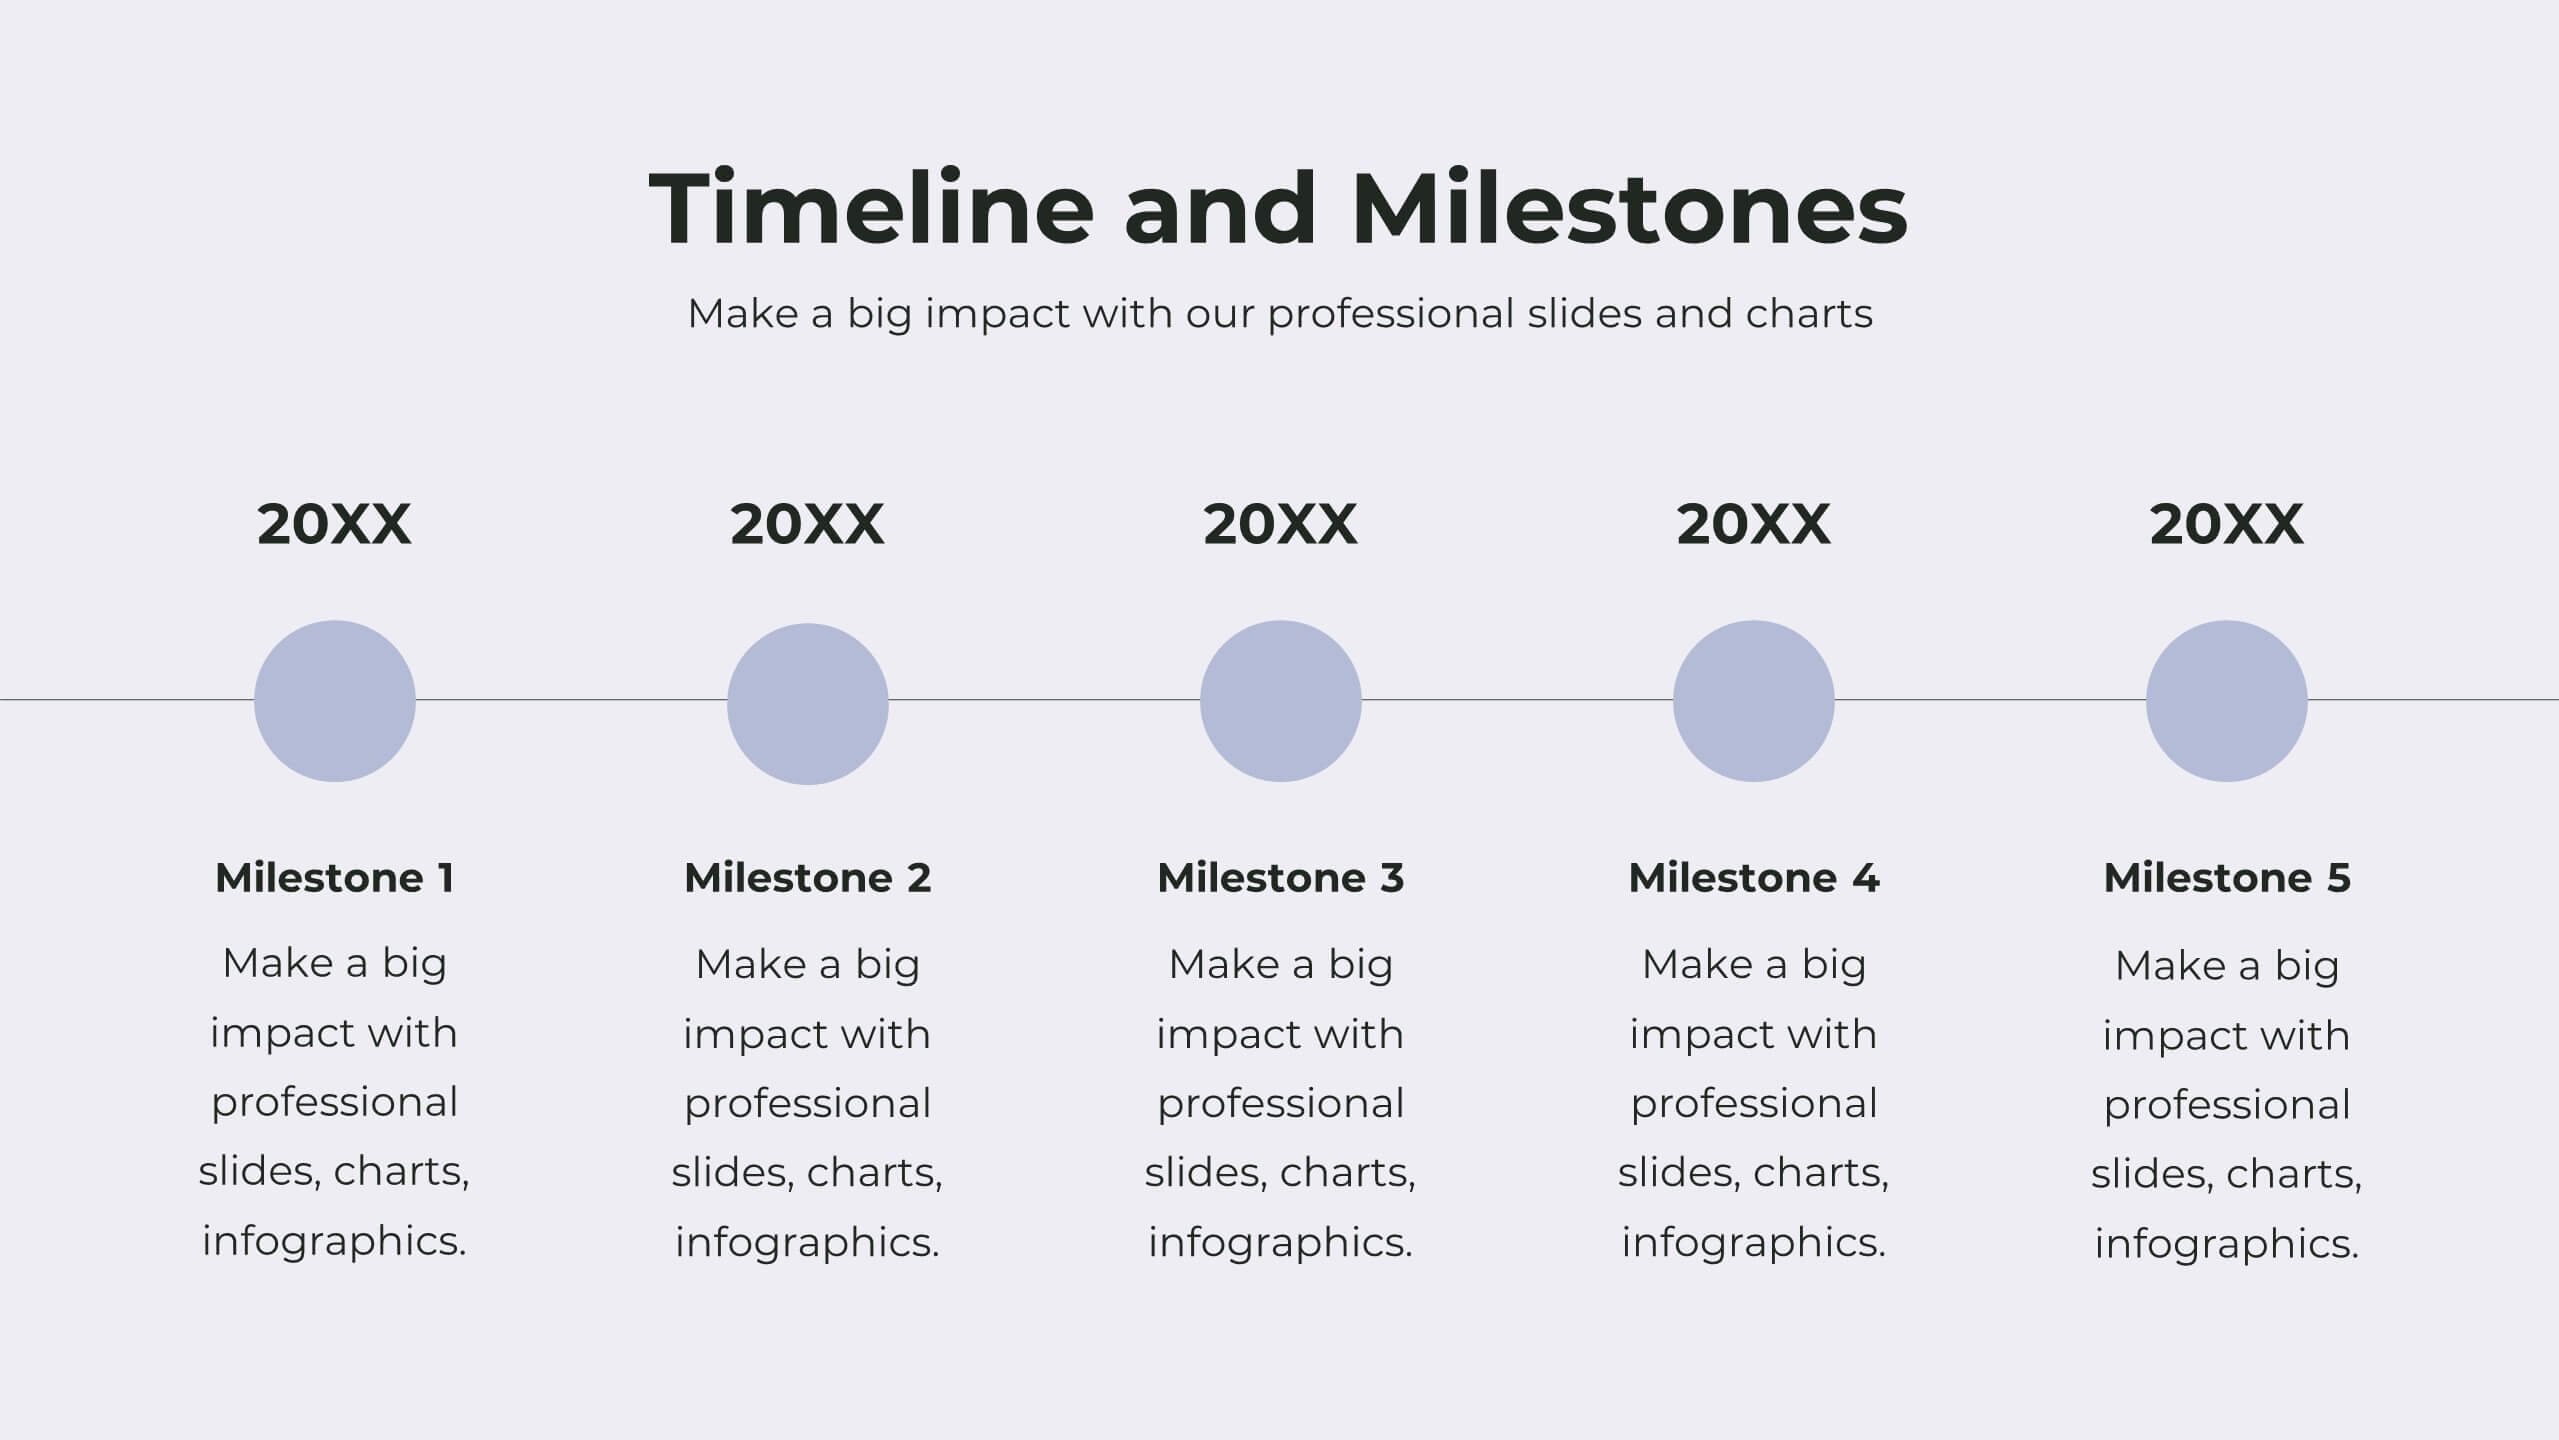
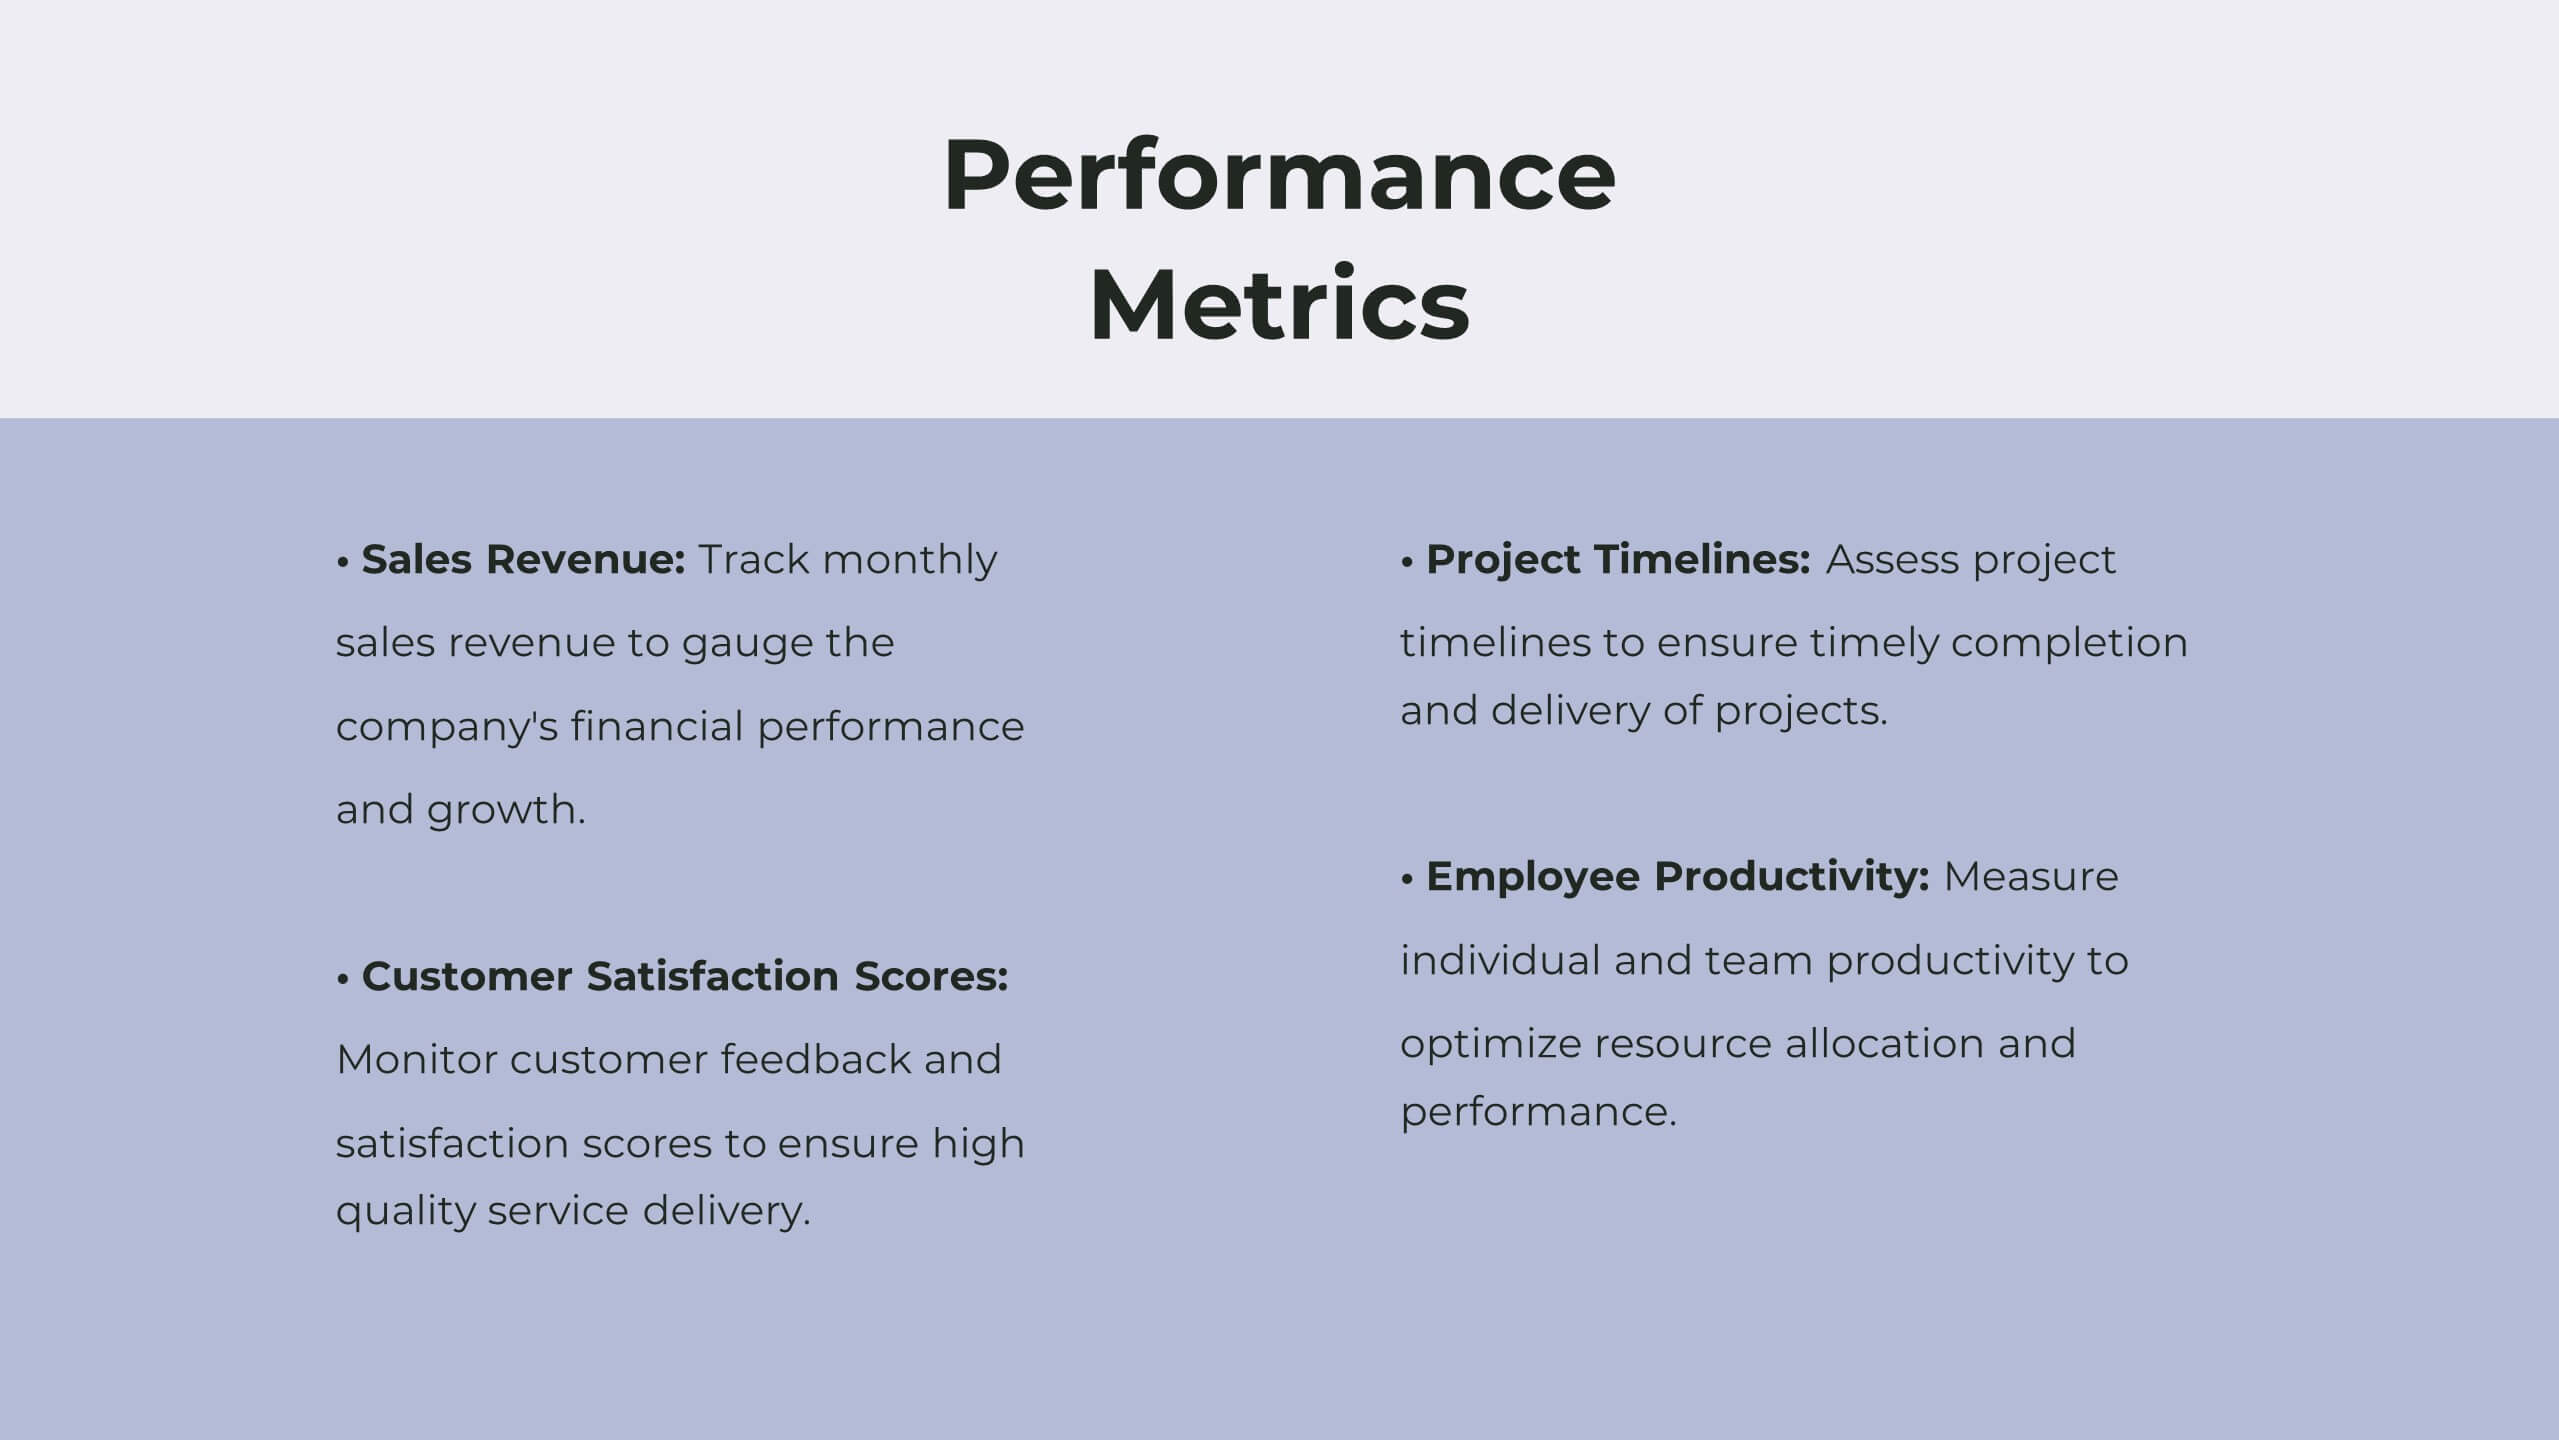
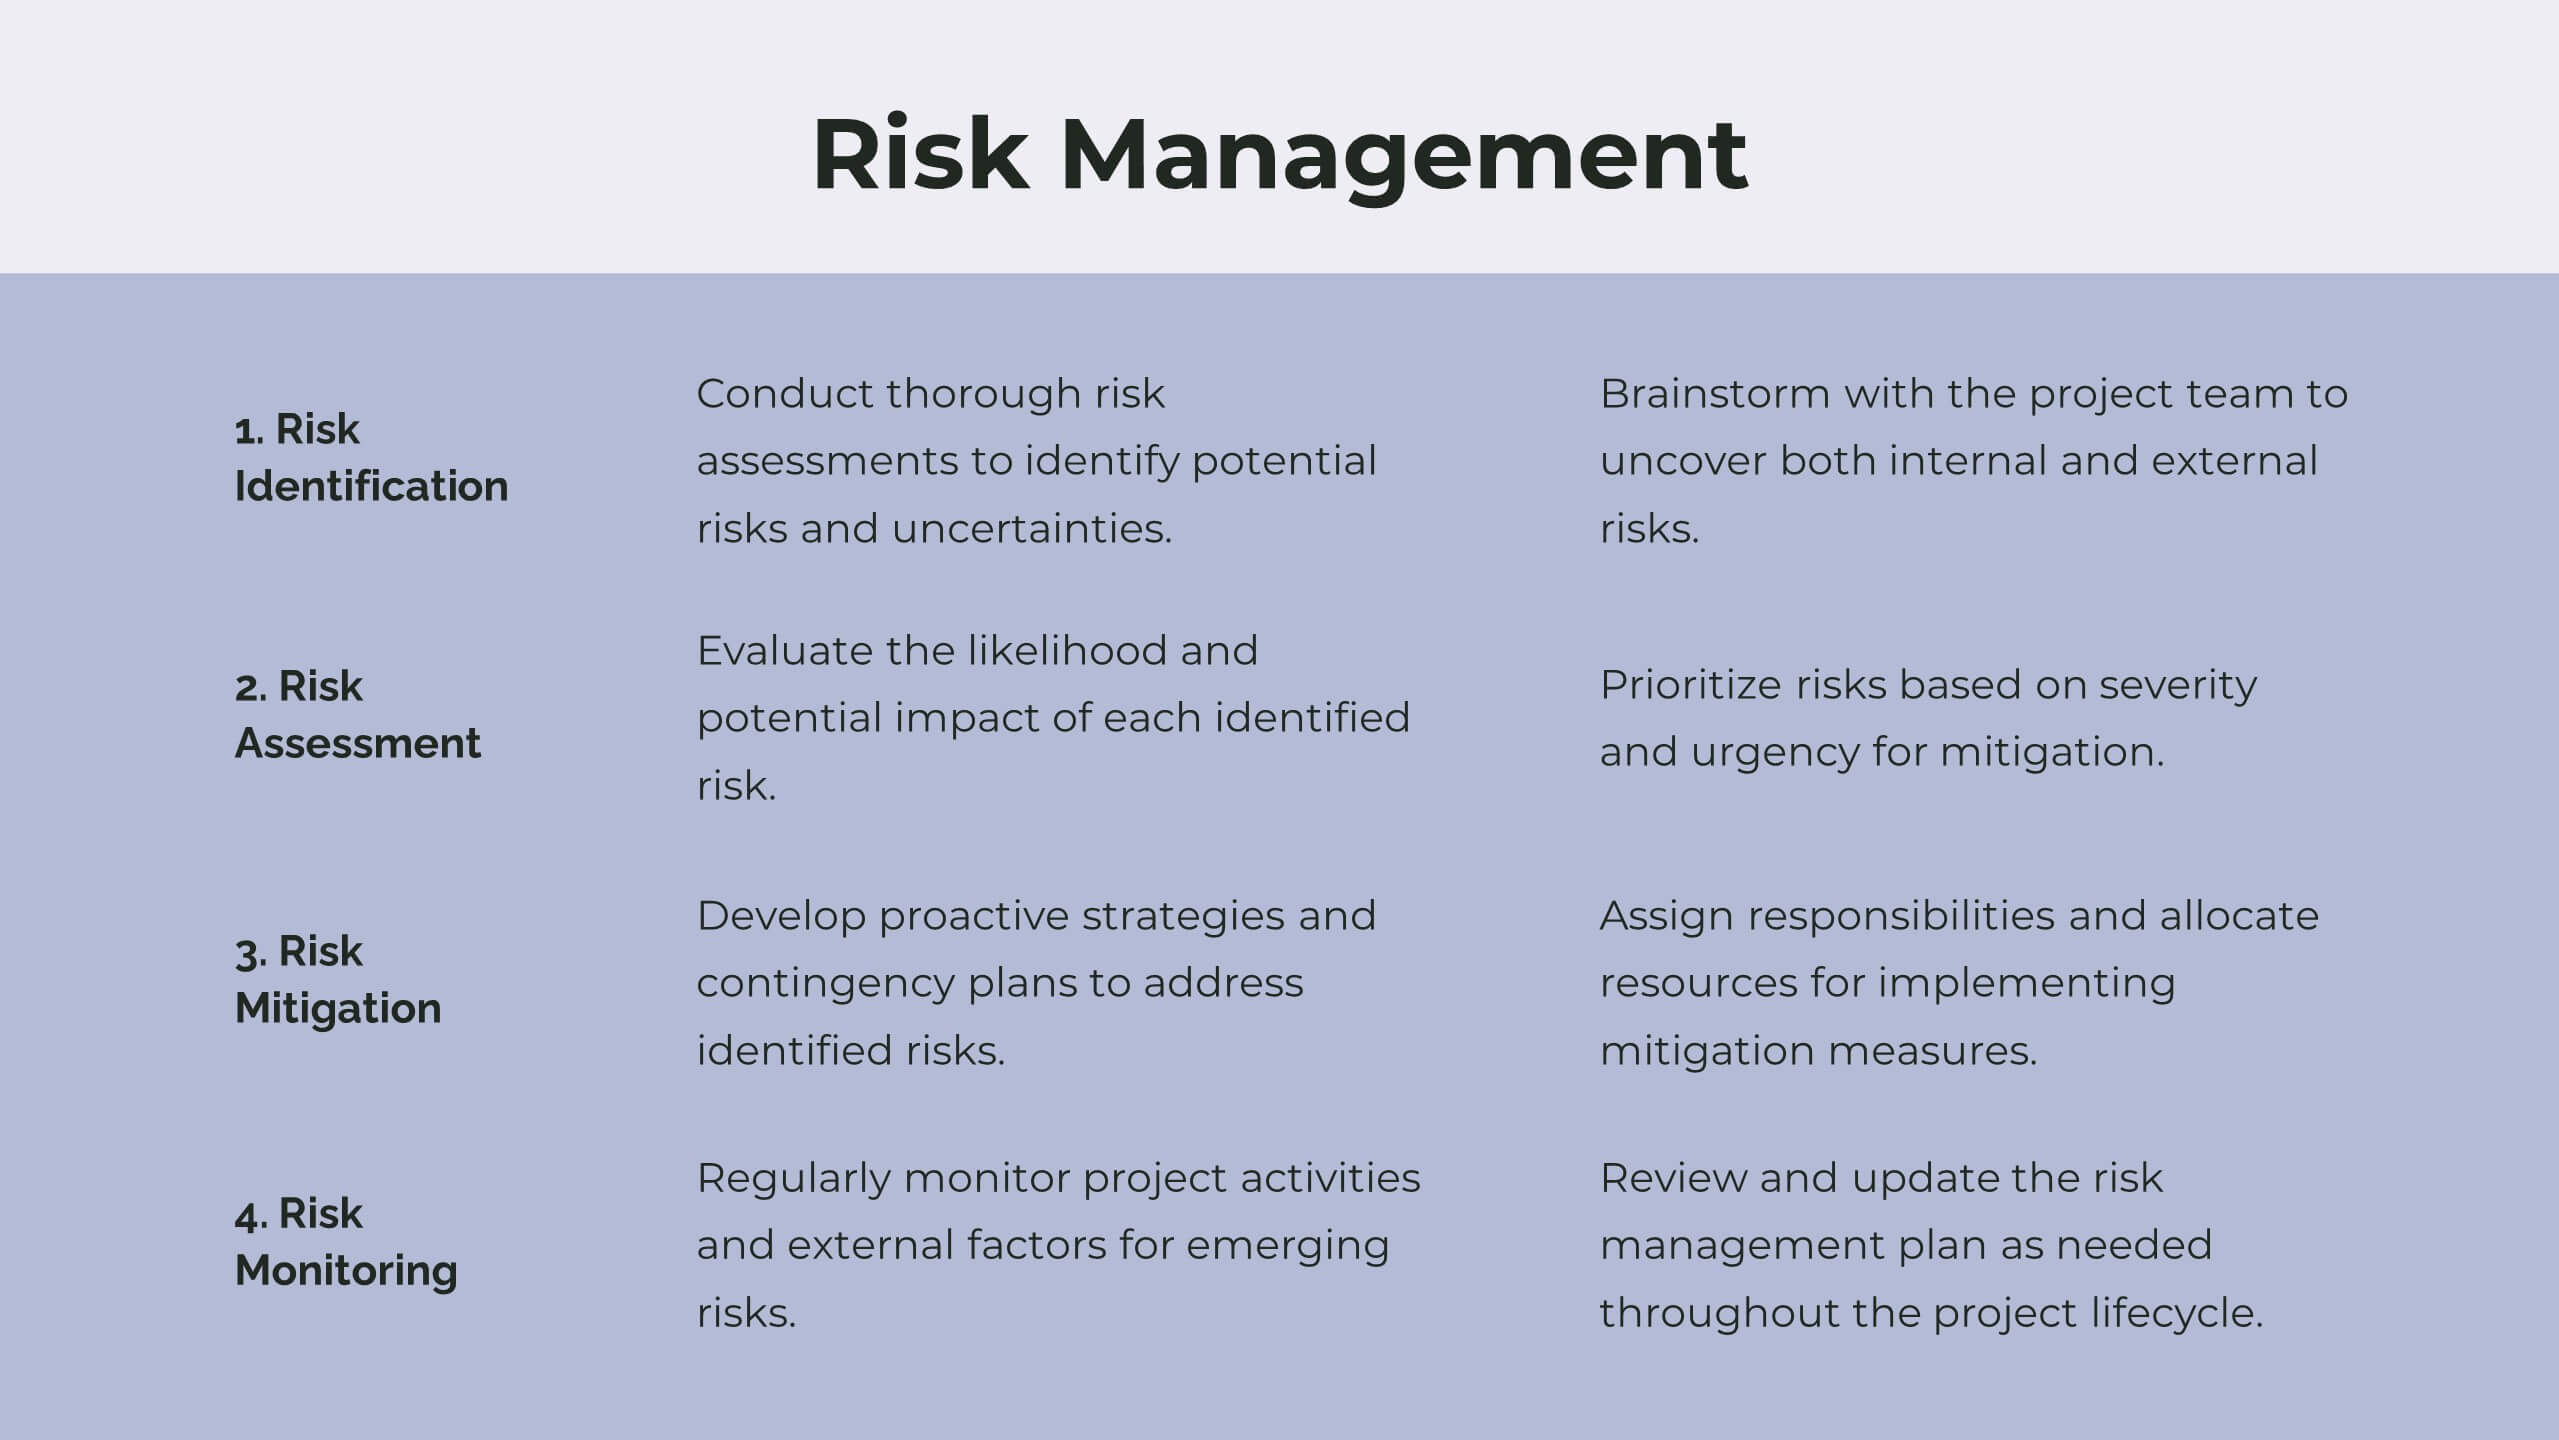
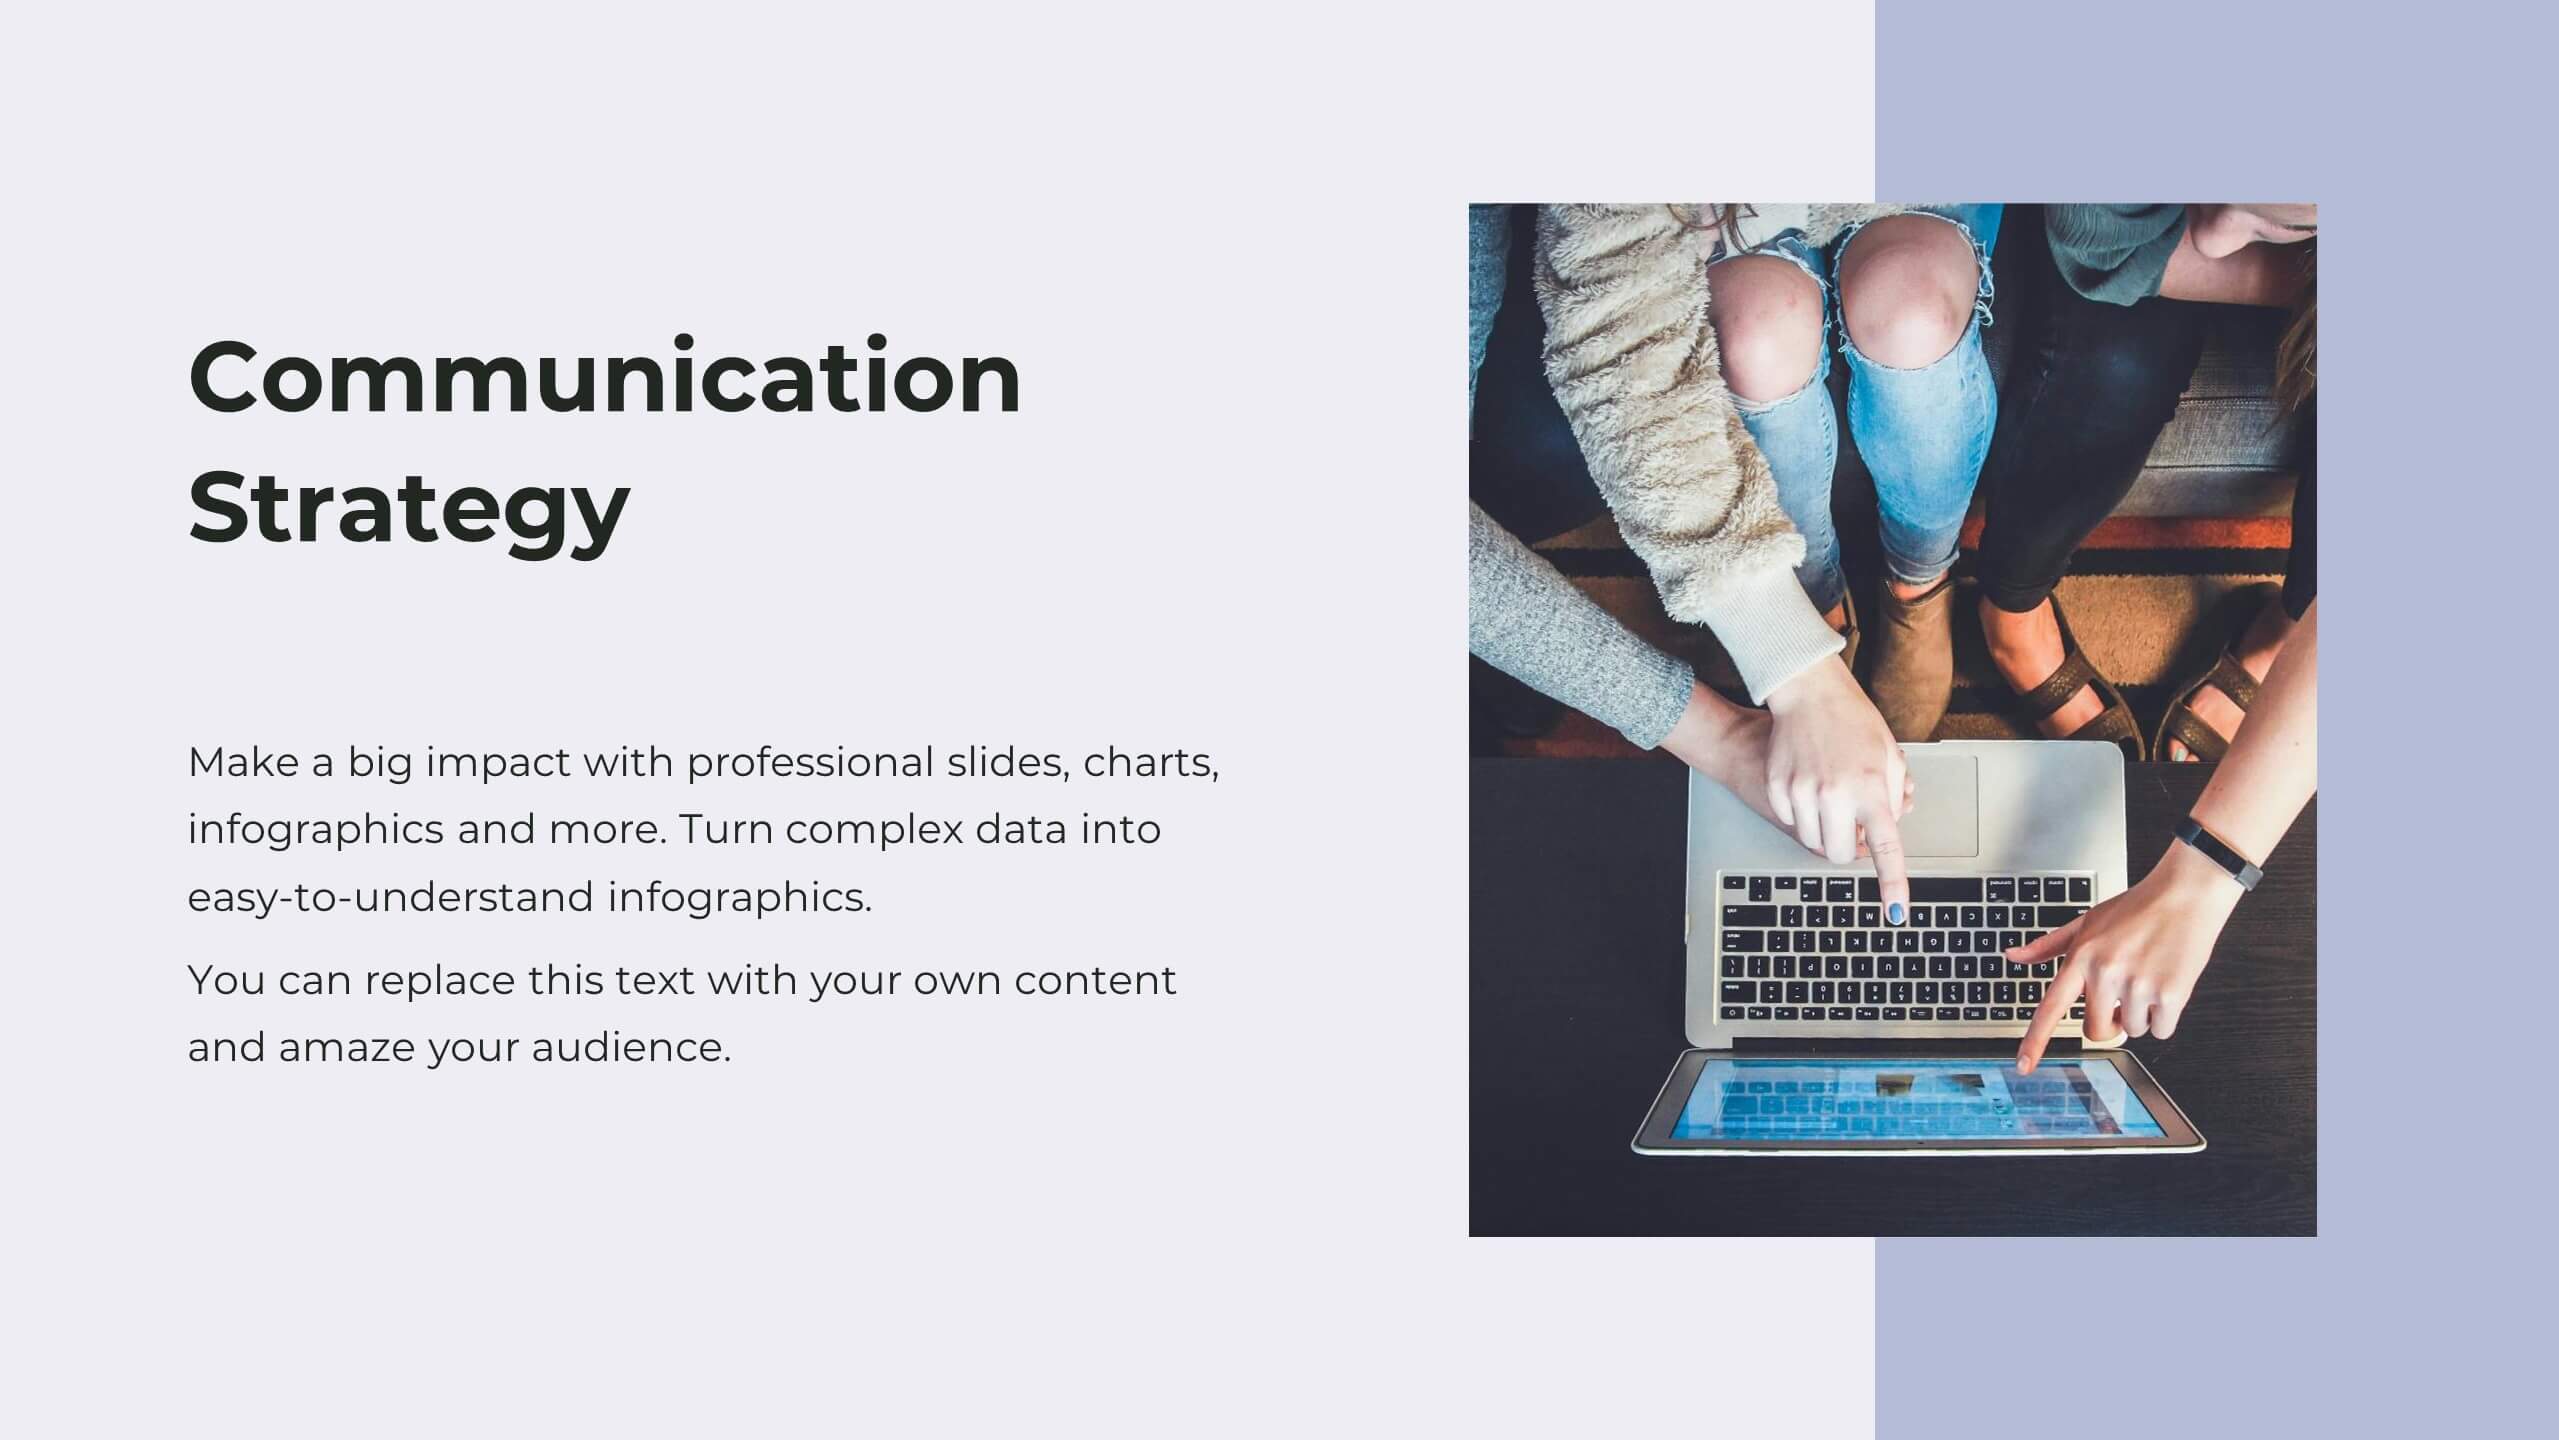

23 diapositivas
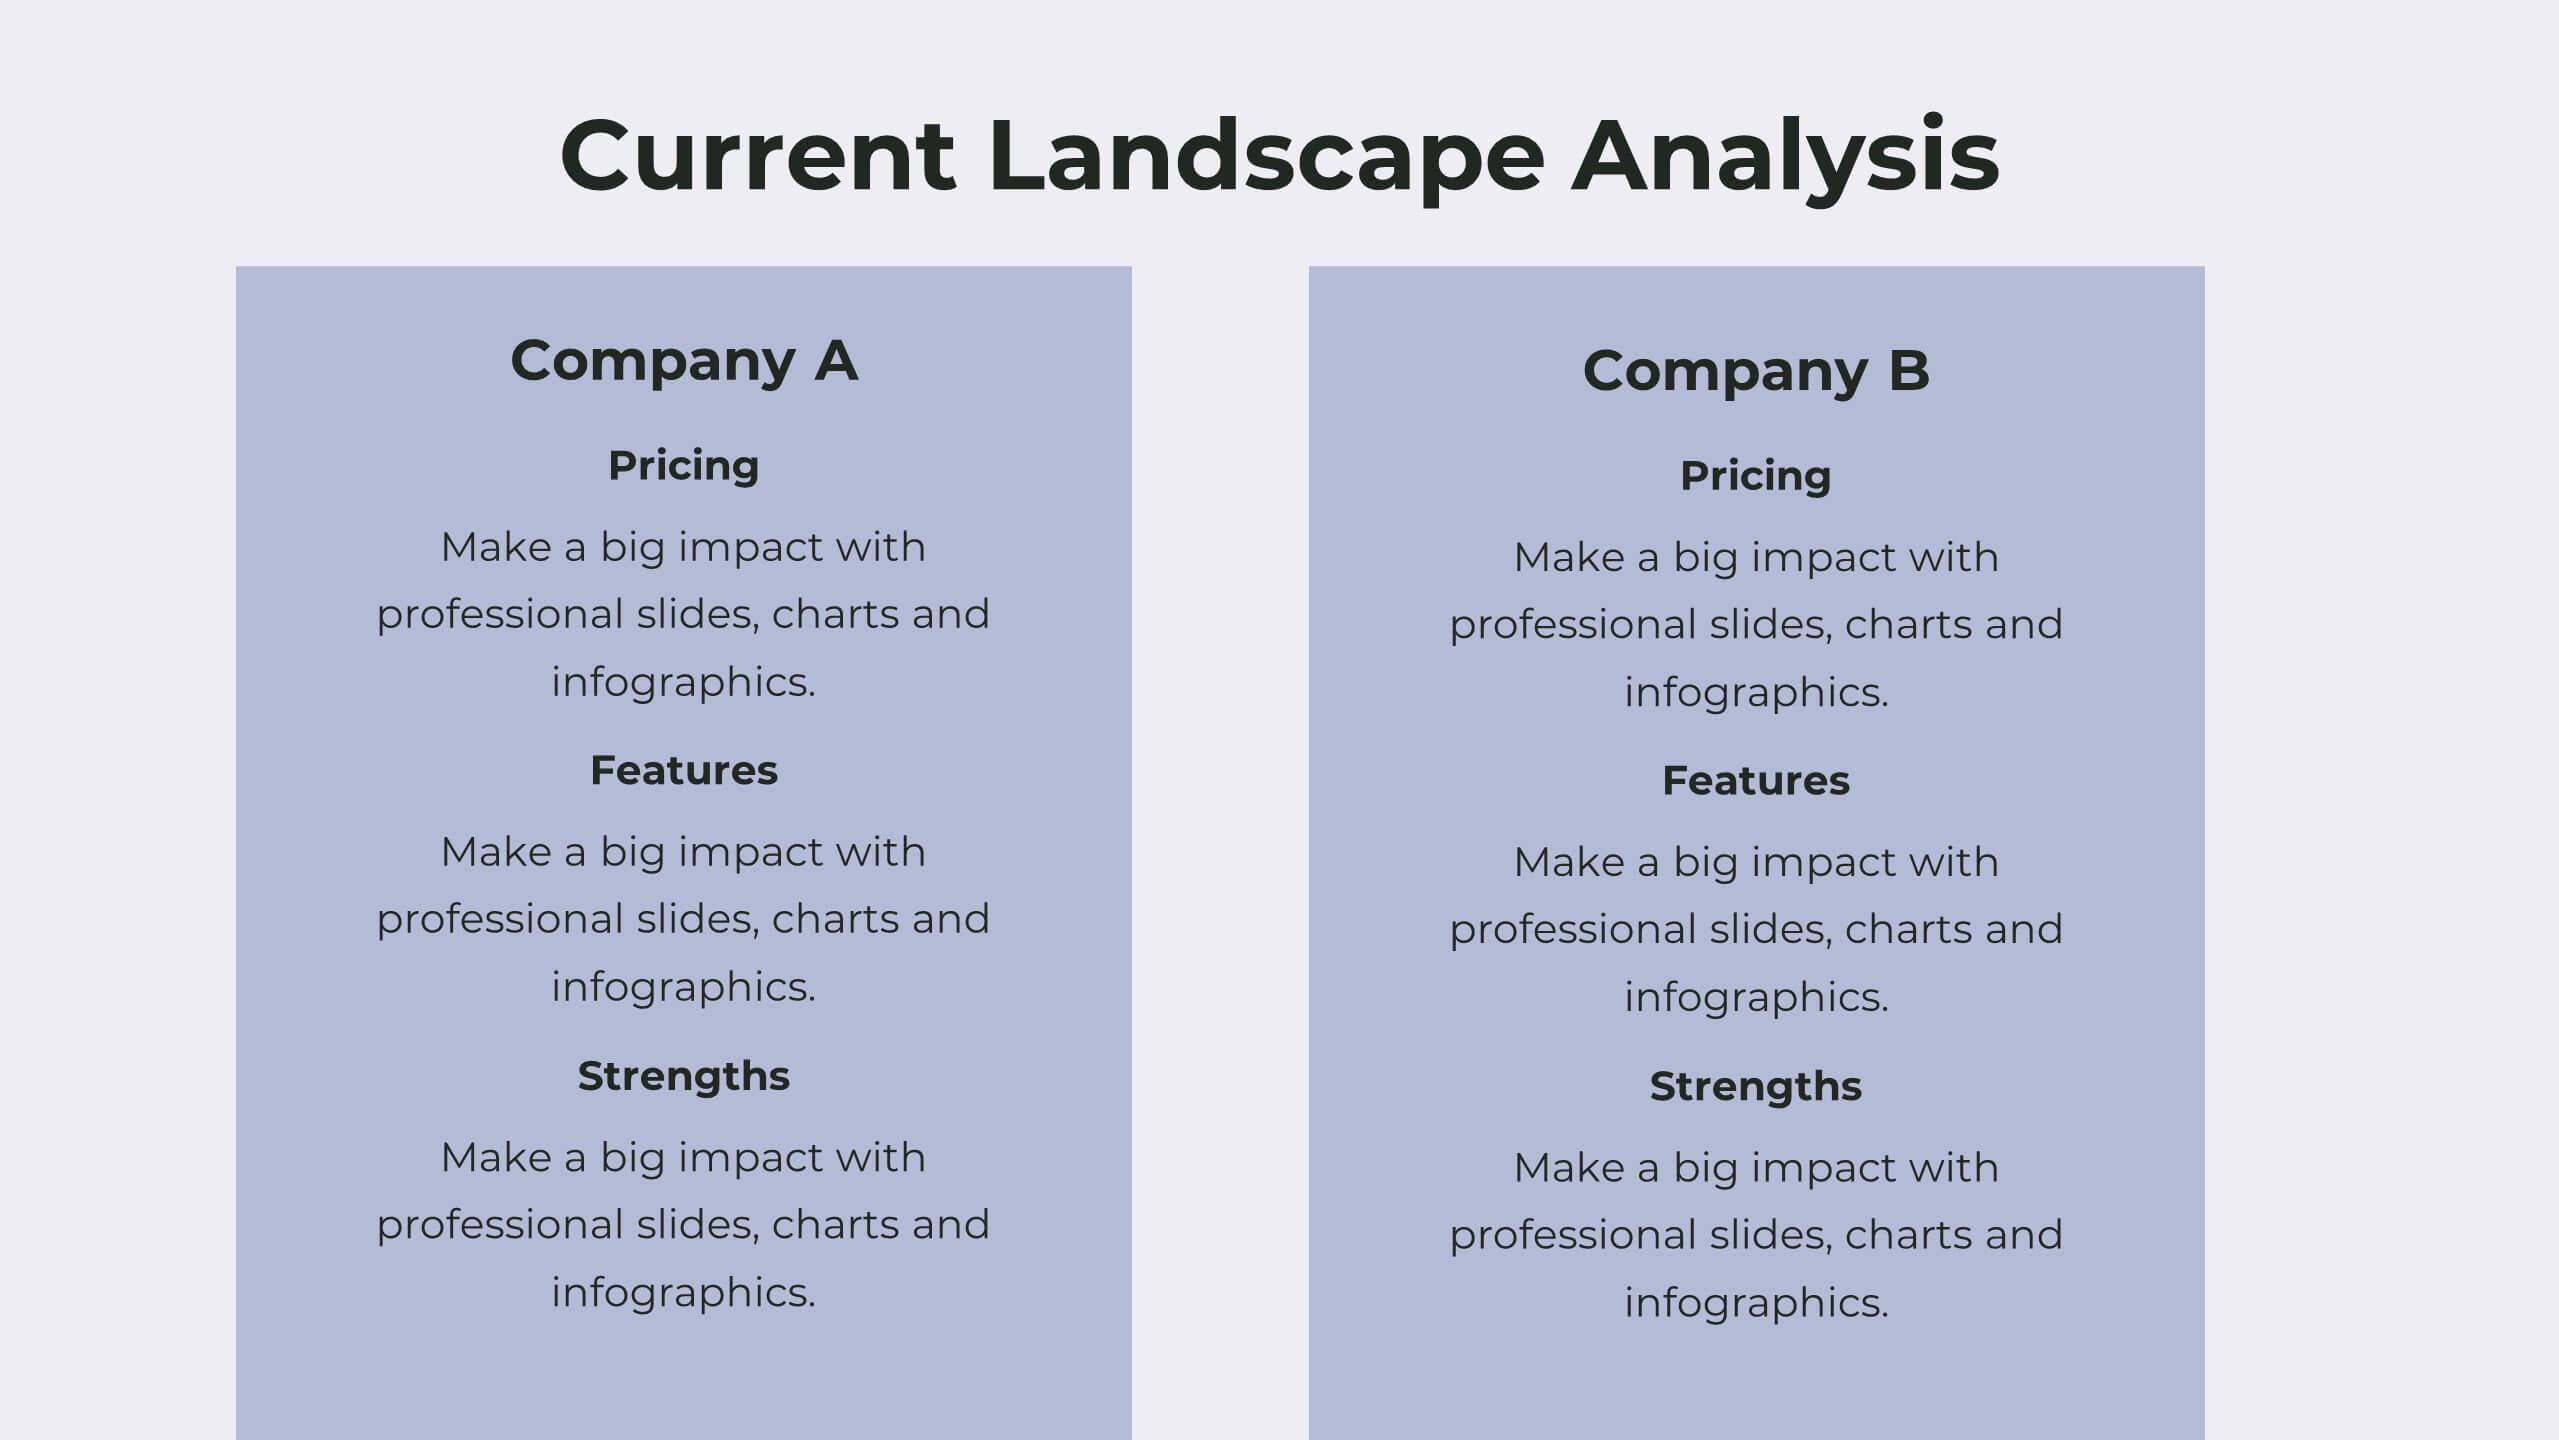
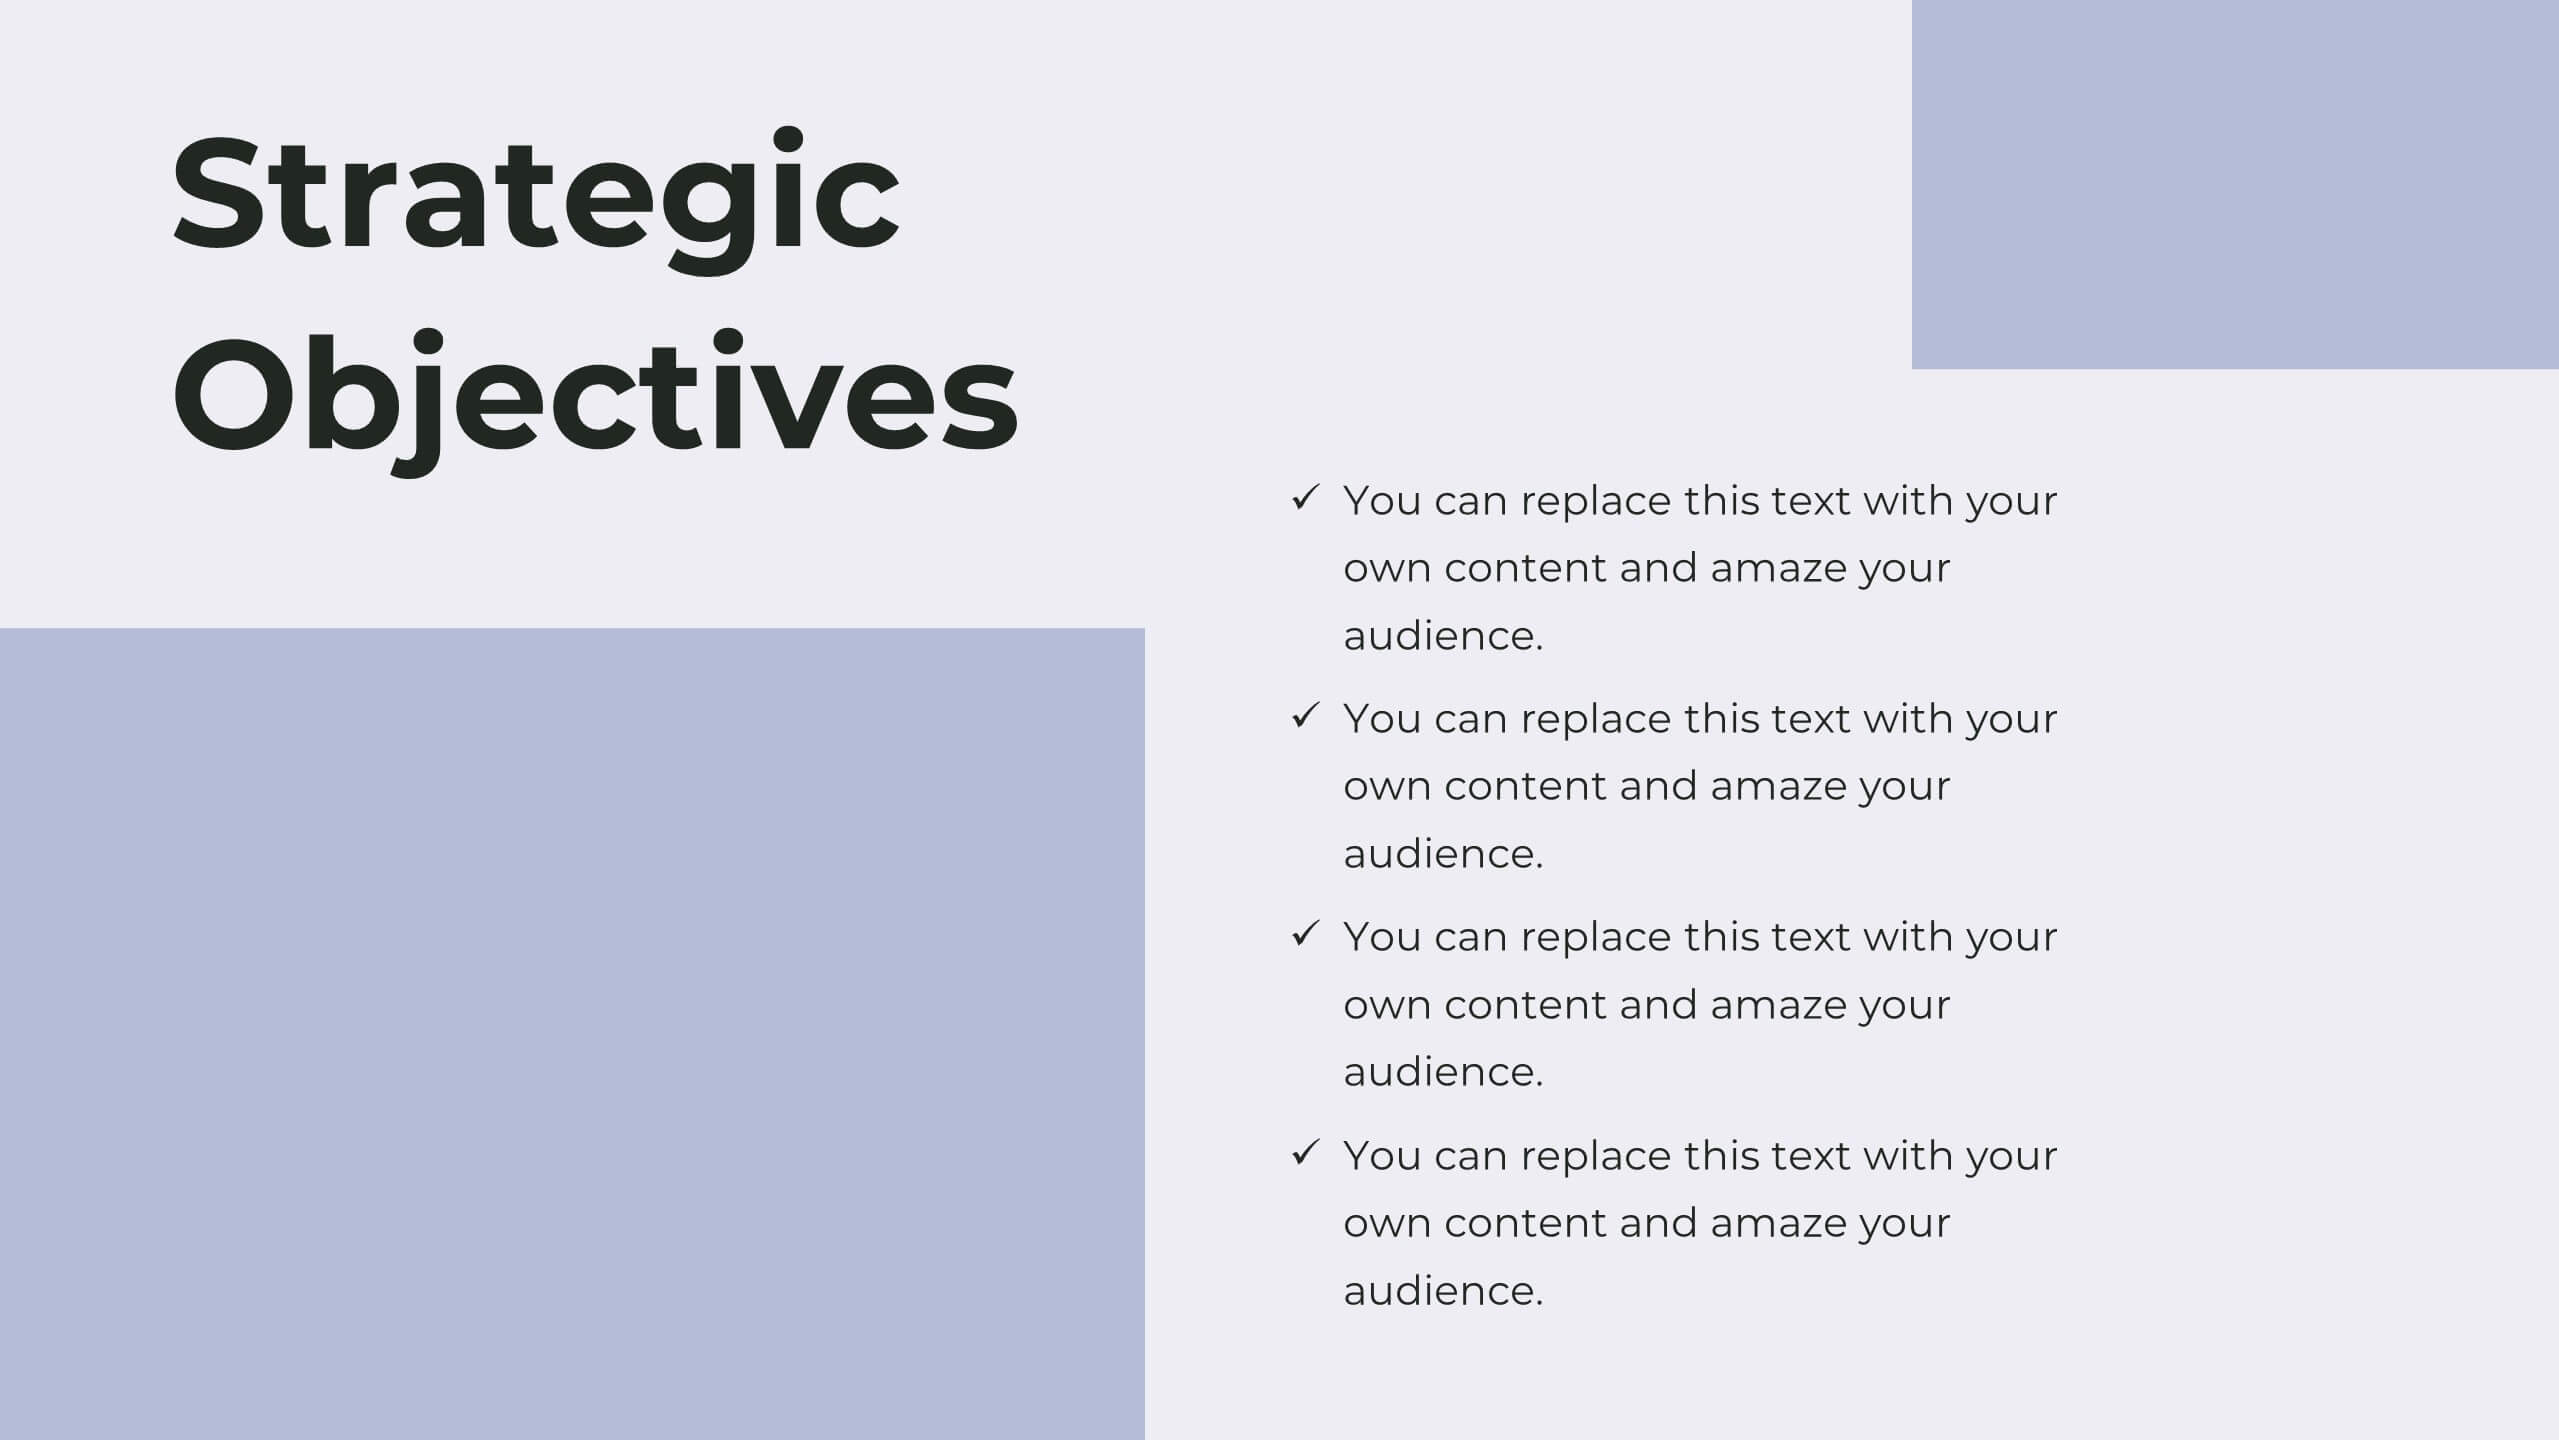
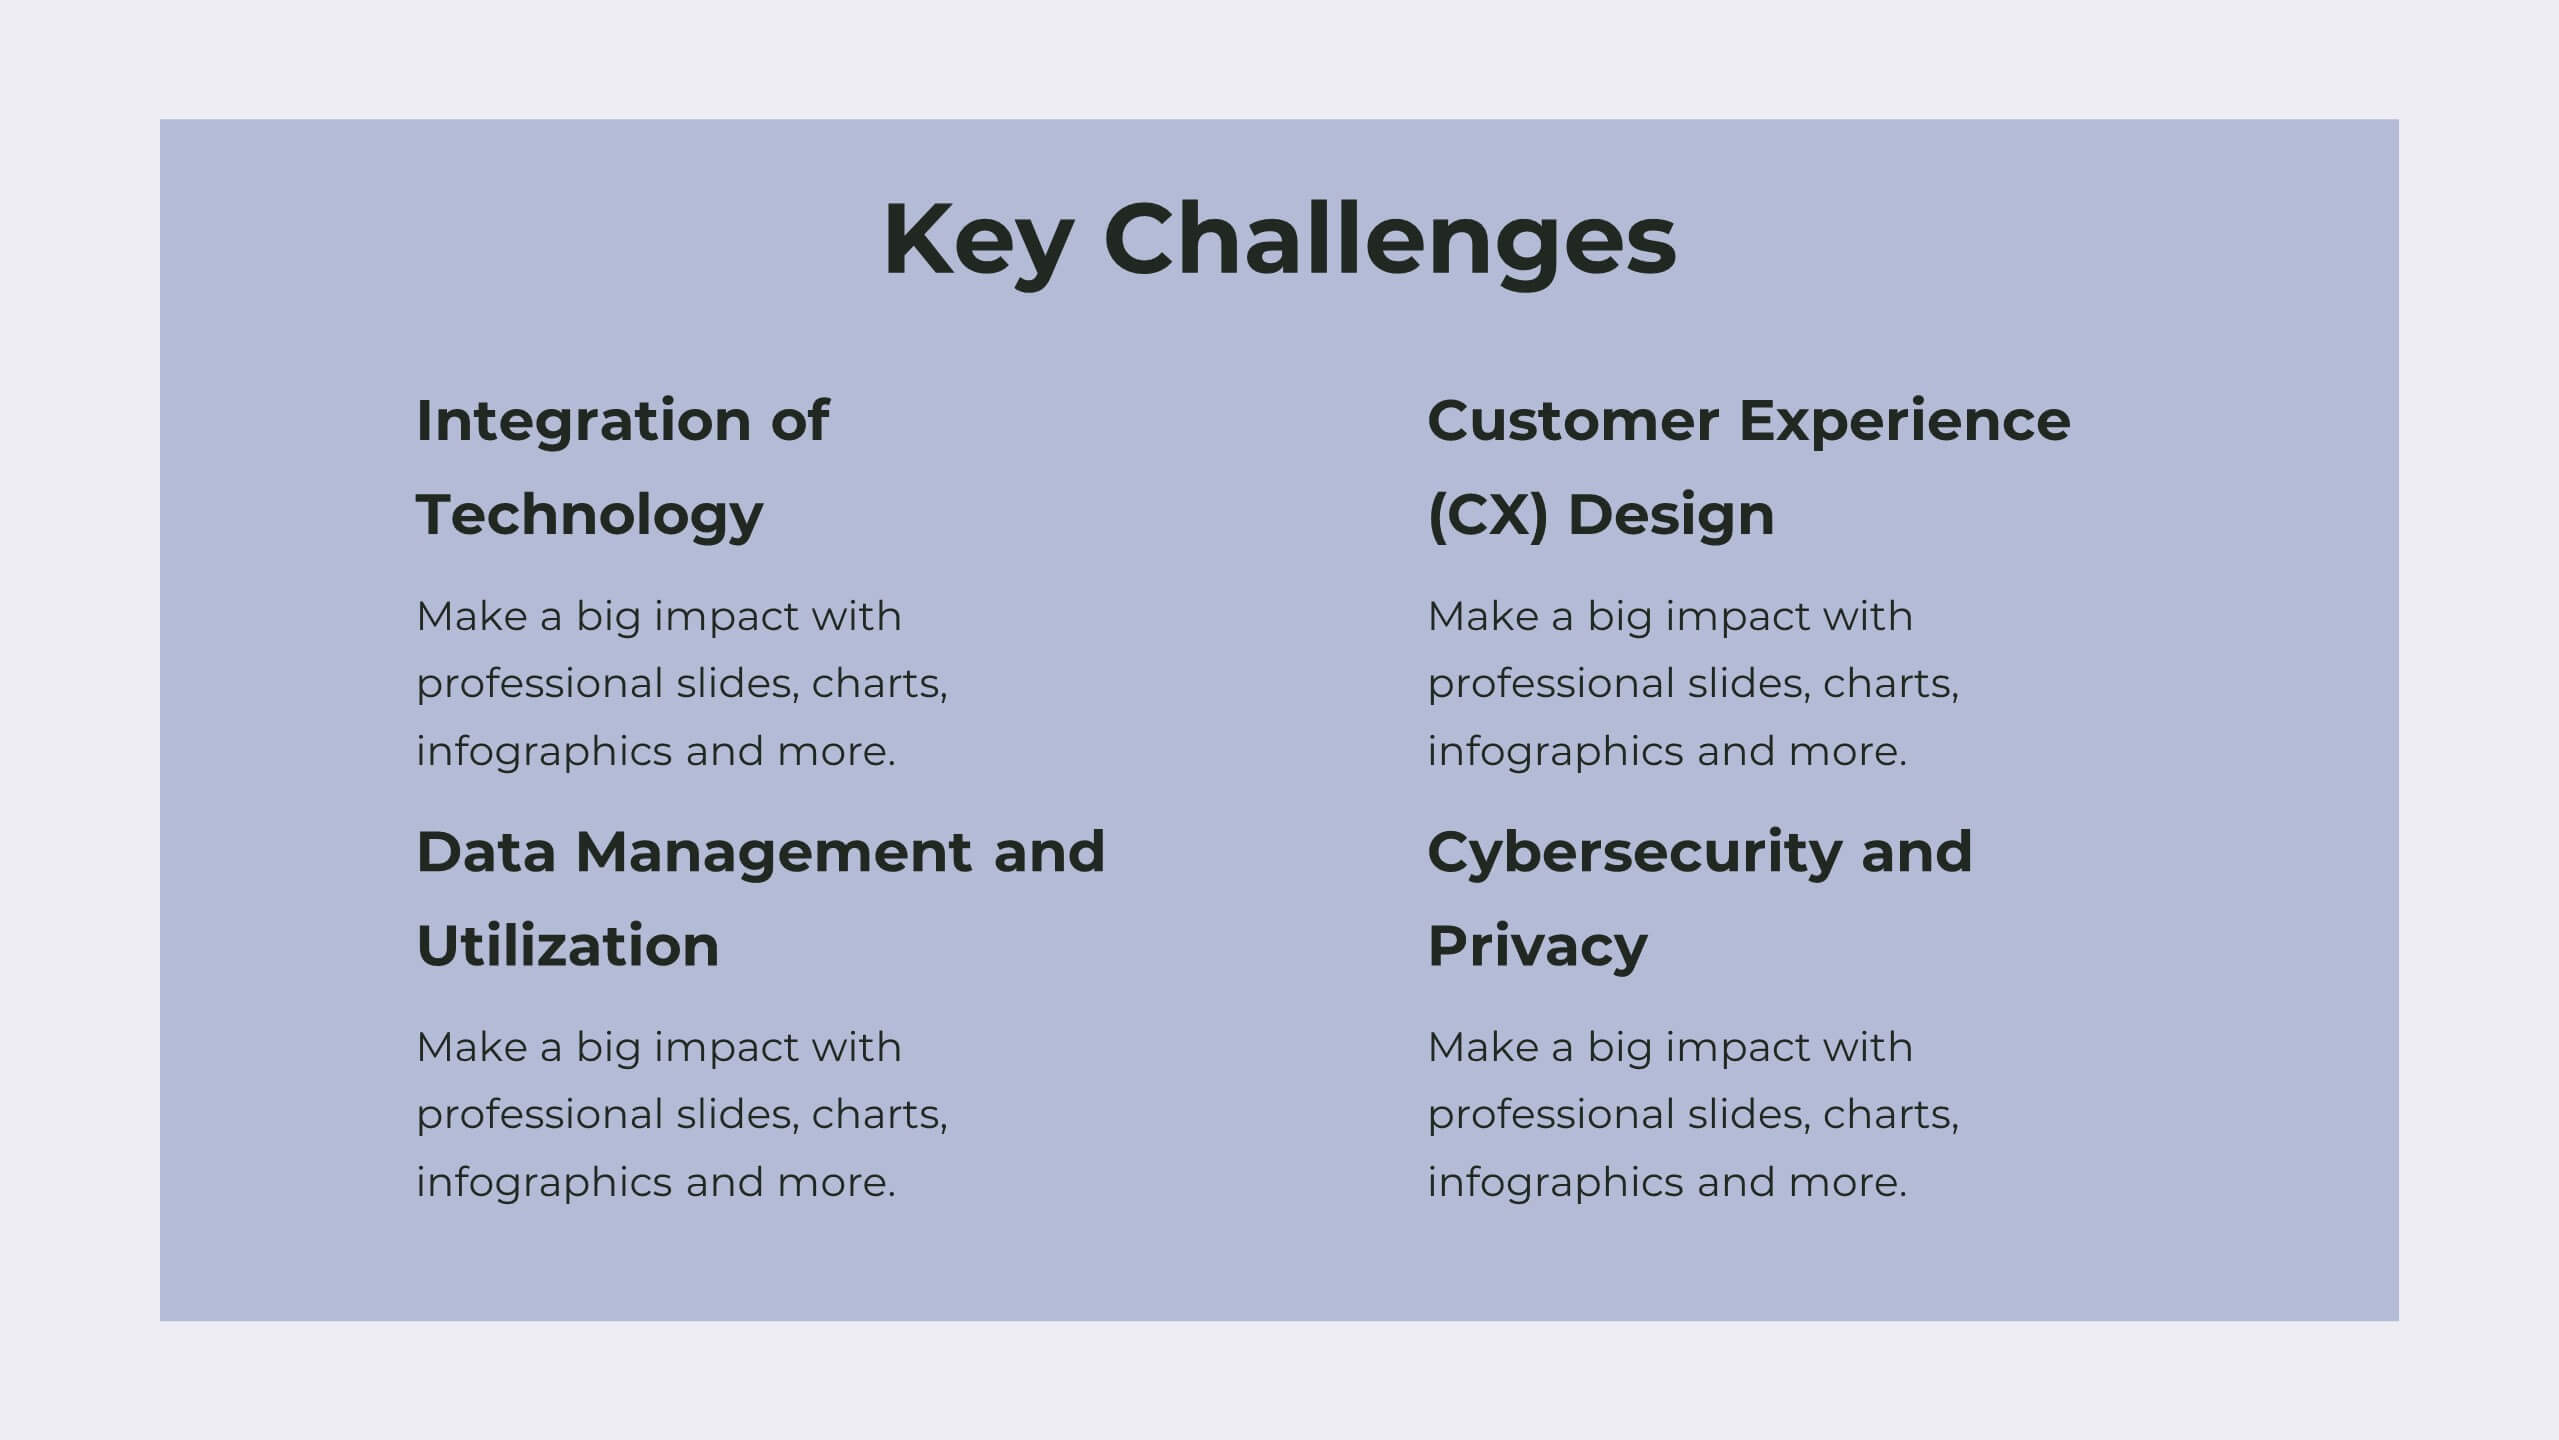
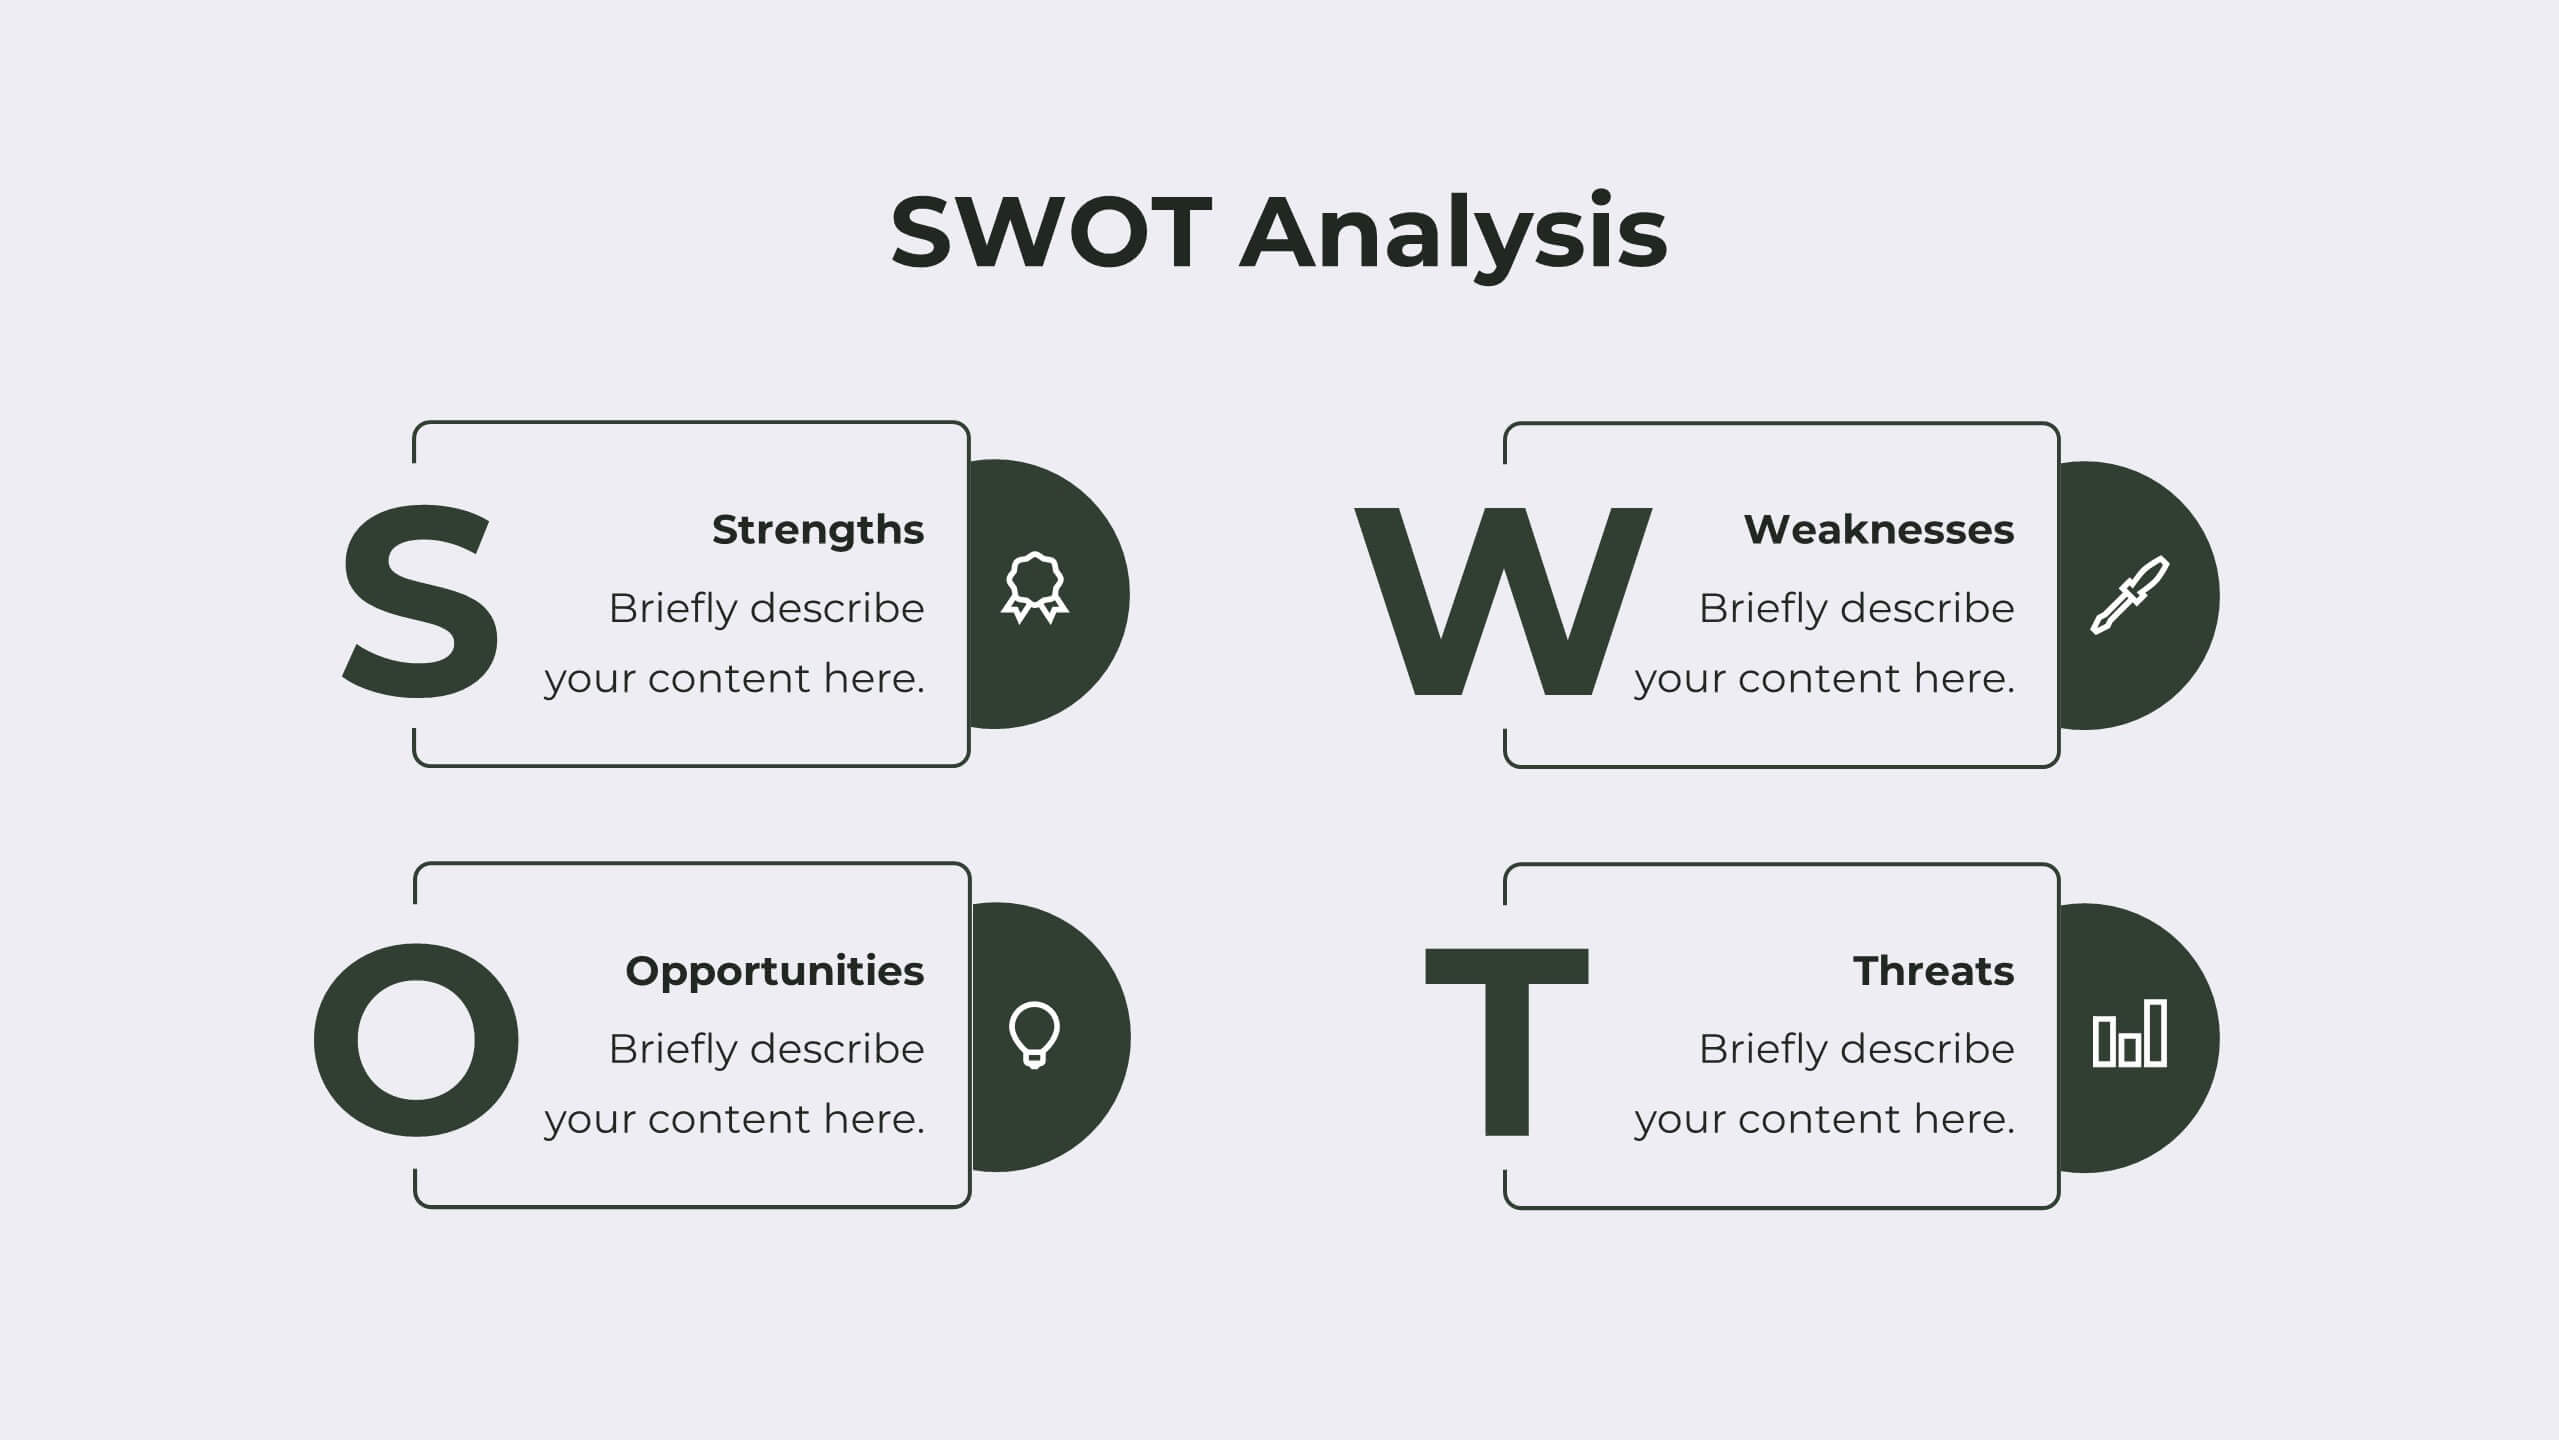
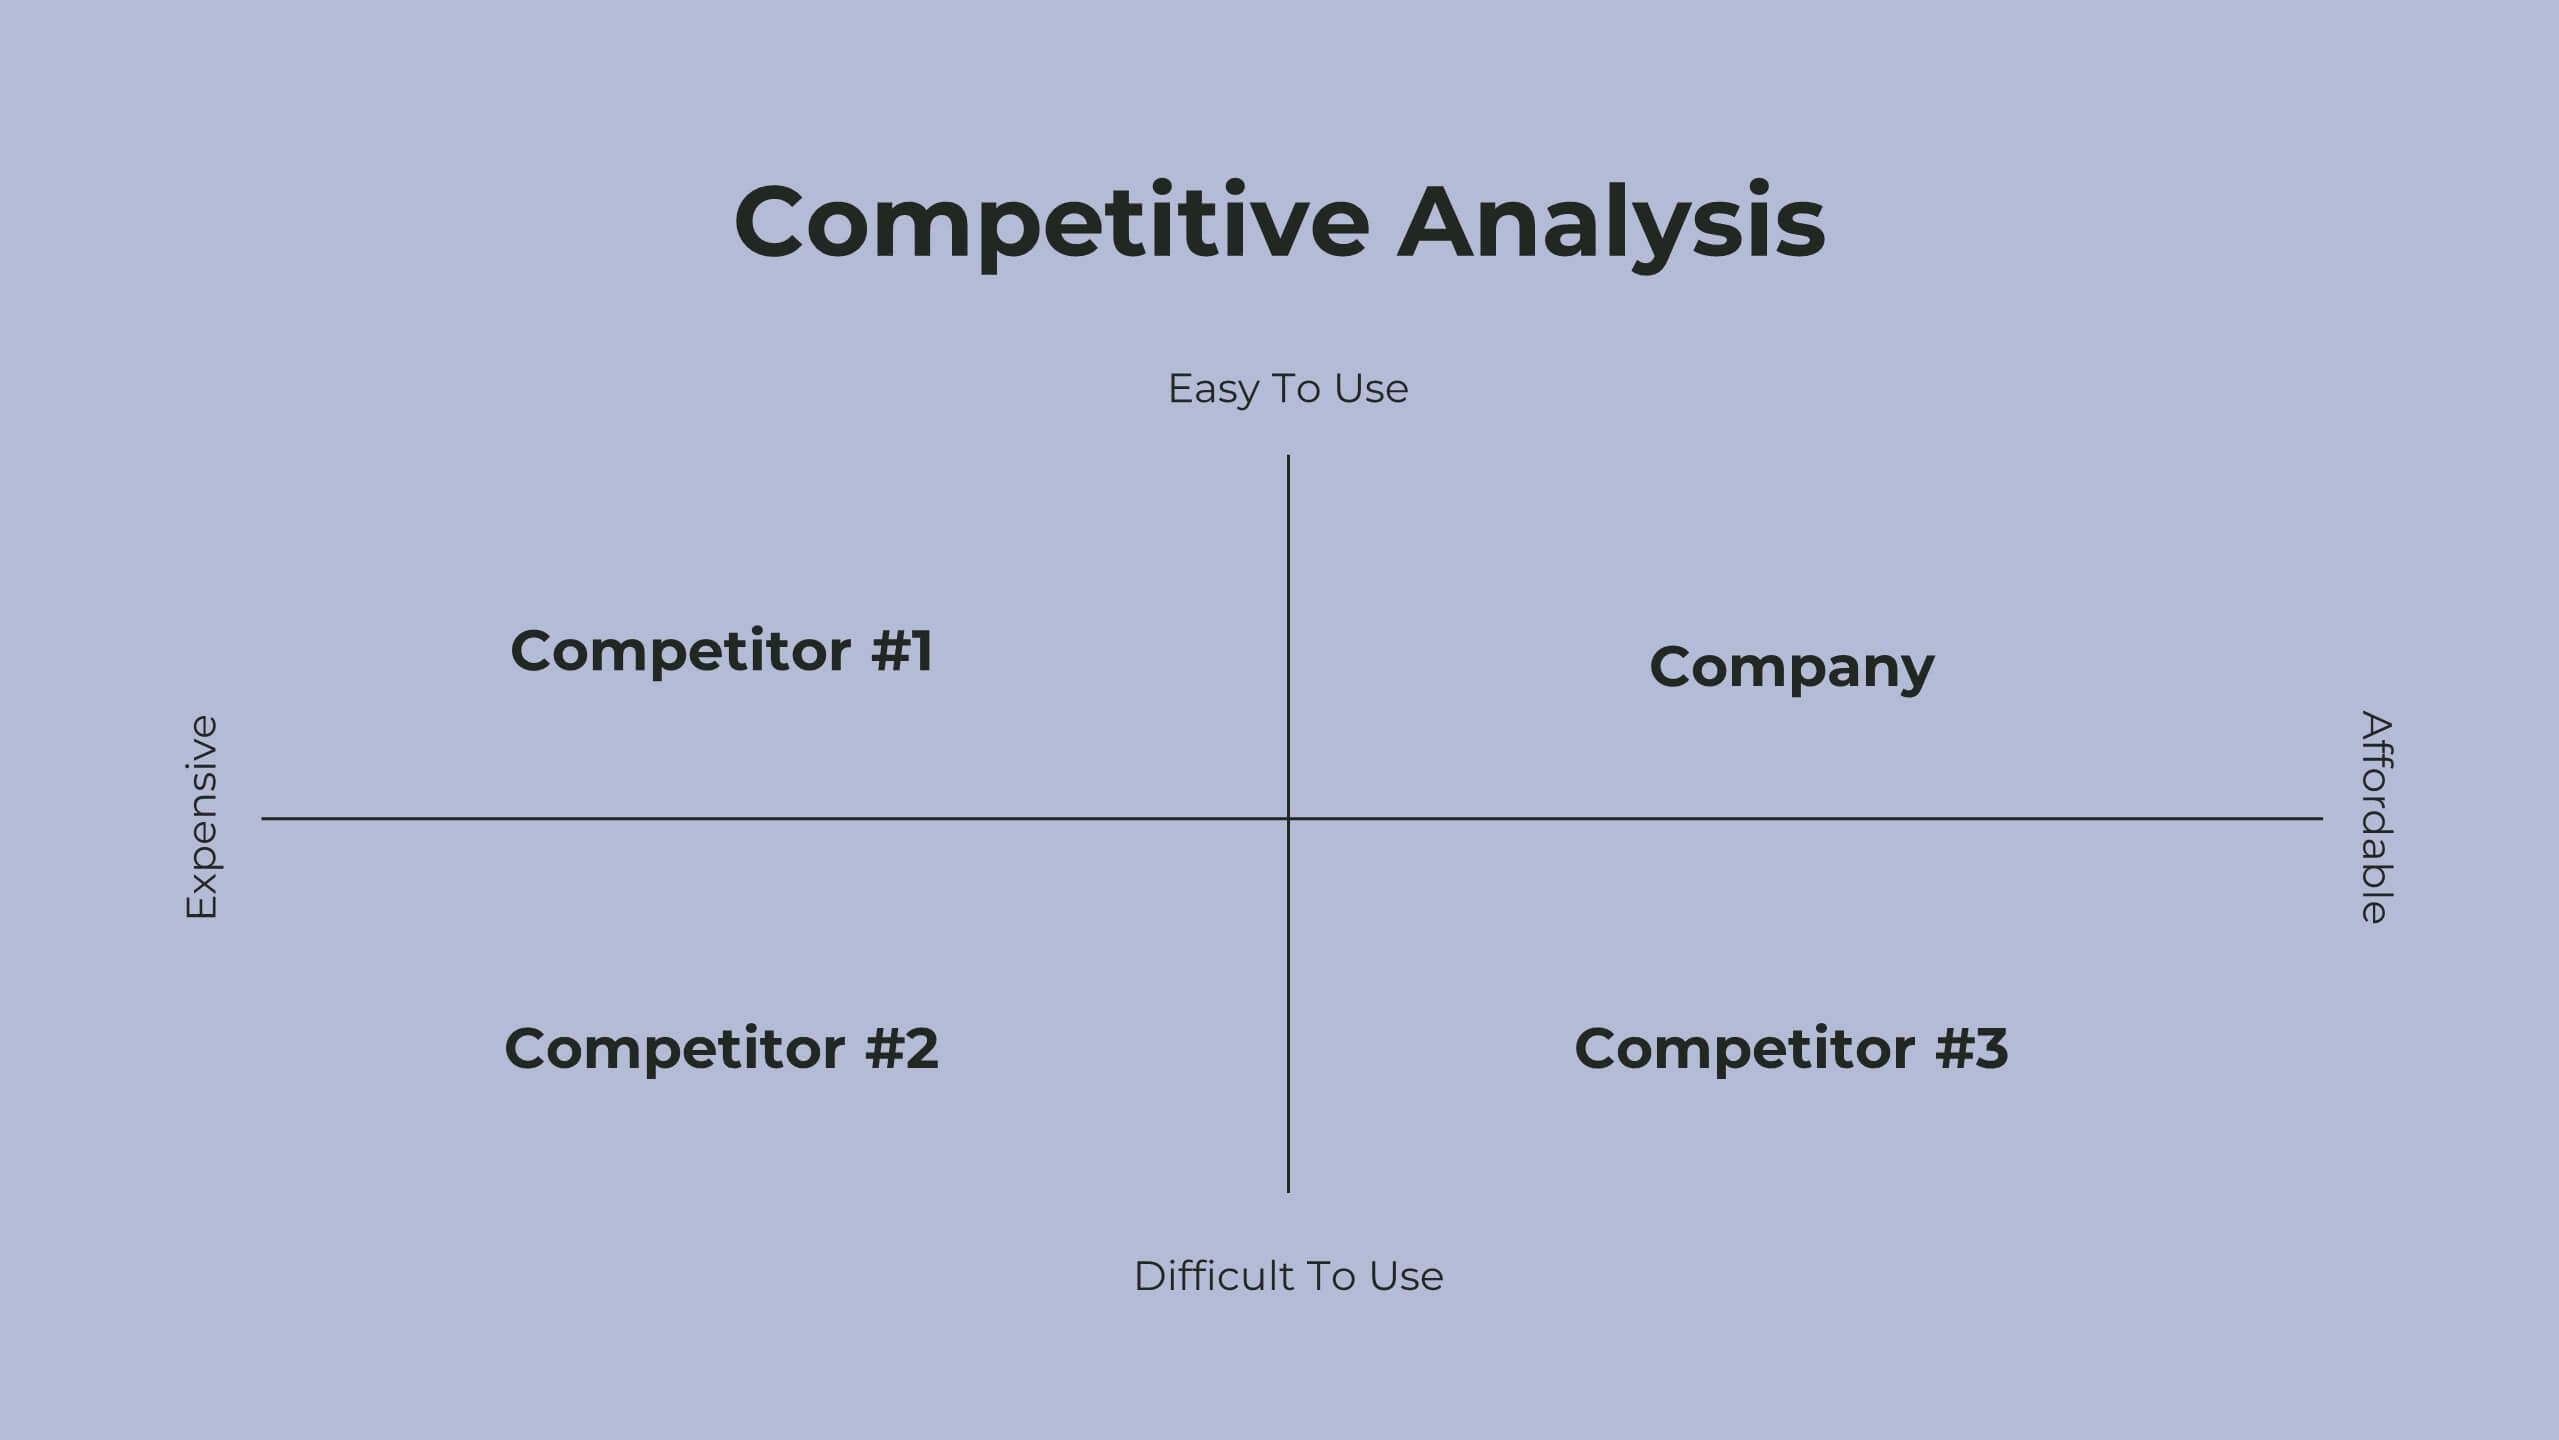
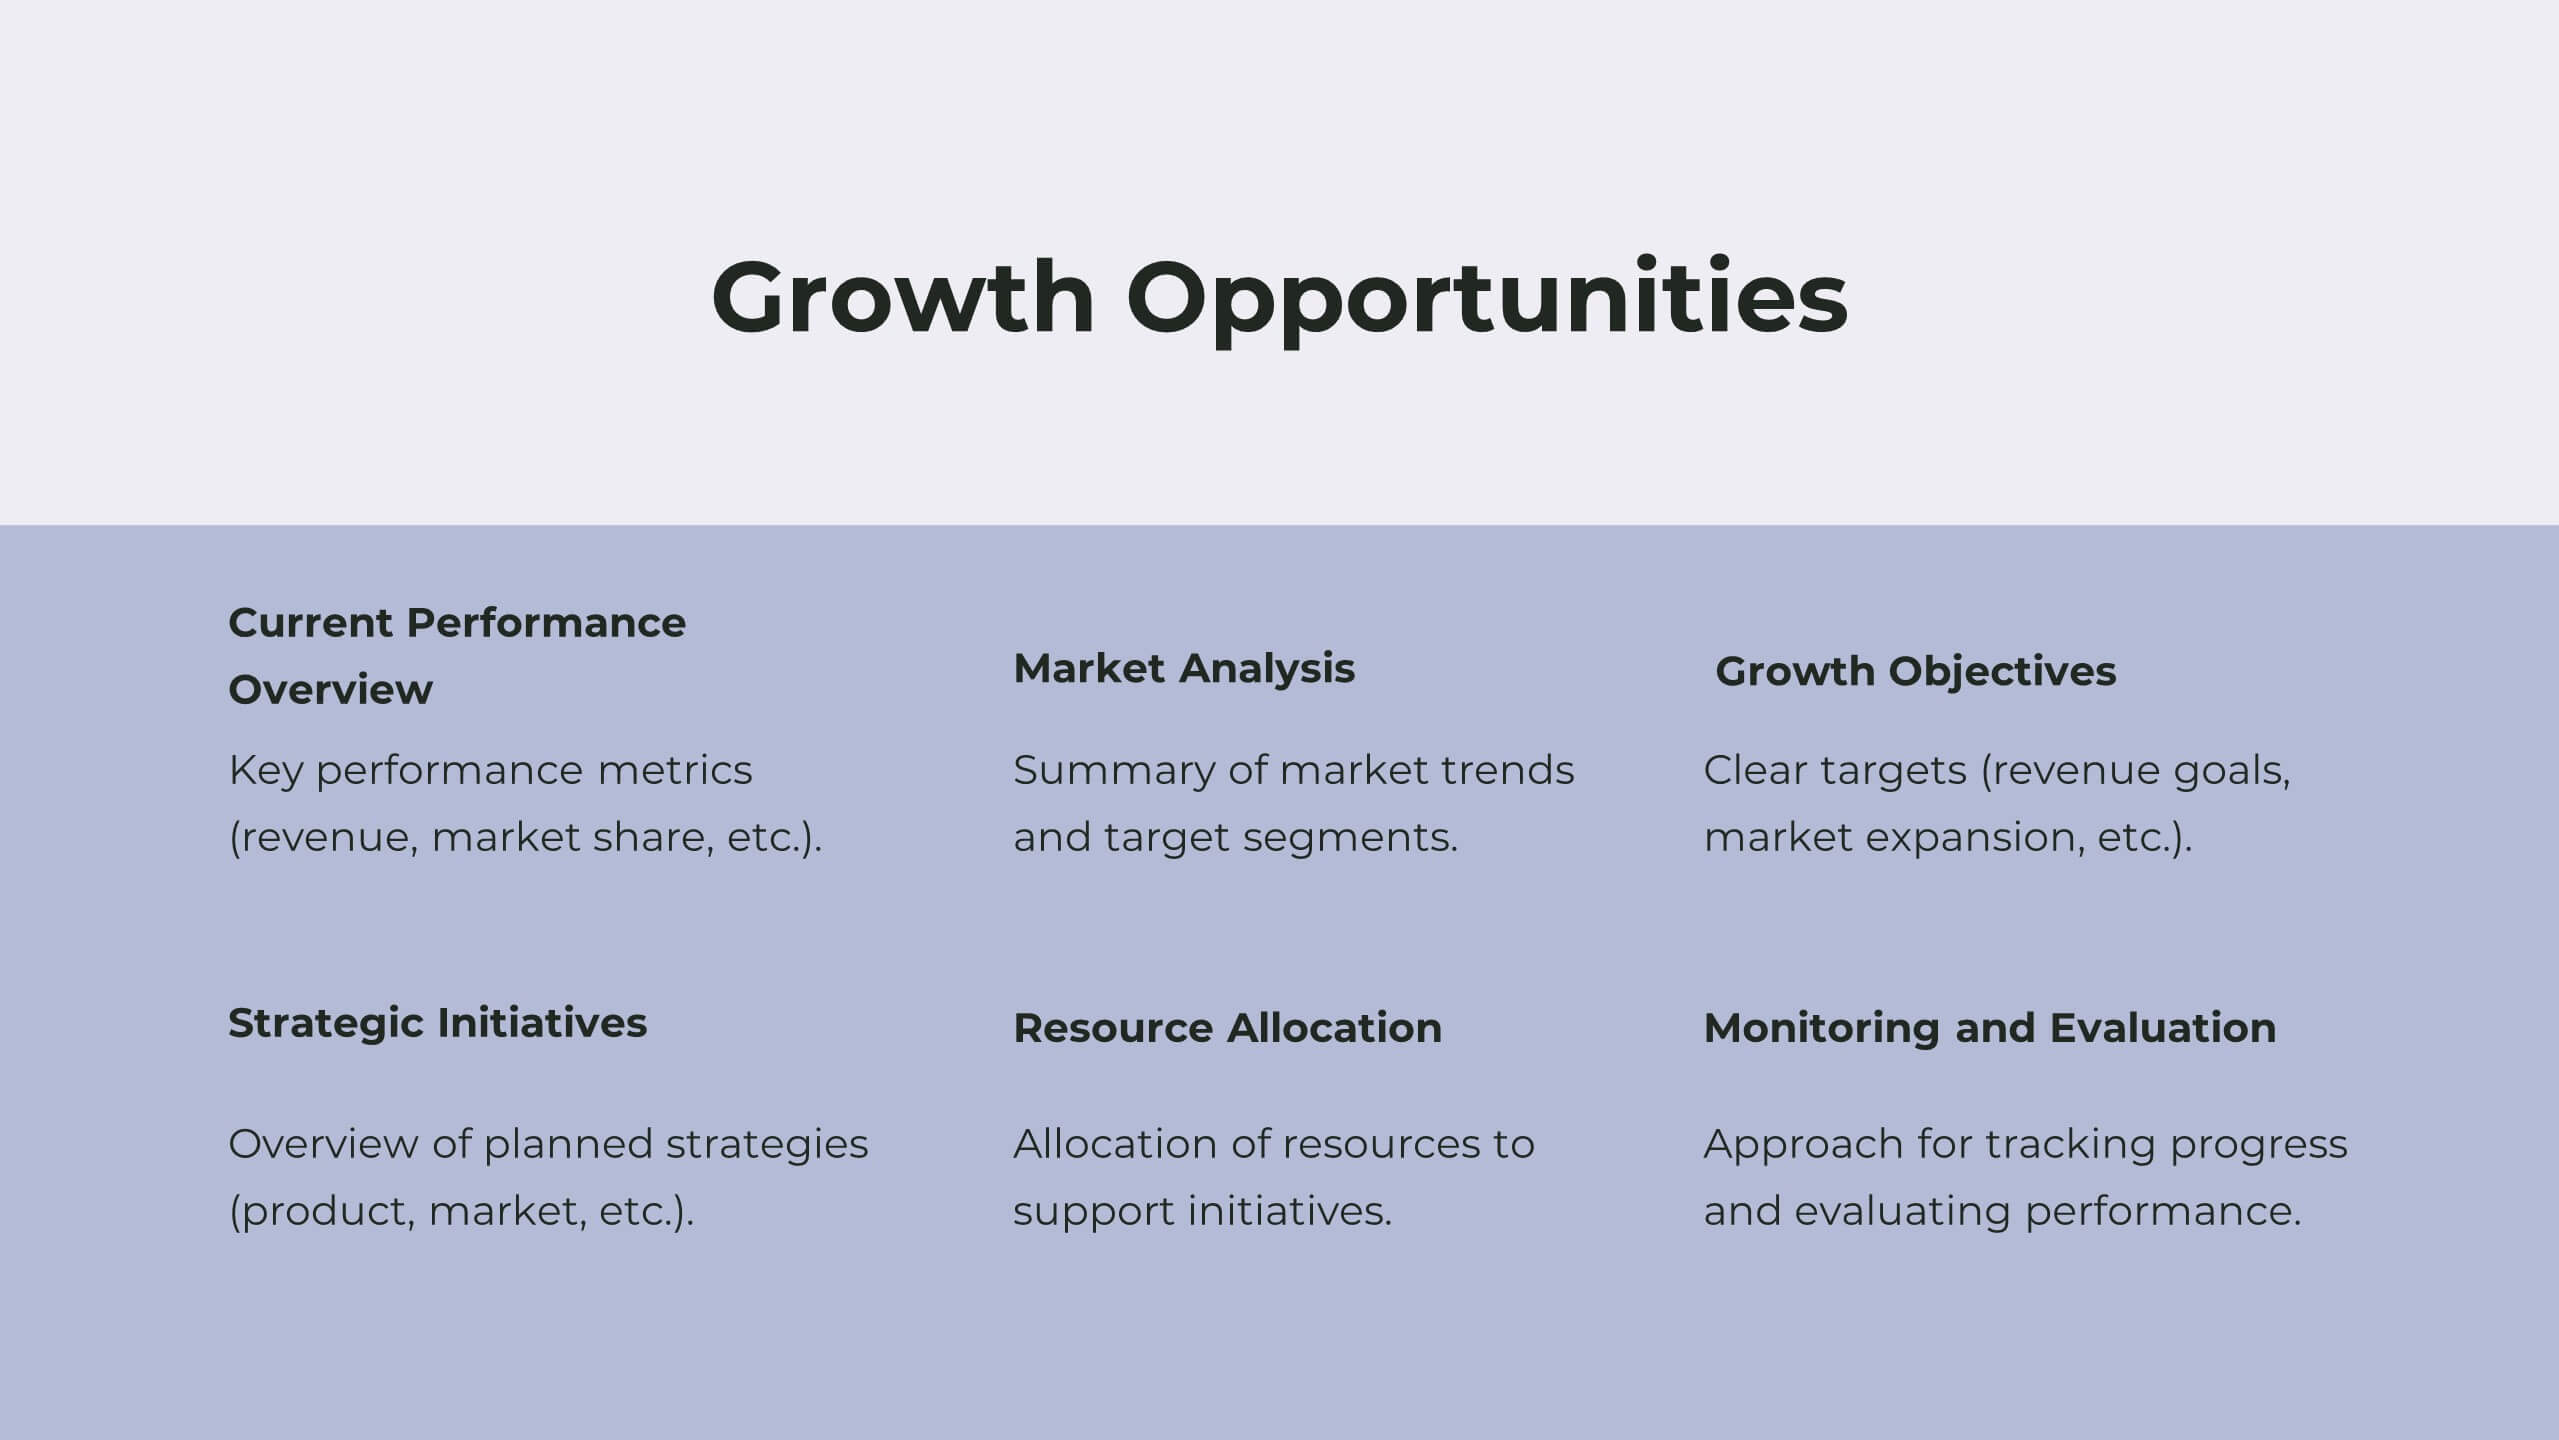
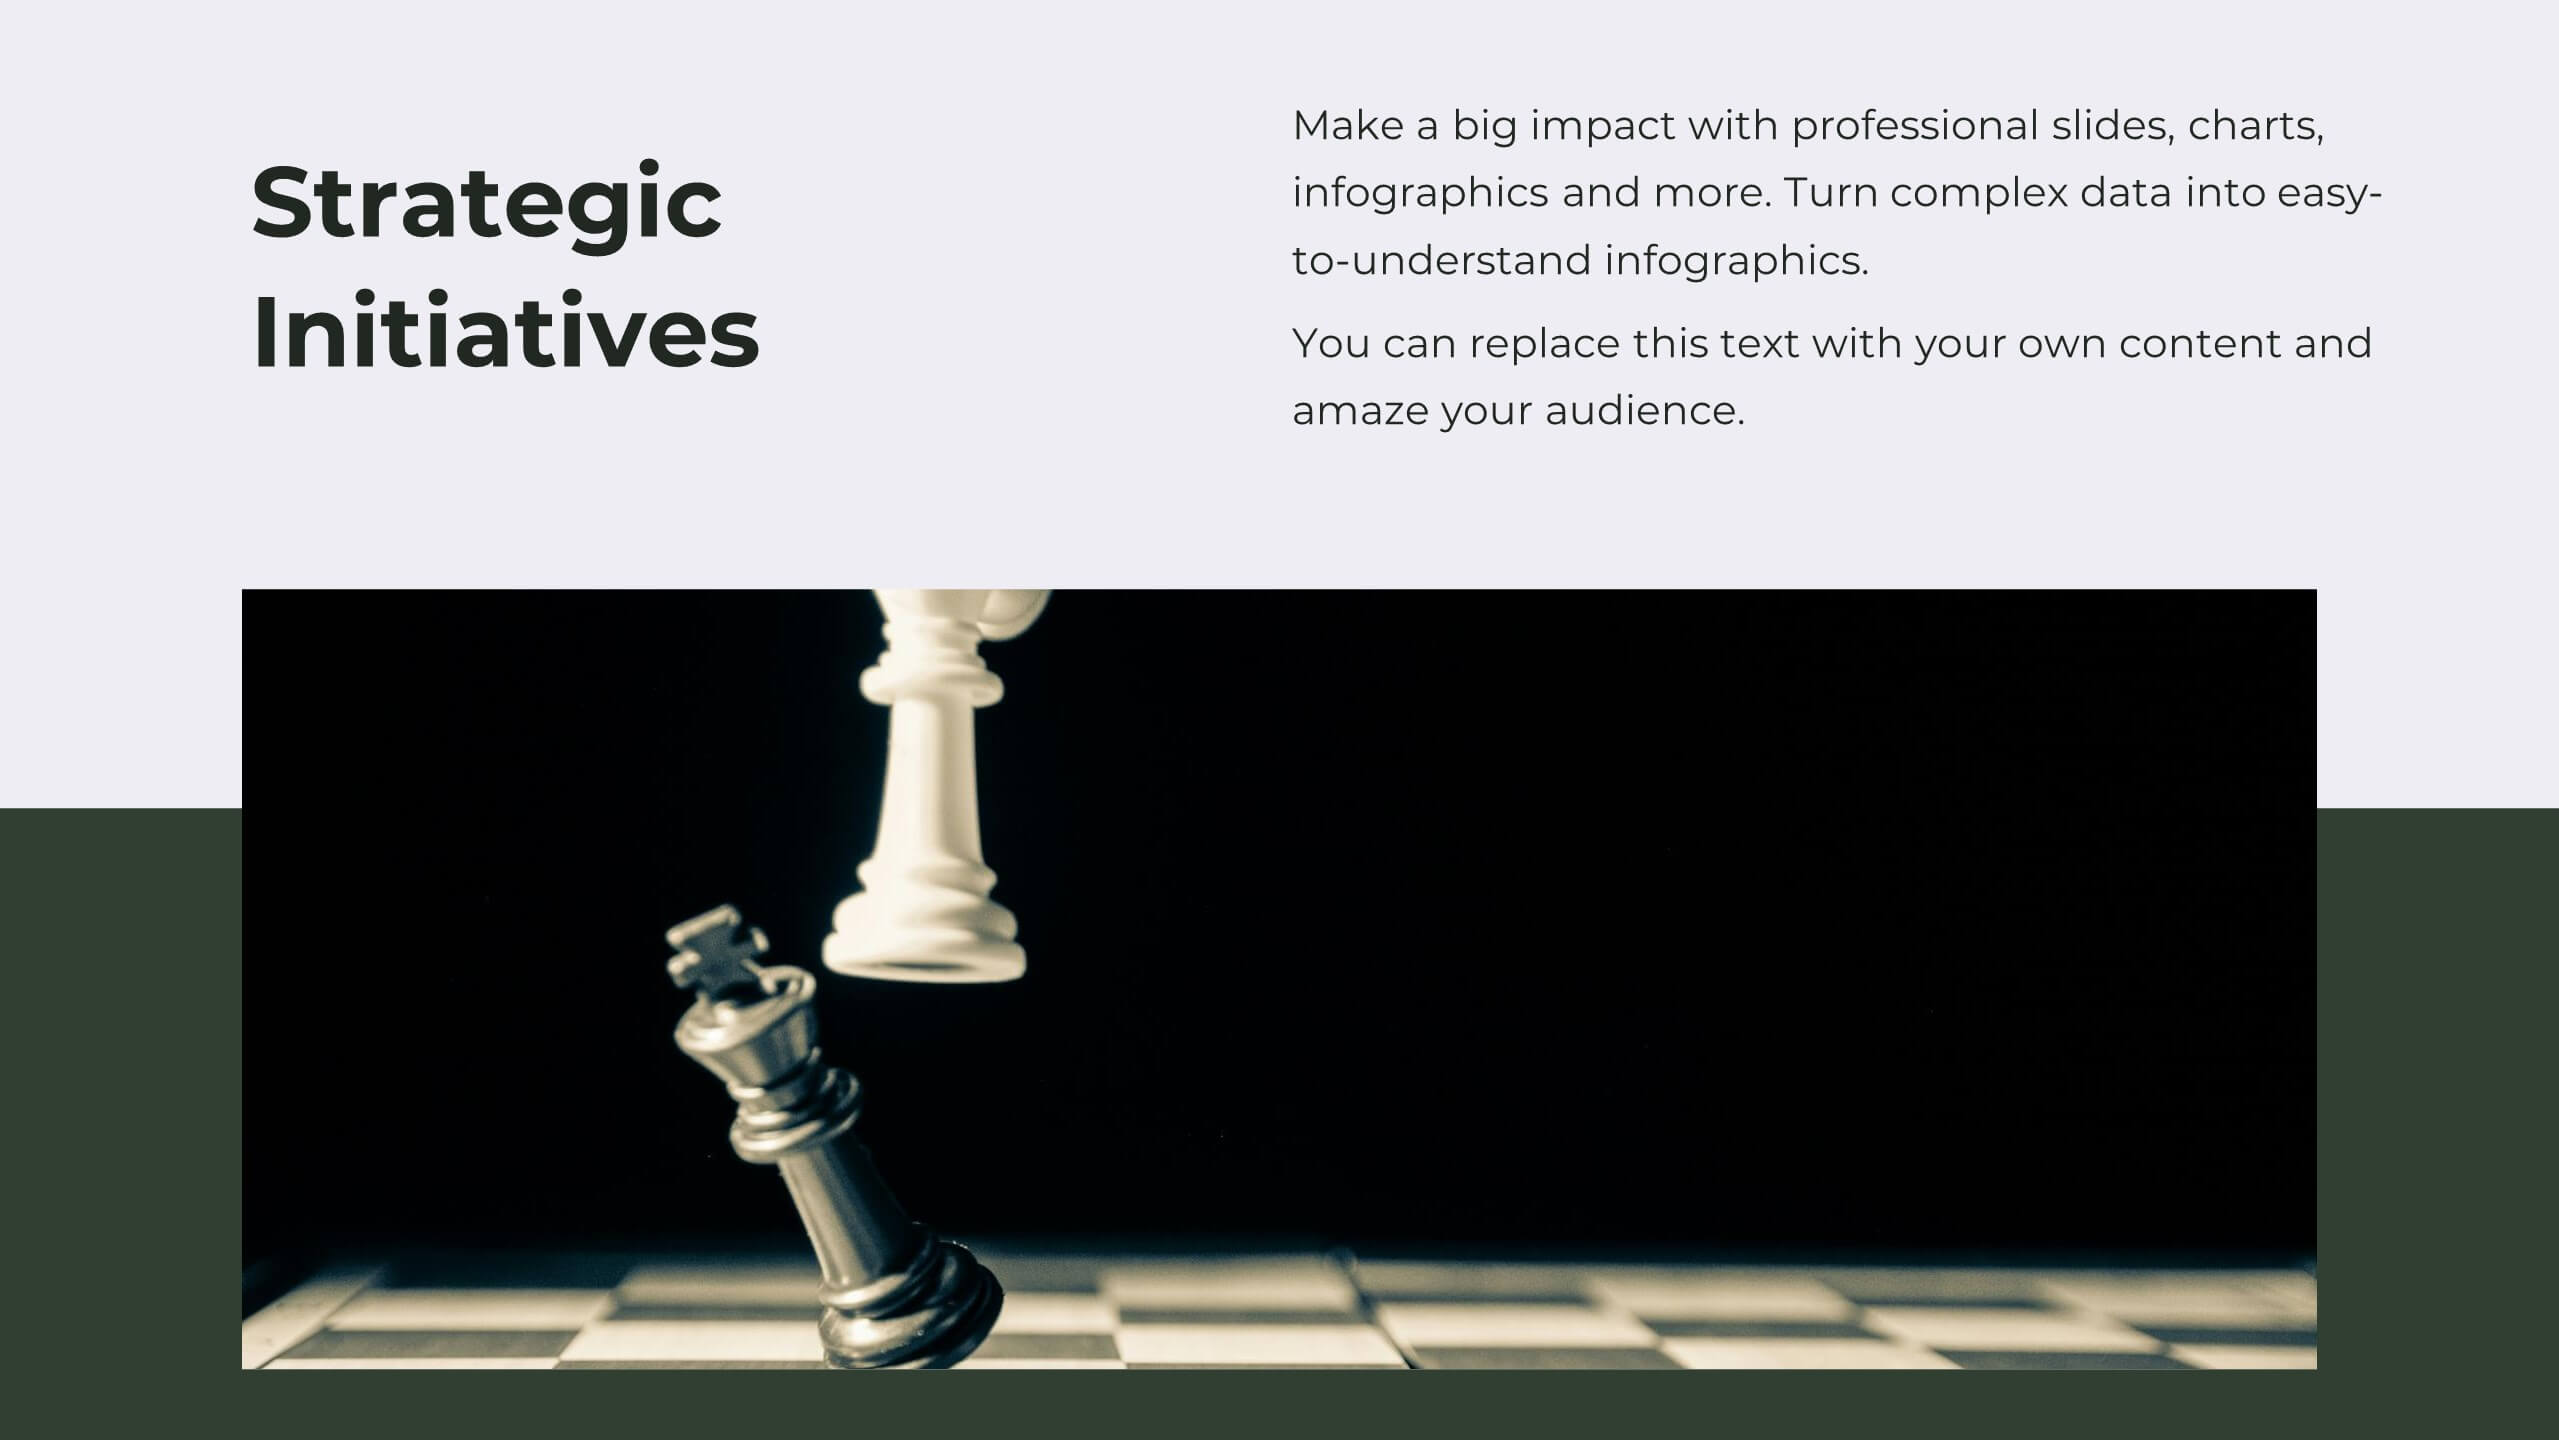
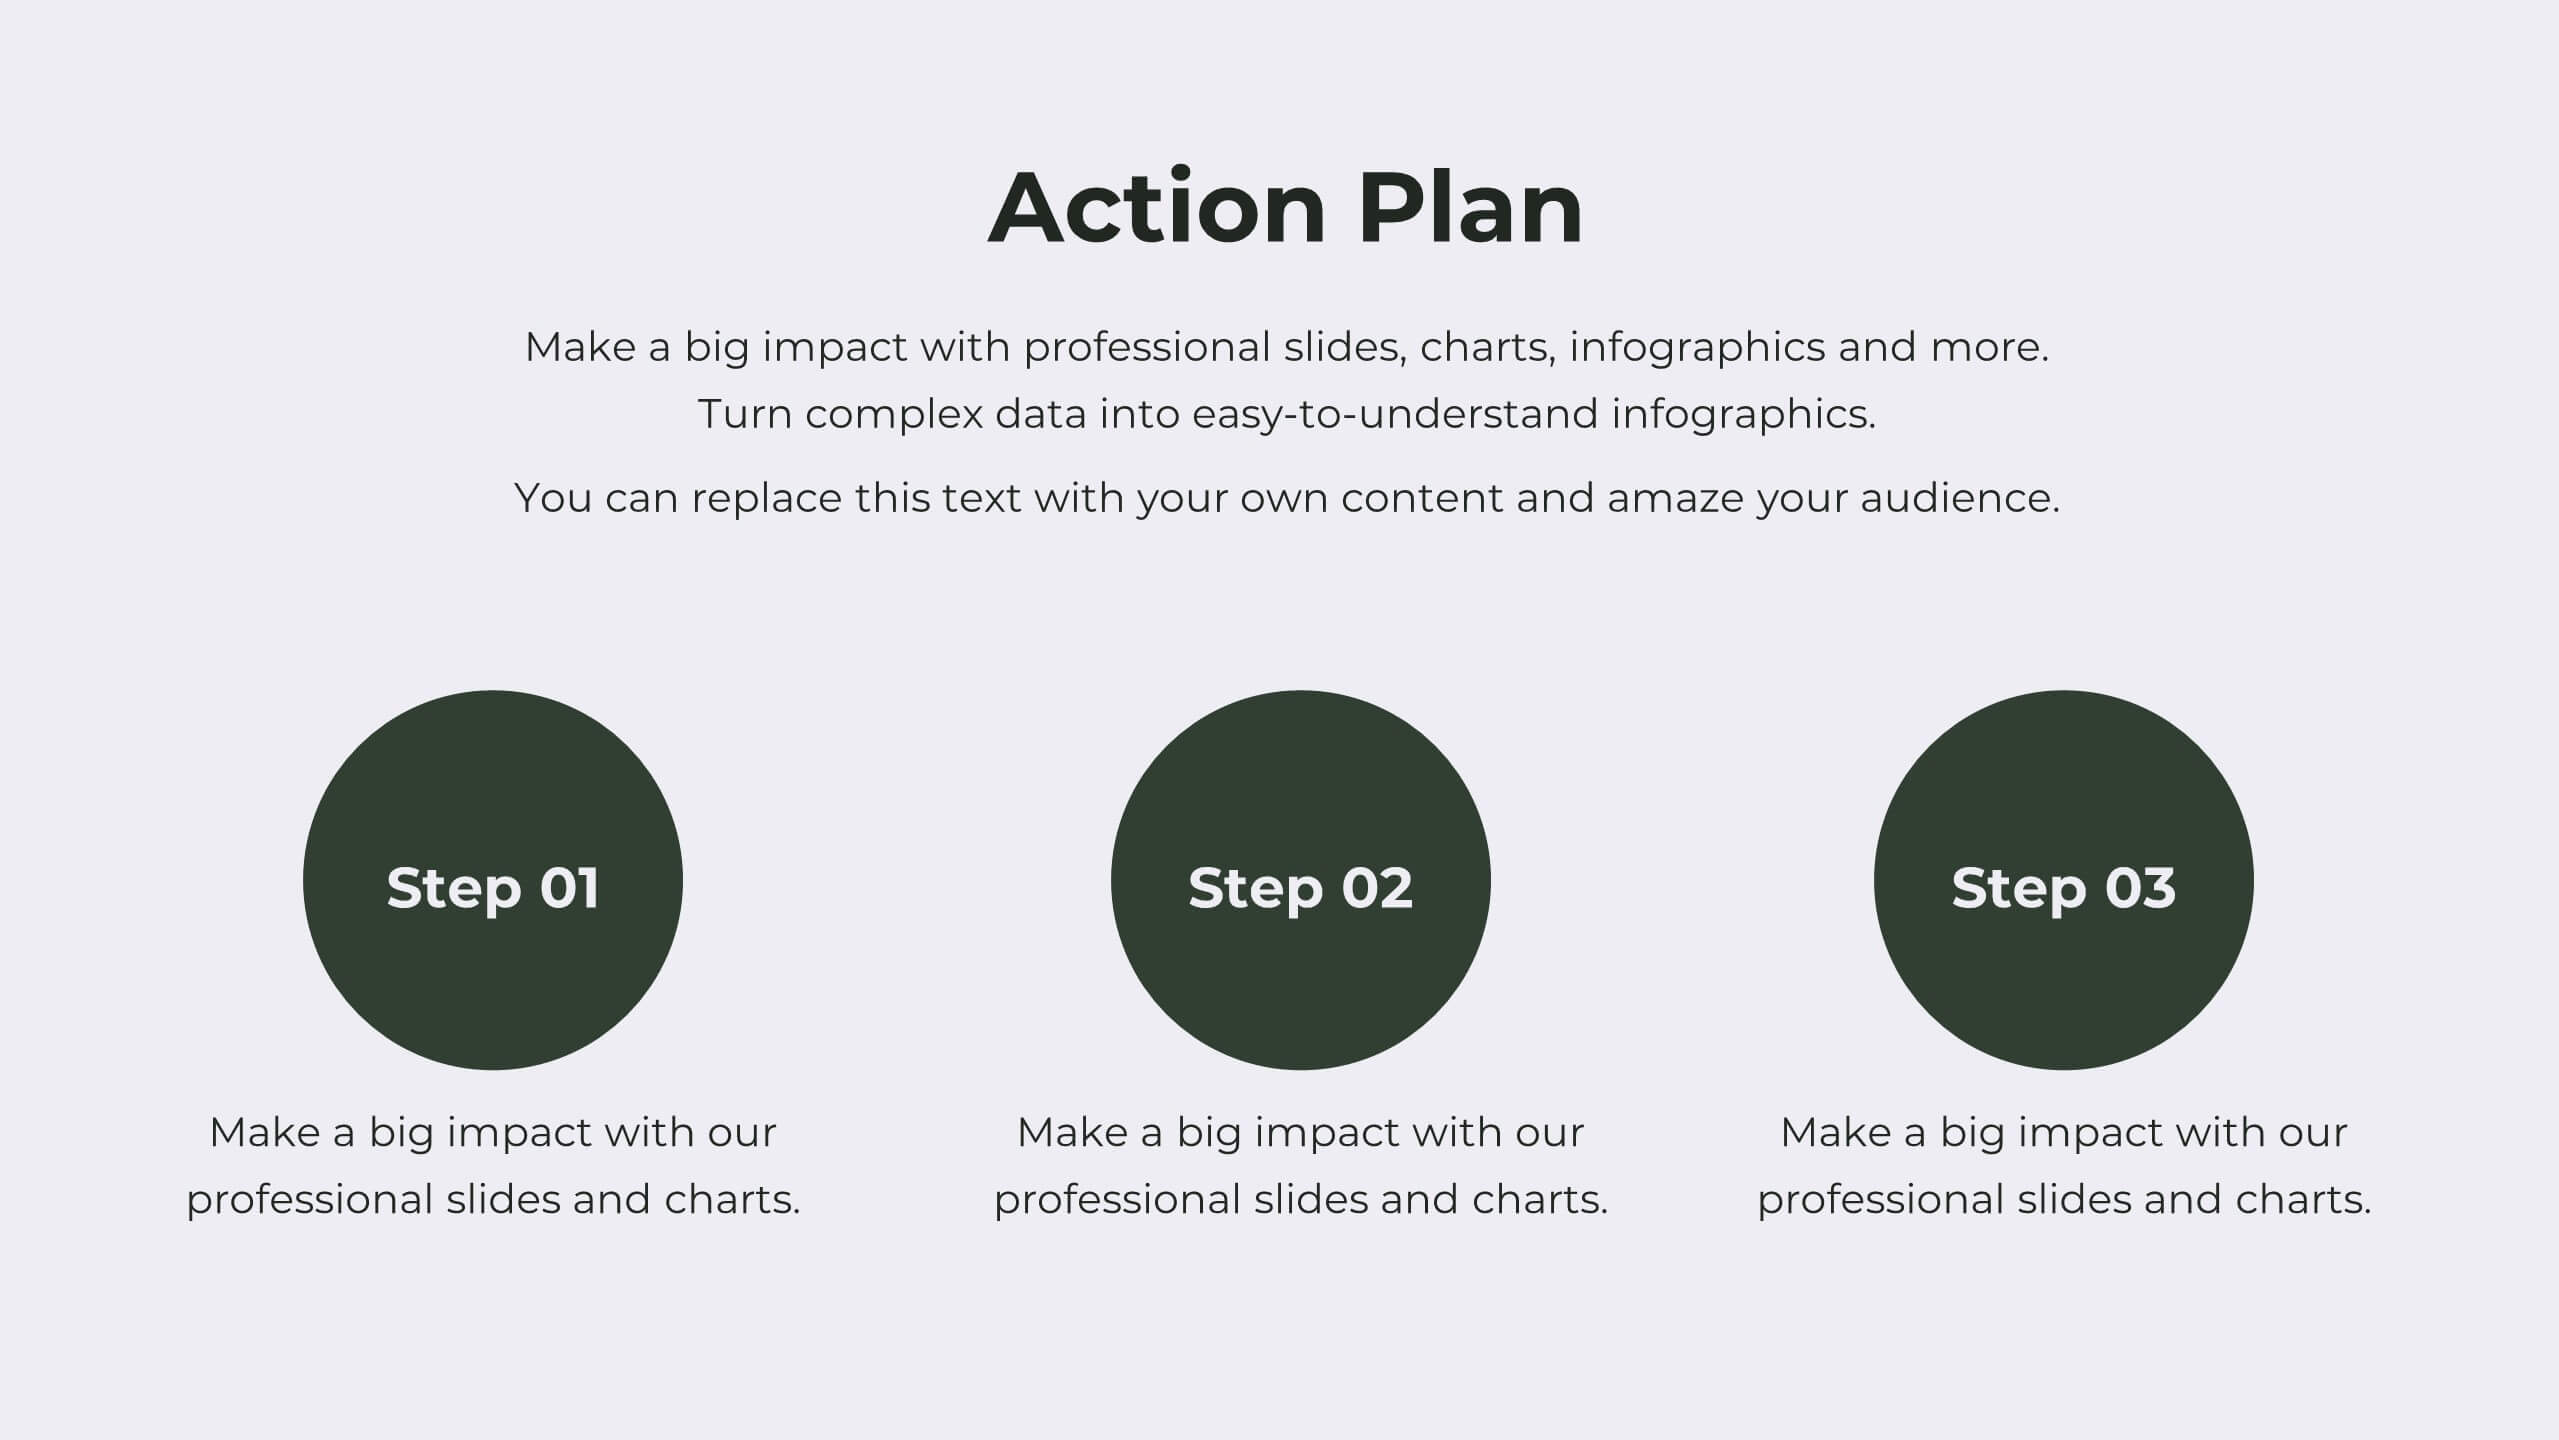
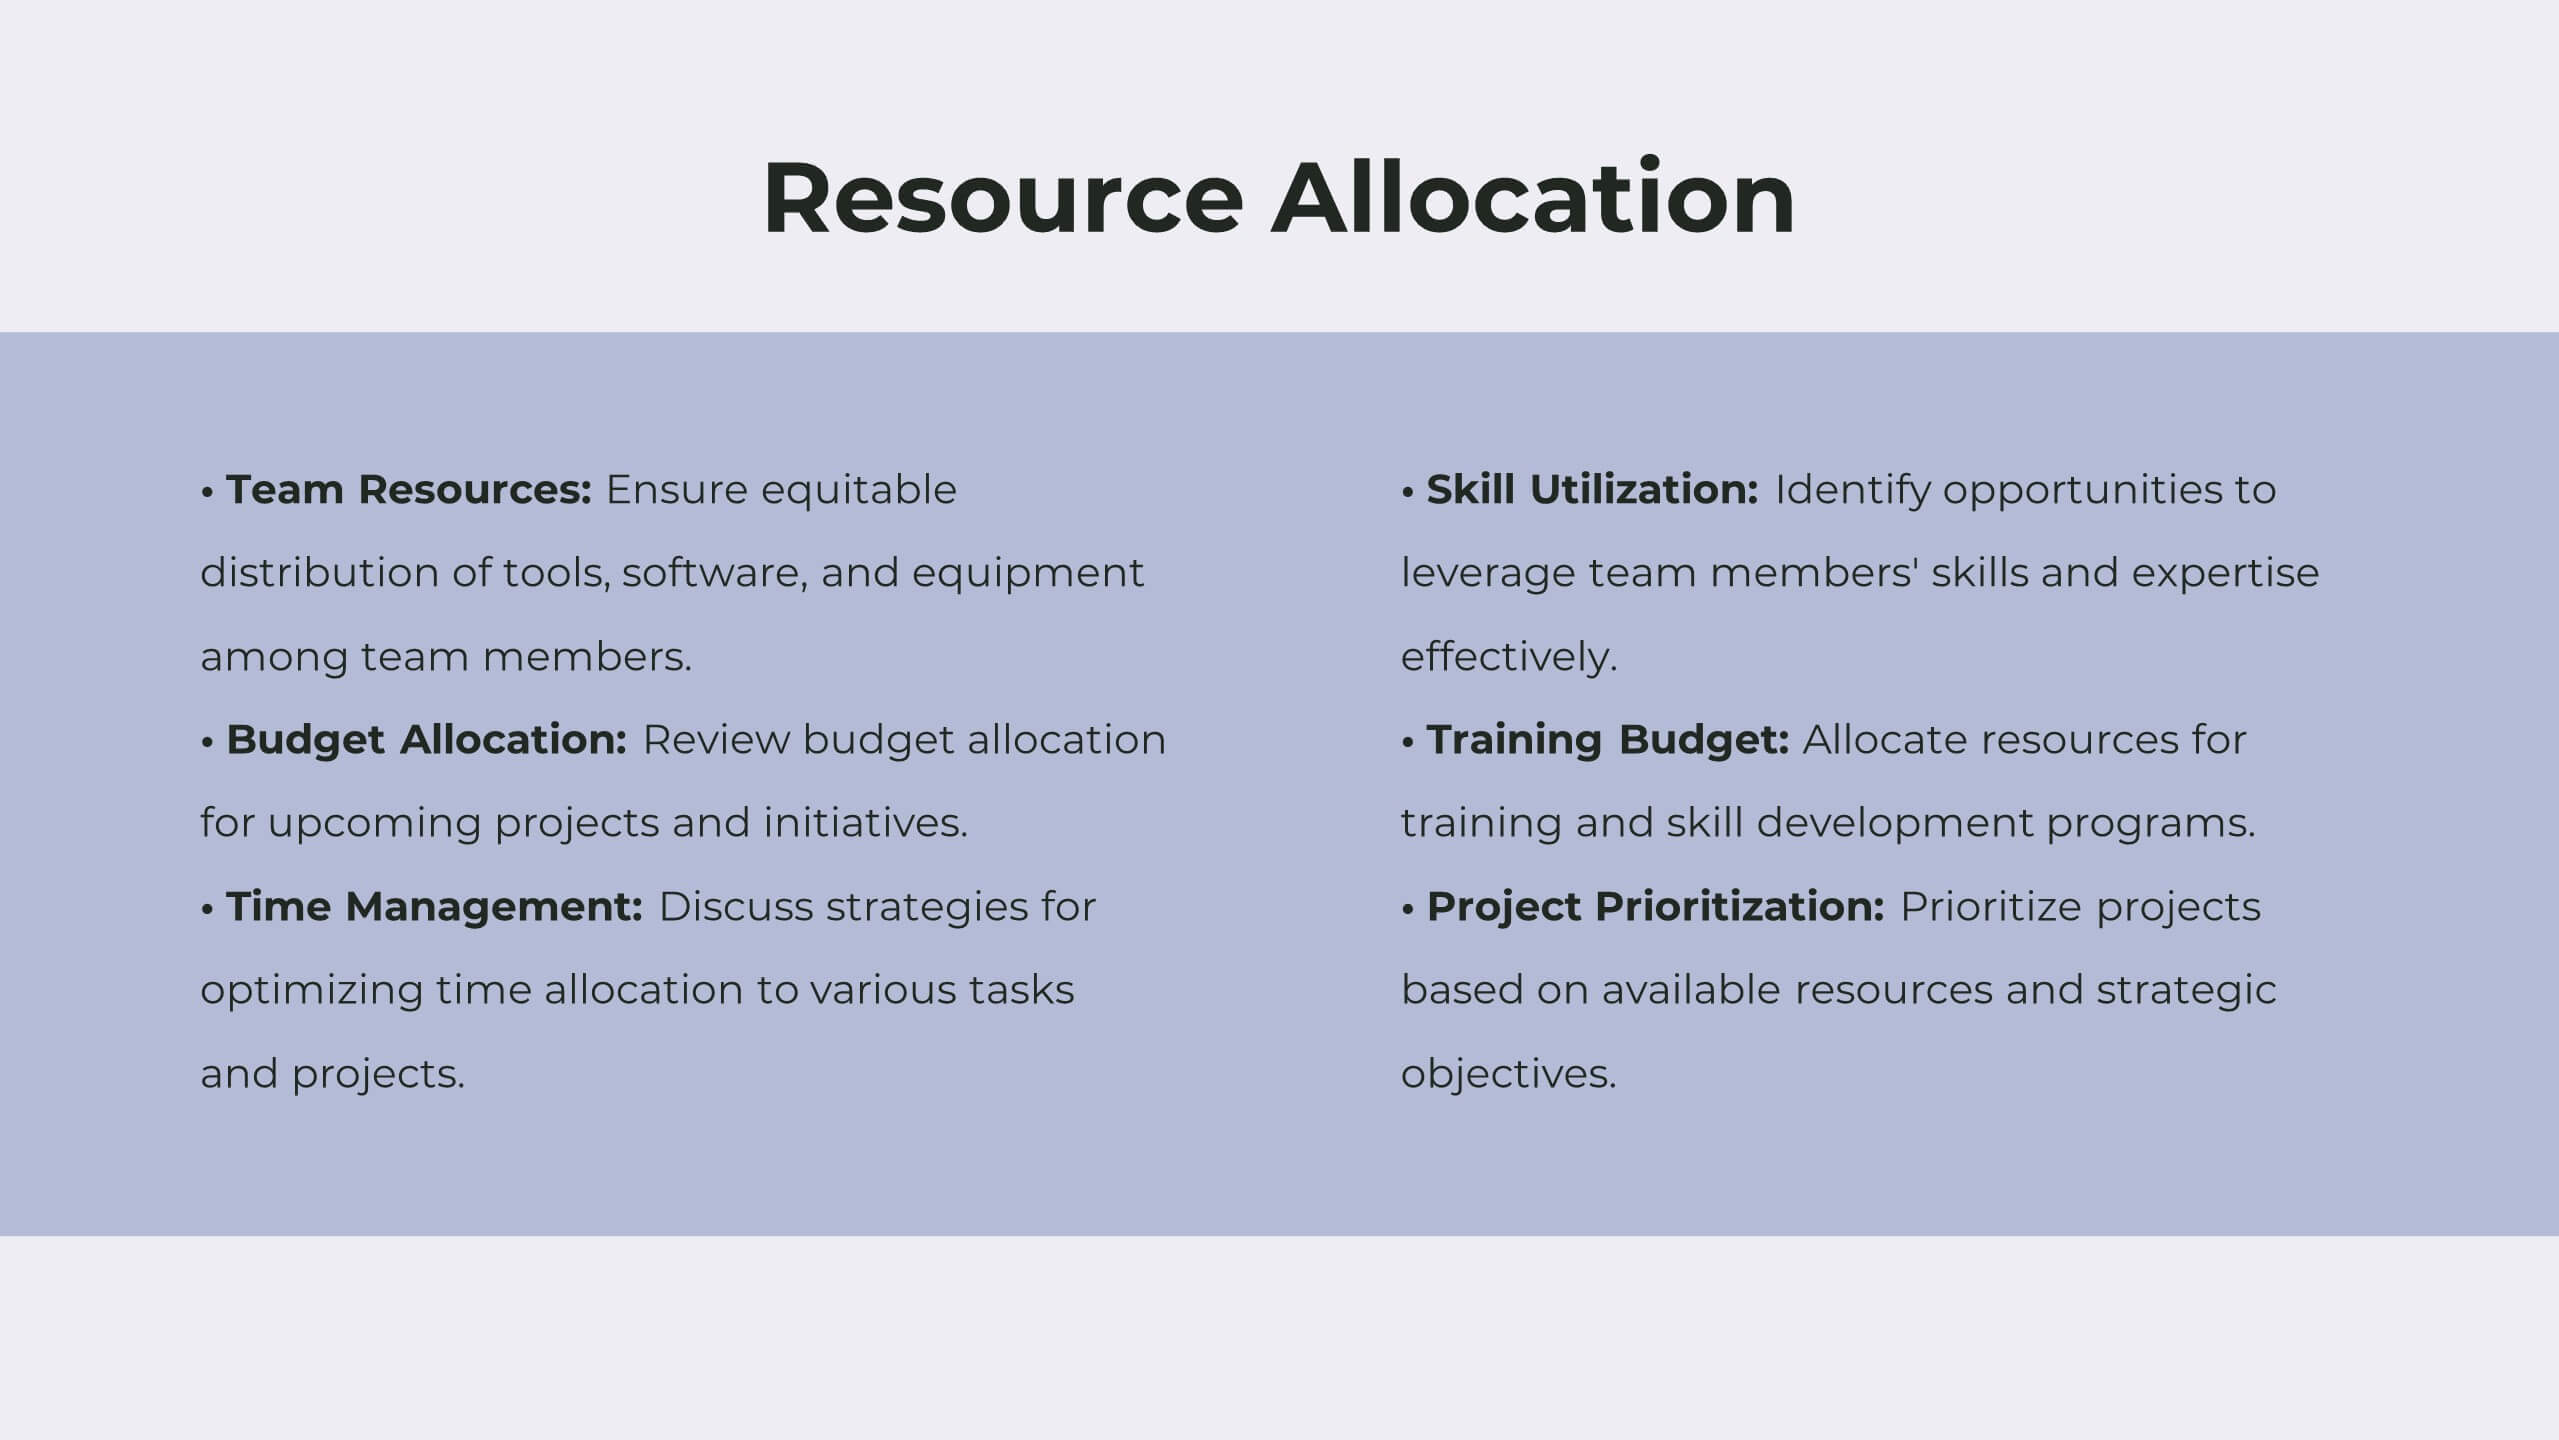
Tranquil Corporate Strategy Proposal Presentation
Drive your business forward with this elegant corporate strategy proposal template! Ideal for outlining strategic objectives, competitive analysis, and growth opportunities, it includes slides for SWOT analysis, resource allocation, and performance metrics. Impress stakeholders with clear visuals and structured content. Compatible with PowerPoint, Keynote, and Google Slides for seamless presentations on any platform.