


Características


¿Tienes alguna pregunta?
Recomendar


4 diapositivas
Sales Funnel Data Presentation
Turn your data into a clear story with a visual flow that shows exactly how leads move from one stage to the next. This presentation helps explain conversion steps, highlight drop-off points, and simplify complex marketing insights. It’s easy to customize and fully compatible with PowerPoint, Keynote, and Google Slides.


21 diapositivas
Prismtrail Product Roadmap Presentation
Guide your product development journey with this structured roadmap template, covering everything from target market and product features to pricing strategy and production process. Designed for clarity and impact, this template streamlines presentations and is compatible with PowerPoint, Keynote, and Google Slides, ensuring seamless use across platforms.


7 diapositivas
Root Cause Model Infographic
Unlock problem-solving efficiency with our Root Cause Analysis Model Infographic, designed for process engineers, quality assurance teams, and business managers. This infographic is a strategic tool to dissect complex issues and identify underlying causes of operational challenges. Our infographic outlines a step-by-step methodology to trace problems back to their fundamental causes, using visual diagrams to map out cause-and-effect relationships. It's crafted to facilitate a thorough examination of processes, systems, and outcomes, promoting a deep understanding of business issues. Customizable elements allow you to detail specific causes, impacts, and the interplay between different contributing factors. This SEO-optimized infographic is designed to be an accessible resource for professionals dedicated to continuous improvement and corrective action planning. Employ this infographic to guide your team through root cause analysis, fostering a culture of proactive problem-solving and sustainable solutions within your organization.


6 diapositivas
Team Leadership and Management
Foster stronger collaboration with this team-focused circular diagram. Designed to showcase six key areas of team leadership, this template is perfect for outlining communication, goal-setting, delegation, performance, feedback, and development strategies. Ideal for managers, trainers, and HR professionals. Fully customizable in PowerPoint, Keynote, and Google Slides.


2 diapositivas
Online Course Structure and Syllabus Deck Presentation
Welcome students with a vibrant and modern course intro slide. This template is perfect for online educators outlining course objectives and syllabus details. Features an image placeholder and text sections for clear communication. Fully editable in PowerPoint, Keynote, and Google Slides—ideal for virtual learning environments and eLearning programs.


5 diapositivas
Beer Drinking Infographics
The art of beer encompasses the brewing process, the craftsmanship of creating unique flavors and styles, and the enjoyment of this ancient beverage. These infographics are perfect for showcasing key facts, statistics, and interesting information related to the world of beer. This template is ideal for breweries, beer enthusiasts, bartenders, or anyone interested in sharing knowledge about different beer types, brewing processes, or beer culture. The template offers a variety of slide layouts to cover different aspects of beer drinking. The template provides sections for discussing different beer styles, brewing processes, and beer tasting.


5 diapositivas
Annual Business Performance Year in Review Presentation
Present your metrics with clarity using the Annual Business Performance Year in Review Presentation. This visual slide showcases key data points and financial highlights through an ascending, step-based layout — perfect for reflecting growth, comparing yearly results, or visualizing KPIs. Ideal for year-end reviews or stakeholder updates. Easy to edit and compatible with PowerPoint, Keynote, and Google Slides.


7 diapositivas
Circle Chart Infographic Presentation
This unique design incorporates both circular and star-shaped elements to convey information in charts. Whether your goal is to showcase market shares, highlight trends, or simply enhance your academic presentation, this infographic will help you achieve it. You can edit this template without any need of design skills or technical knowledge. This presentation includes 7 slides, chart shapes with colors and fonts, all fully customizable. This template is an excellent choice for presenting content on any topic, in a circular format. Simply put your data on the design, add a title, and you're done!


5 diapositivas
Fundraising for Nonprofits Infographics
Elevate your fundraising efforts with our fundraising for nonprofits infographics template. Cast in the trustworthy shades of blue and red, this collection is a boon for nonprofit organizations, charity events coordinators, and social activists. It's designed to articulate critical fundraising information, campaign progress, and financial goals in a format that's as compelling as it is clear. Compatible with Powerpoint, Keynote, and Google Slides. The creative and informative style, replete with pertinent graphics, icons, and image placeholders, ensures your message resonates profoundly, encouraging more engagement and generosity towards your noble causes.


5 diapositivas
Marketing Concepts Infographics
Marketing Concepts refer to the various strategies and philosophies that guide the marketing efforts of businesses and organizations. Our marketing concept infographics are visual representations of the different marketing concepts and strategies that businesses use to promote their products or services. These infographics can cover a wide range of marketing topics, including target audience, product positioning, branding, advertising, and video marketing. The purpose of these infographics is to provide a easy-to-understand overview of key marketing concepts that businesses can use to drive sales and increase brand awareness.


7 diapositivas
Time Management Infographic Presentation Template
Time management skills are important in all aspects of life, not just work. Mastering time management allows you to get everything that you want out of your day. This time management template is the perfect tool to help you stay productive. Keep track of tasks, create a schedule and organize time where you need it most. Use this template to build a database of your weekly tasks, daily activities and recurring tasks that can be easily structured in a clock view. This time management template Is compatible with Powerpoint, Keynote, and Google Slides, so you can use it on any device.


7 diapositivas
Product Roadmap Infographic Presentation
A well-designed Roadmap infographic can be a powerful tool used to communicate your vision. This template highlights important dates, objectives and milestones to achieve over a period of time. The roadmap provides a clear view of what needs to be done, and when it needs to be done. This template is fully editable in PowerPoint, Keynote and Google Slides, making it easily personalized and customized to suit your project needs. Use this roadmap infographic to help you display a plan for accomplishing a long-term goal, and communicate your vision in an appealing and memorable way!


5 diapositivas
SEO Techniques Infographics
SEO (Search Engine Optimization) techniques are strategies and practices used to improve a website's visibility and ranking in search engine results pages (SERPs). These infographic templates are designed to educate and inform about various techniques and strategies used in search engine optimization. With its eye-catching design and clear visual representations, the template helps convey complex SEO concepts in a concise and engaging manner. These provide a foundation for understanding the subsequent techniques discussed in the presentation. Throughout the infographic, best practices and tips are shared to help optimize SEO efforts.

1 diapositiva
Geometric Shapes for Visual Clarity Presentation
Present your ideas with precision using this geometric-themed slide layout. Featuring four diamond icons in vibrant outline styles, this template is perfect for breaking down key business concepts. Ideal for professional briefings, marketing plans, or strategy decks. Fully customizable in Canva, PowerPoint, Keynote, and Google Slides.


24 diapositivas
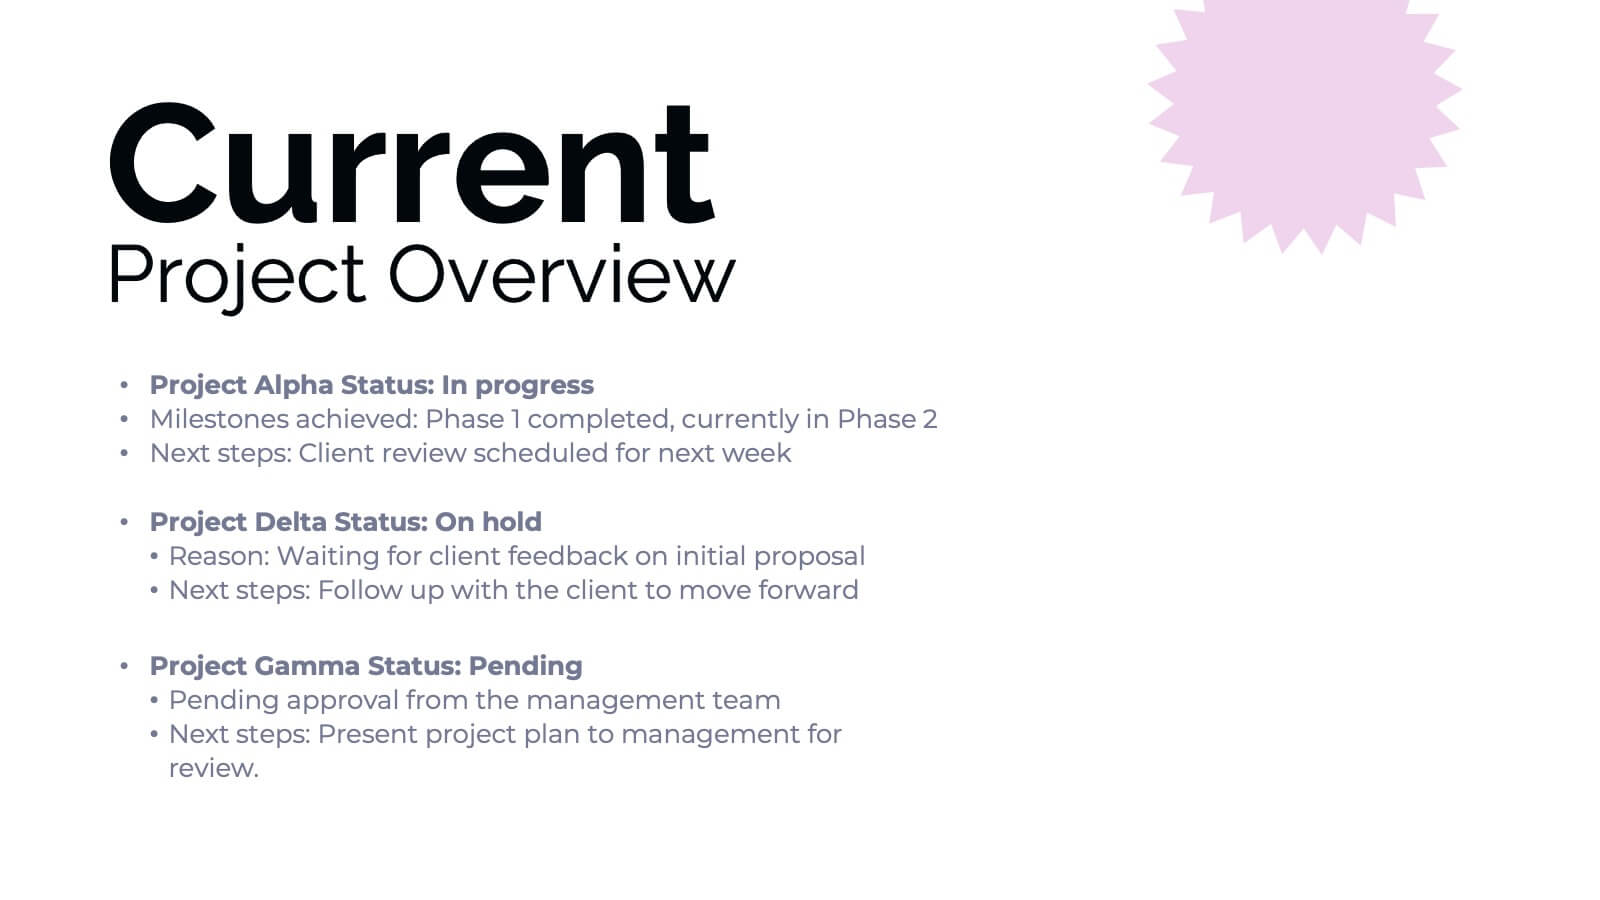
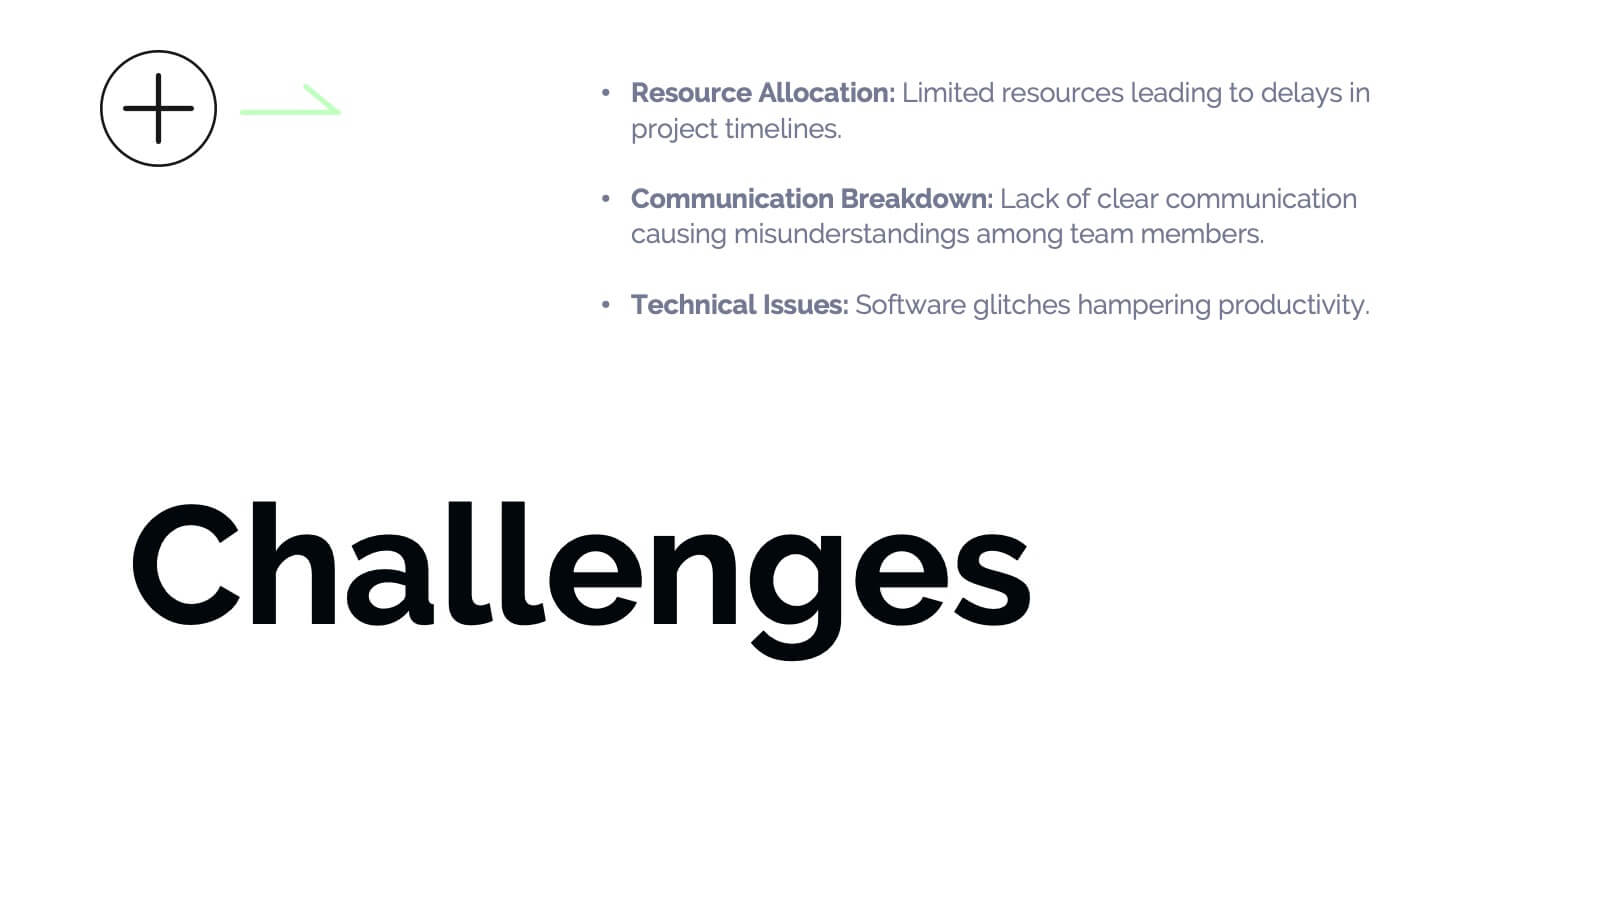
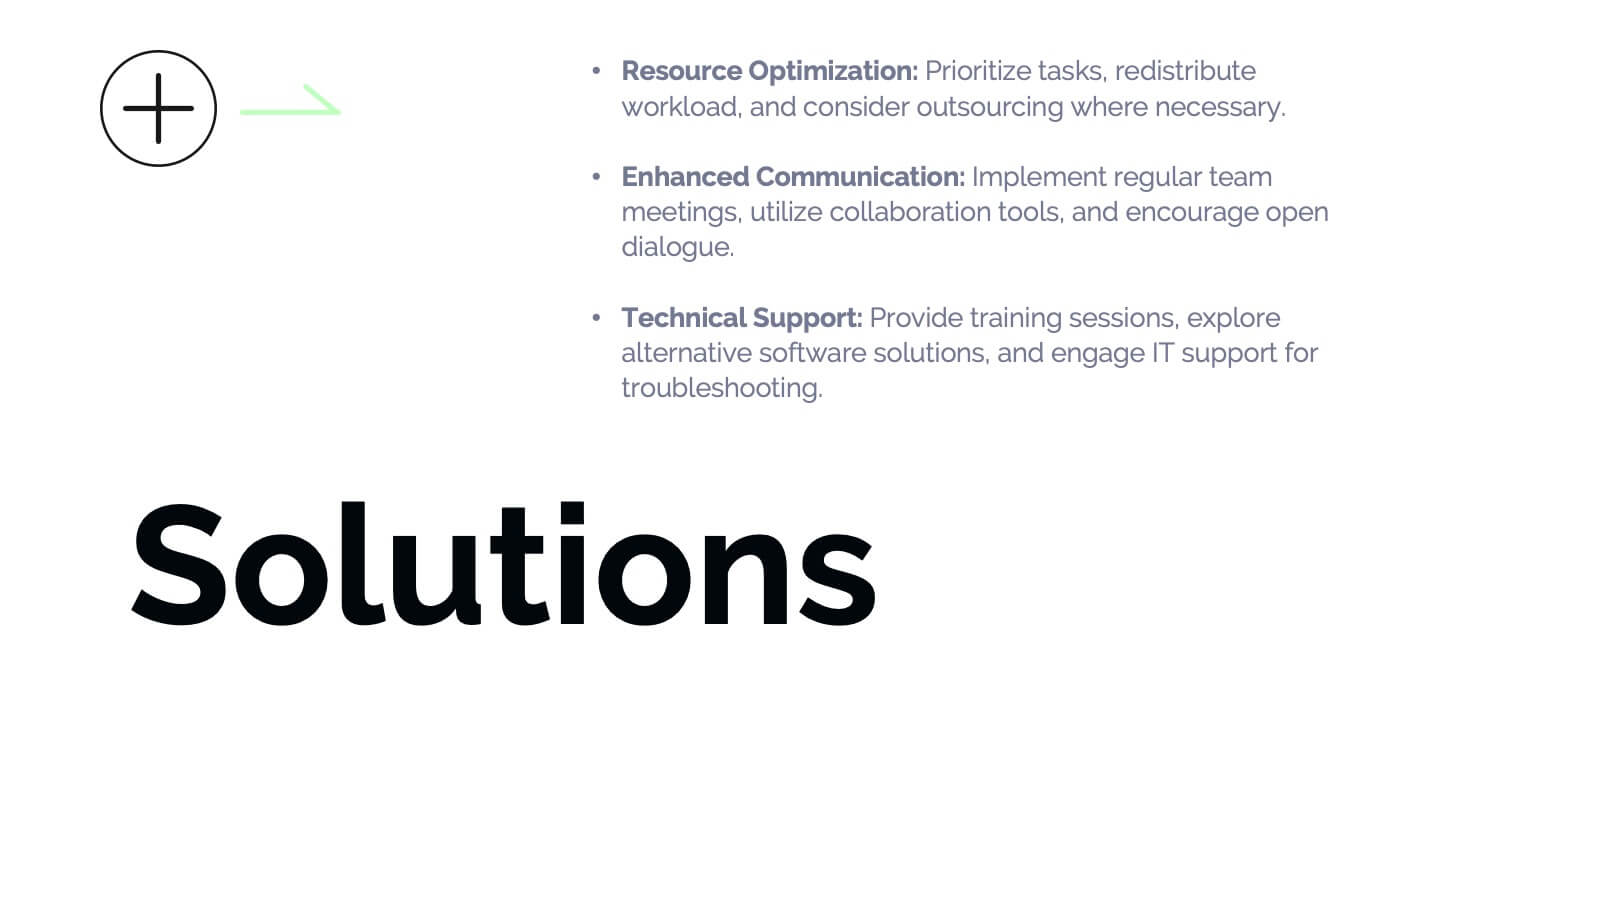
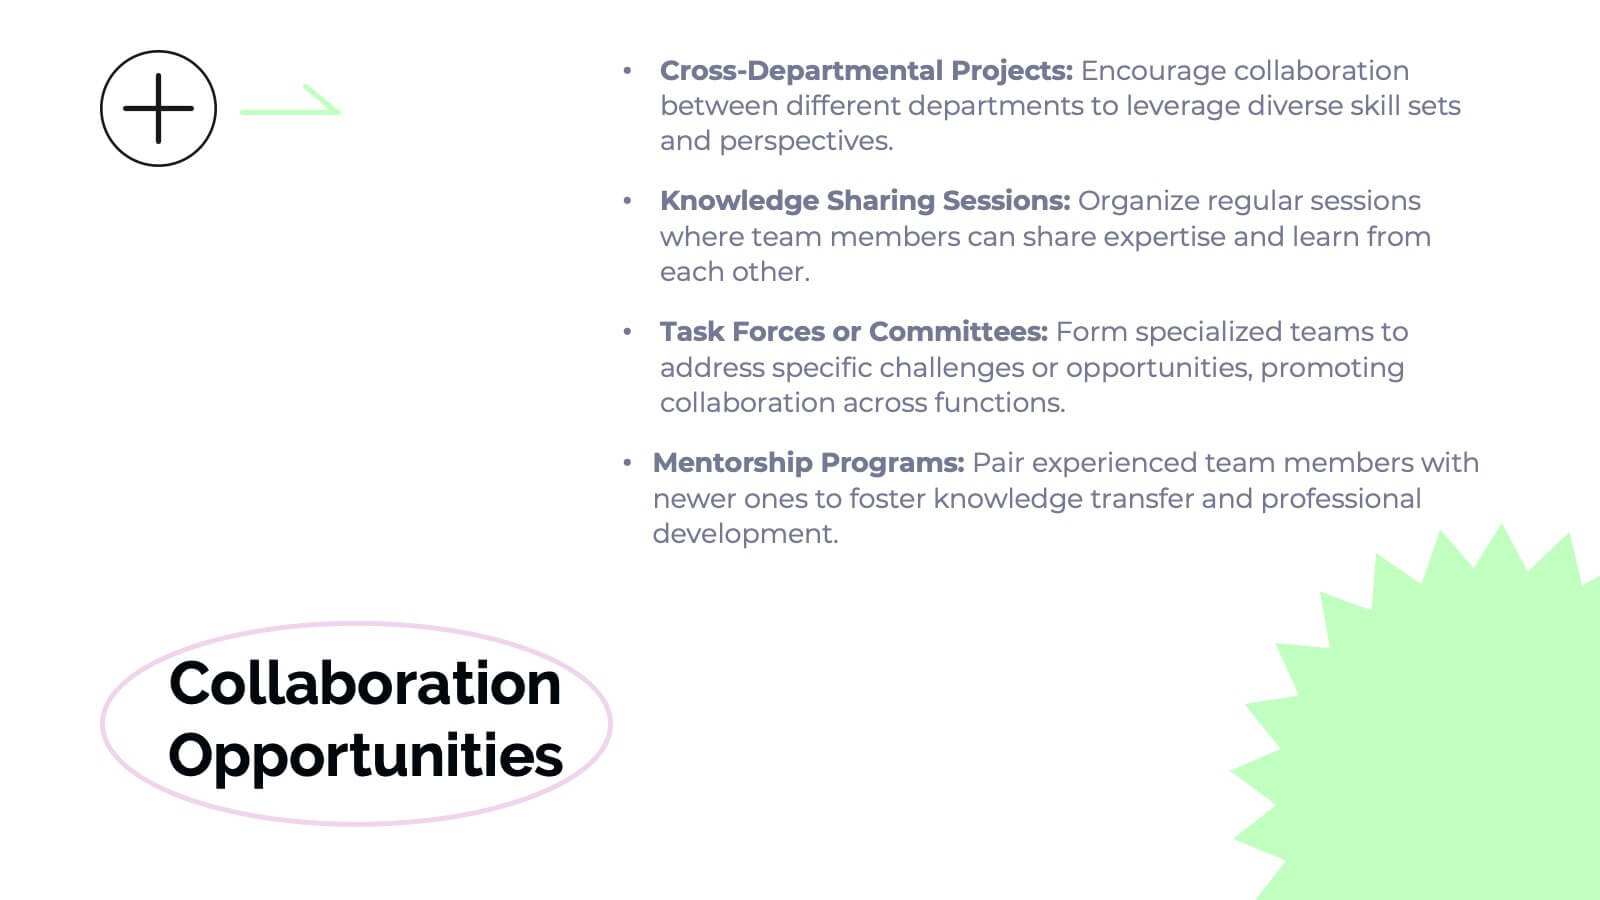
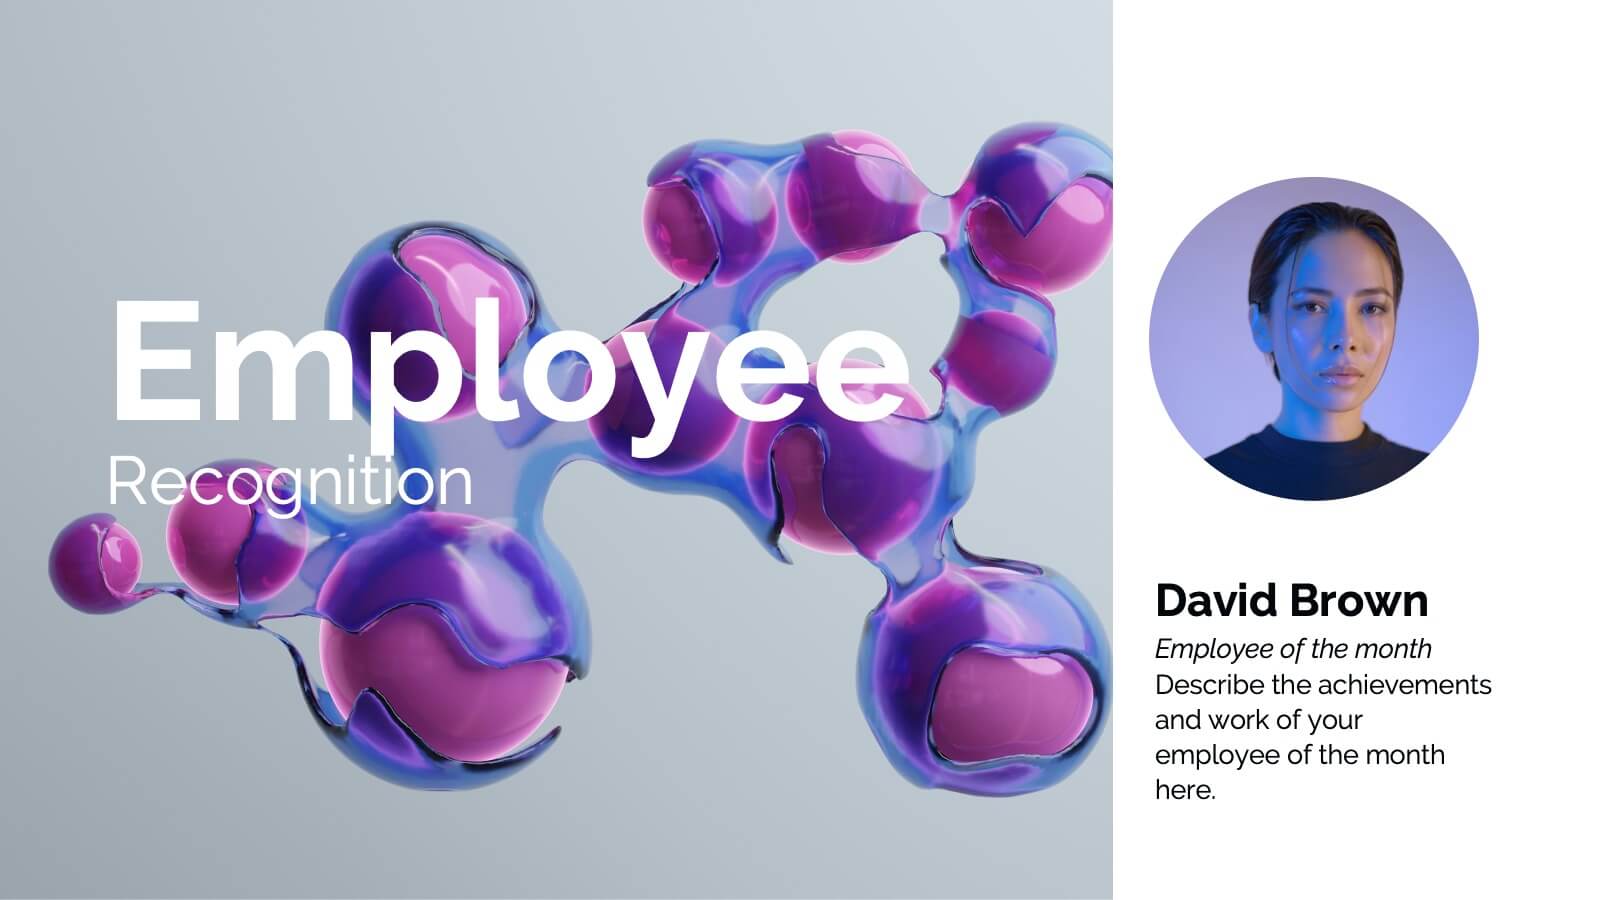
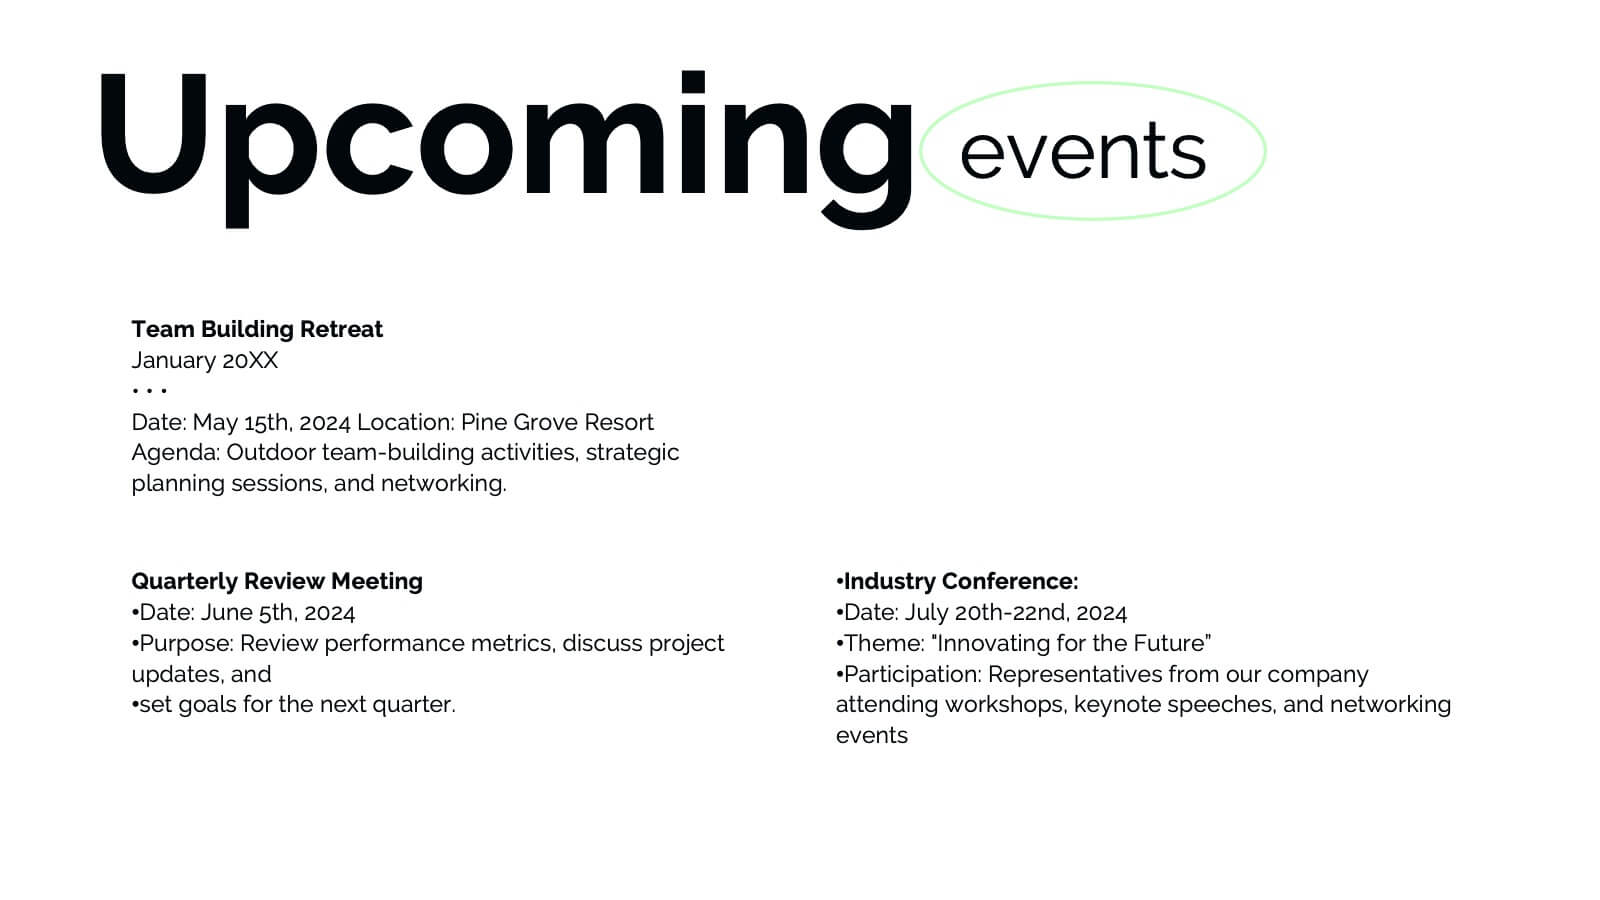
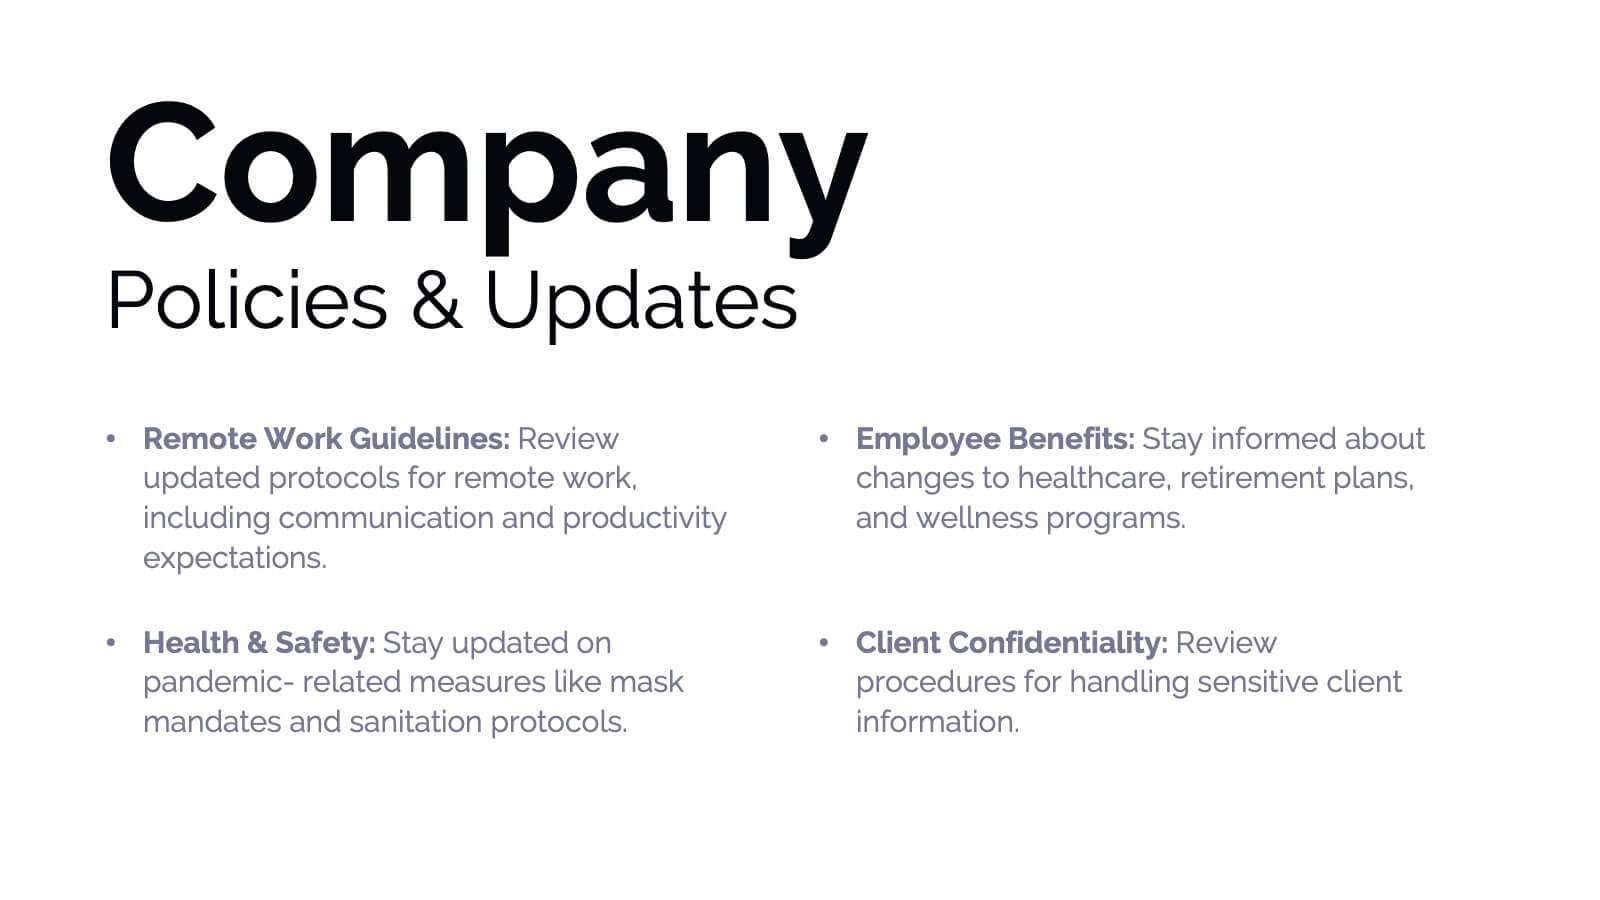
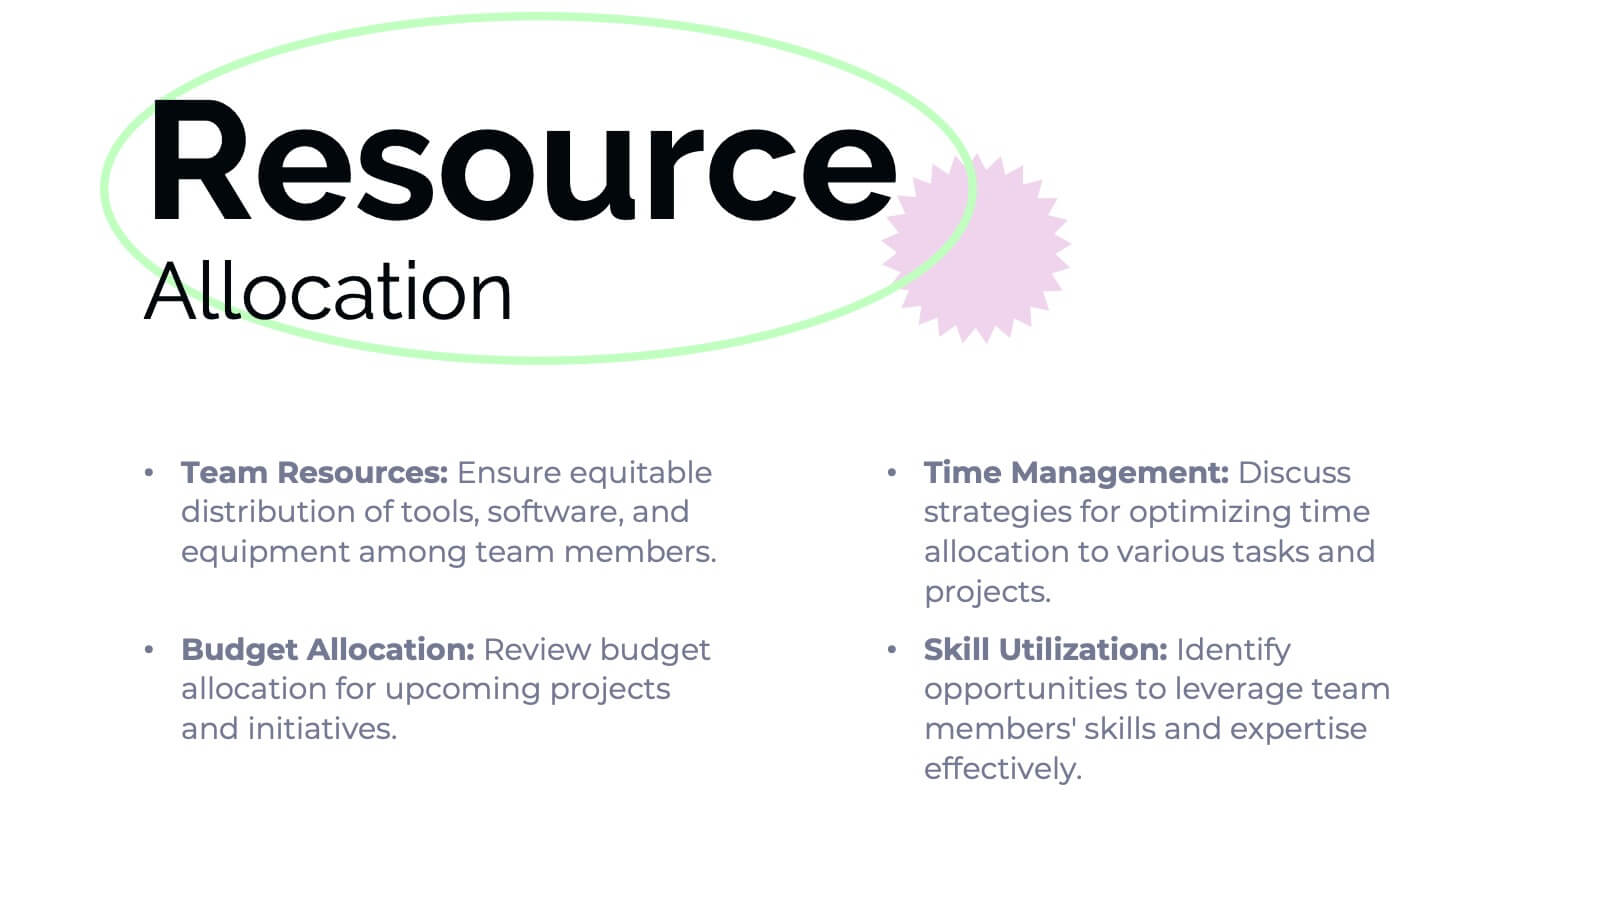
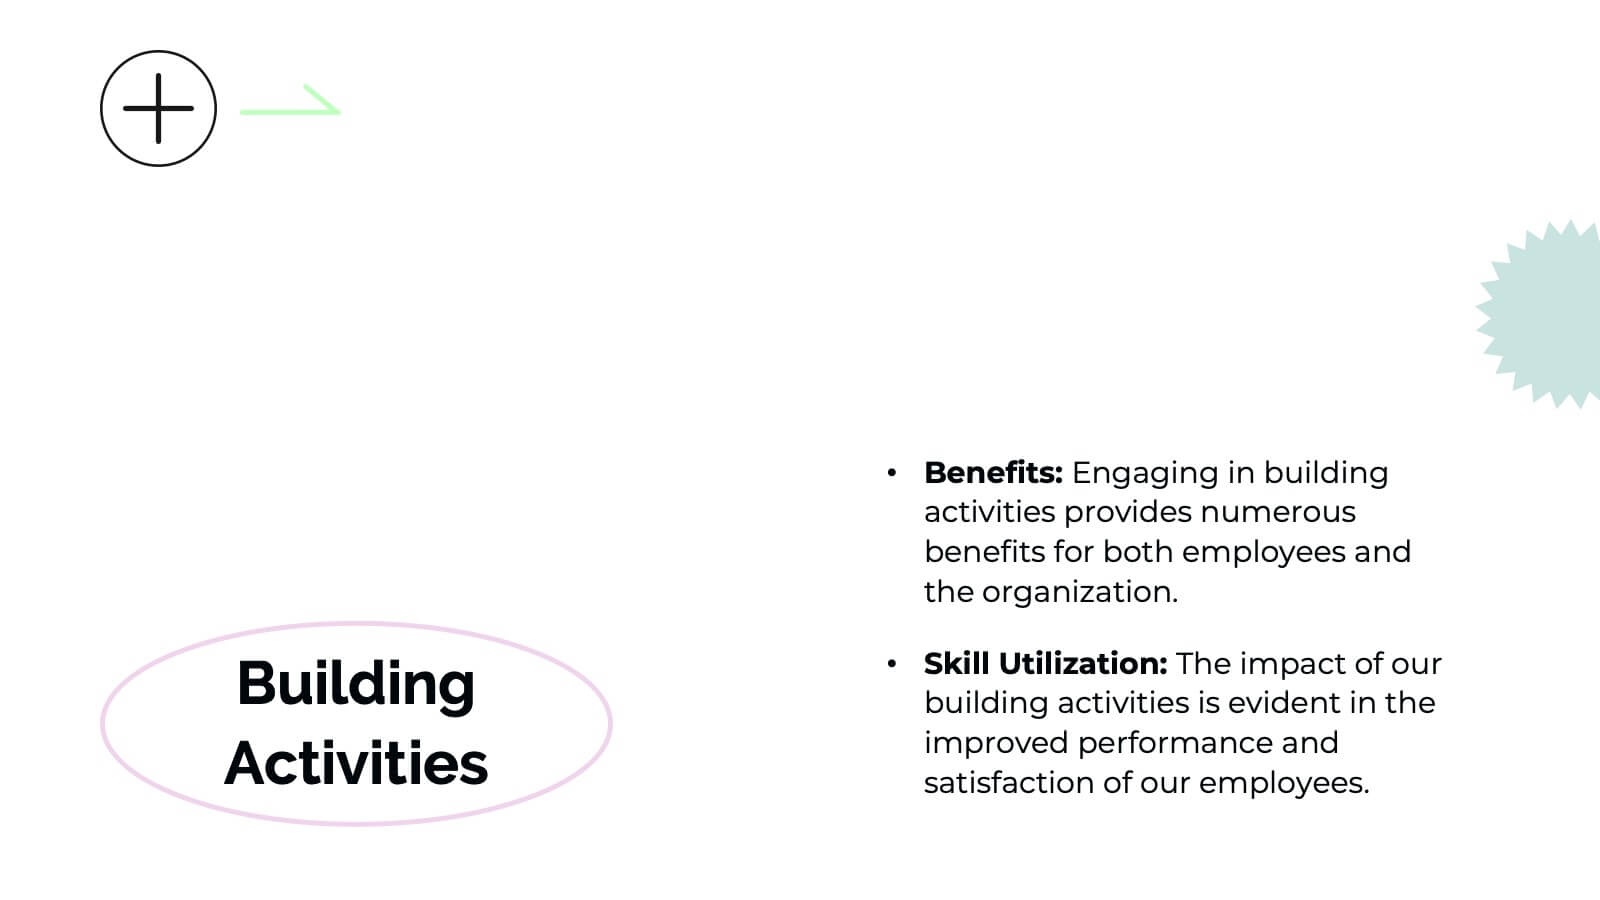
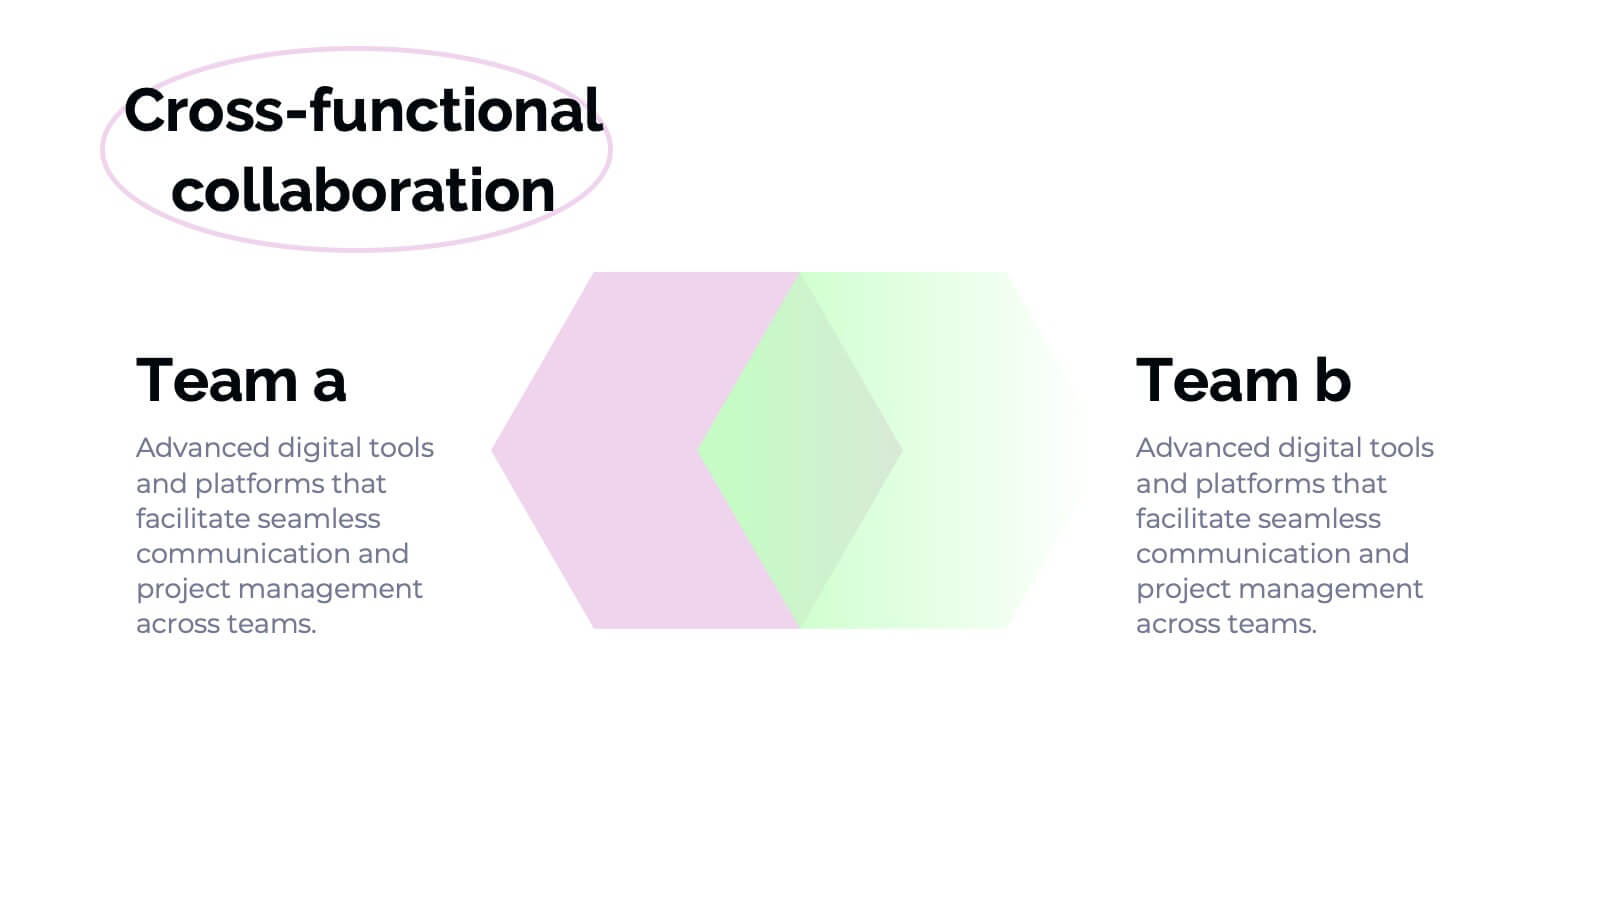
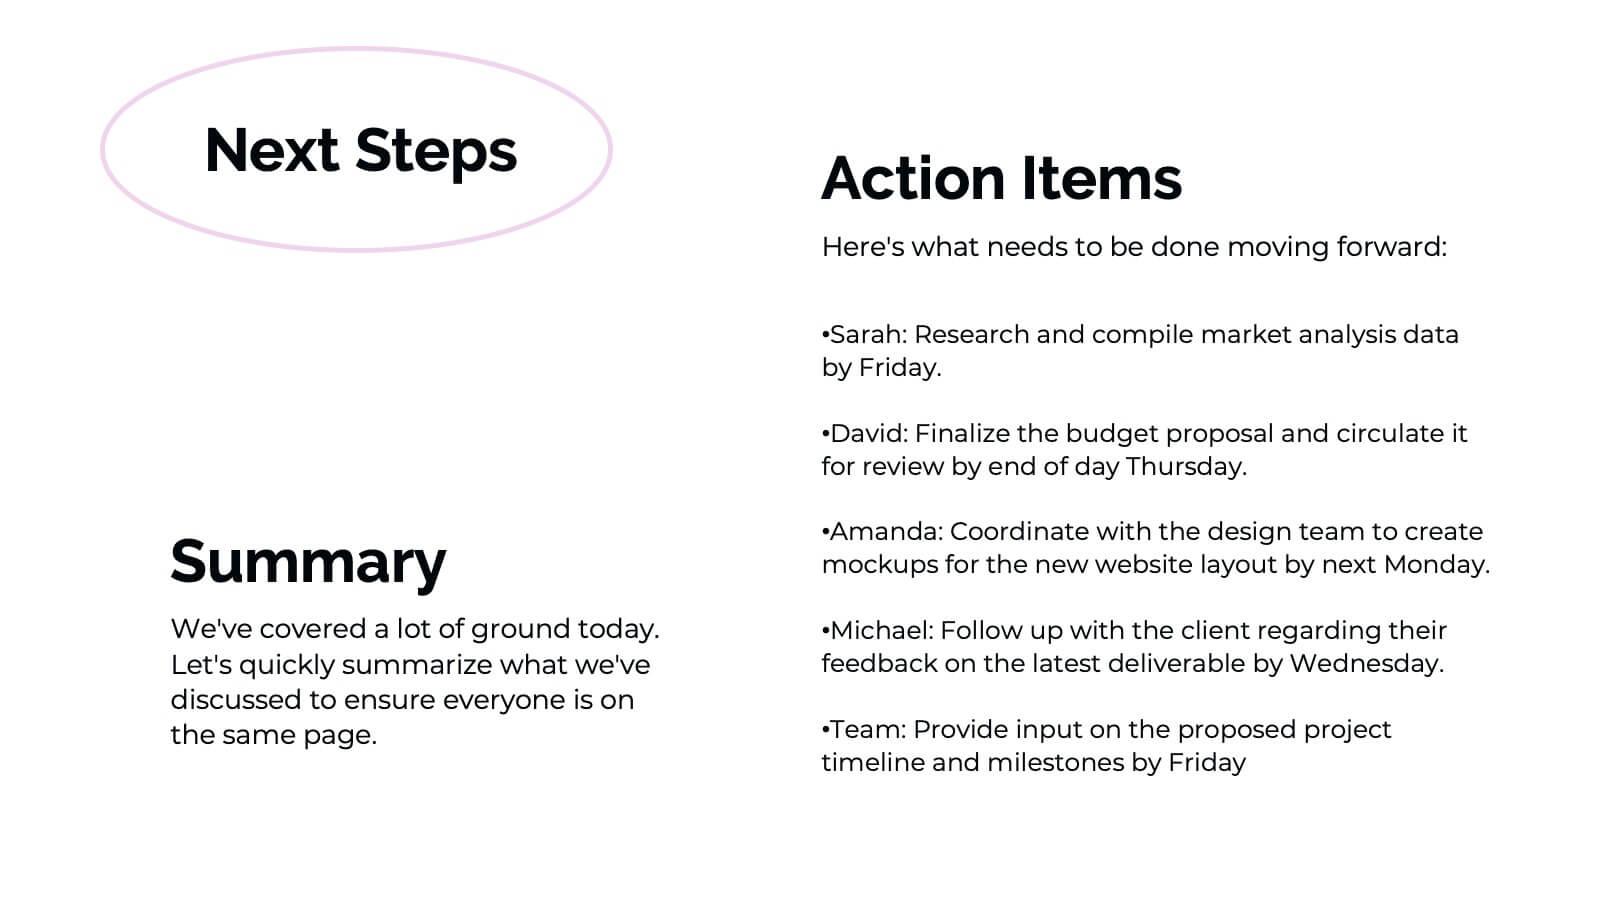
Banshee Business Operations Plan Presentation
Streamline your business operations with this comprehensive presentation template! From team updates and key achievements to challenges and solutions, every aspect of your business plan is covered. Ideal for tracking performance metrics, resource allocation, and upcoming events, this design keeps your operations organized and efficient. Compatible with PowerPoint, Keynote, and Google Slides for seamless integration.


4 diapositivas
Infrastructure and Construction Industry Presentation
Showcase key developments in the Infrastructure and Construction Industry with this visually structured template. Ideal for project managers, urban planners, and engineers, it highlights construction phases, investment data, and industry insights. Fully customizable and compatible with PowerPoint, Keynote, and Google Slides for seamless integration into your professional presentations.


2 diapositivas
Target Audience and Persona Development Presentation
Bring your audience straight into the heart of your ideal customer with a vibrant, story-focused slide that highlights goals, motivations, data insights, and key pain points. This presentation makes it easy to communicate who you’re targeting and why it matters. Fully compatible with PowerPoint, Keynote, and Google Slides.