


Características


¿Tienes alguna pregunta?
Recomendar


6 diapositivas
User Empathy Map Infographic
An Empathy Map is a visual tool used in design thinking and customer-centric approaches to understand the needs, thoughts, feelings, and behaviors of a specific target user or customer. This infographic template is a tool used in user-centered design and product development to better understand and empathize with the needs, thoughts, emotions, and experiences of the target users. It helps teams gain deeper insights into the users' perspectives and develop more user-focused solutions. The infographic consists of four quadrants, each representing different aspects of the user's experience. Compatible with Powerpoint, Keynote, and Google Slides.


7 diapositivas
Mortgage Comparison Infographic
Make the home buying decision easier with our mortgage comparison infographic template. This user-friendly and visually engaging infographic allows you to compare different mortgage options, helping your audience make informed financial choices. Use the charts to illustrate how the loan term impacts the total cost of the mortgage, making it easier to choose the right term. Fully customizable and compatible with Powerpoint, Keynote, and Google Slides. With this template, you can demystify mortgage options and empower individuals to choose the mortgage that best fits their needs and financial goals.


5 diapositivas
Construction Processes Infographics
Dive into the construction industry with this detailed infographic template that provides a comprehensive overview of construction processes, careers, and competitive strategies. Ideal for professionals, educators, and students involved in construction, this resource offers a clear and structured presentation of various aspects of the field. The infographic is divided into sections detailing key areas such as industry sectors, job roles, and strategic approaches for sustainable competitiveness. It highlights important segments like planning, finance, legal aspects, and on-site construction activities, all designed to give a well-rounded view of the construction process. Additionally, it includes data on job growth, employment statistics, and future projections, which are crucial for understanding labor market trends within the construction sector. Vibrant colors and easy-to-understand layouts make this template not only informative but also visually appealing. Whether used in training sessions, academic courses, or professional presentations, this infographic is a valuable tool for conveying the dynamic and multifaceted nature of the construction industry.


5 diapositivas
Global Nonprofit Help Infographics
A global nonprofit organization is a type of organization that operates on an international scale and focuses on making a positive impact on a global scale. These vertical infographics focuses on the impact and importance of nonprofit organizations worldwide. This is ideal for showcasing the achievements and goals of nonprofits in addressing various global issues, such as poverty, healthcare, and environmental conservation. The infographics include a collection of captivating icons and illustrations related to nonprofit work. These slides allow you to present compelling stories, case studies, and success stories that demonstrate the real-world impact of nonprofit work.


2 diapositivas
Eye-Catching Title Cover Slide Presentation
Capture attention instantly with this bold, modern title cover slide. Featuring vibrant colors, oversized geometric shapes, and strong typography, this layout is ideal for setting the tone in creative, marketing, or business presentations. The design is fully editable and compatible with PowerPoint, Keynote, and Google Slides—making it easy to tailor to your brand and message.


6 diapositivas
OKR Goal-Setting Framework
Clarify your goals and drive performance with this OKR-based layout that maps Objectives, Key Activities, and Results in a clear, actionable format. Ideal for teams, managers, and performance reviews. Each section is fully editable to match your organizational strategy. Compatible with PowerPoint, Keynote, and Google Slides.


20 diapositivas
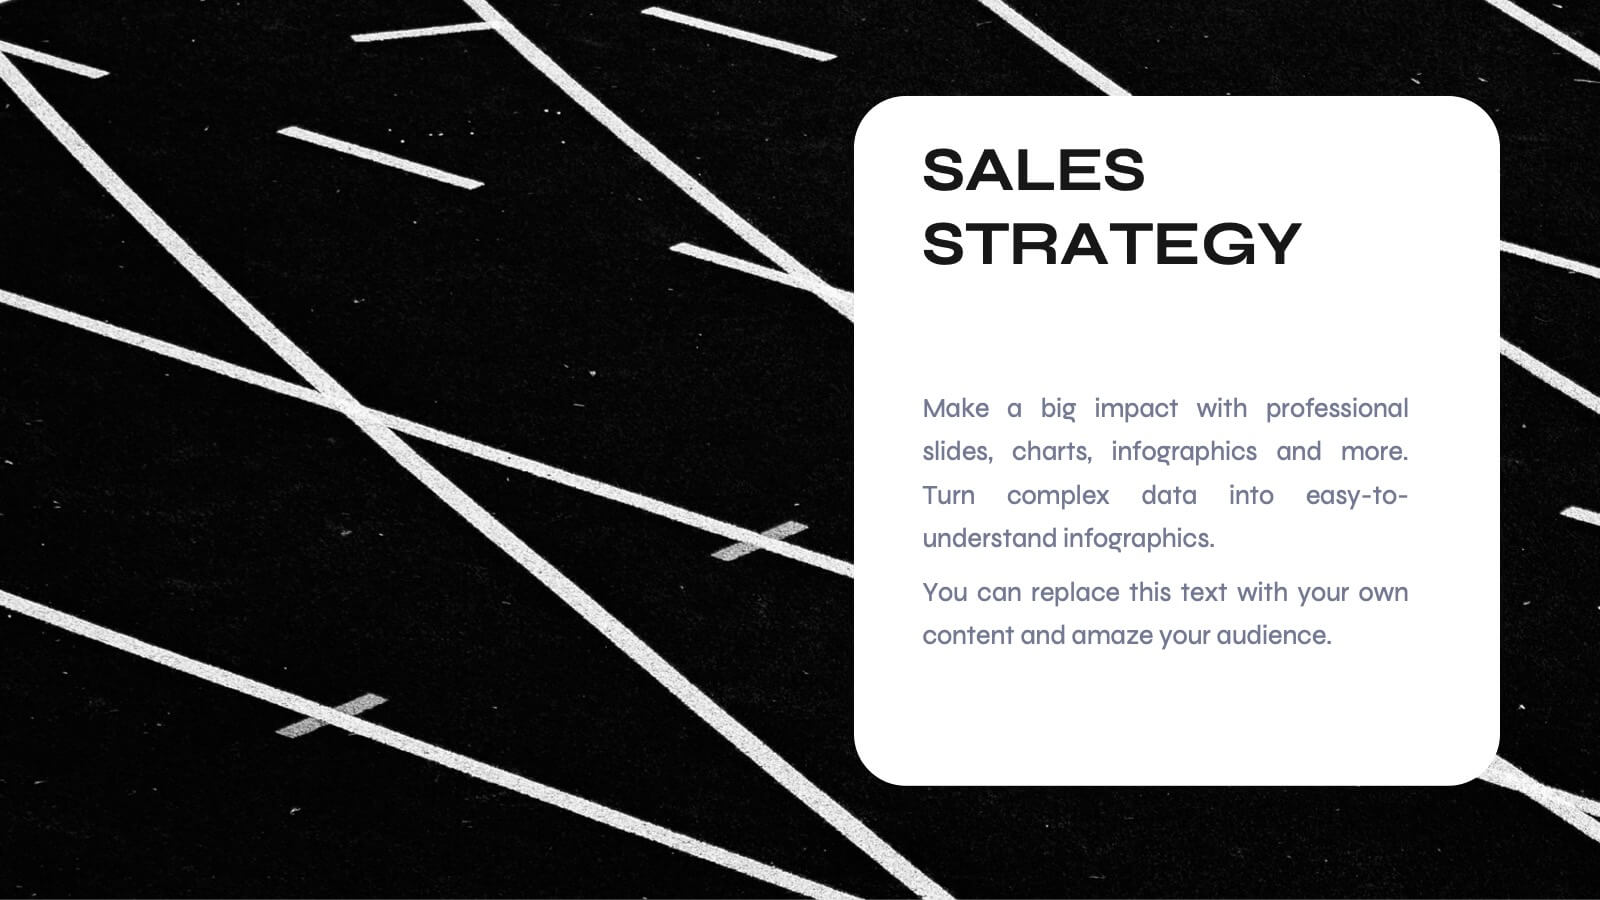
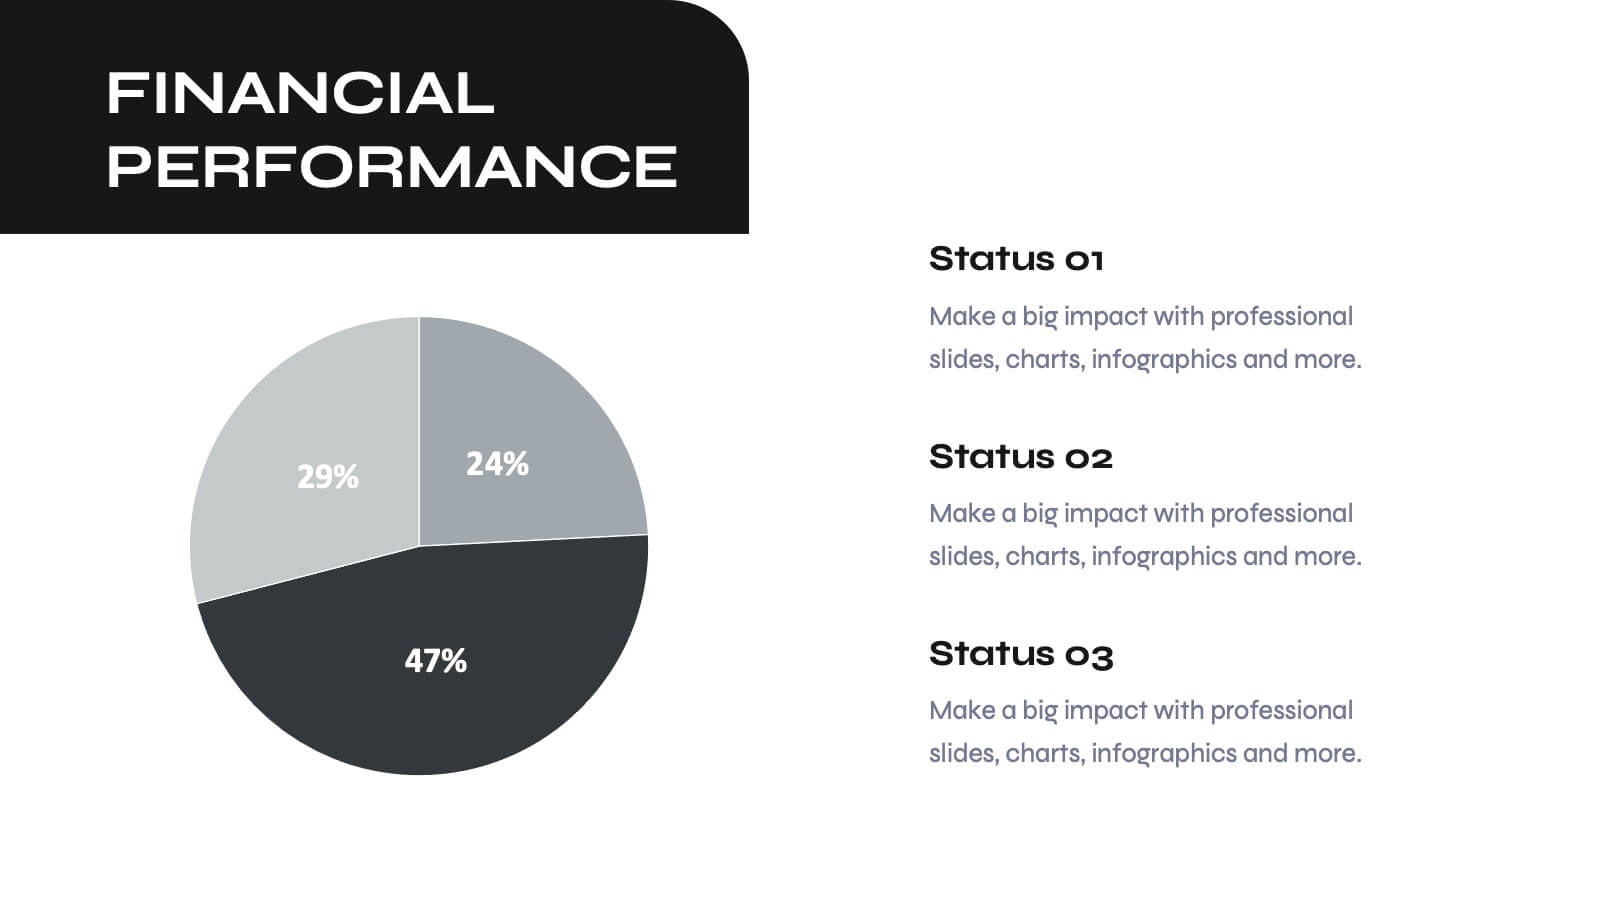
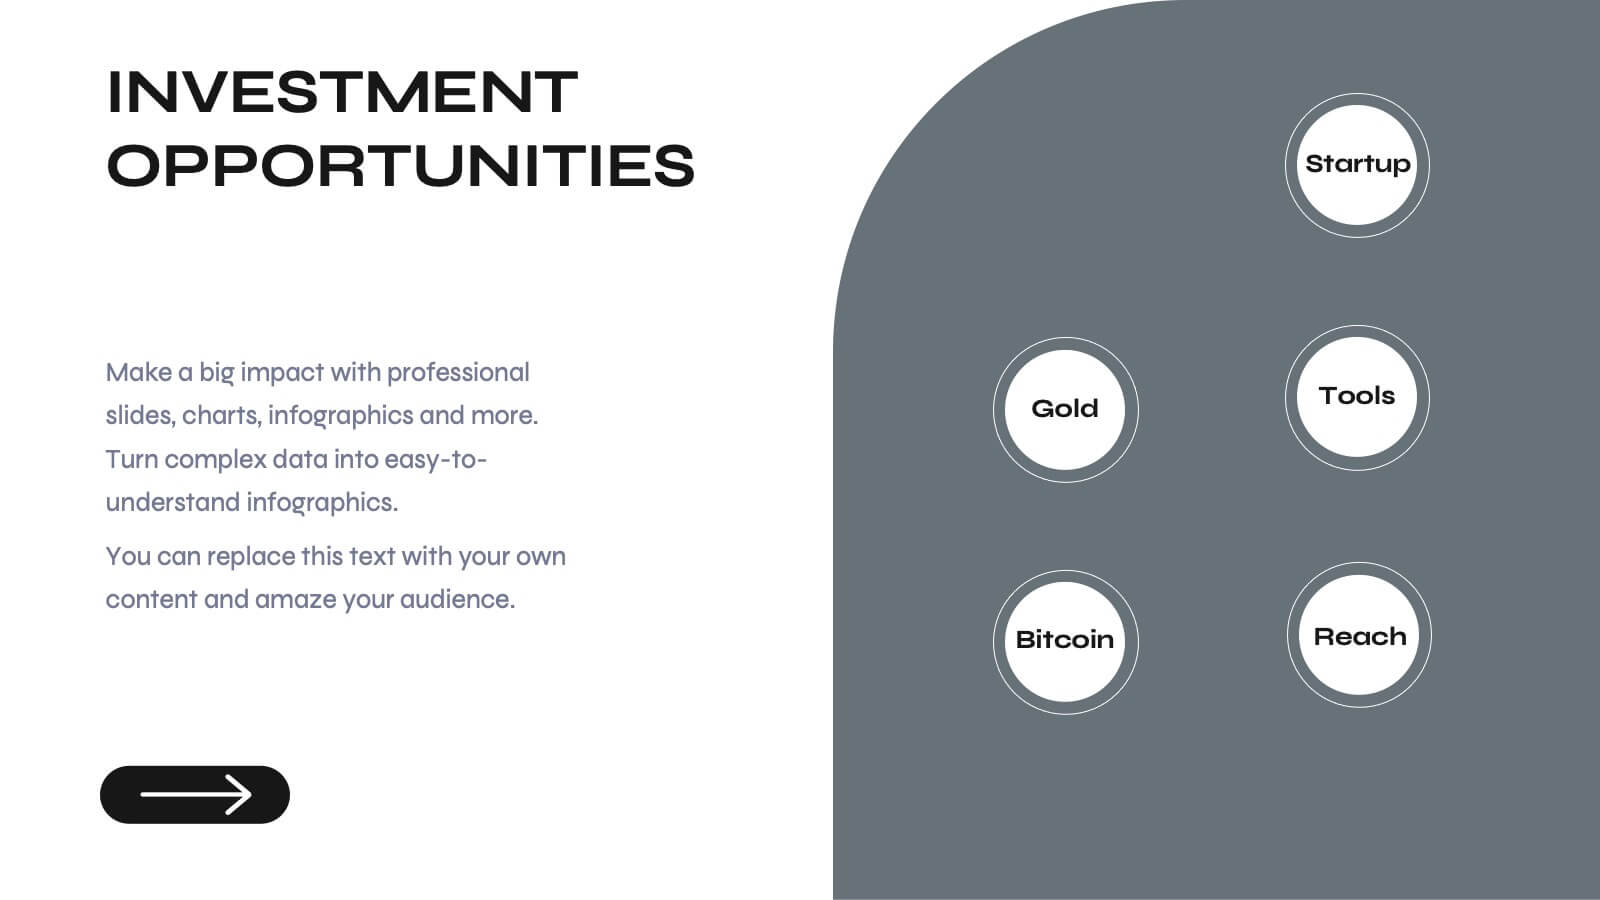
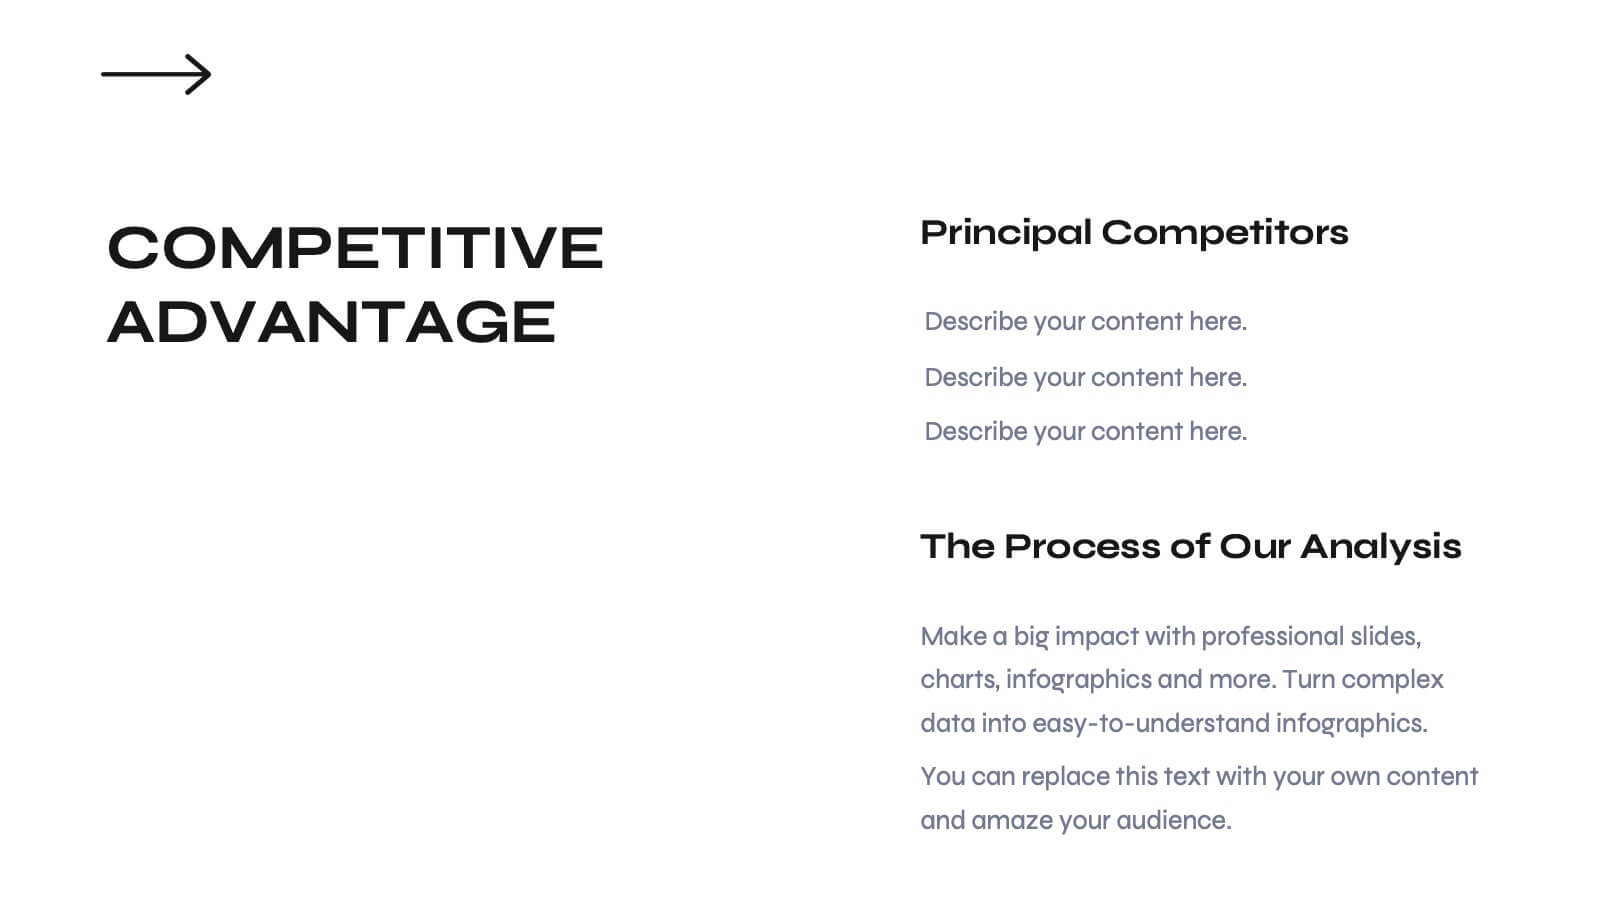
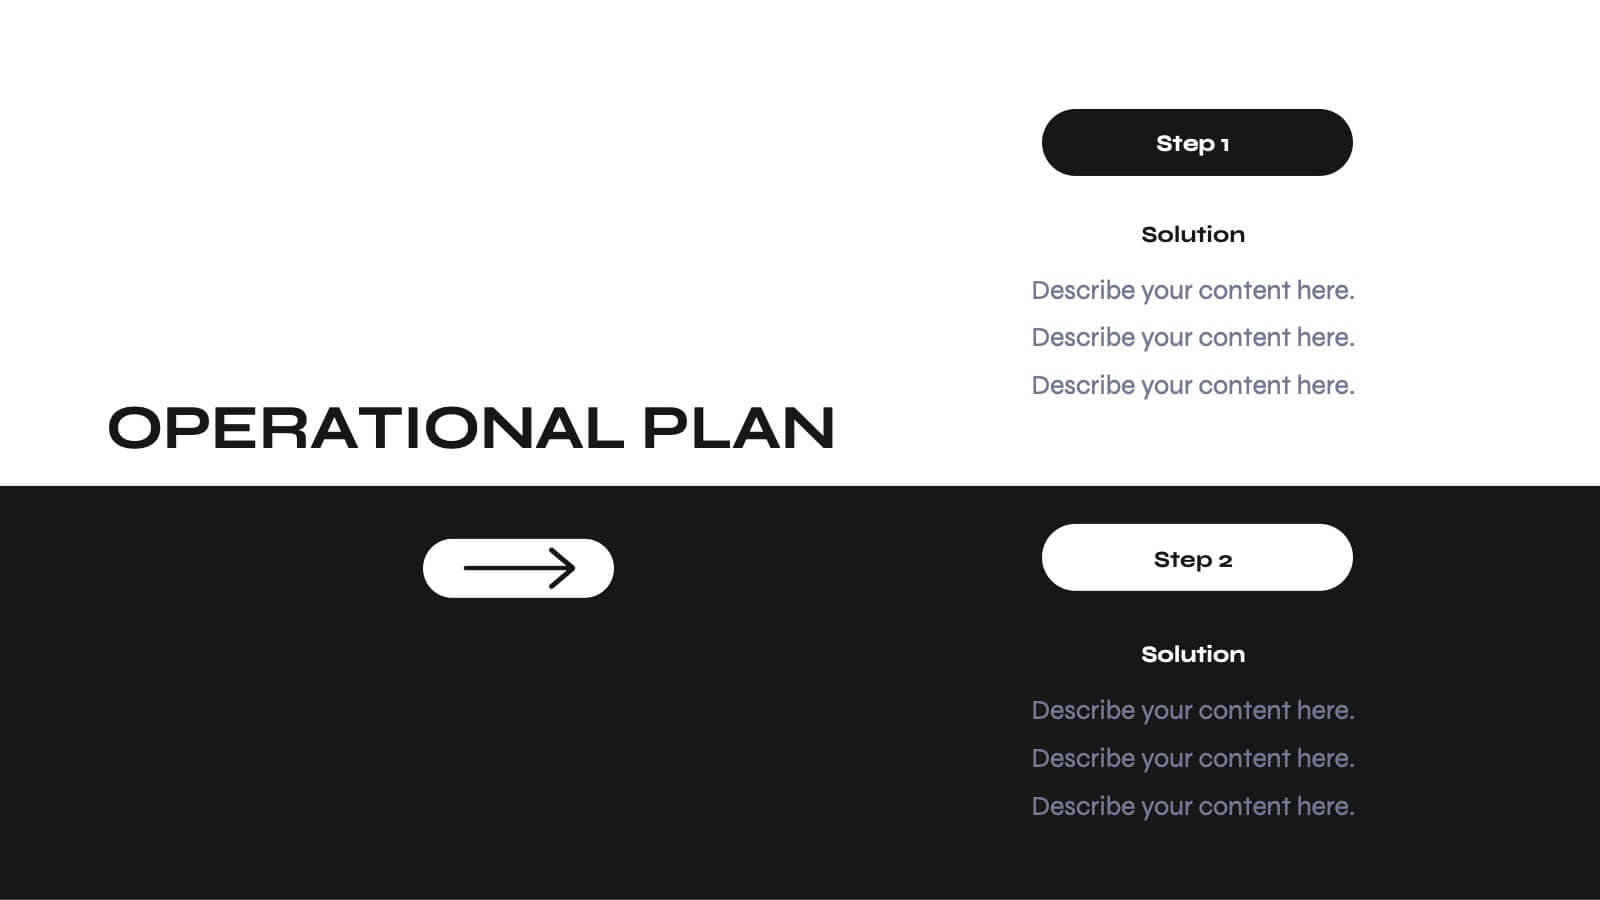
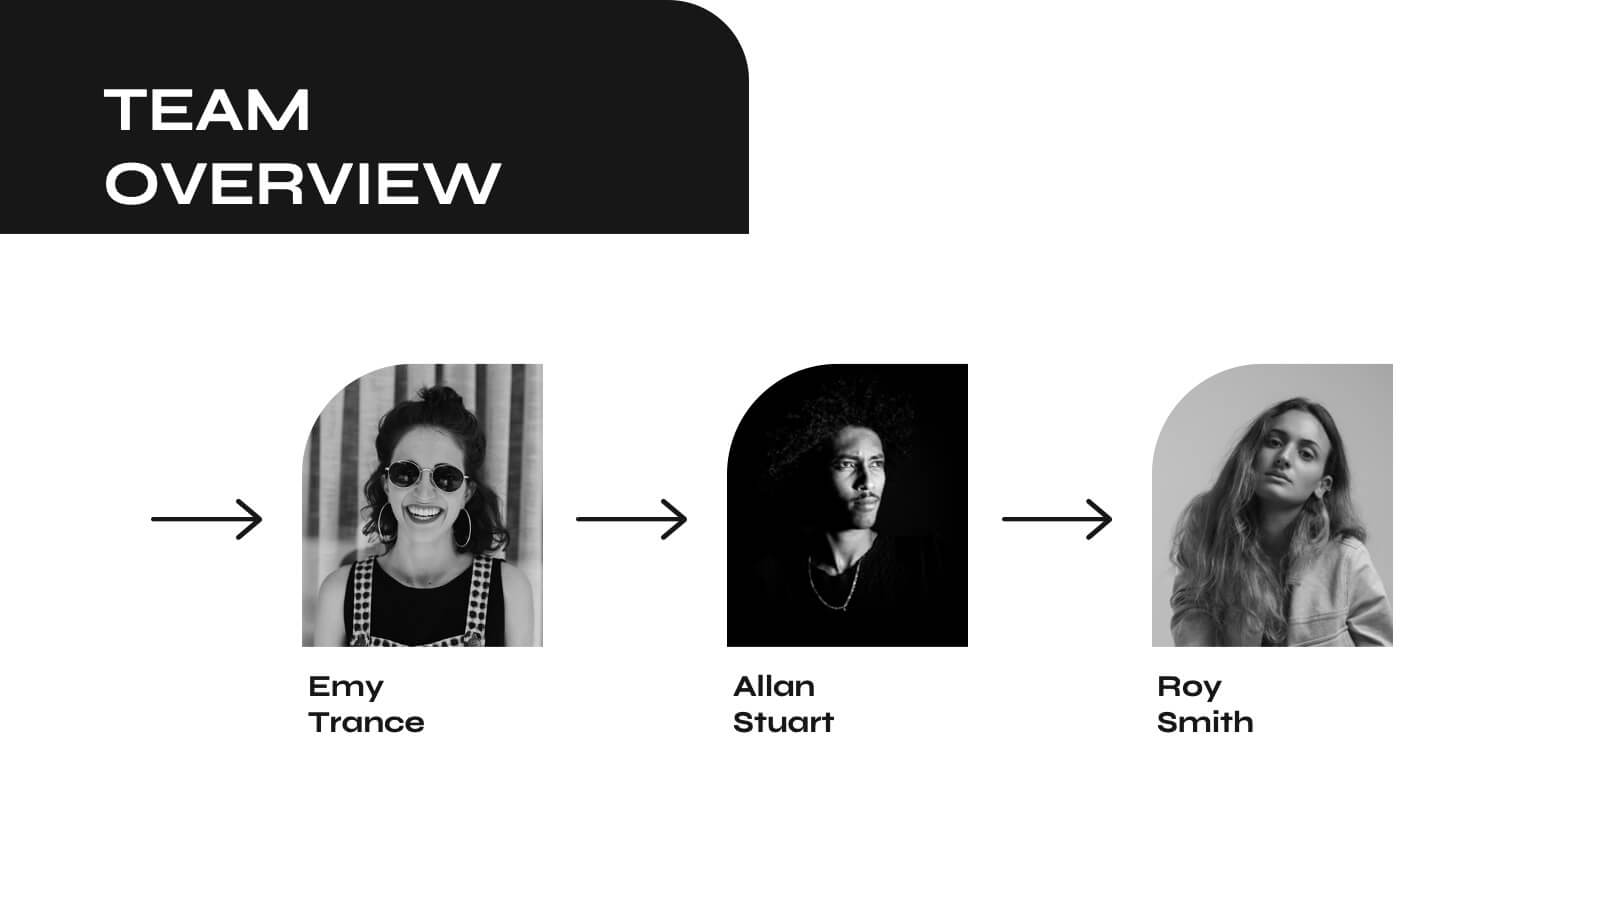
Fluxion Product Launch Pitch Deck Presentation
Launch your next big idea with this sleek and impactful pitch deck! Featuring sections like market opportunities, business model, revenue streams, and team introductions, it ensures a persuasive narrative for investors. Perfect for startup launches or product pitches, this deck works seamlessly with PowerPoint, Keynote, and Google Slides.


21 diapositivas
Flare Project Management Plan Presentation
Unleash the full potential of your projects with a dynamic plan template that makes every detail shine! This vibrant and clear design is built to guide your team and stakeholders through every phase of your project with confidence and clarity. Starting with a compelling introduction and project overview, this template captures attention and sets the stage for success. Dive deep into problem statements, objectives, and the scope of work, all presented in a visually appealing and easy-to-digest format. With sections dedicated to timelines, milestones, budget breakdowns, and resource allocation, this template ensures every aspect of your project is meticulously planned and communicated. The inclusion of stakeholder analysis, risk management, and quality assurance plans showcases your thorough approach to project management. Perfectly compatible with PowerPoint, Keynote, and Google Slides, this template is your go-to tool for creating project plans that are both inspiring and effective. Get ready to impress and lead your projects to success!


4 diapositivas
Clinical Workflow and Patient Info Layout Presentation
Visualize patient pathways with the Clinical Workflow and Patient Info Layout Presentation. This diagram-based template simplifies complex clinical processes using a clear, step-by-step structure with decision nodes and action points. Ideal for hospital teams, medical administrators, and EHR system walkthroughs. Fully customizable in PowerPoint, Keynote, Google Slides, and Canva.


6 diapositivas
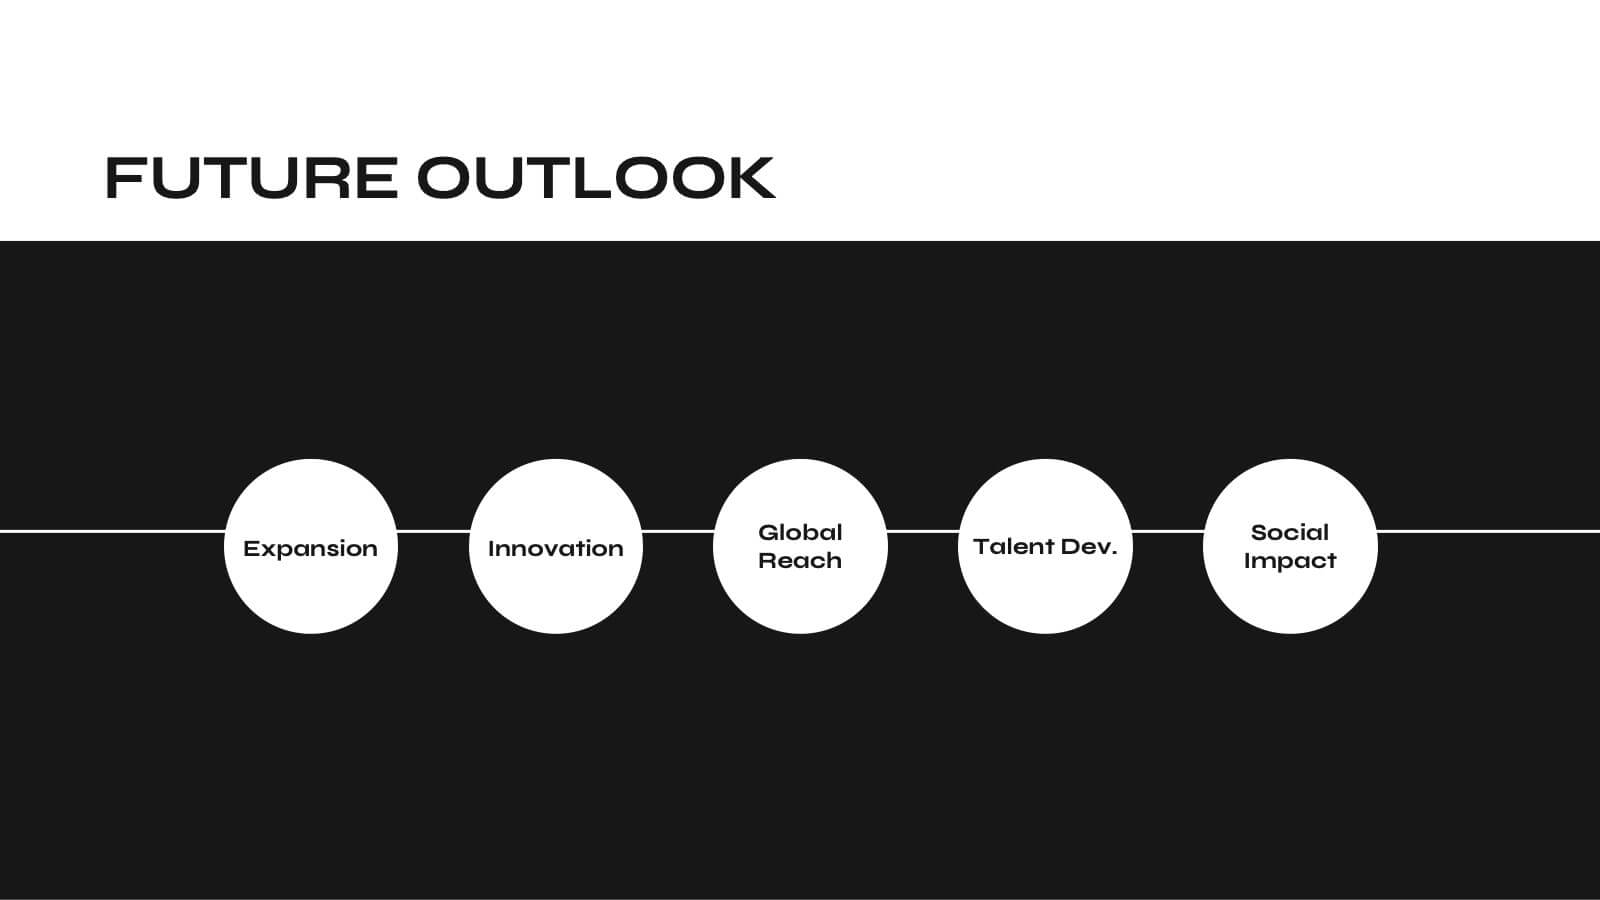
Team Vision Infographic
Explore our collection of Slide Templates tailored to showcase your team's vision and future ambitions. These templates offer a blend of modern and professional designs that are perfect for laying out your team's objectives and strategies. Each slide is crafted to facilitate clear communication of your vision, ensuring every team member is aligned and motivated. These visually appealing templates are ideal for team meetings, strategic planning sessions, and leadership presentations. They are fully customizable, allowing you to adapt the colors, text, and graphics to match your team's identity and goals. Optimize your team's presentations with these versatile templates, designed to promote understanding and enthusiasm for your collective vision.

1 diapositiva
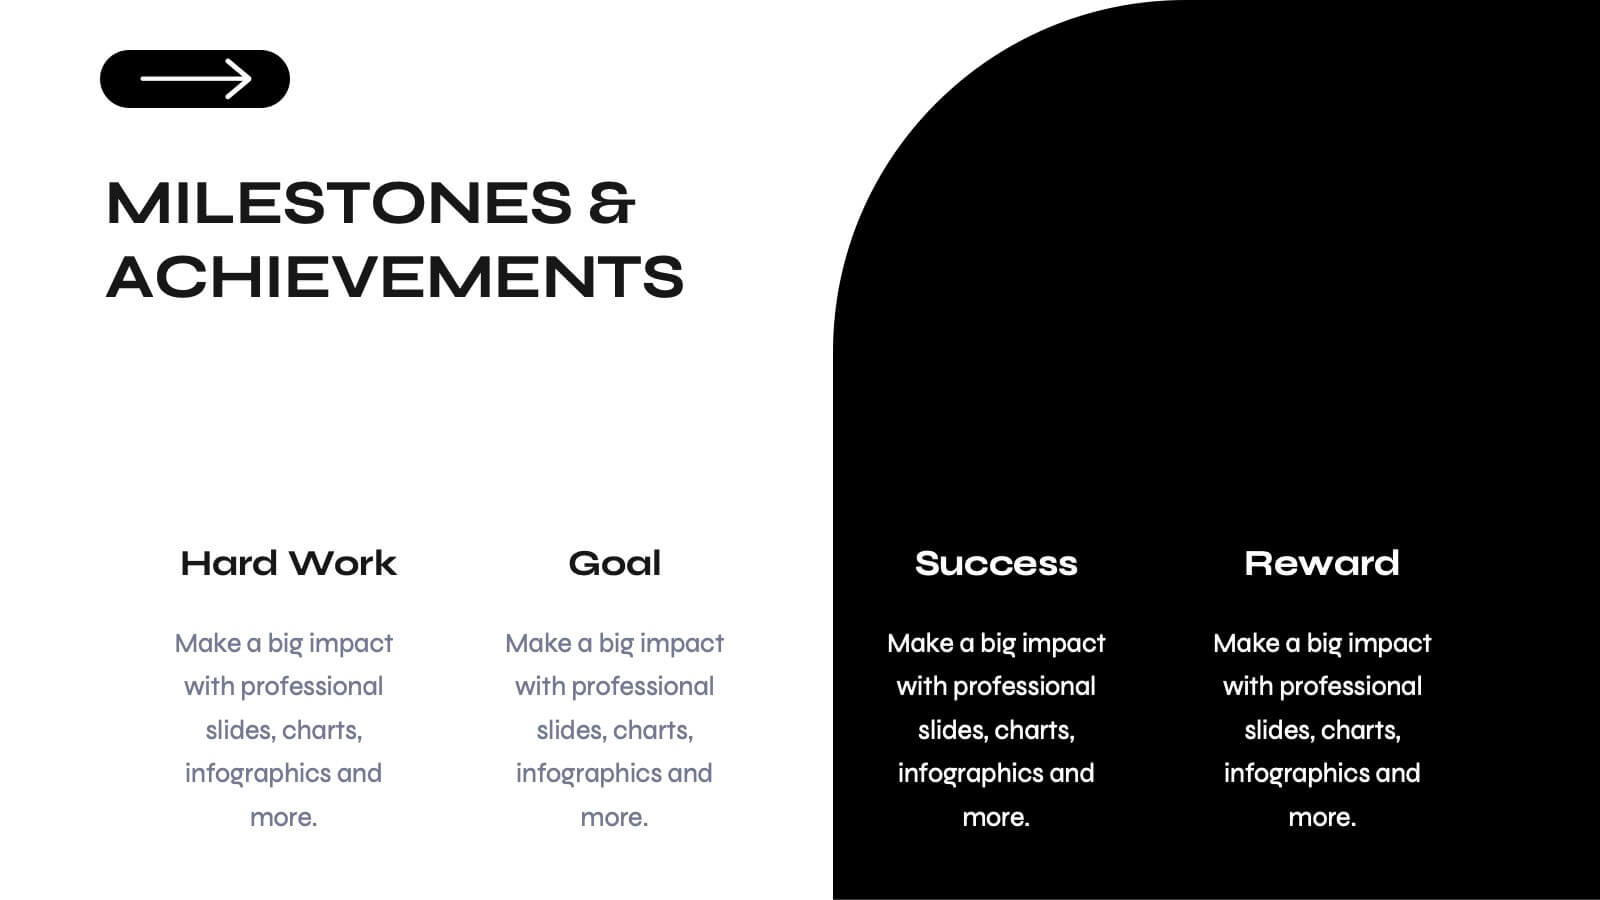
Success Roadmap and Personal Achievement Presentation
Visualize your path to success with the Success Roadmap and Personal Achievement Presentation. This stepwise layout guides your audience through key milestones, making it perfect for showcasing personal growth, career progression, or business achievements. Each step features a distinct icon and space for focused insights. Fully editable in Canva, PowerPoint, Keynote, and Google Slides.


21 diapositivas
Harpy Product Development Plan Presentation
Present your product development plan with precision using this comprehensive and visually engaging template! It covers essential sections like product features, target market, pricing strategy, competitive analysis, and production process to ensure every aspect is communicated effectively. Perfect for product teams or client pitches, it’s fully compatible with PowerPoint, Keynote, and Google Slides.


23 diapositivas
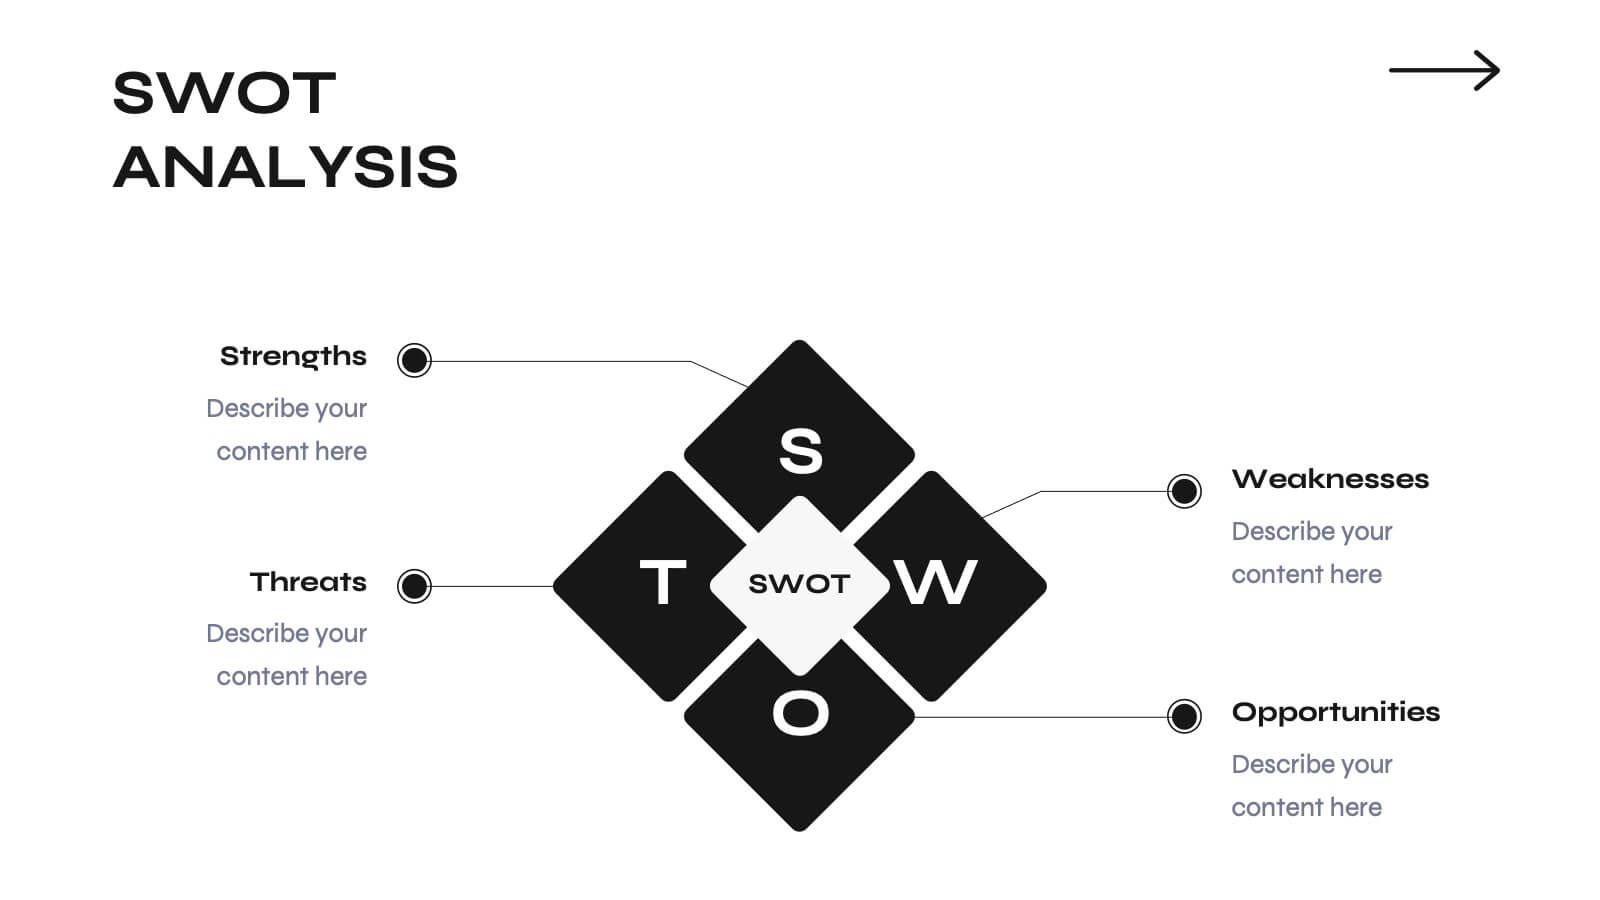
Odyssey Small Business Pitch Deck Presentation
Elevate your business pitch with this sleek, monochrome presentation template. Perfect for presenting company backgrounds, market opportunities, and financial performance, it features a minimalist design that enhances clarity and impact. Highlight your value proposition and strategic plans to captivate investors. Compatible with PowerPoint, Keynote, and Google Slides, it ensures seamless presentations on any platform.


6 diapositivas
Concentric Circles Strategy Infographics
Visualize your strategic approach with our Concentric Circles Strategy infographic template. This template is fully compatible with popular presentation software like PowerPoint, Keynote, and Google Slides, allowing you to easily customize it to illustrate and communicate your concentric circles strategy. The Concentric Circles Strategy infographic template offers a visually engaging platform to depict your strategy's core, intermediate, and peripheral elements. Whether you're a business leader, strategist, or planner, this template provides a user-friendly canvas to create informative presentations and effectively communicate your strategic vision. Enhance your strategic planning with this SEO-optimized Concentric Circles Strategy infographic template, thoughtfully designed for clarity and ease of use. Customize it to highlight the key components of your concentric circles strategy, ensuring that your team and stakeholders grasp the strategic direction clearly. Start crafting your personalized infographic today to drive alignment and execution of your strategic goals.


5 diapositivas
Water Problems Infographics
Water Problems refer to the various issues that arise due to the scarcity, pollution, or mismanagement of water resources. These vertical infographics are perfect for addressing various issues related to water management and conservation. They are effective tools for raising awareness about water-related issues and promoting sustainable water management practices. This template is completely customizable and includes various icons and images related to water such as water droplets, faucets, and ocean waves. The color scheme is predominantly blue, signifying the importance of water conservation and preservation.


5 diapositivas
IT Infrastructure and Architecture
Visualize your tech ecosystem with this layered pyramid infographic designed for showcasing IT infrastructure components. Ideal for CIOs, network architects, or IT consultants, this slide highlights five essential levels—from hardware to services. Fully editable in PowerPoint, Keynote, and Google Slides.


5 diapositivas
Ishikawa Fishbone Diagram Presentation
Bring clarity to problem-solving with a visual that makes root-cause analysis feel simple and intuitive. This presentation helps you map issues, organize insights, and highlight contributing factors with clean, structured design. Perfect for workshops, audits, and process improvement. Fully compatible with PowerPoint, Keynote, and Google Slides.