


Características


¿Tienes alguna pregunta?
Recomendar


7 diapositivas
7 Elements of McKinsey Framework Presentation
Turn complex organizational elements into a simple, story-driven visual with a clean layout that highlights how each component connects back to core values. This presentation helps you explain relationships, improve alignment, and support strategic decision-making with clarity and ease. Fully editable and compatible with PowerPoint, Keynote, and Google Slides.


23 diapositivas
Halo Digital Strategy Presentation
Elevate your digital strategy presentations with this vibrant, professional template. Perfect for showcasing market trends, SWOT analysis, and strategic objectives, it features a modern layout with a cohesive color scheme. Highlight key elements like growth opportunities, value propositions, and performance metrics to captivate your audience. Compatible with PowerPoint, Keynote, and Google Slides, it ensures seamless presentations on any platform.


6 diapositivas
Business Structure Outline Presentation
Visualize your company’s framework with this modern business structure slide. Perfect for showcasing team roles, departments, or organizational functions, it helps simplify complex relationships into a clear overview. Easily editable in Canva, PowerPoint, and Google Slides—ideal for presentations, planning sessions, or onboarding new employees with a professional, easy-to-follow design.


26 diapositivas
Flowers Bold Company Profile Presentation
Step into the enchanting garden of happy flowers, where petals dance and colors sing. Our template, awash in sunlit shades of pink, yellow, orange, and blue, encapsulates the very essence of floral joy. Bursting with vibrant graphics, whimsical icons, and cheerful image placeholders, it's a bouquet of design brilliance. Crafted to perfection for Powerpoint, Keynote, or Google Slides. A delightful pick for florists, garden enthusiasts, event planners, or anyone looking to infuse their presentation with a touch of nature's merriment. Blossom your ideas; let your presentations bloom with happiness.


6 diapositivas
Clear Roadmap and Action Strategy Presentation
Present your strategic roadmap with clarity using this arrow-step diagram. Ideal for visualizing processes, workflows, or goal-driven action plans. The curved sequence highlights five progressive steps with icons and color coding. Fully customizable in PowerPoint, Keynote, or Google Slides—perfect for business strategy meetings, project planning, or milestone tracking.


24 diapositivas
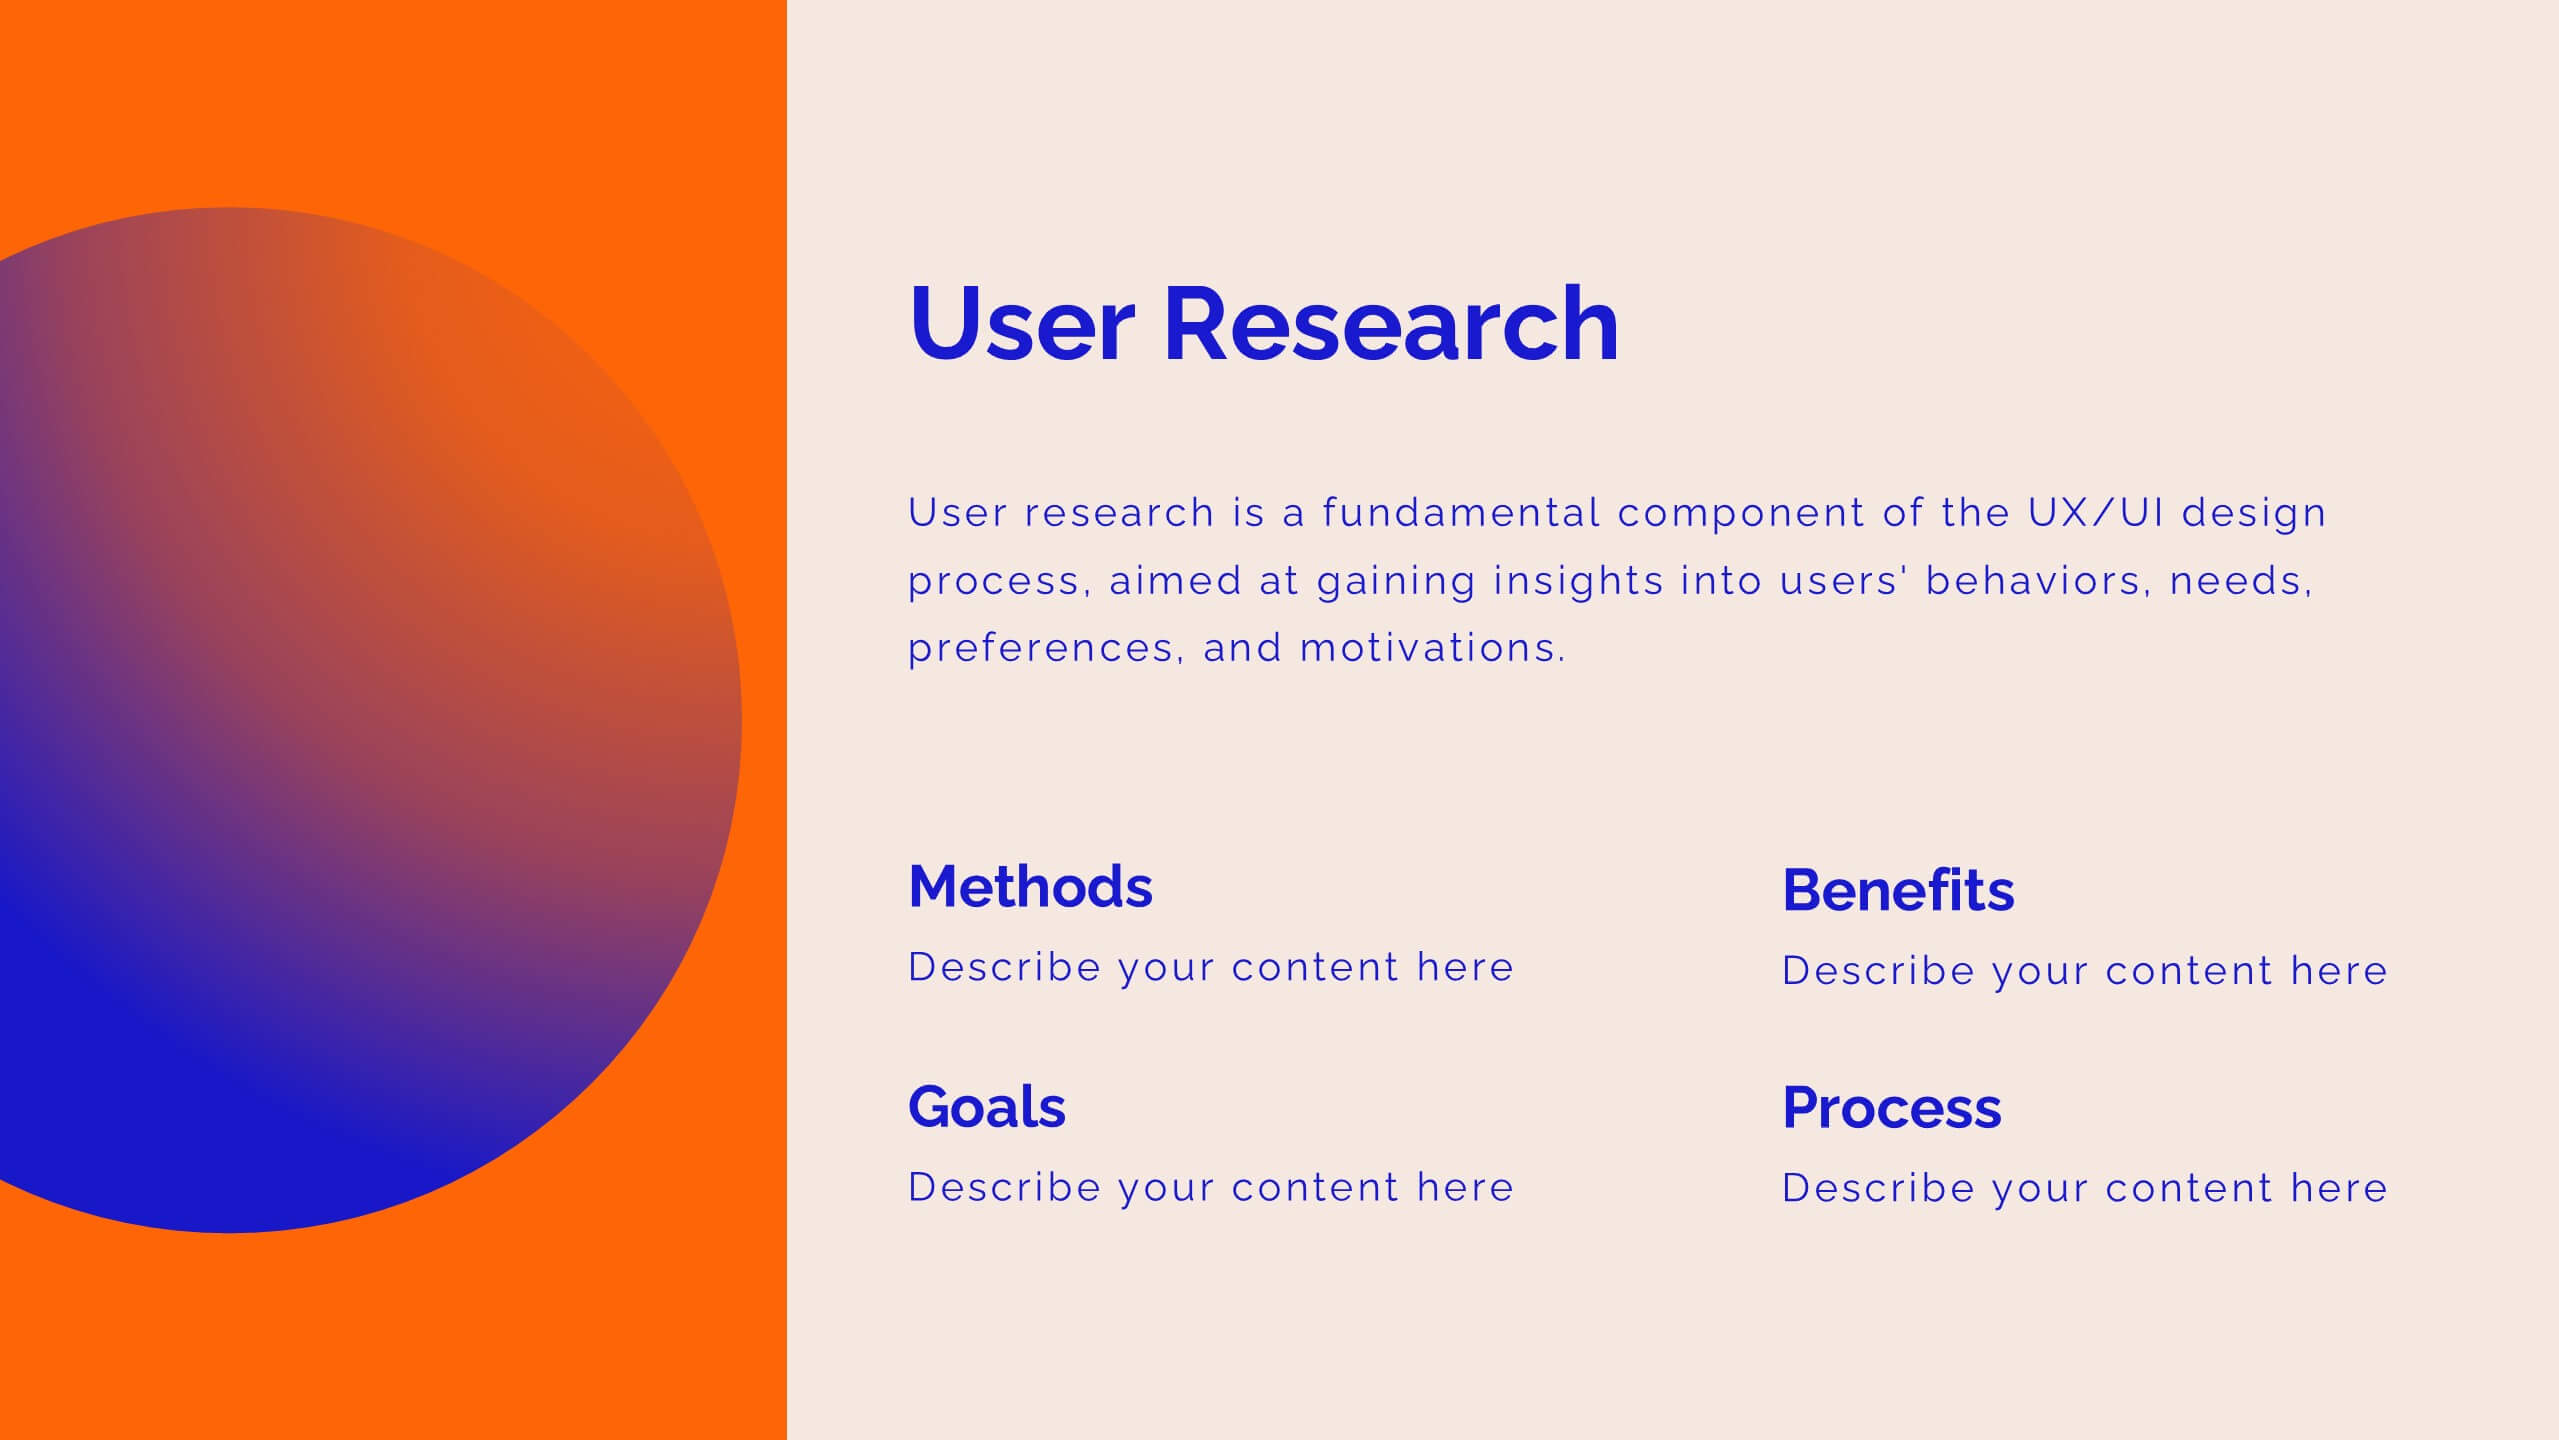
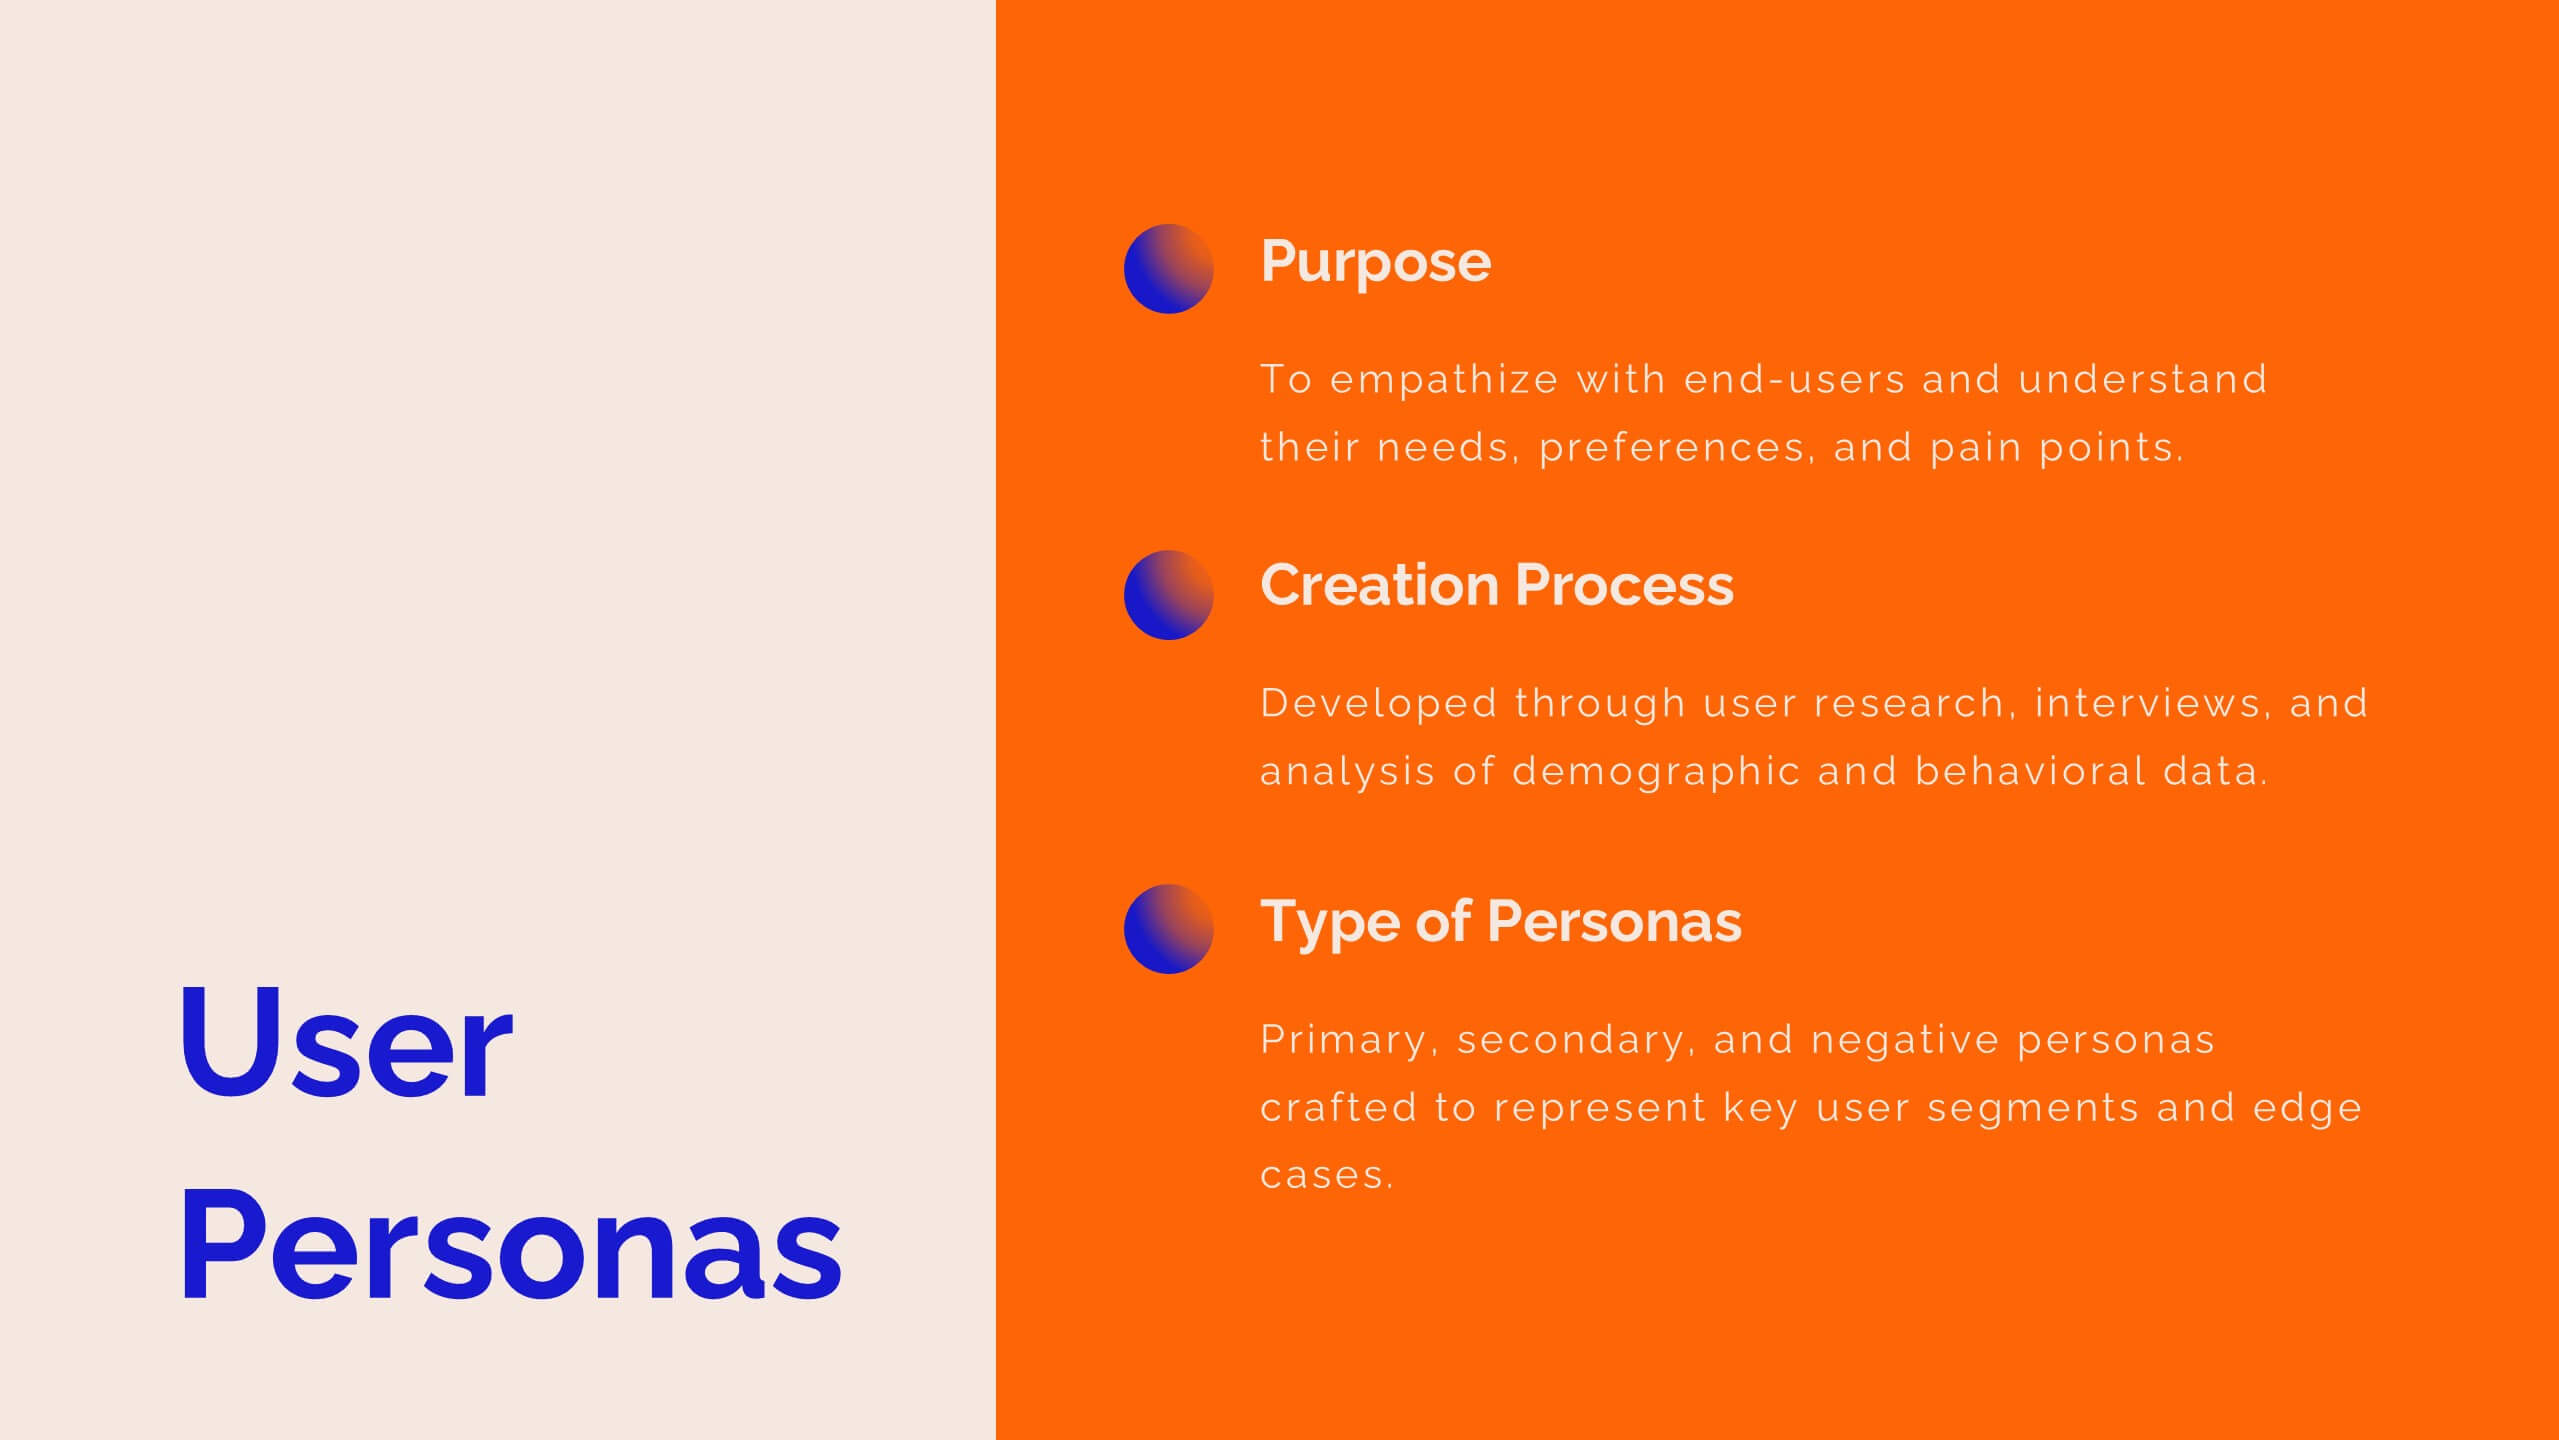
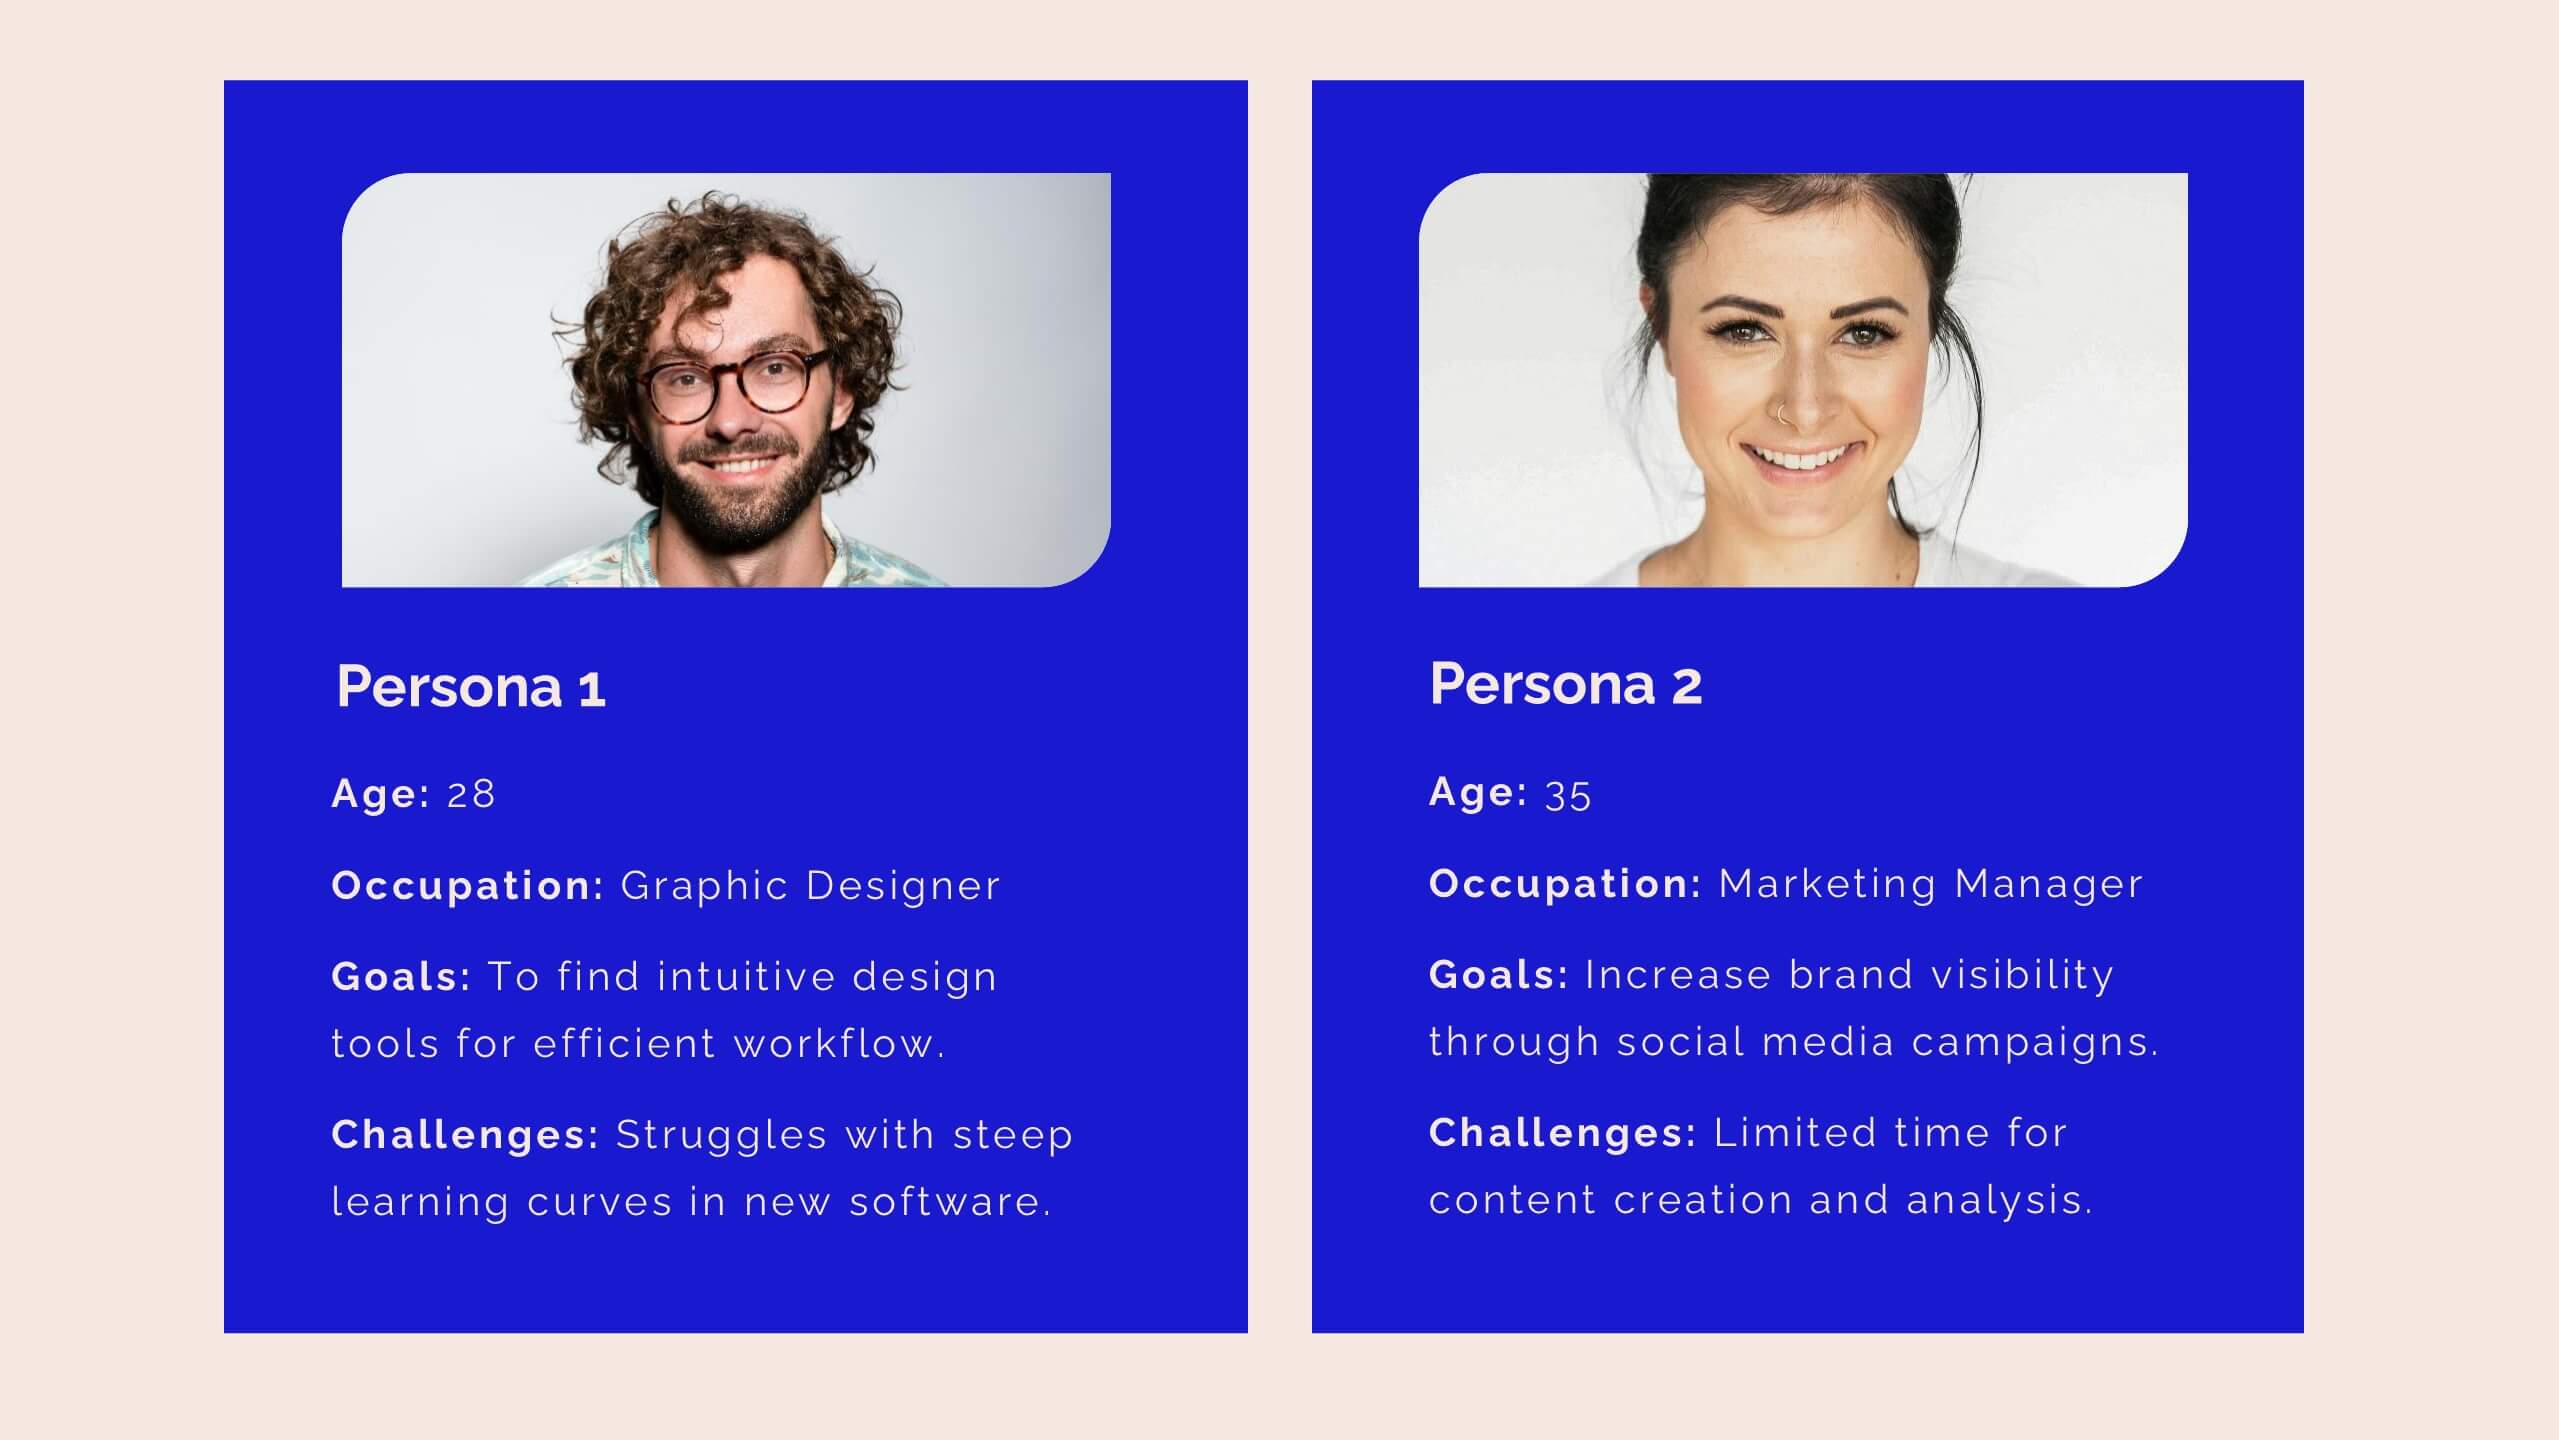
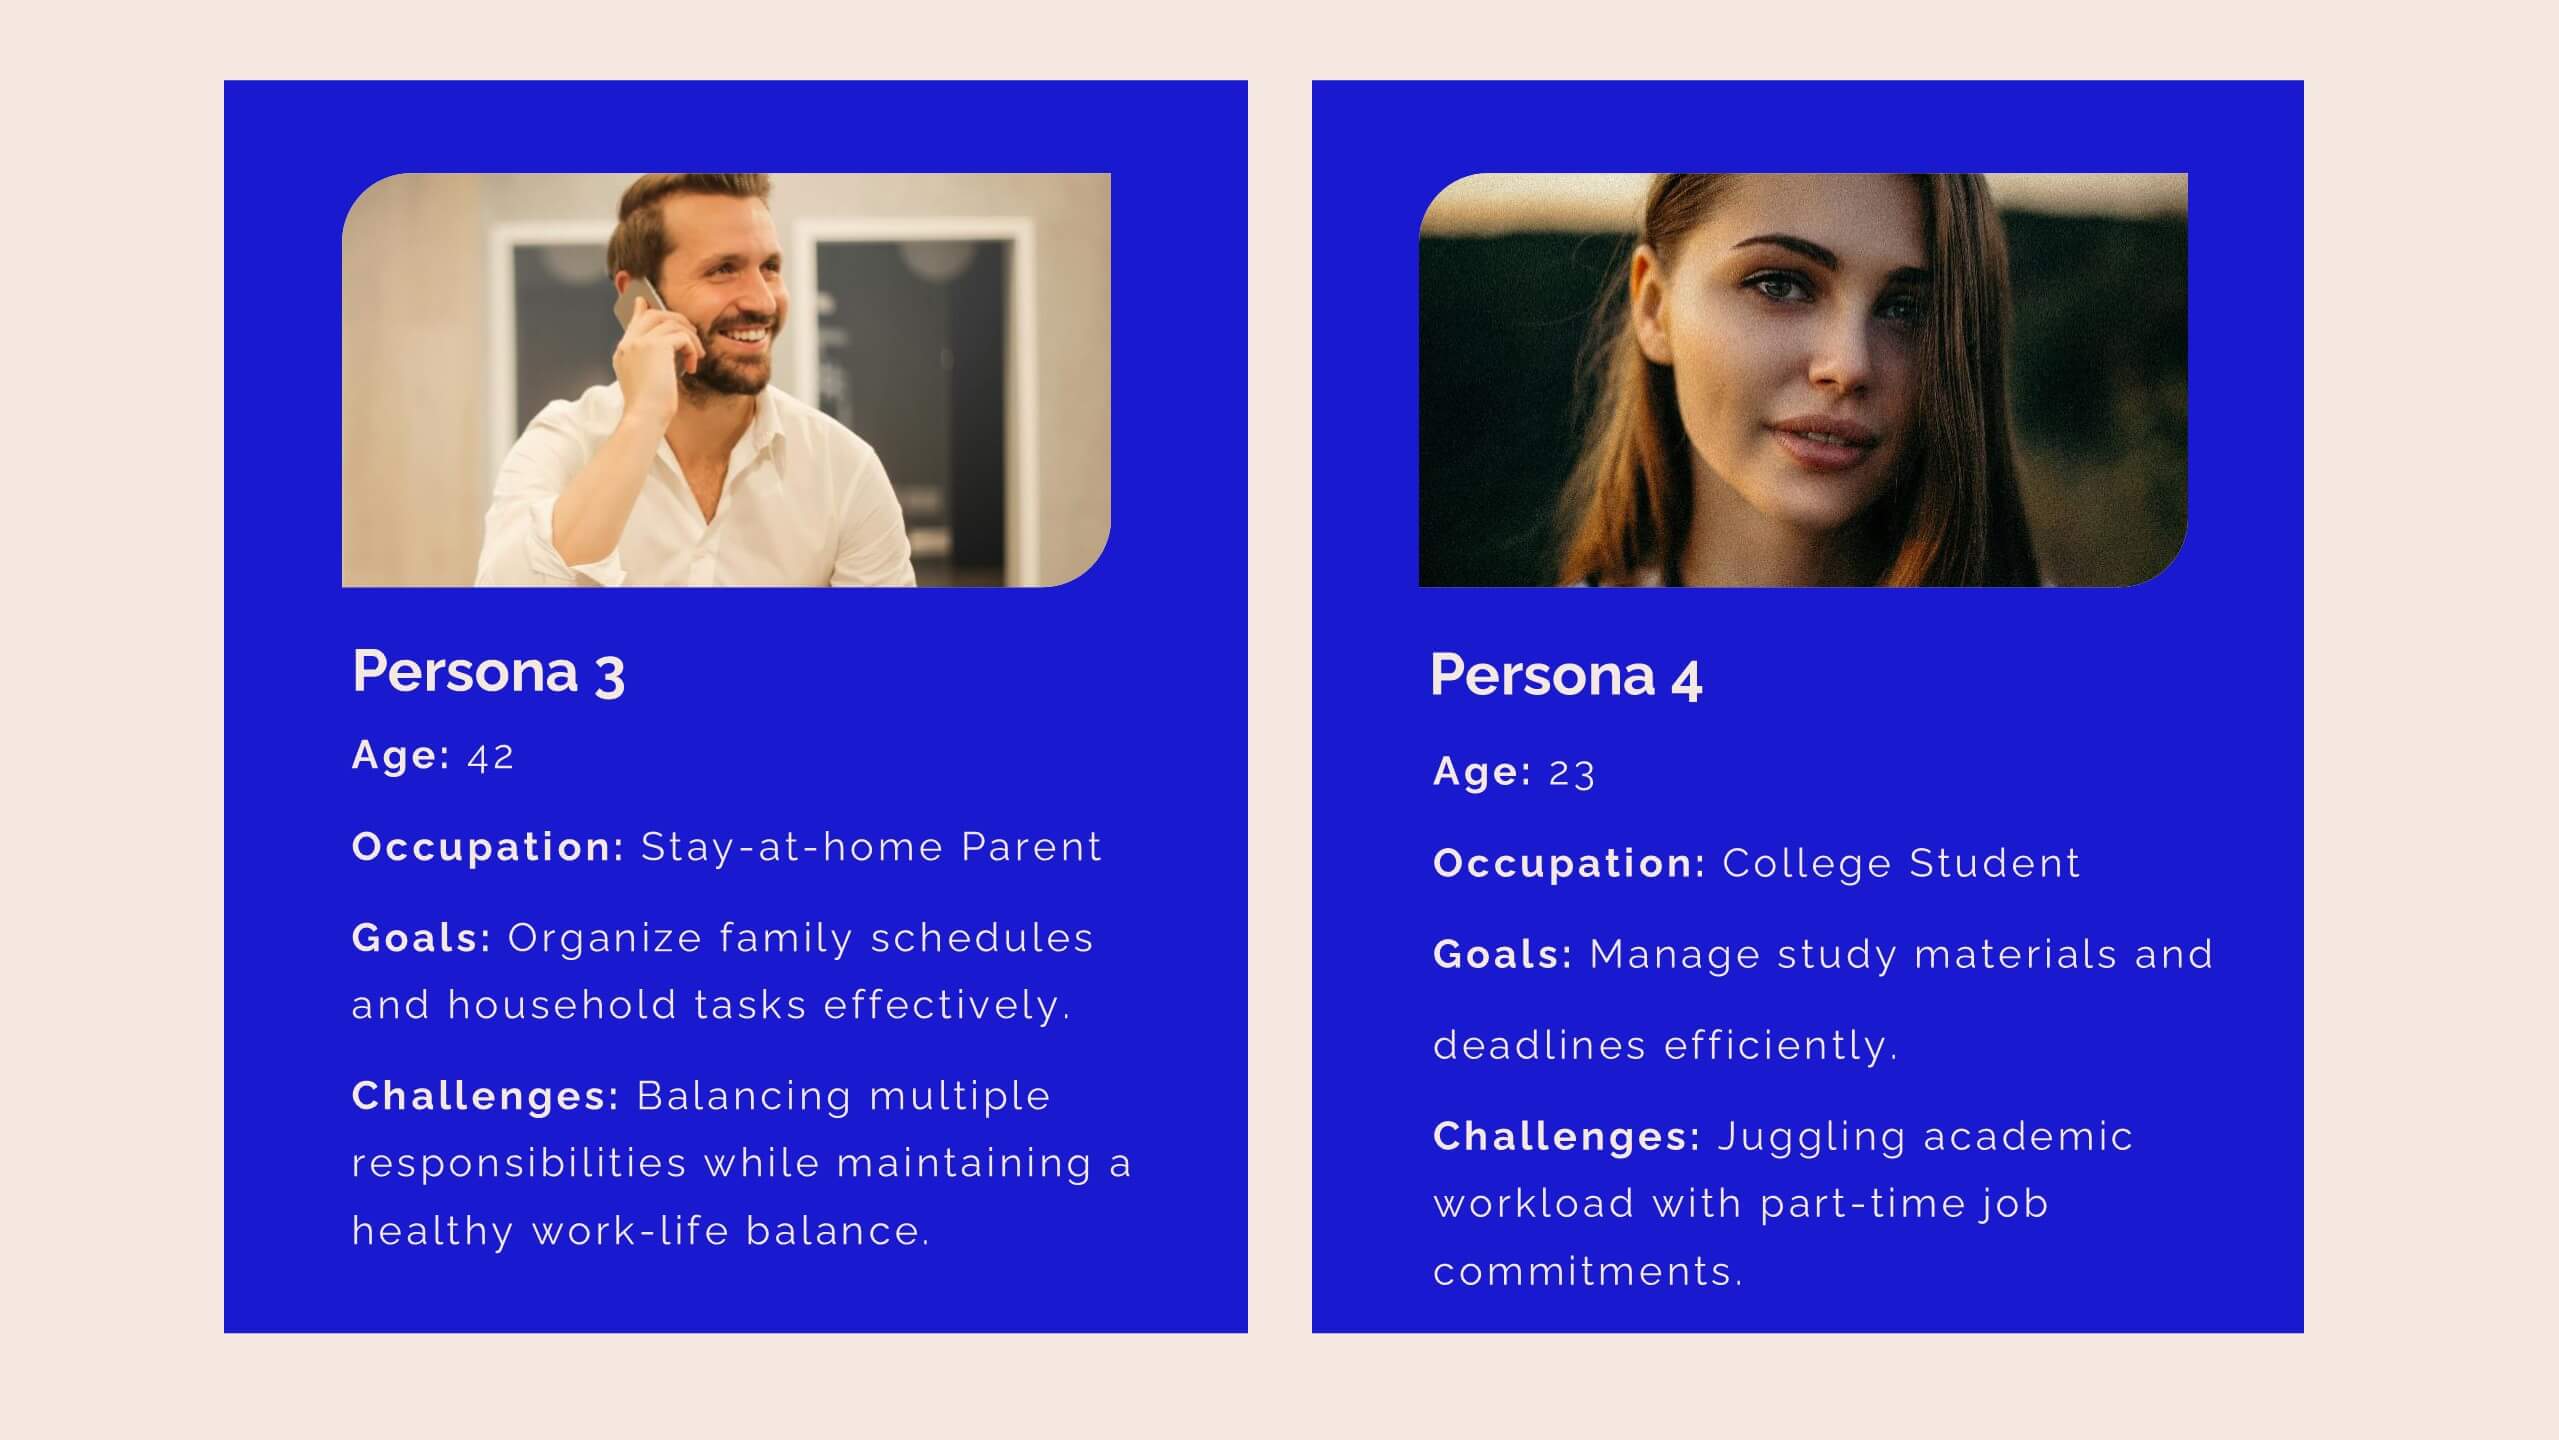
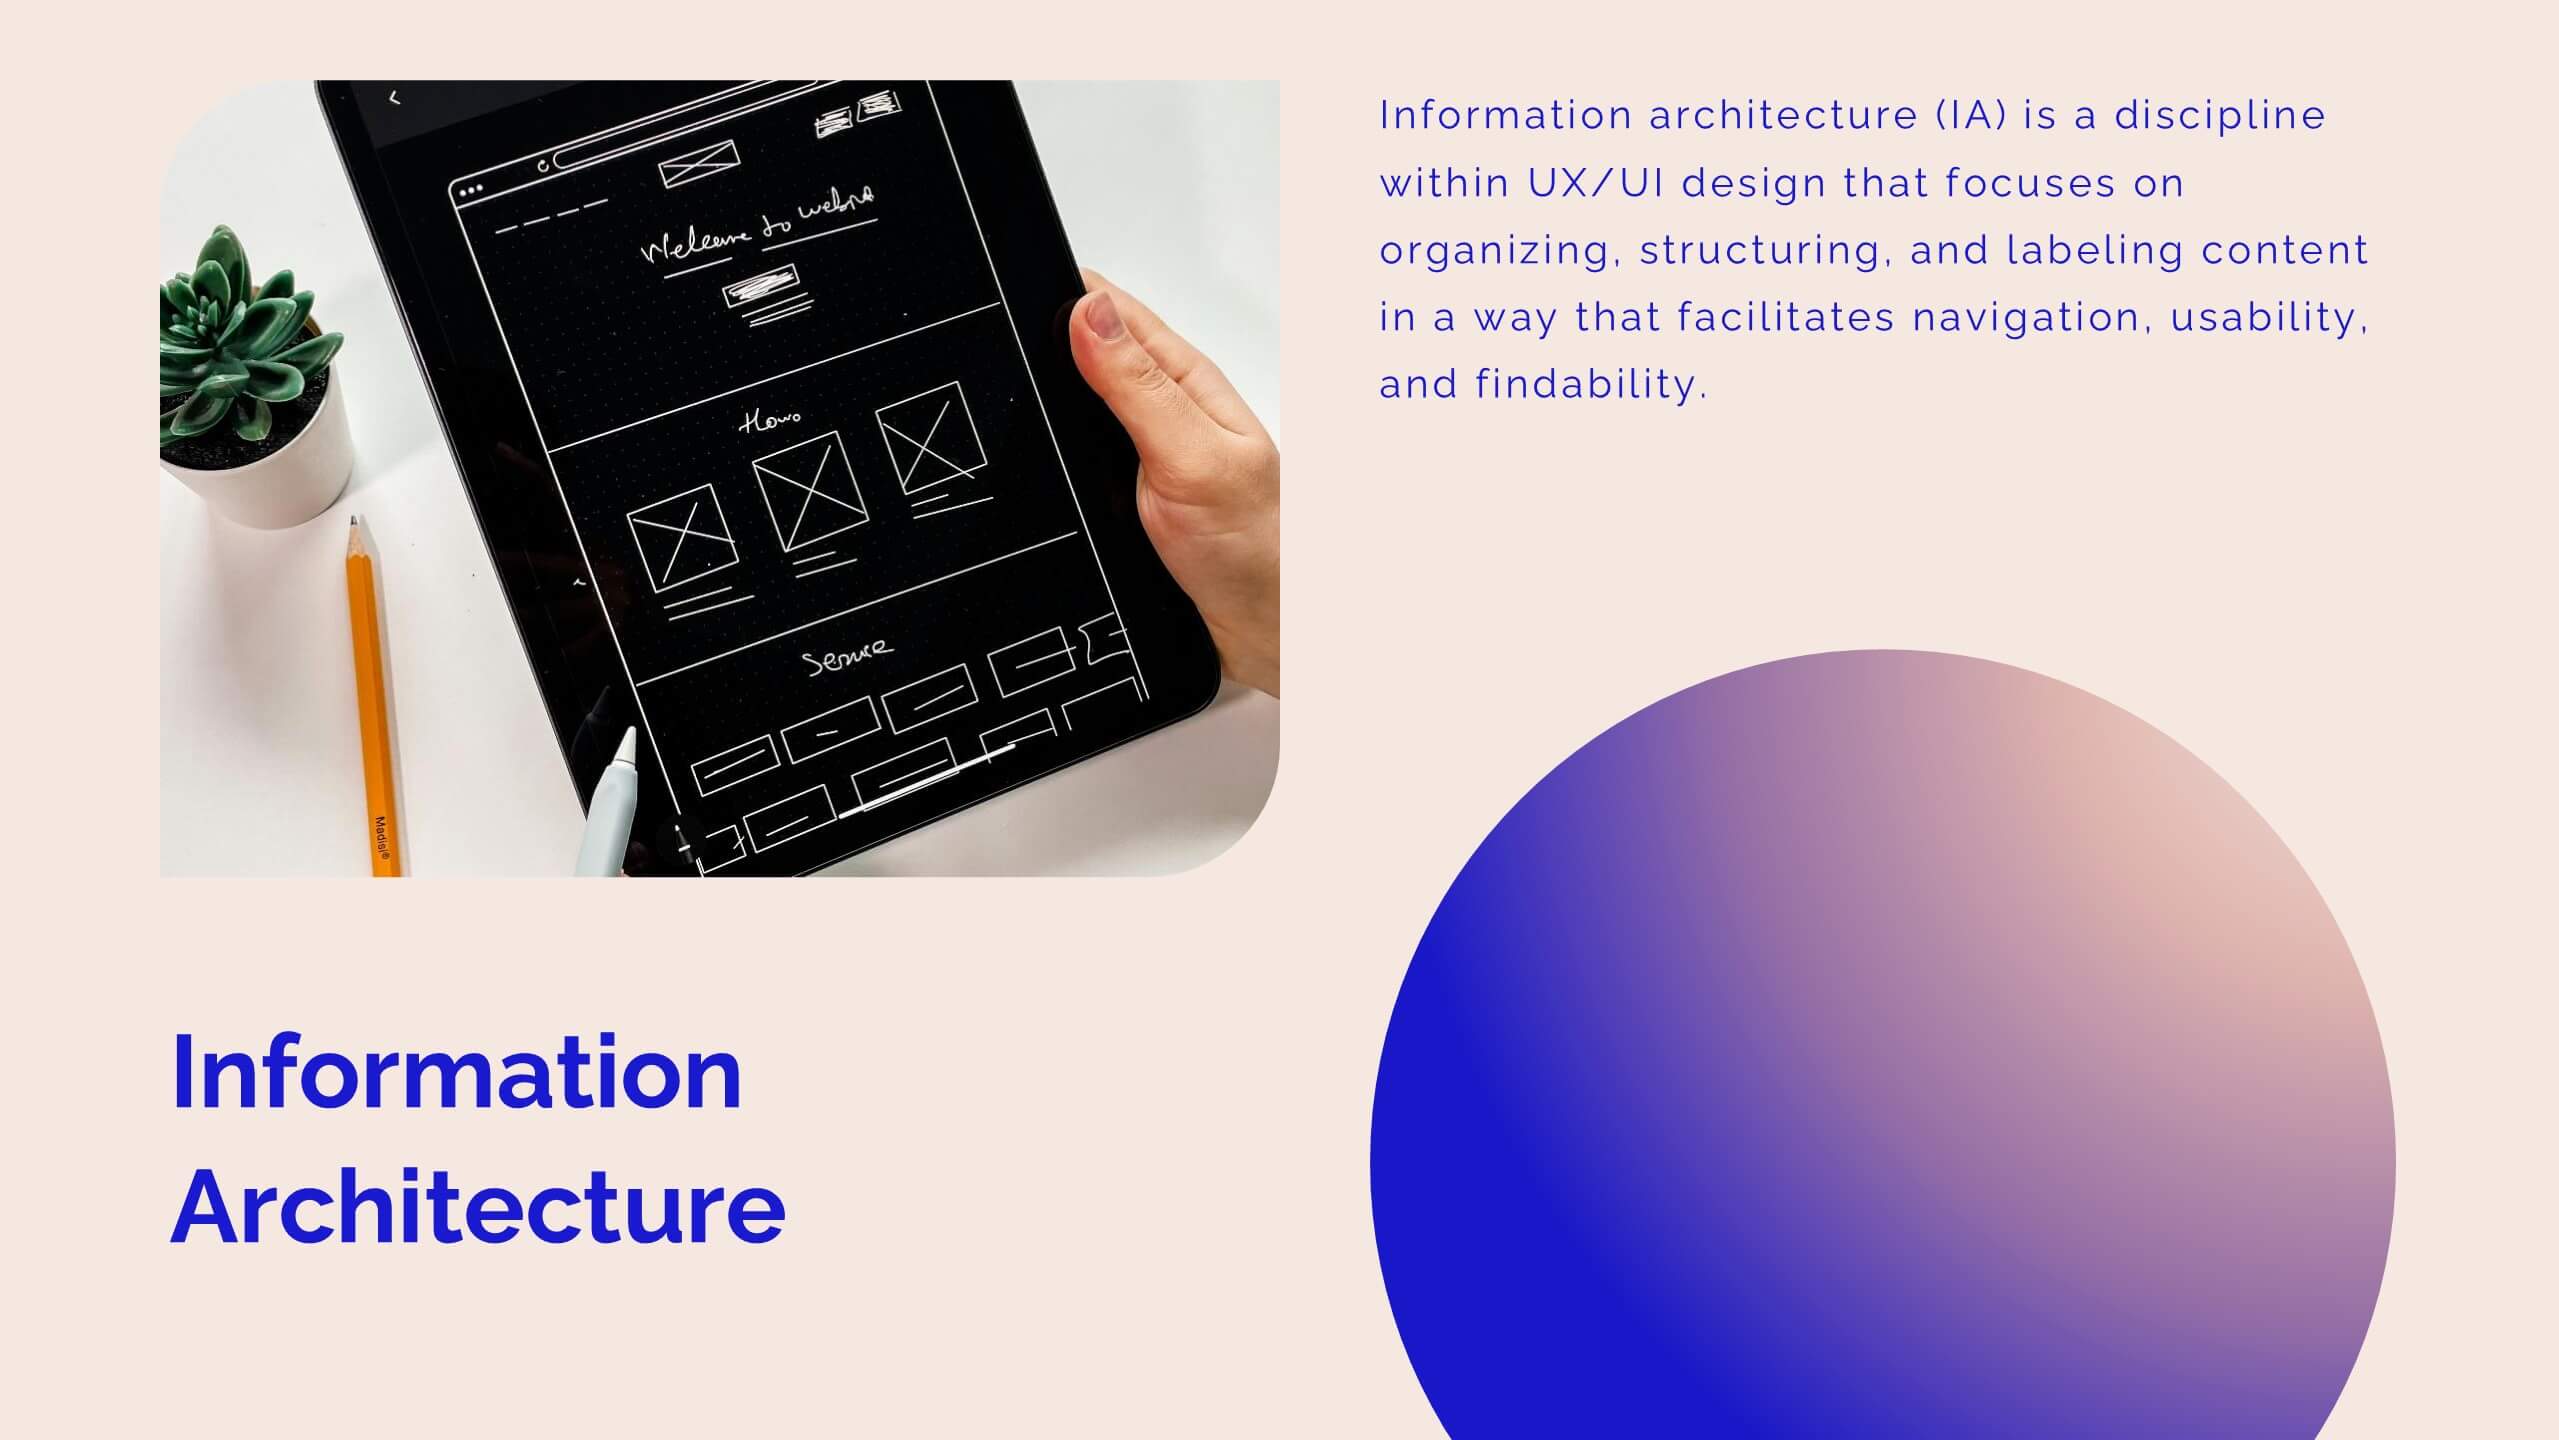
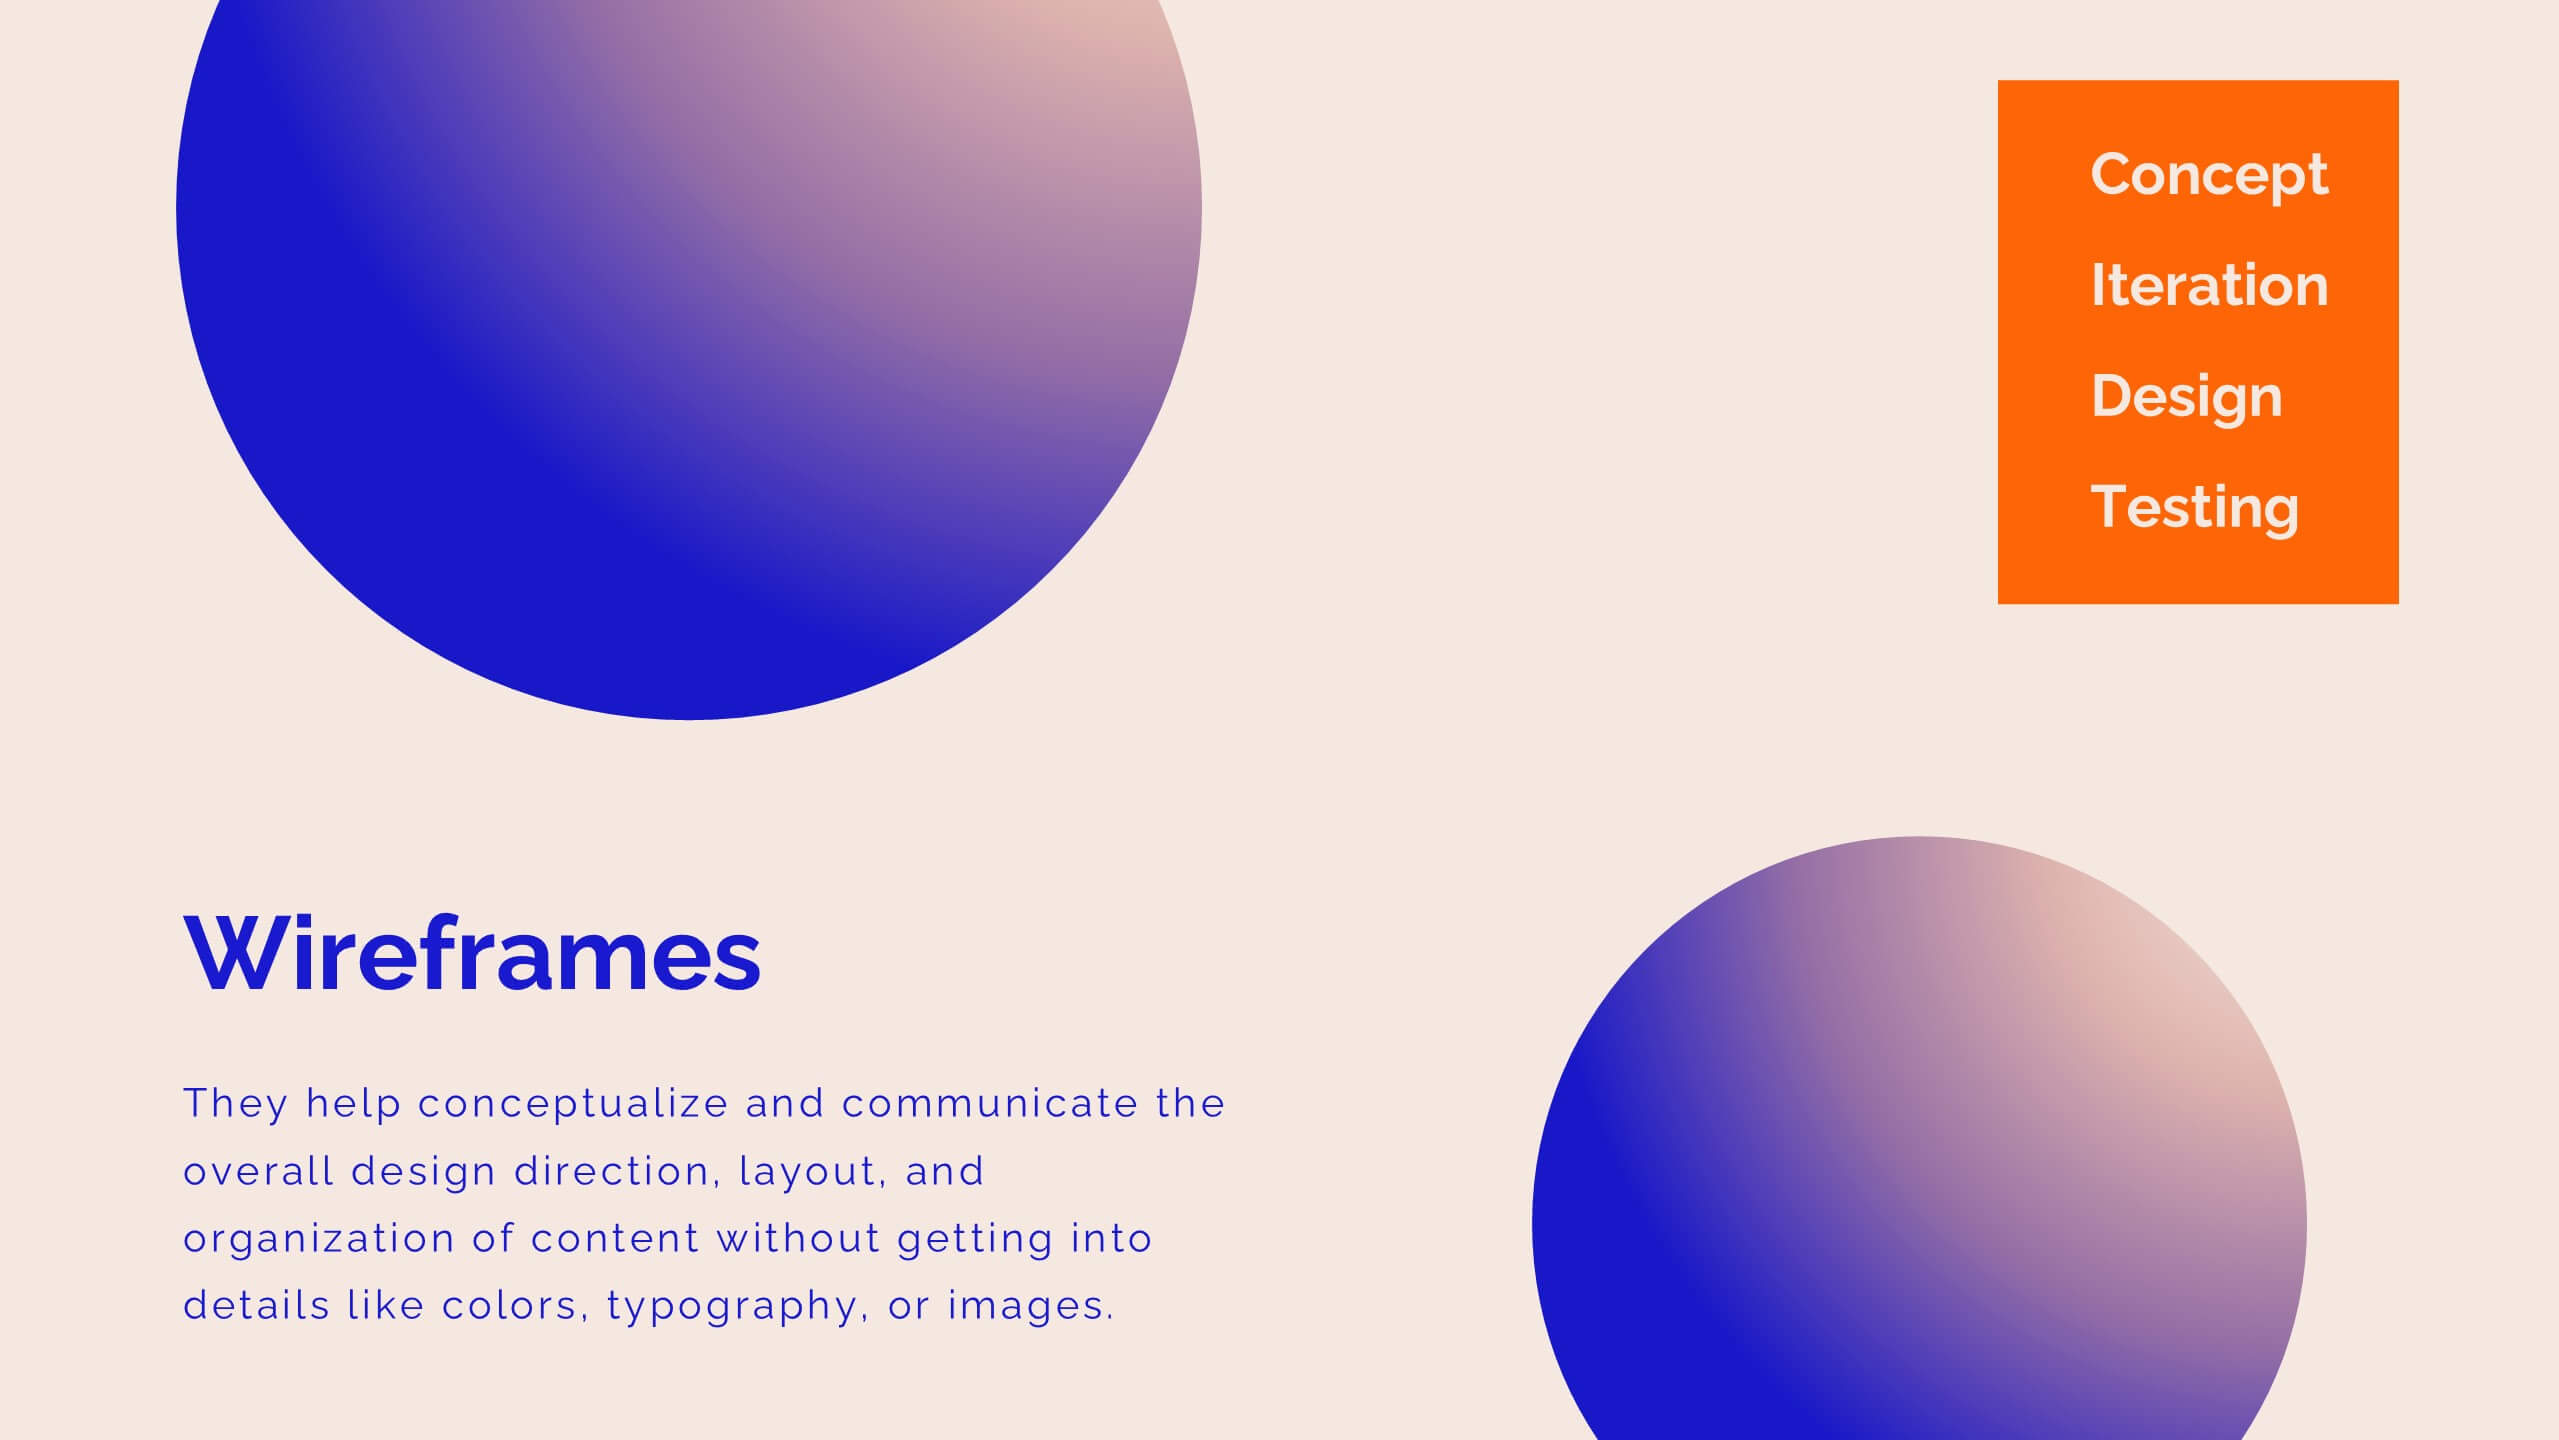
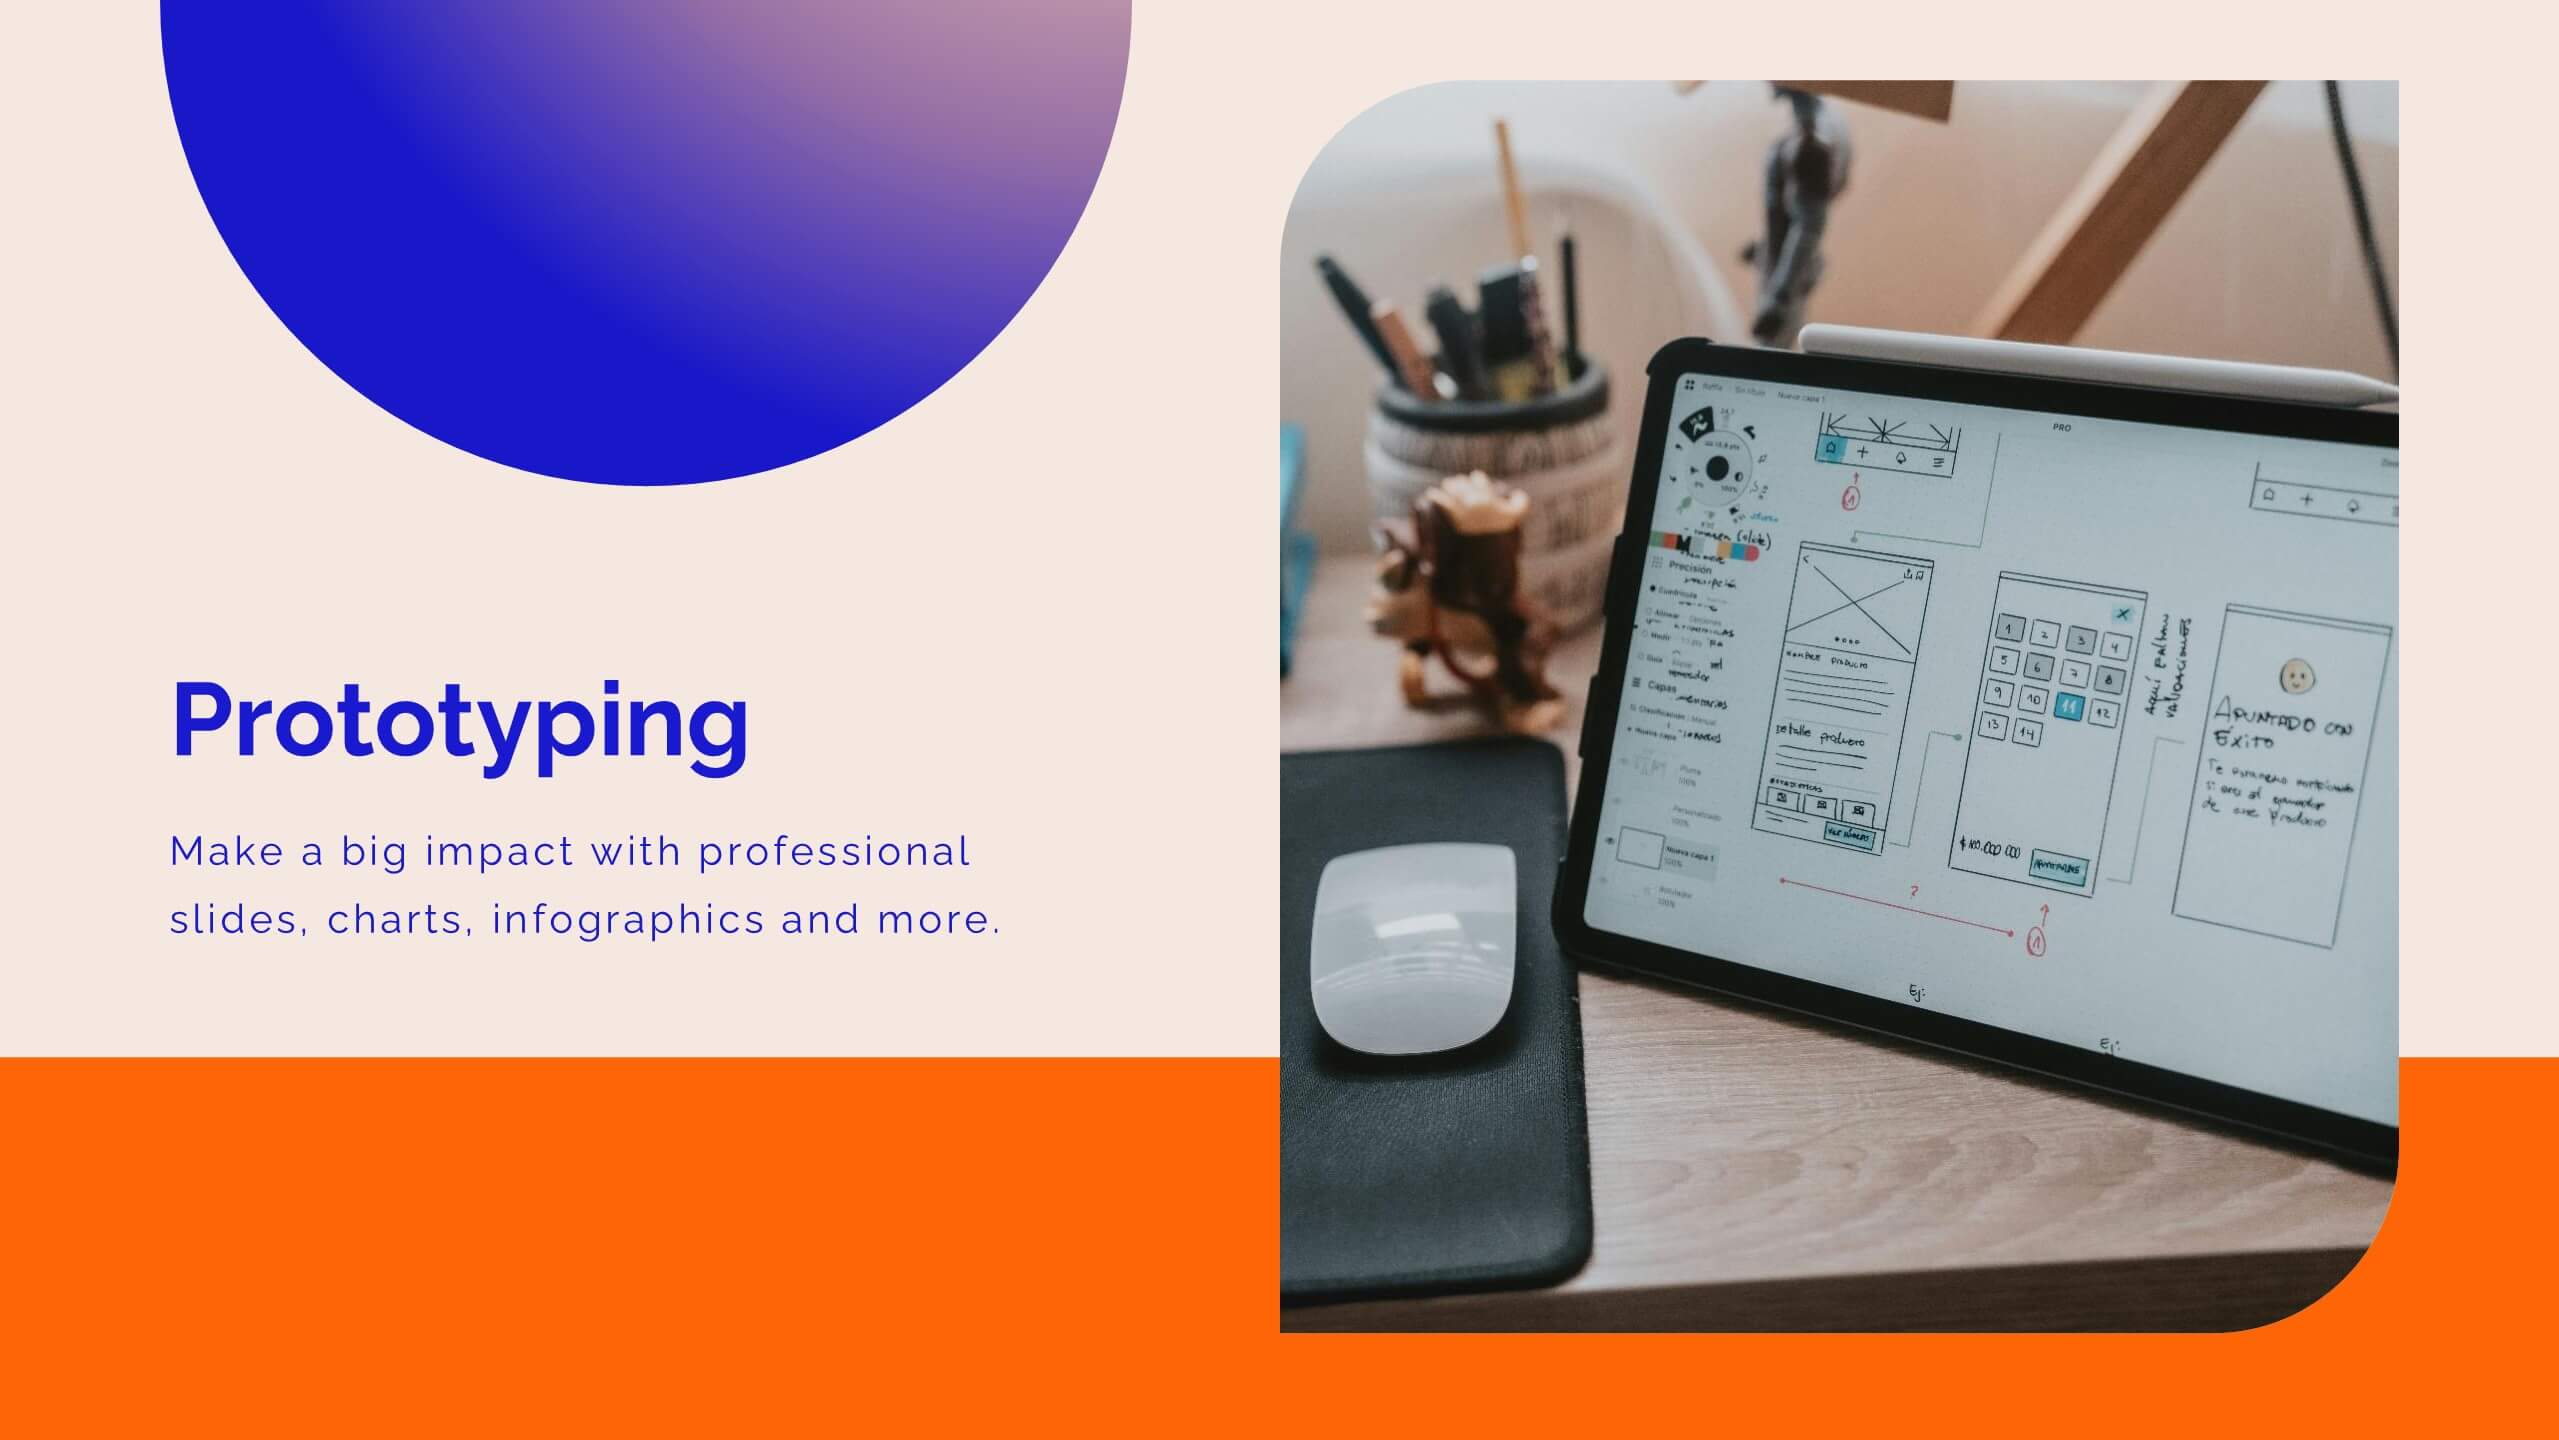
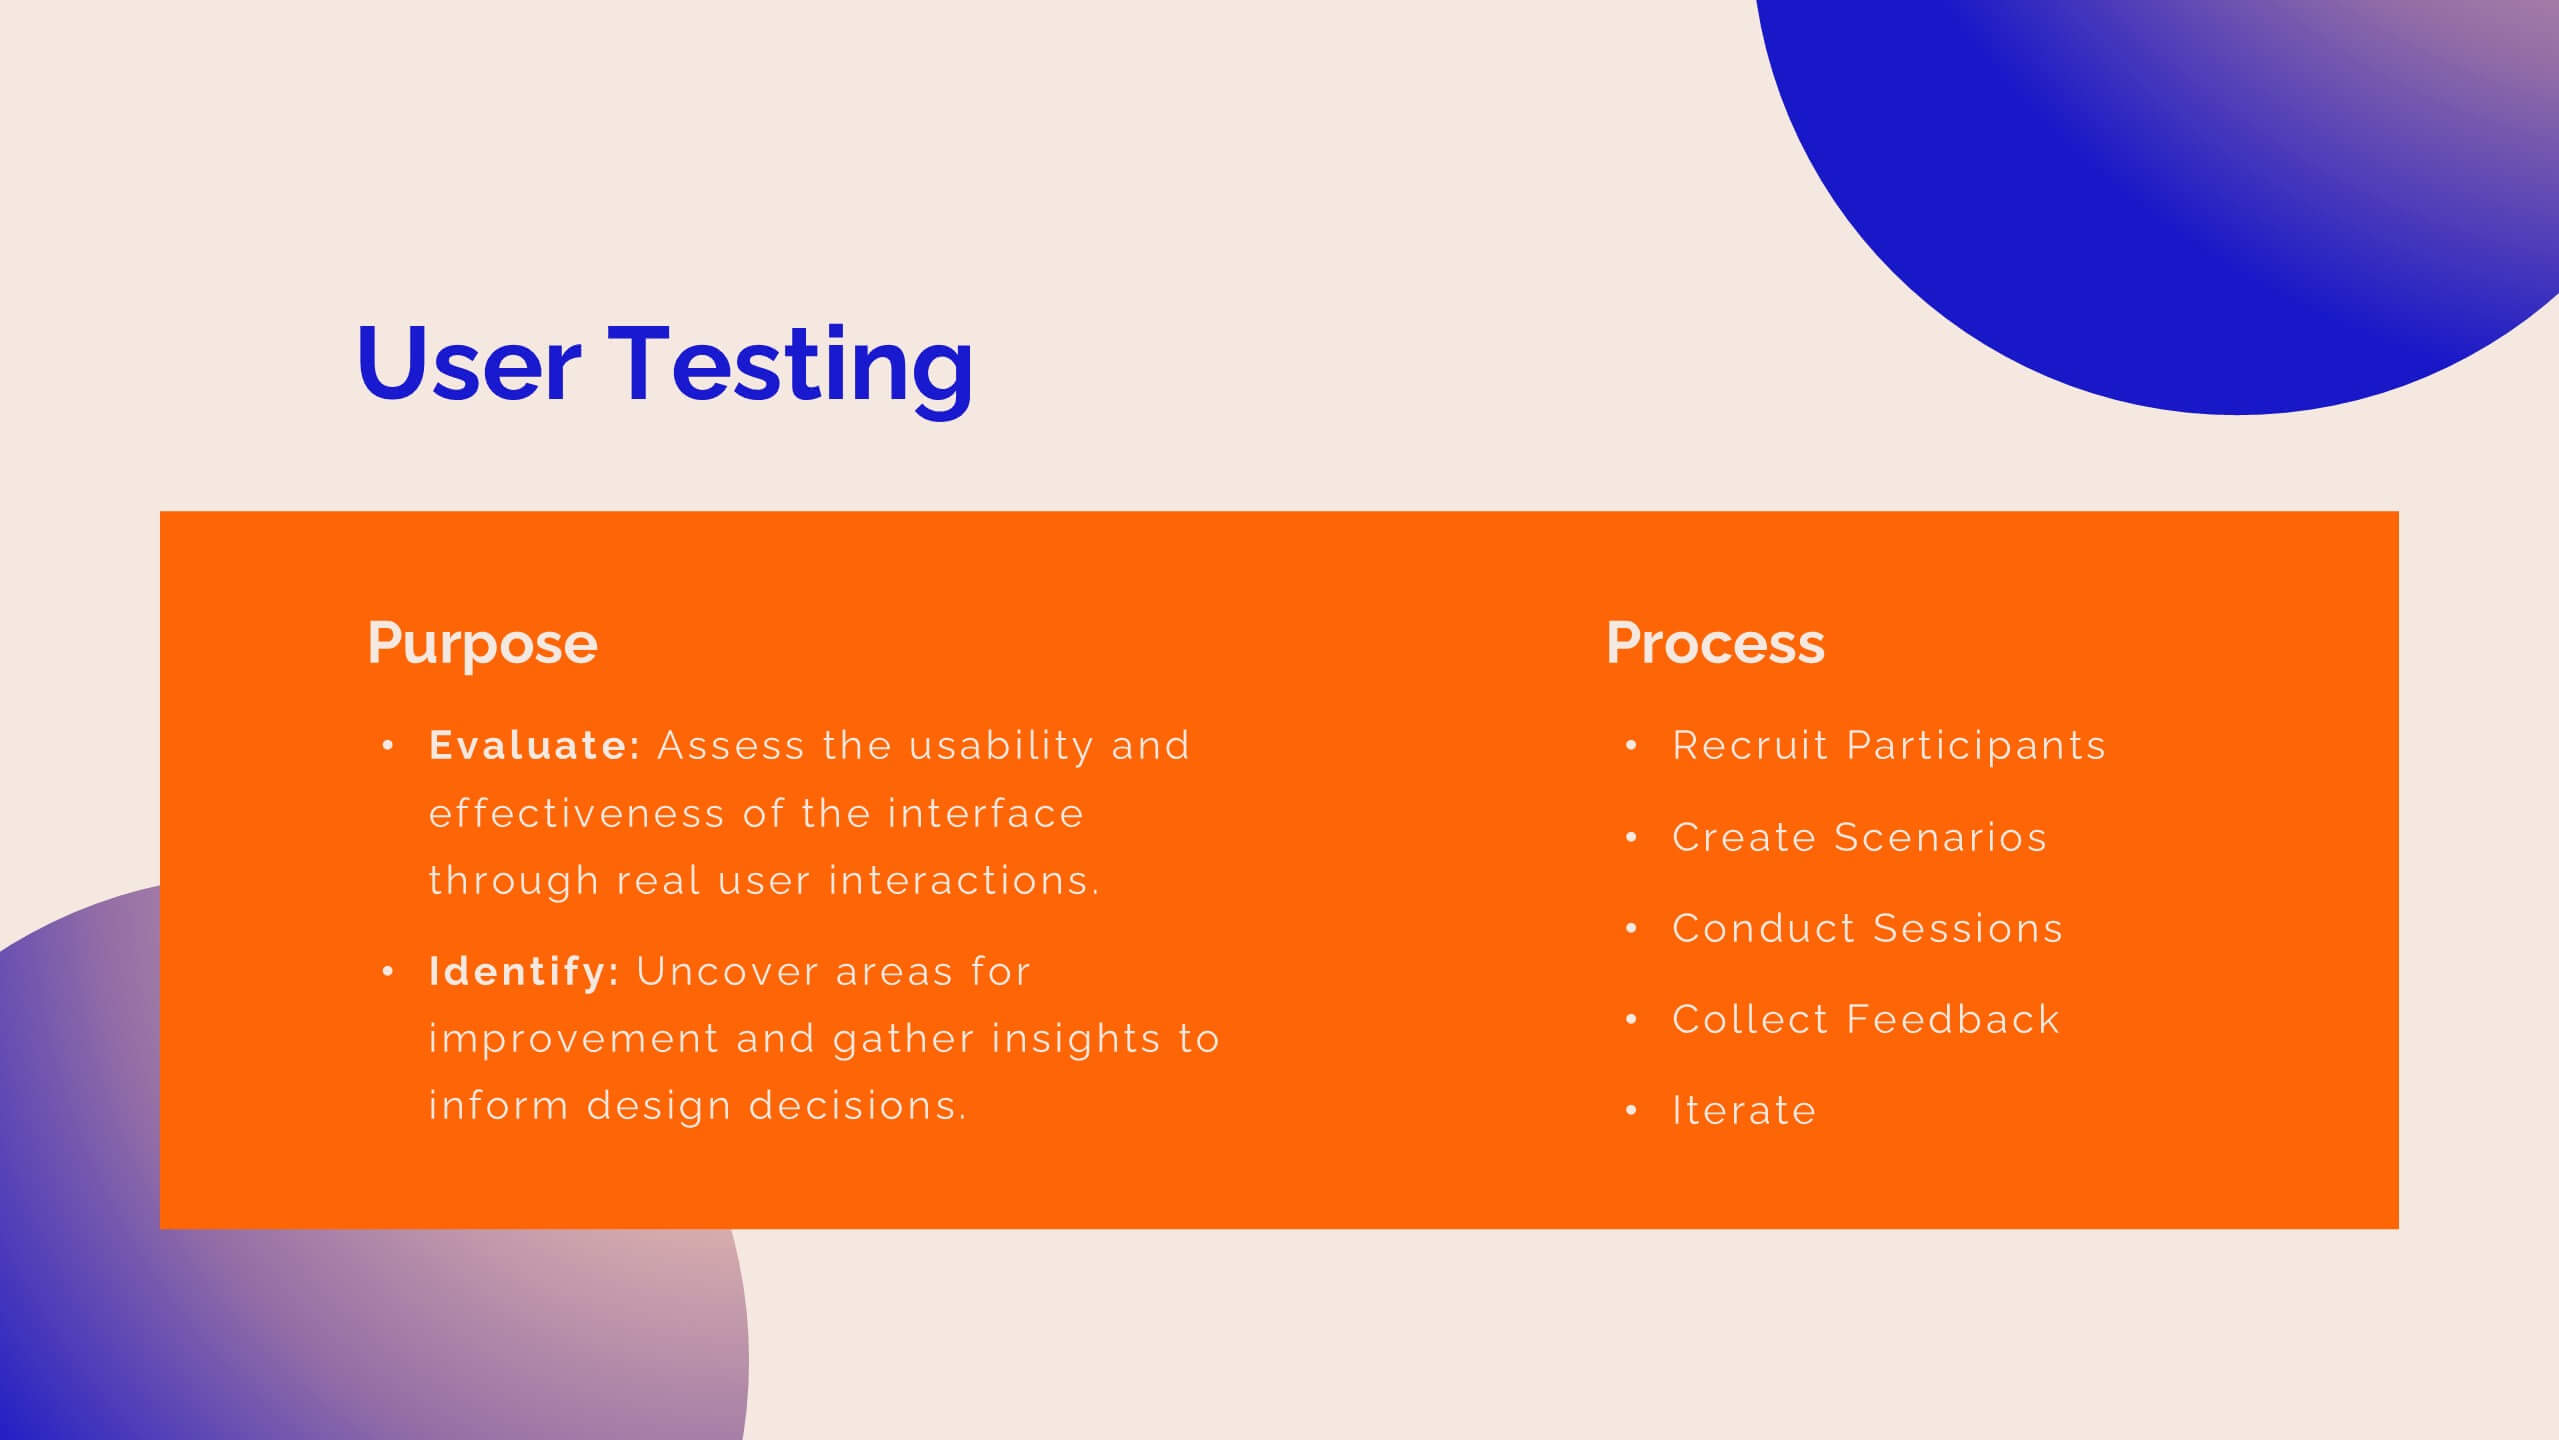
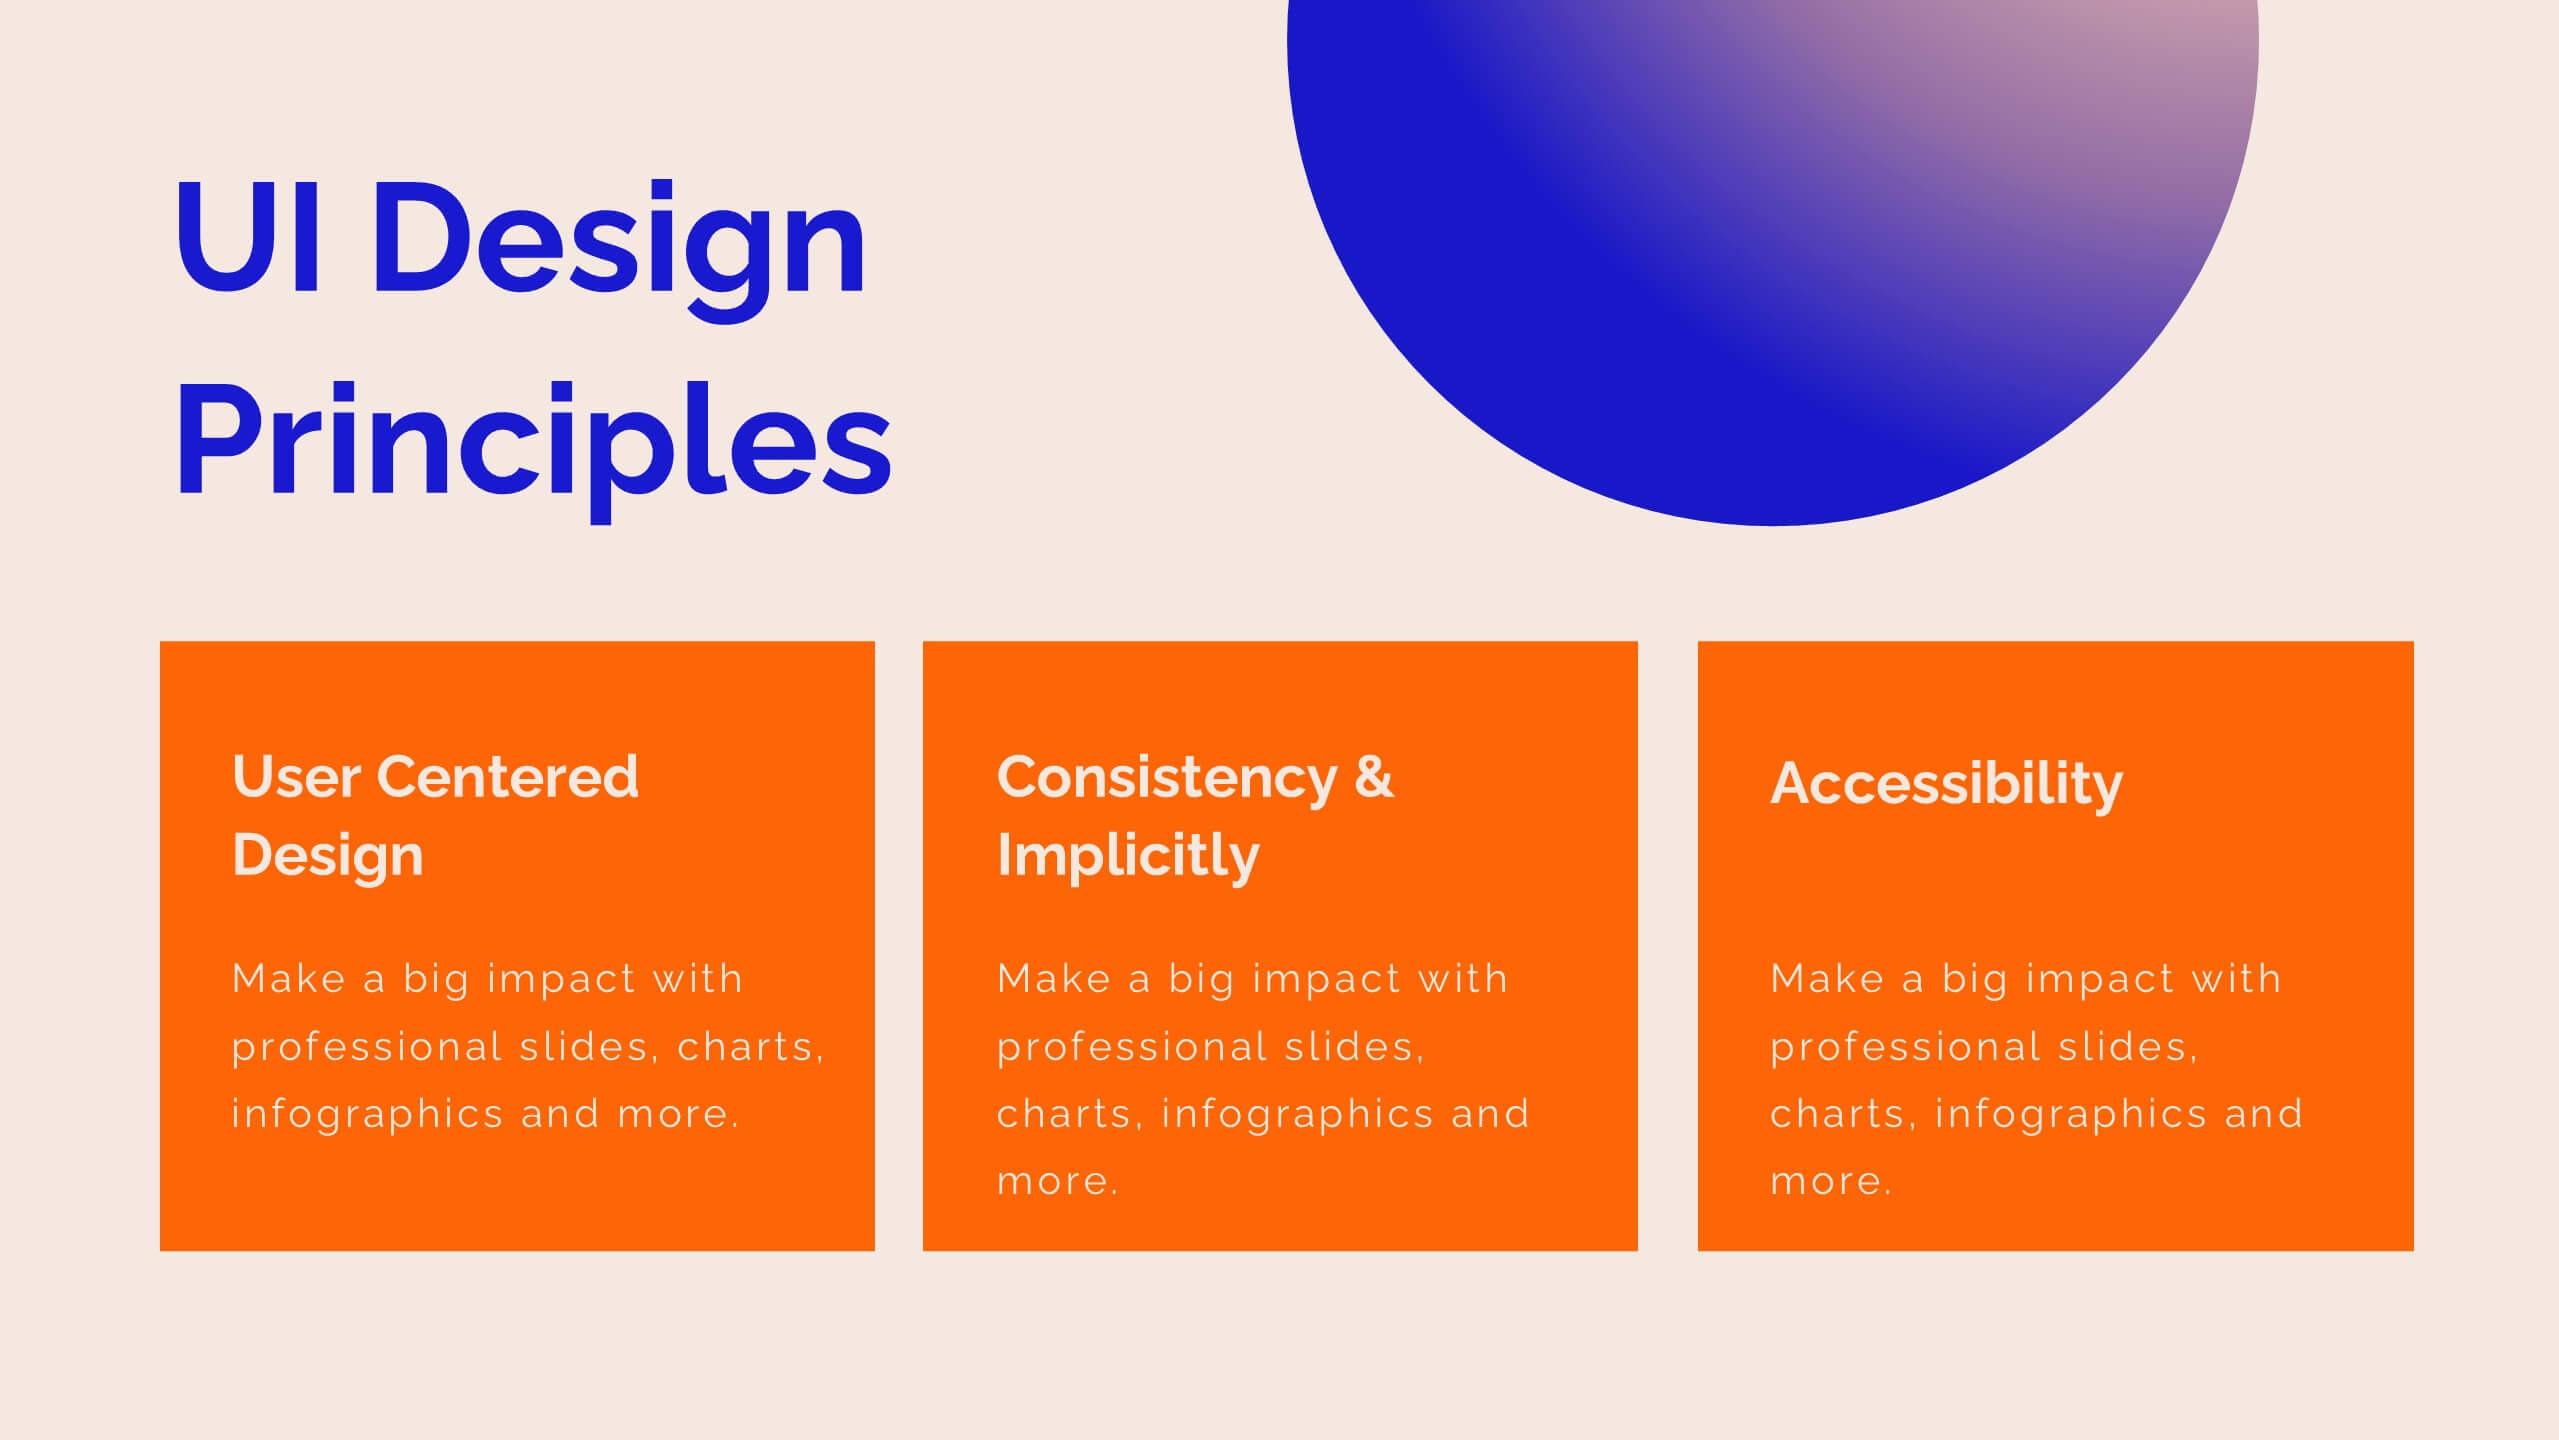
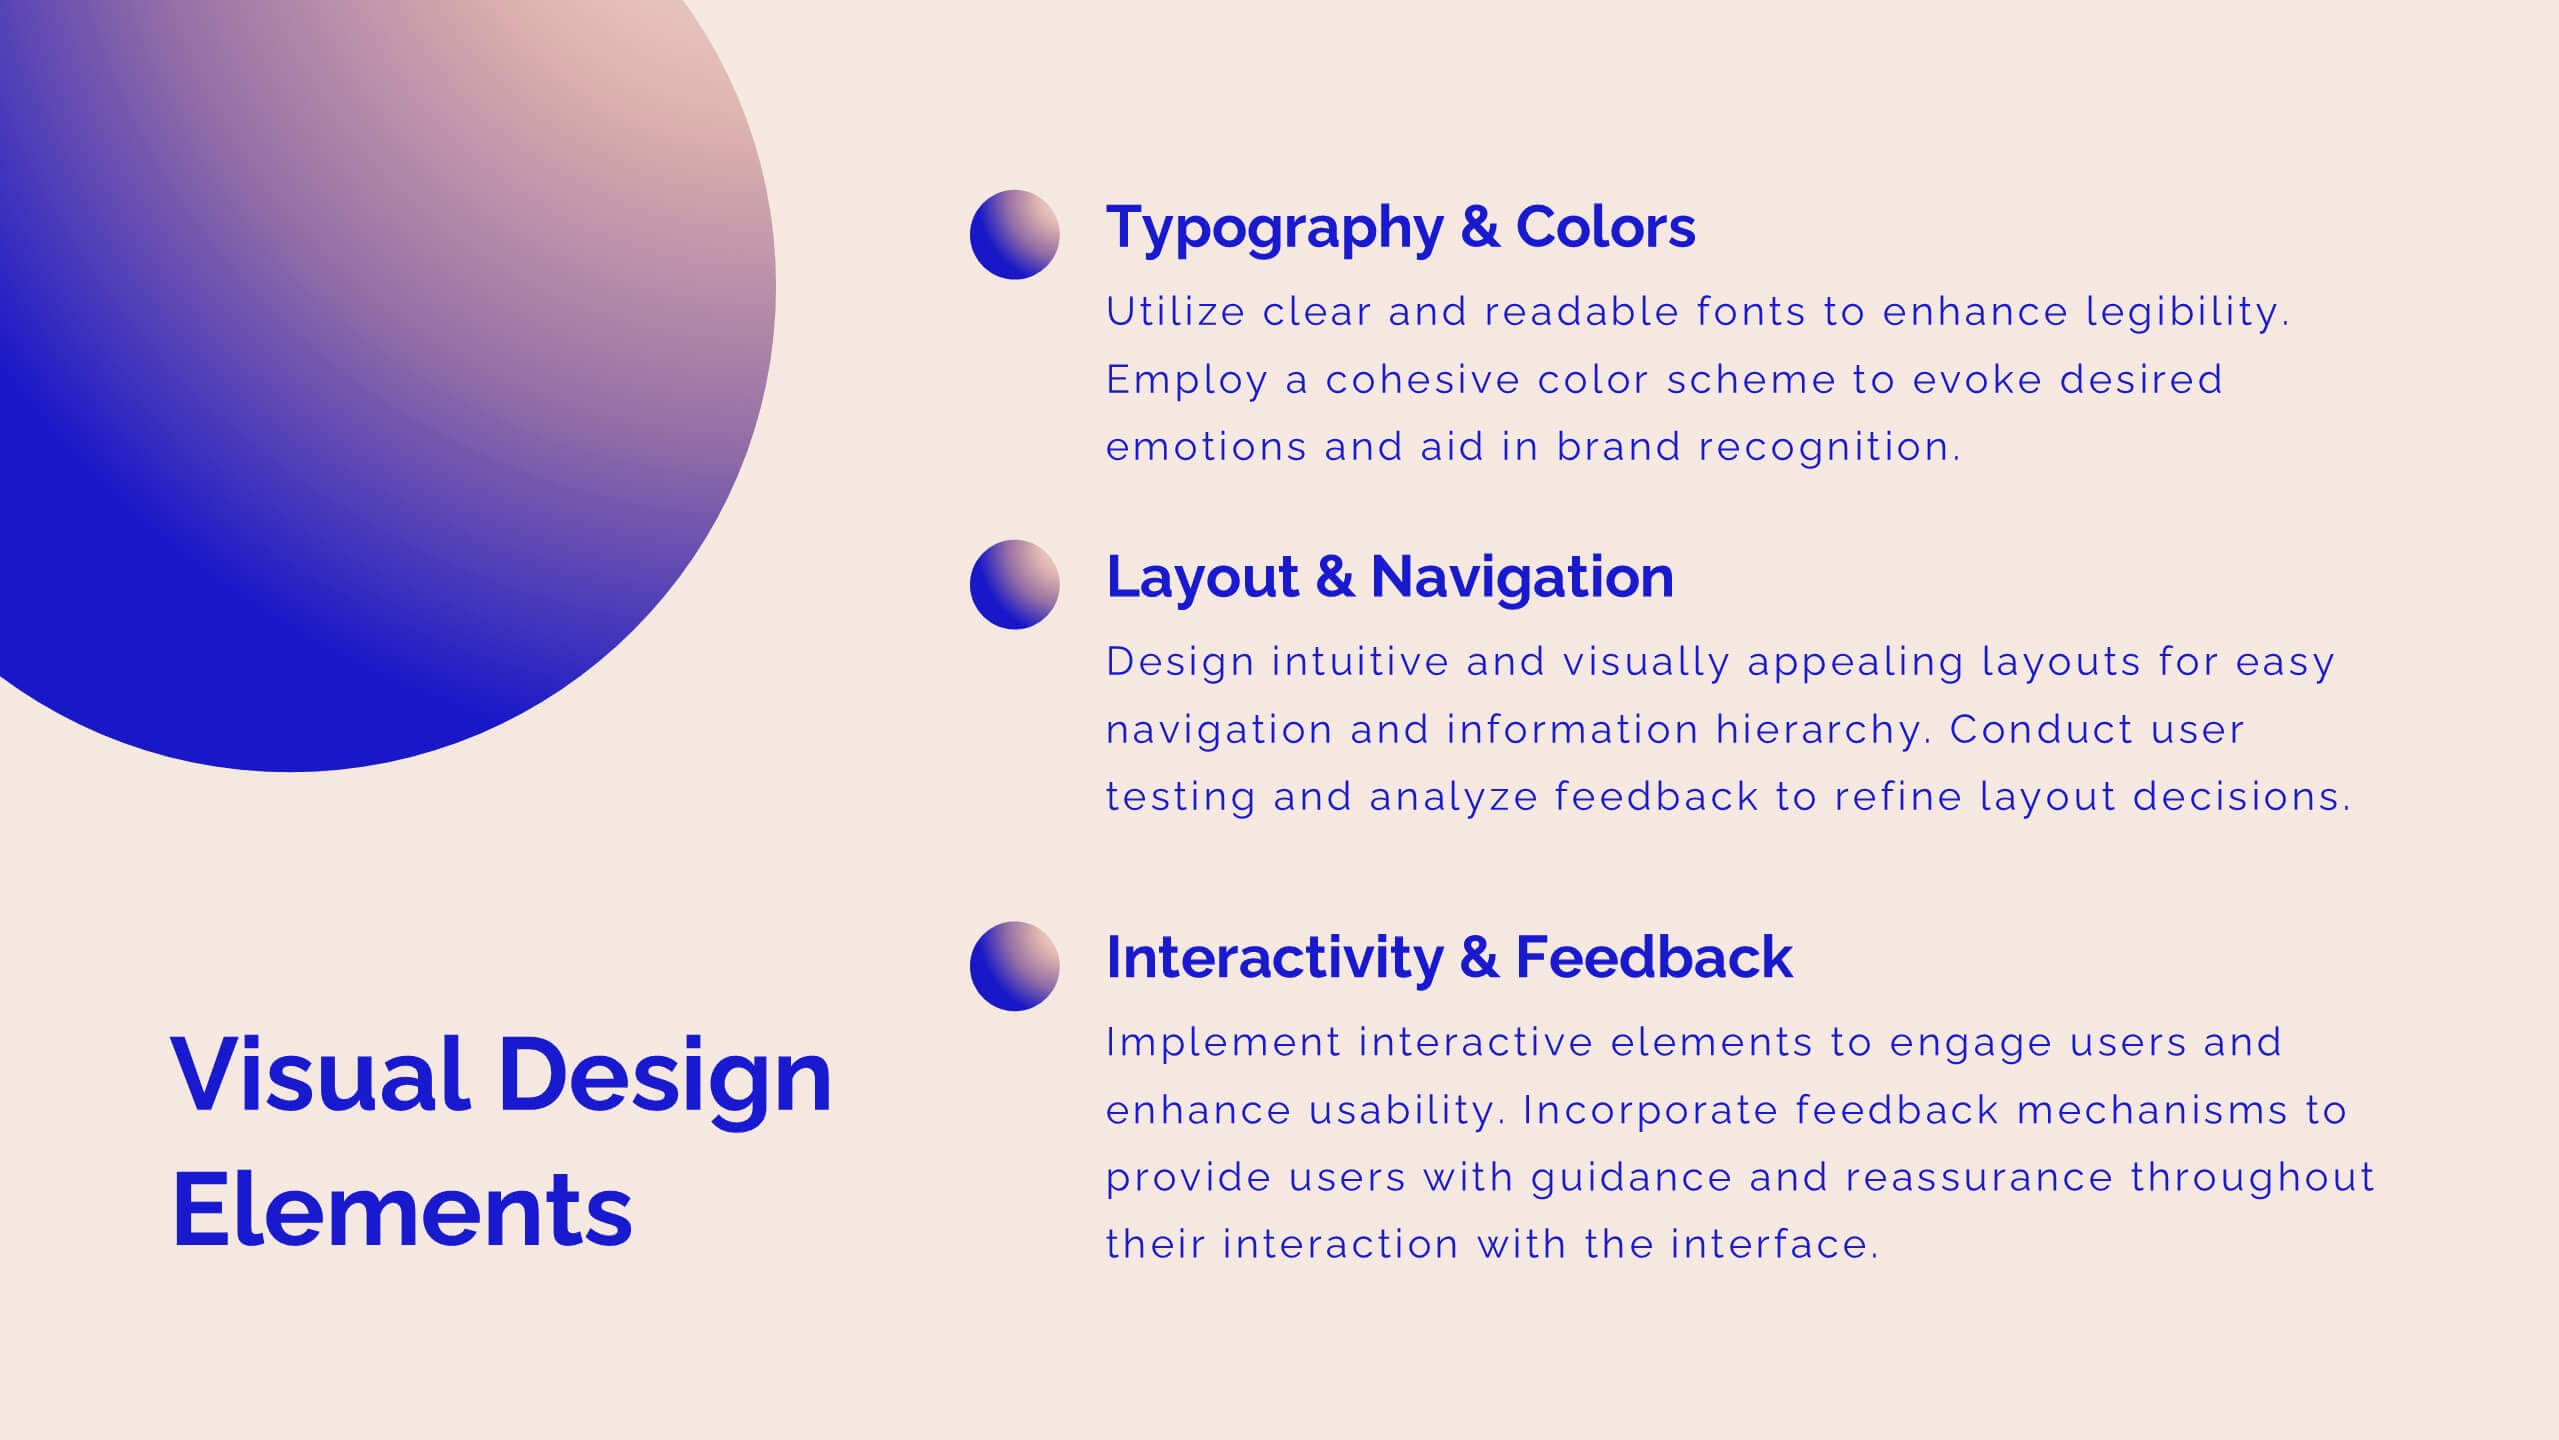
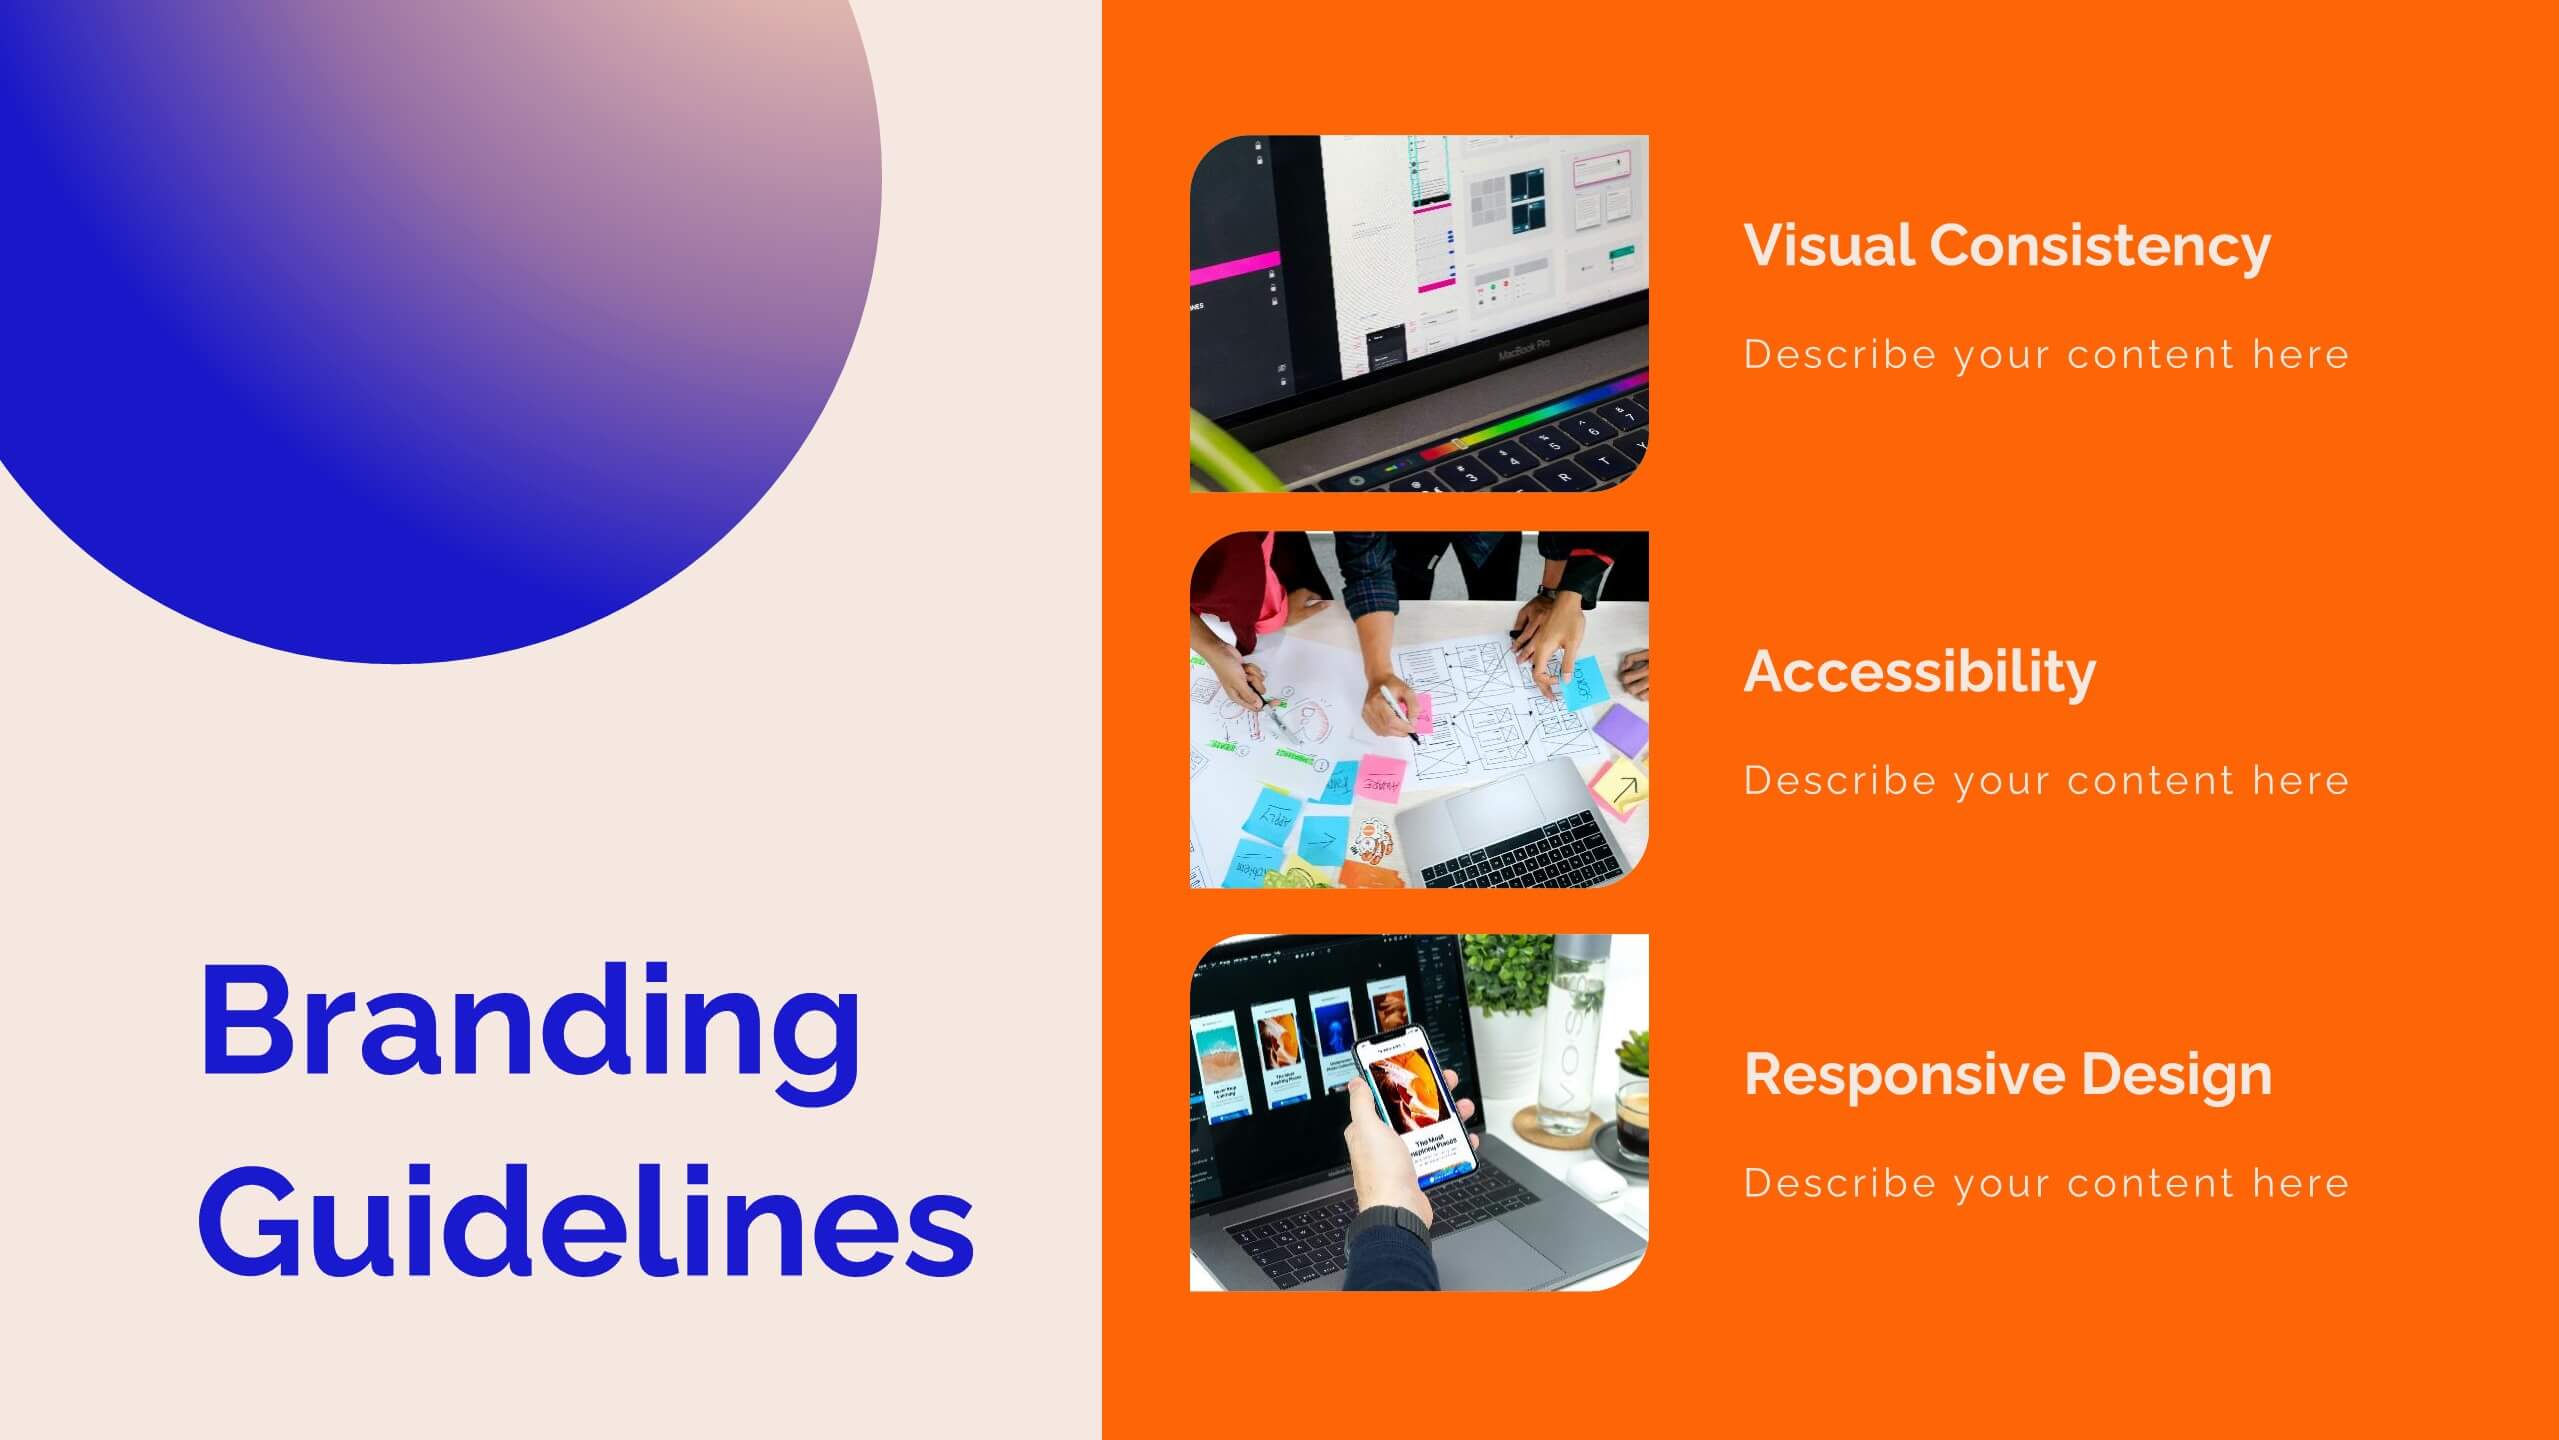
Niobium UX Research Report Presentation
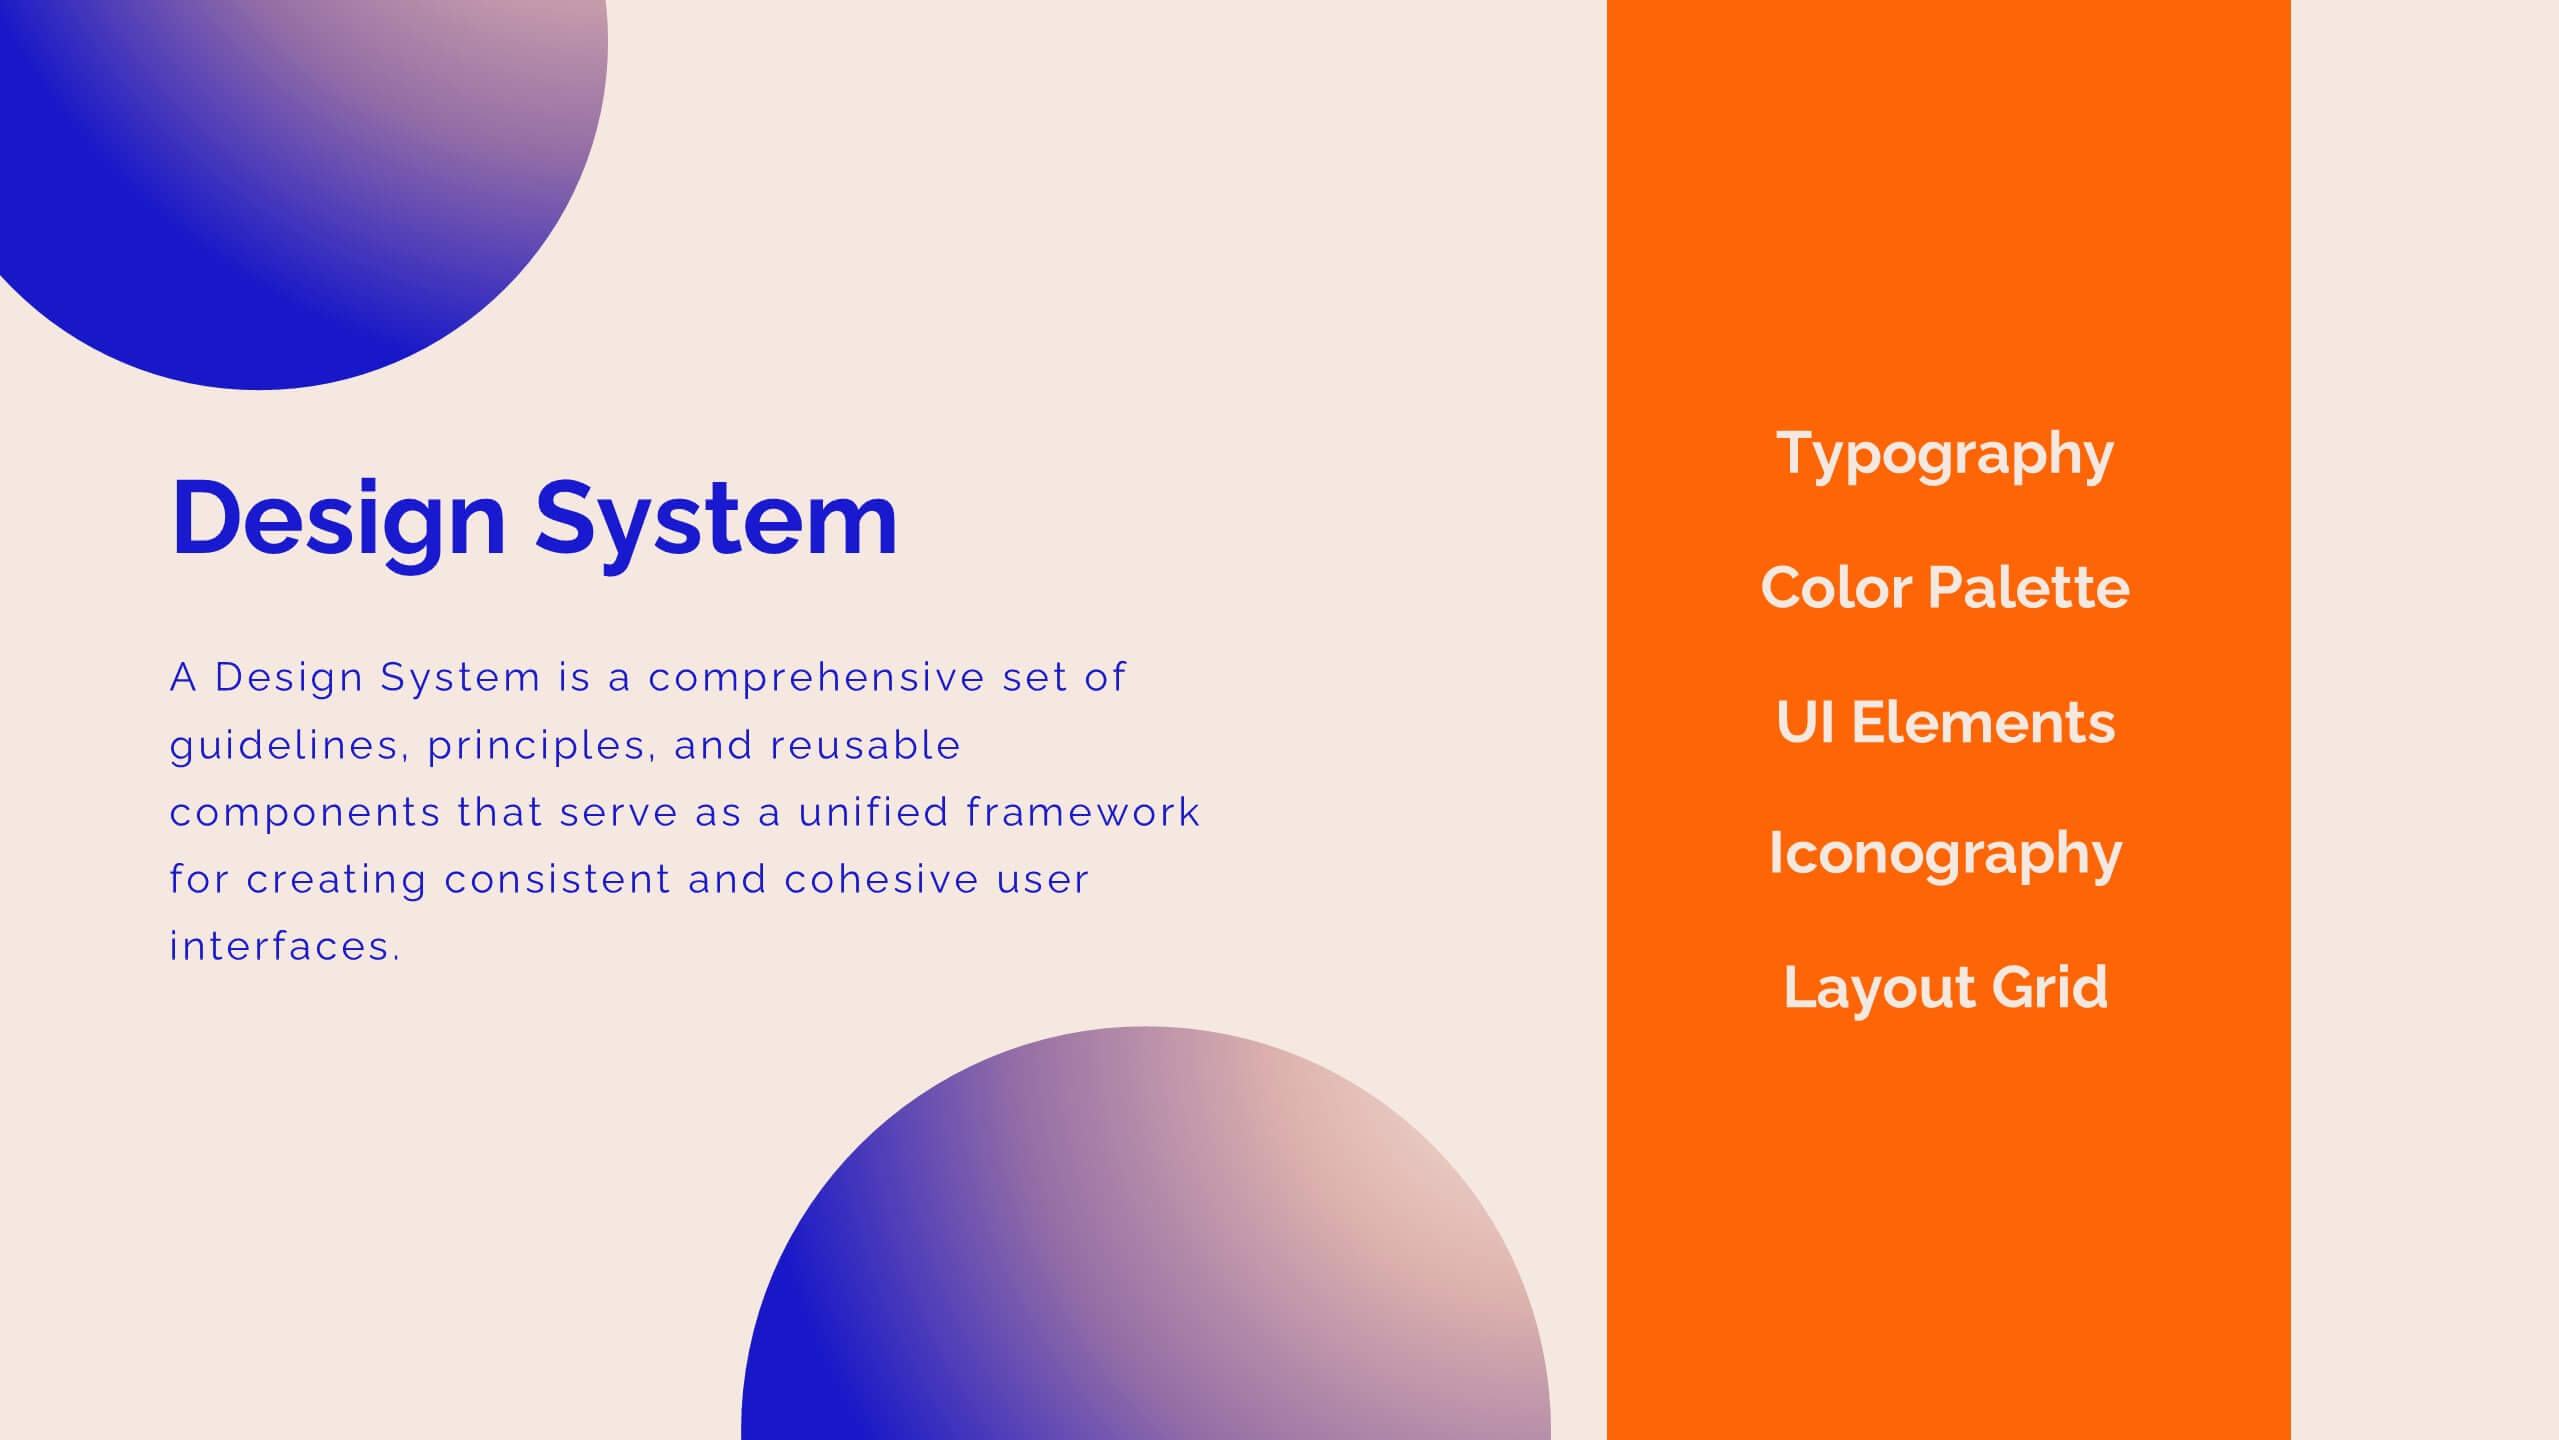
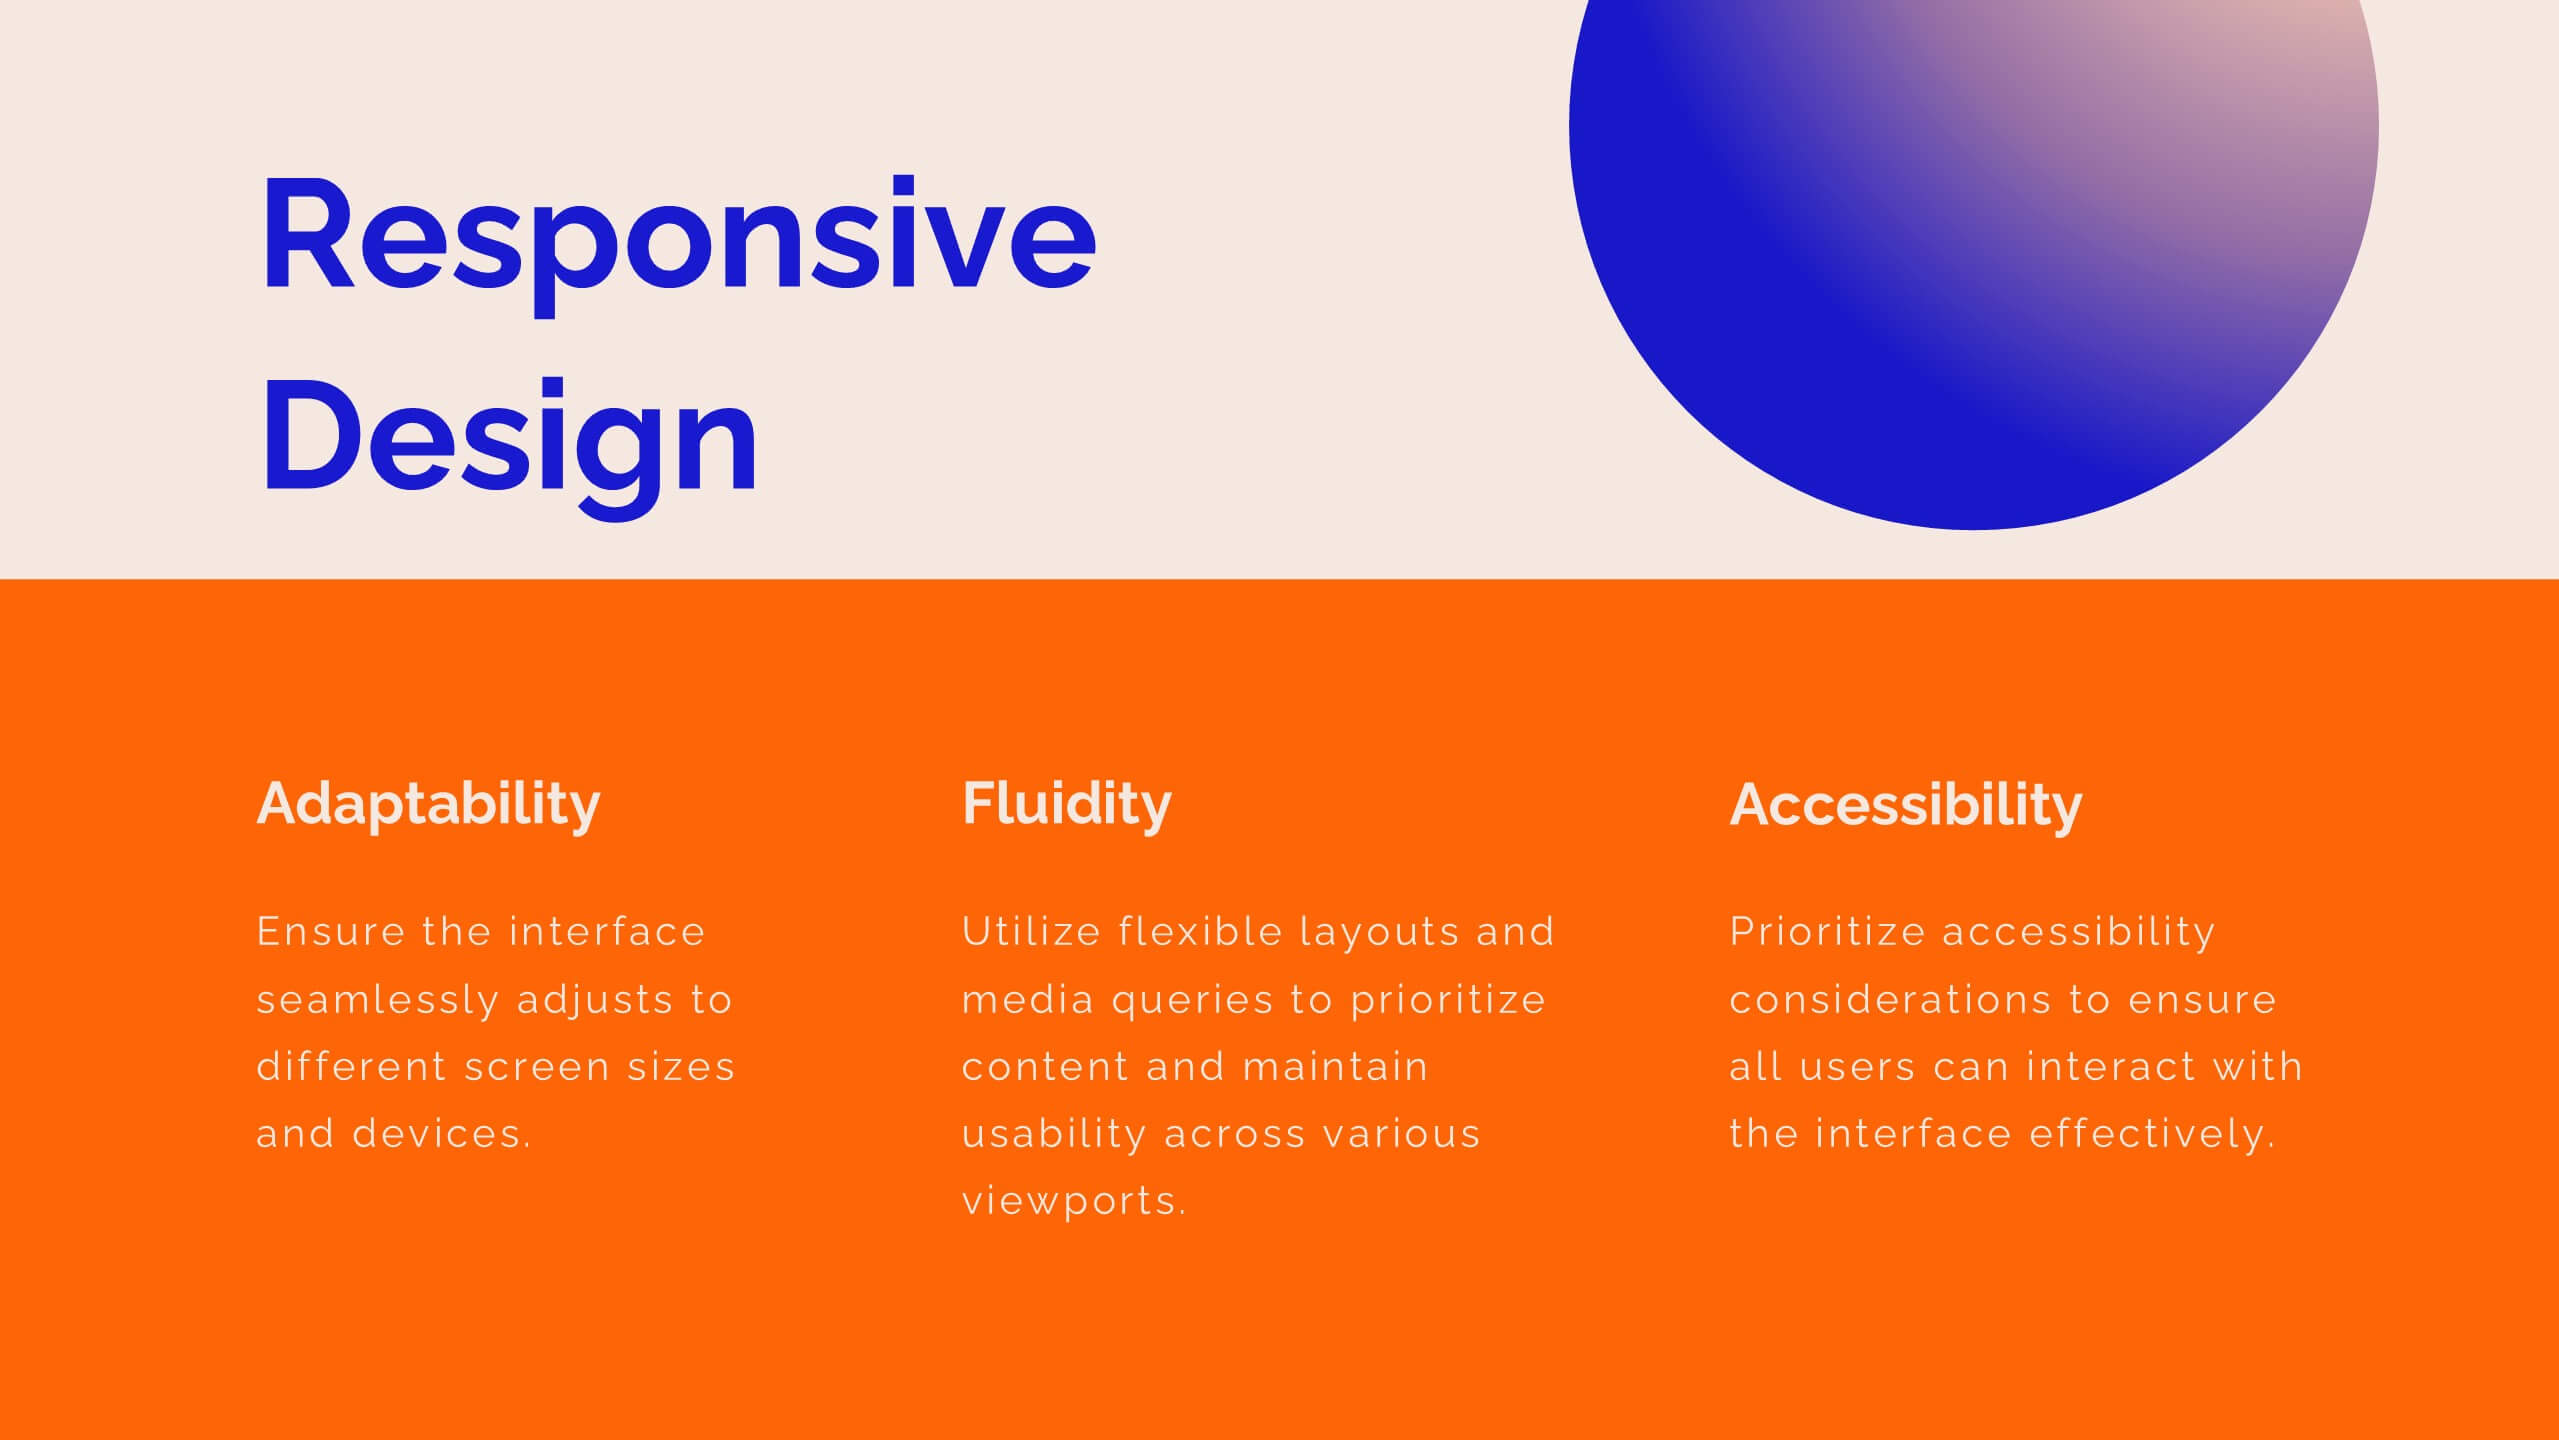
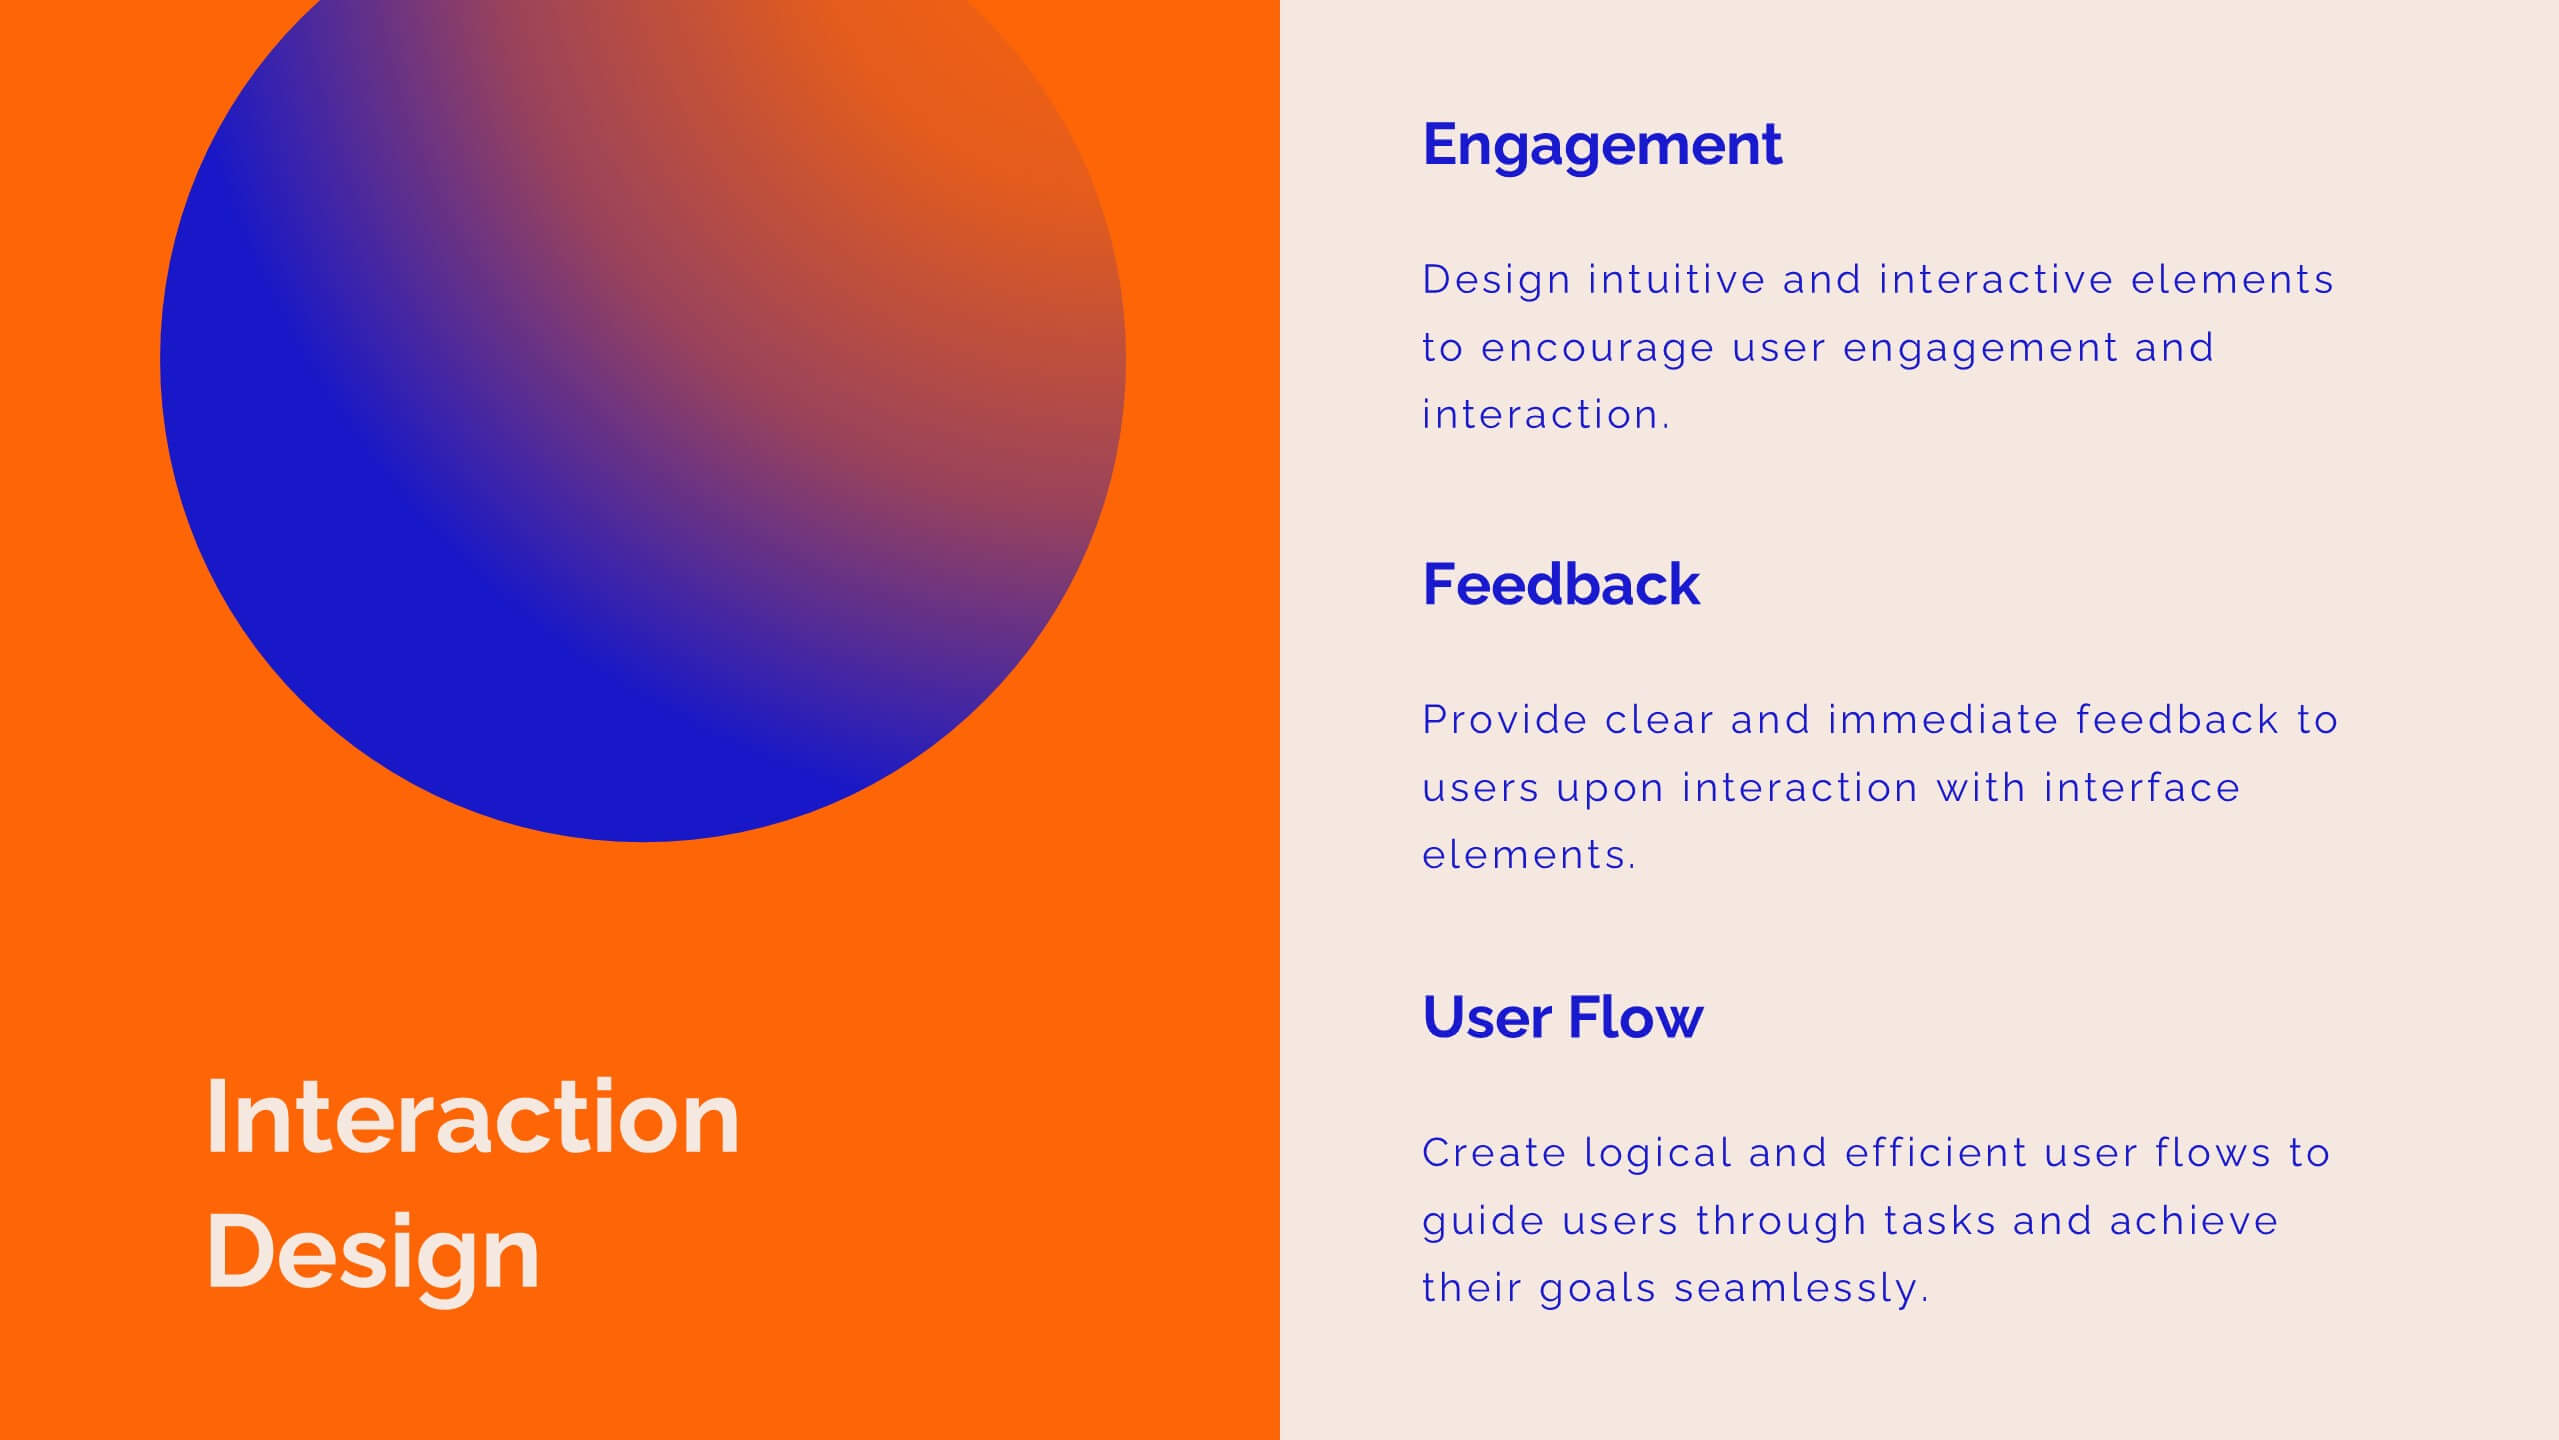
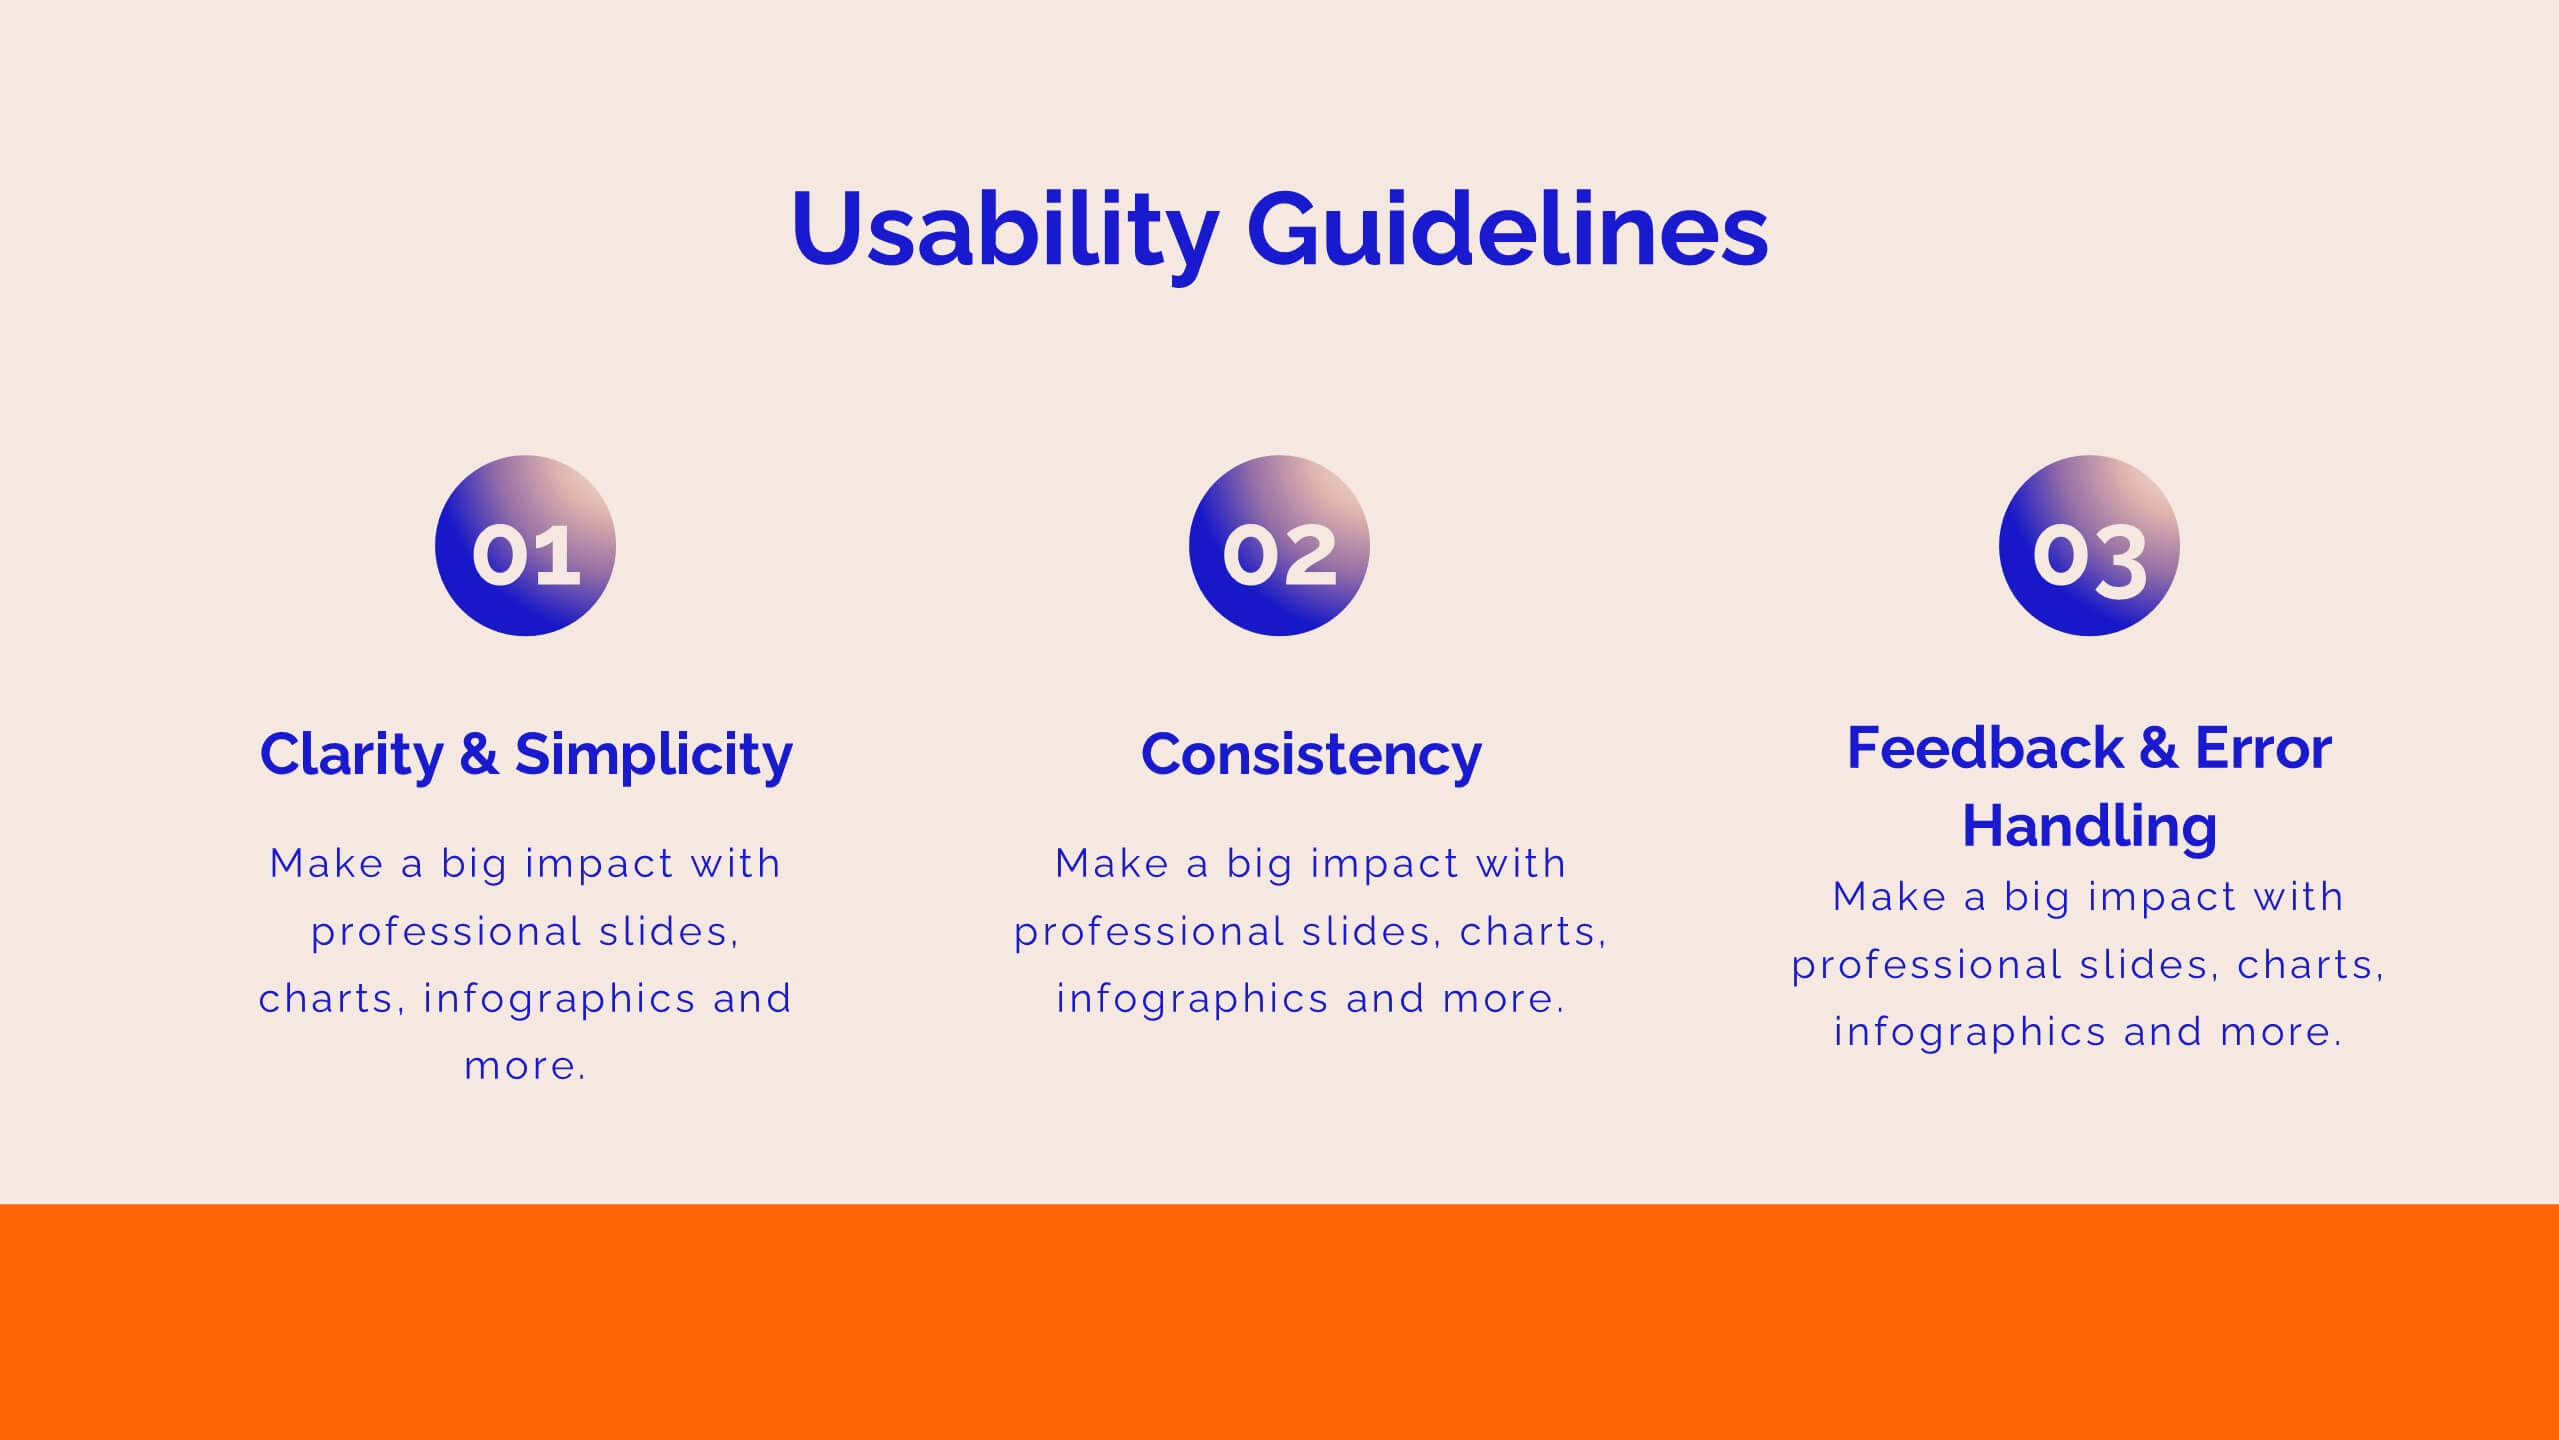
Present your UX research findings with clarity and style using this vibrant UX research report template! It includes sections for user personas, wireframes, user testing, and design principles, making it ideal for sharing research insights. Fully customizable and compatible with PowerPoint, Keynote, and Google Slides, it's perfect for UX professionals and design teams.


20 diapositivas
Cinderbark Product Launch Pitch Deck Presentation
Showcase your product launch with a sleek, modern, and professional pitch deck template. This design empowers you to captivate stakeholders by clearly presenting your problem statement, unique solutions, and market opportunity. Effectively highlight your target audience, revenue model, and competitive landscape to demonstrate market viability. Create impact with visuals detailing your sales strategy, growth projections, and financial summary, ensuring transparency and confidence in your business plan. Timeline and milestone slides keep the focus on key achievements and future goals, while team introduction pages establish credibility and expertise. Fully customizable and compatible with PowerPoint, Google Slides, and Keynote, this template is ideal for startups, entrepreneurs, and product managers aiming for a polished and compelling presentation. Tailor it to your needs and deliver your vision with clarity and style.


20 diapositivas
Storynix New Product Proposal Presentation
This beautifully designed presentation template is your perfect tool to showcase a new product with style and professionalism. It covers everything from company overview and product features to pricing strategies and distribution plans, ensuring a comprehensive and persuasive pitch. Compatible with PowerPoint, Keynote, and Google Slides for seamless customization.

24 diapositivas
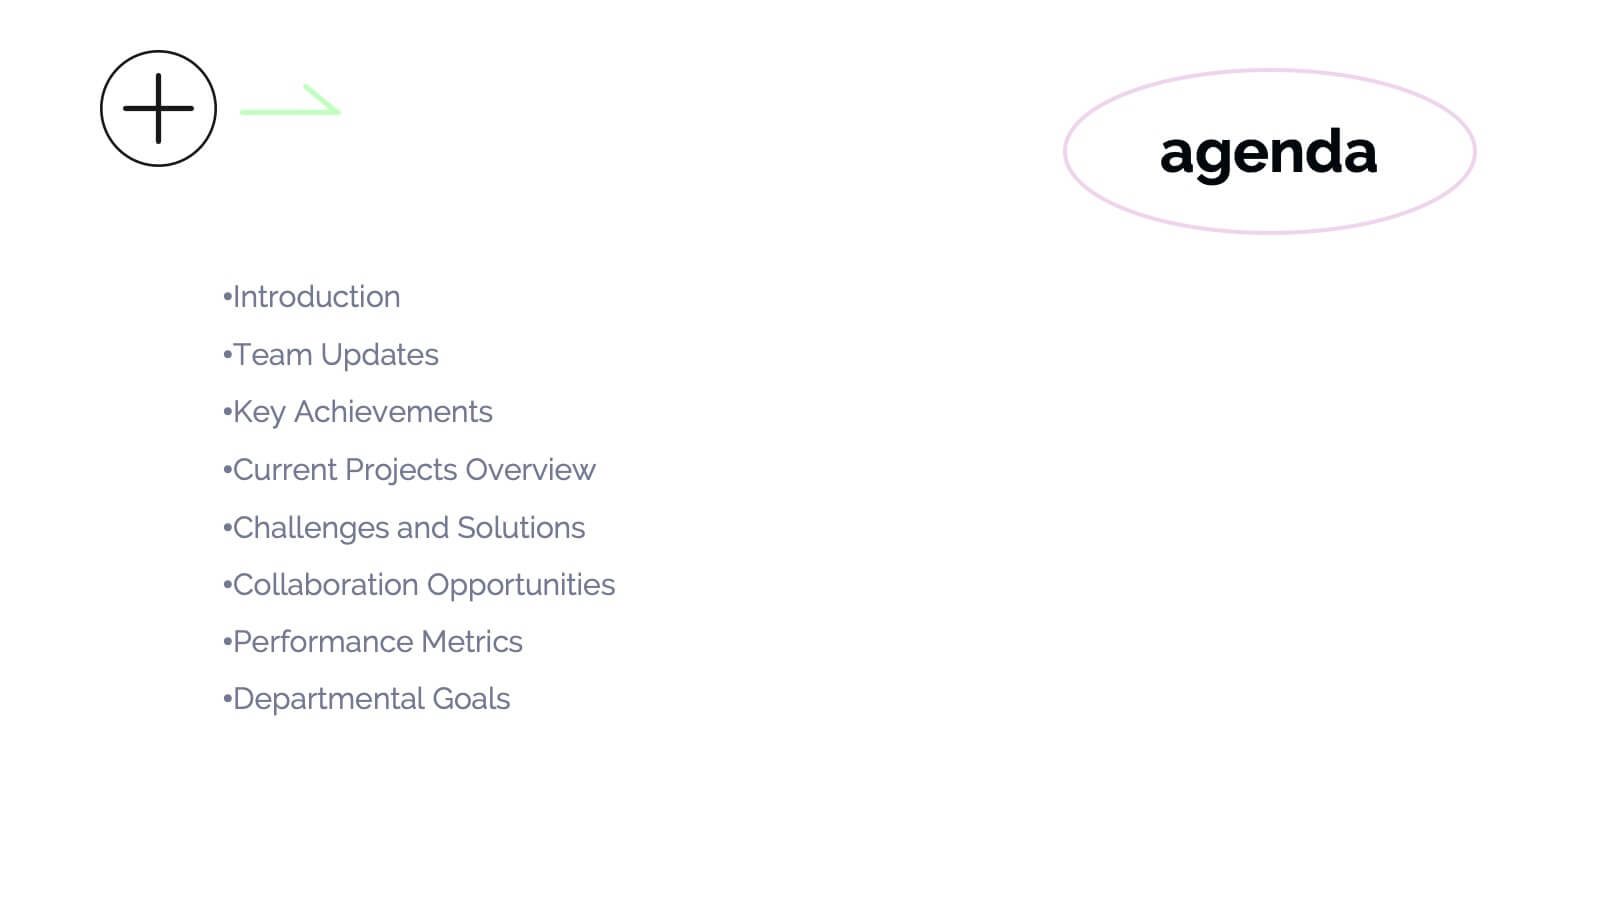
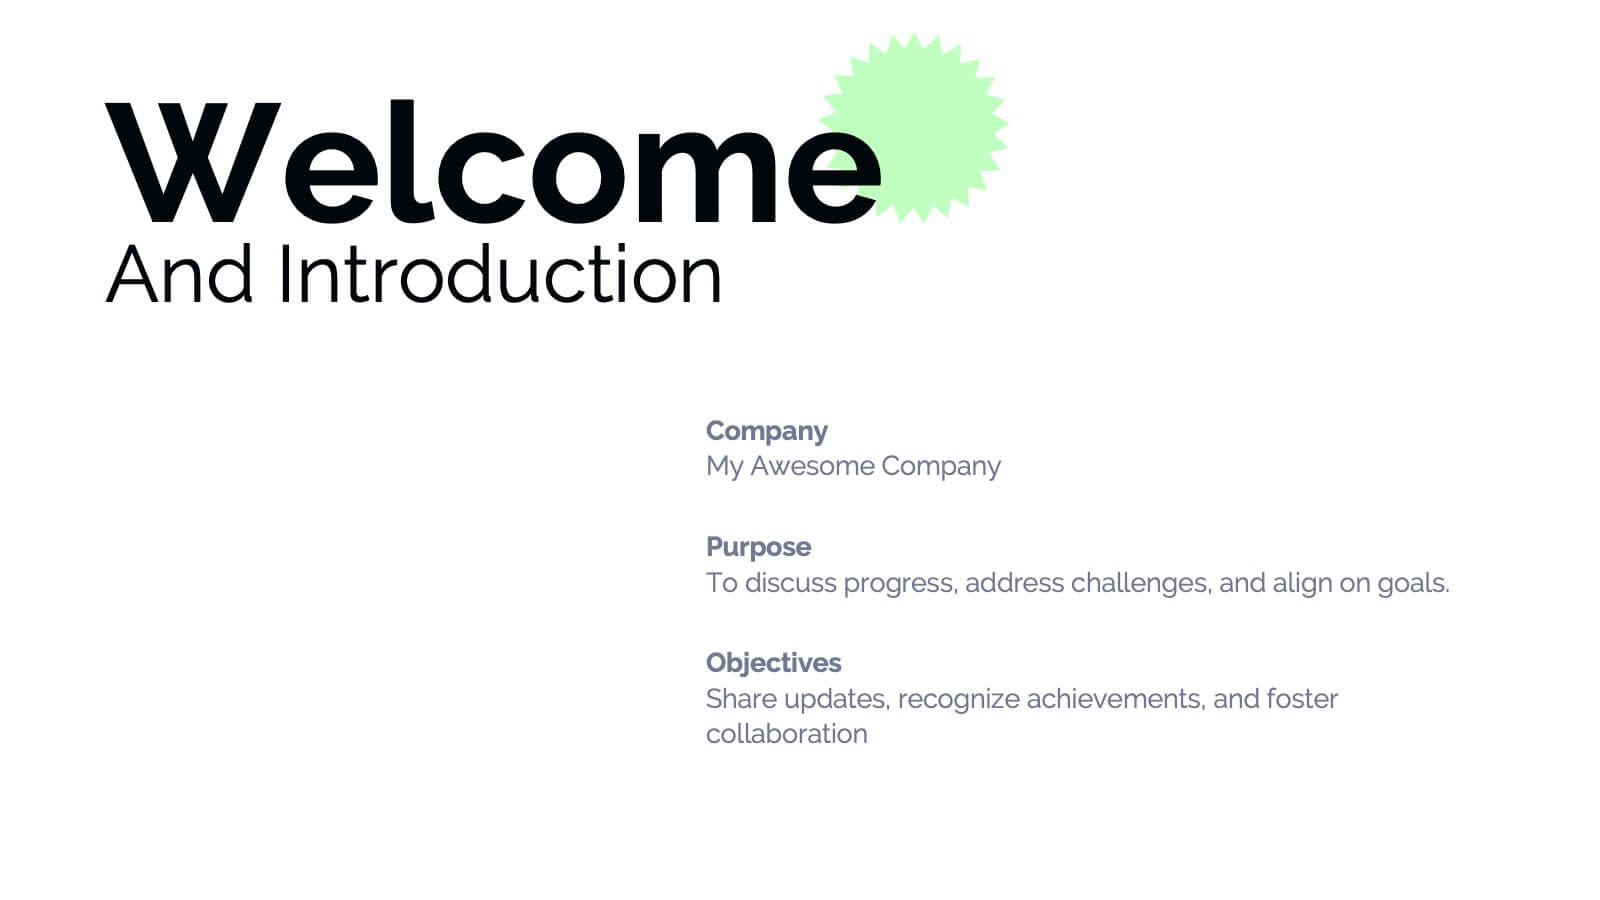
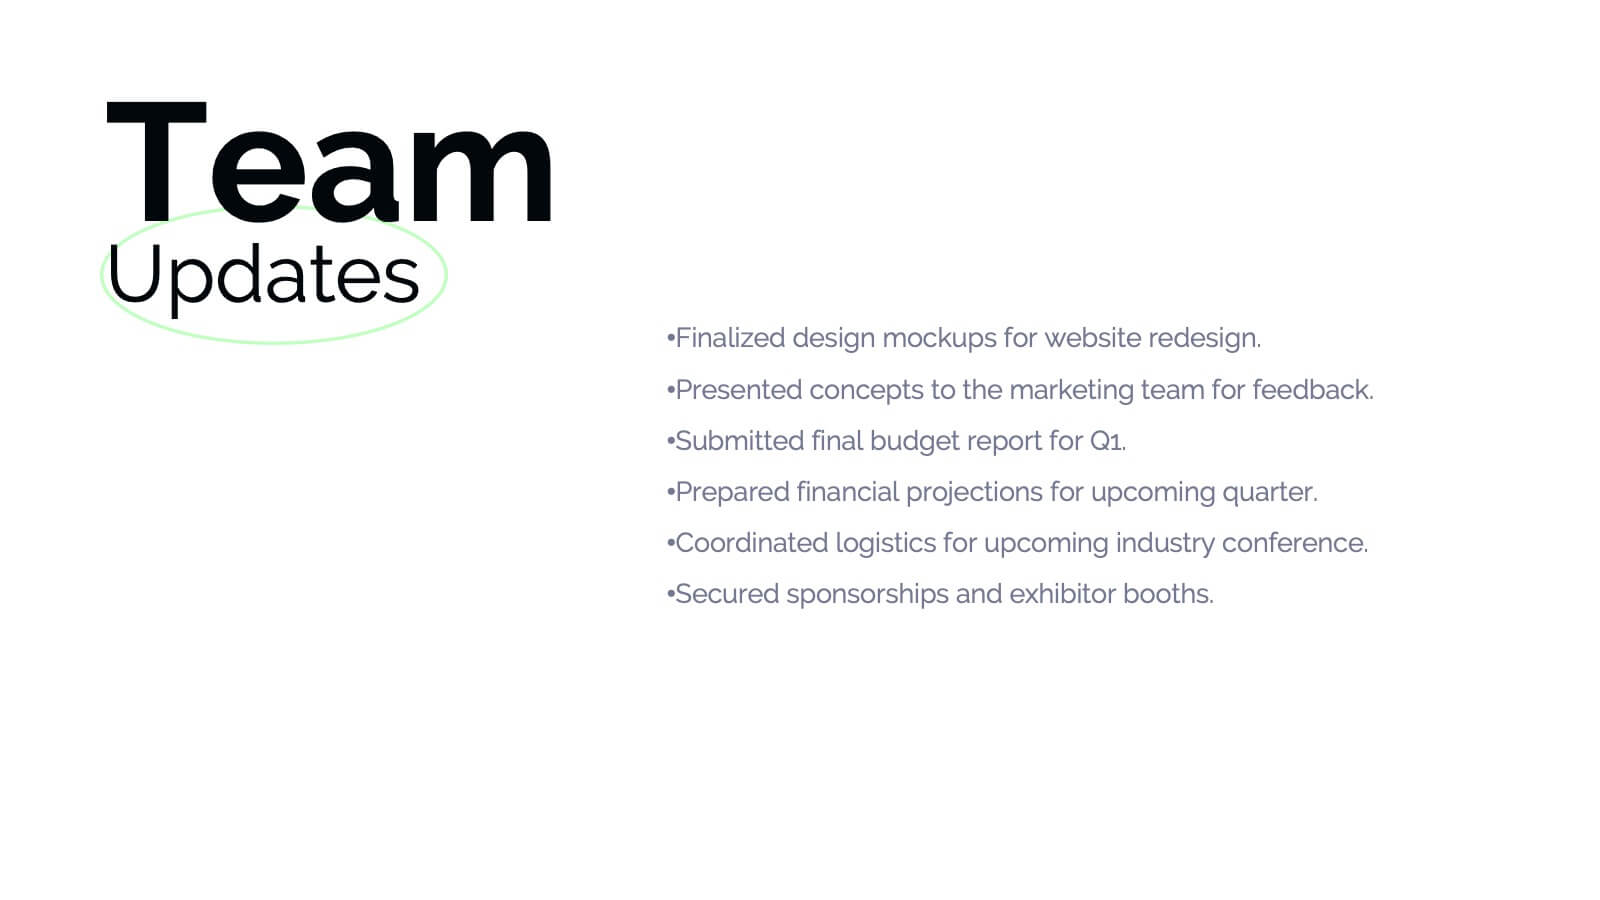
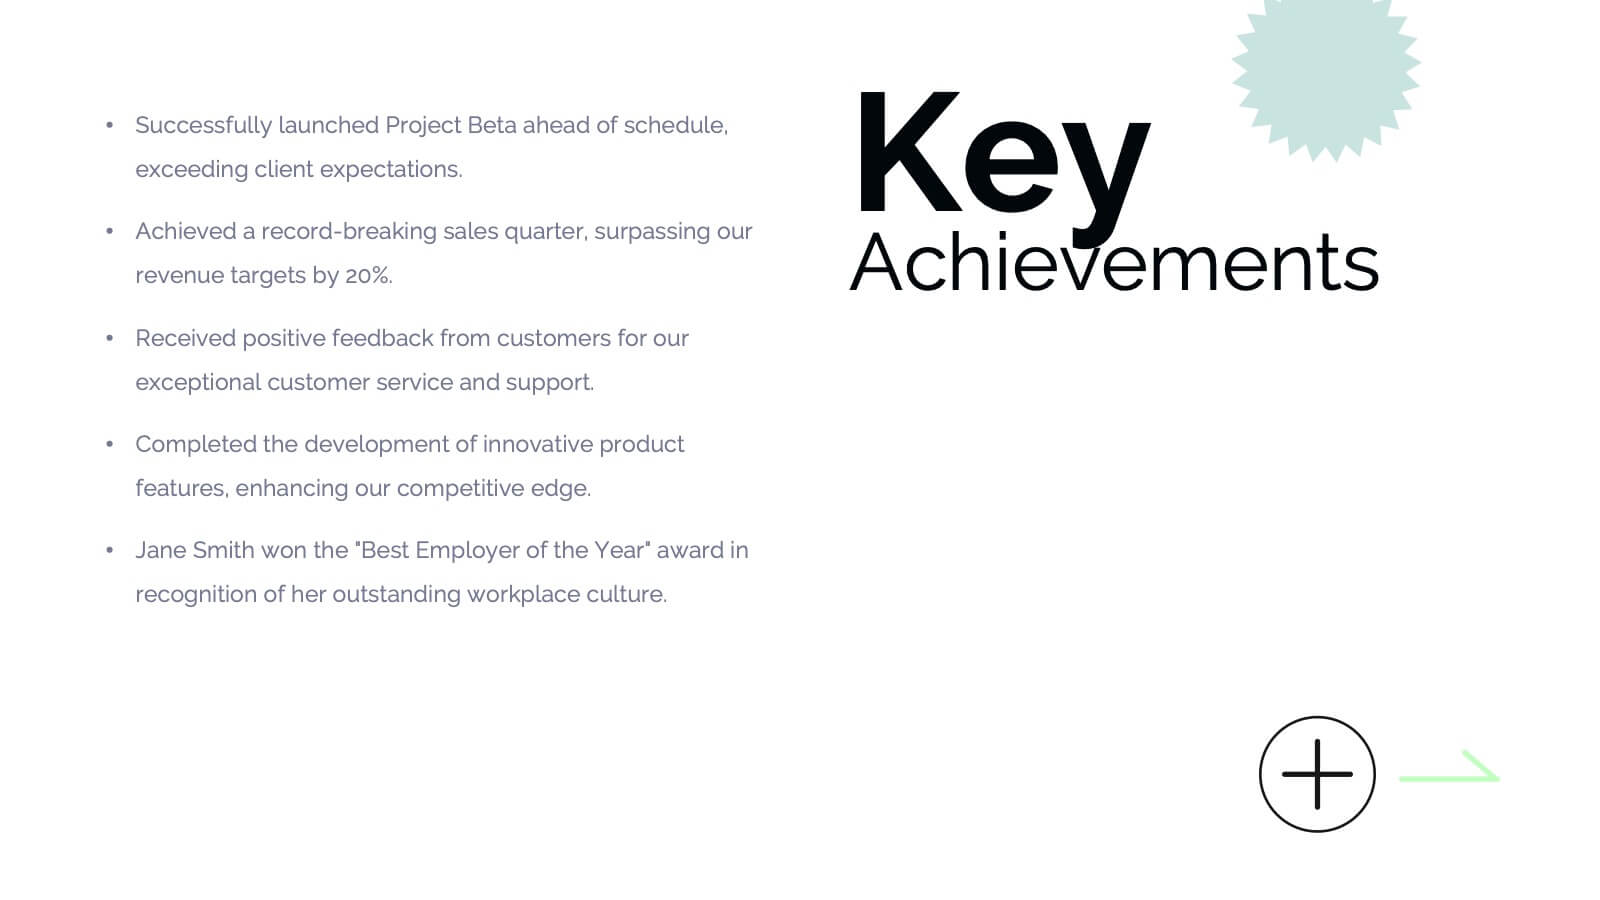
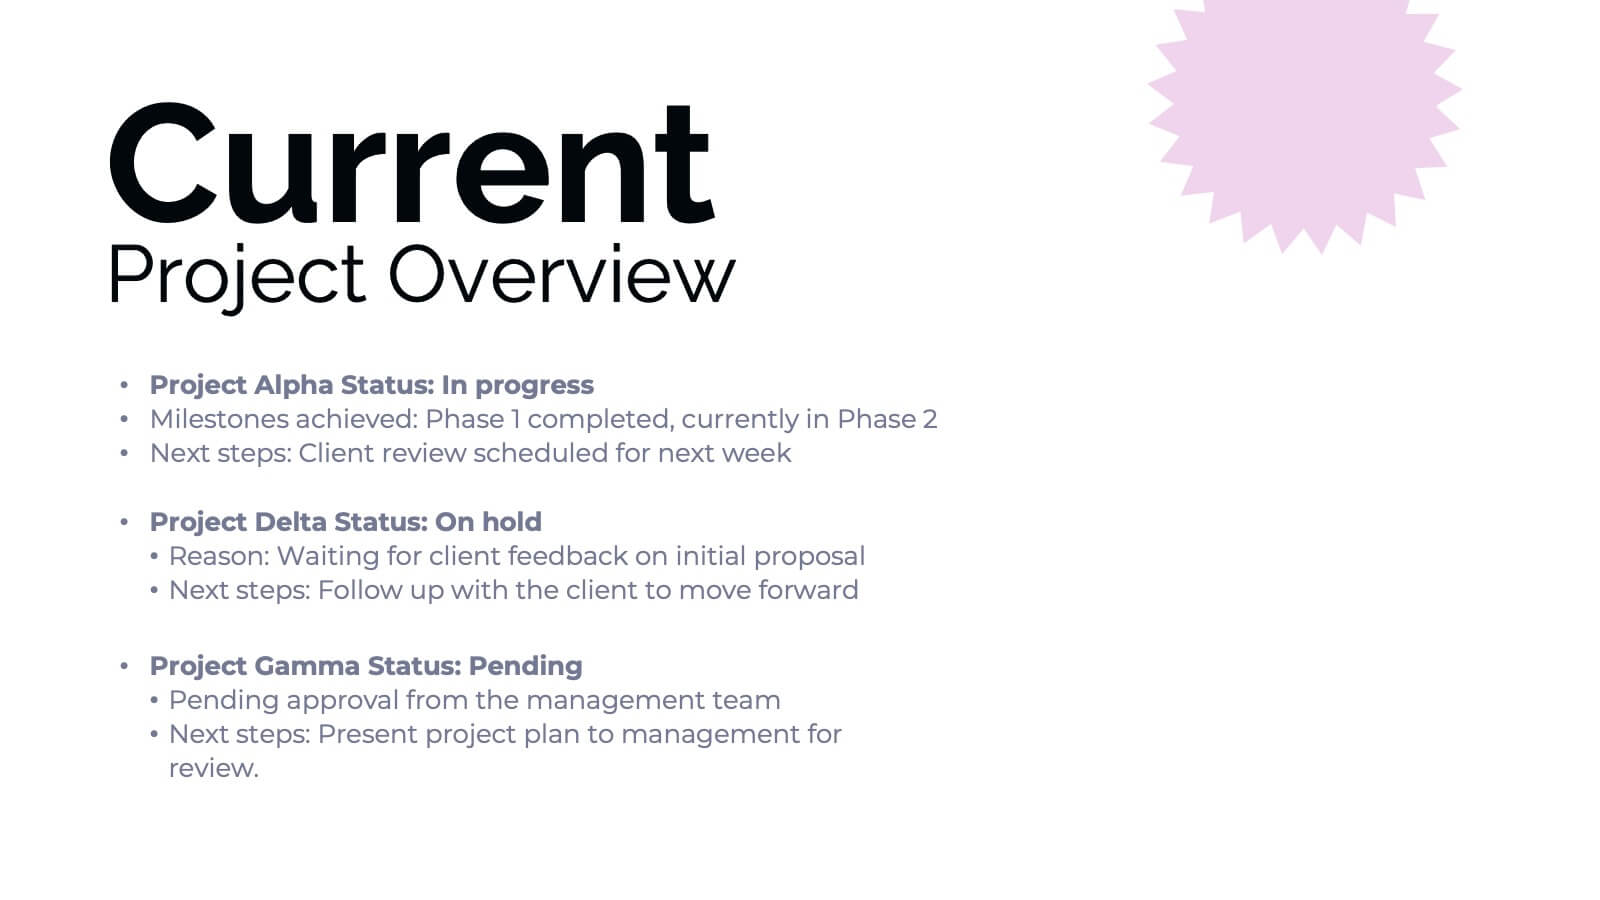
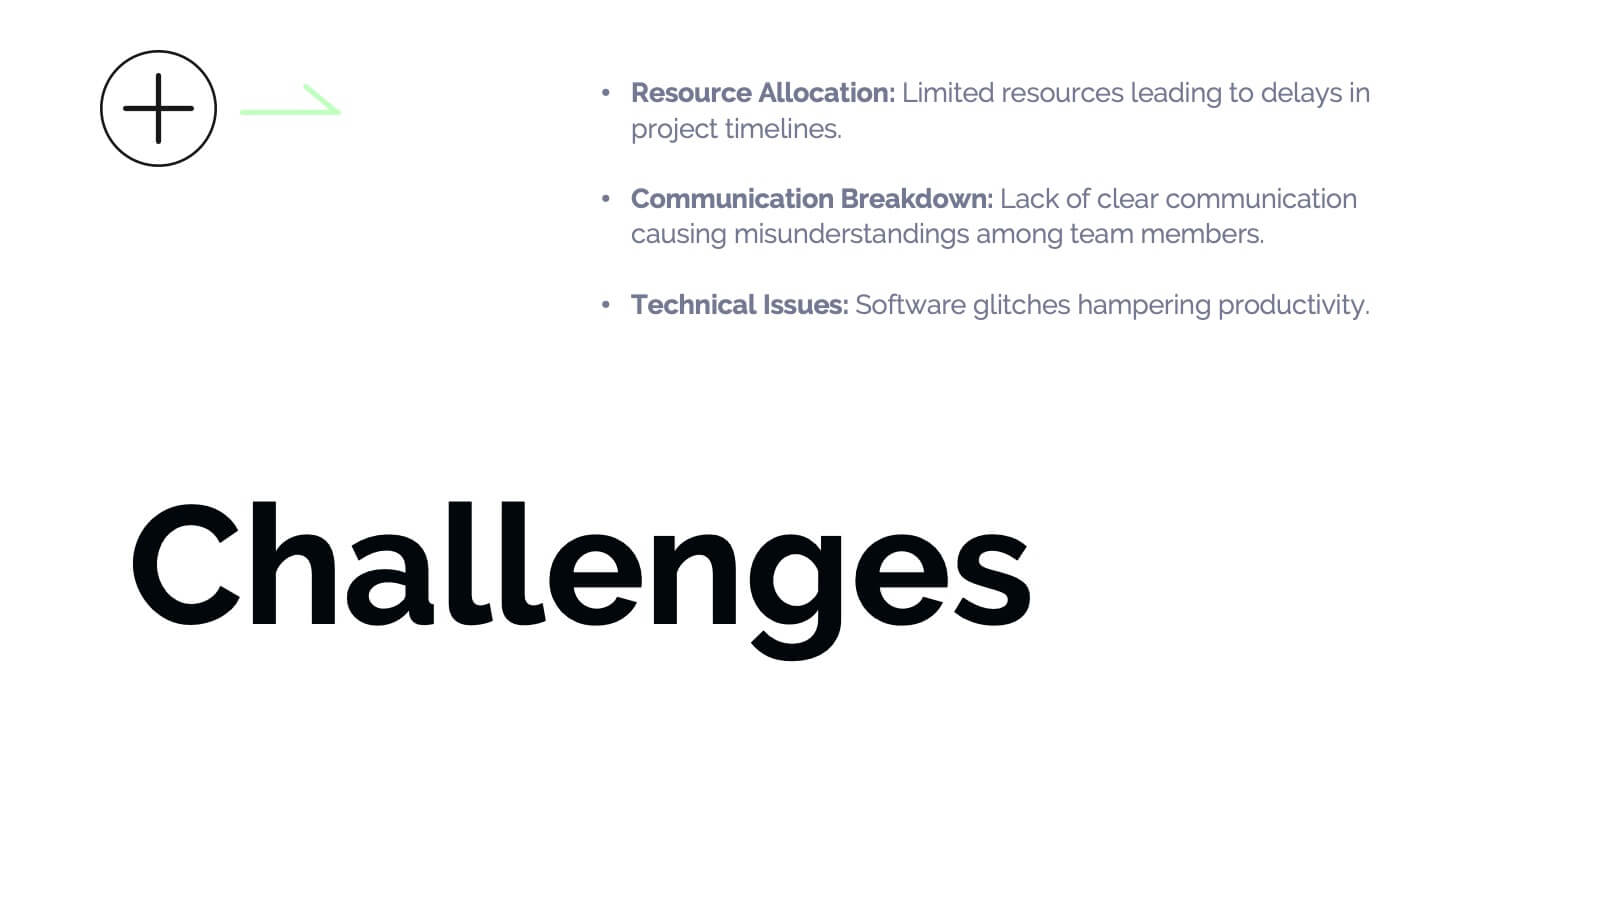
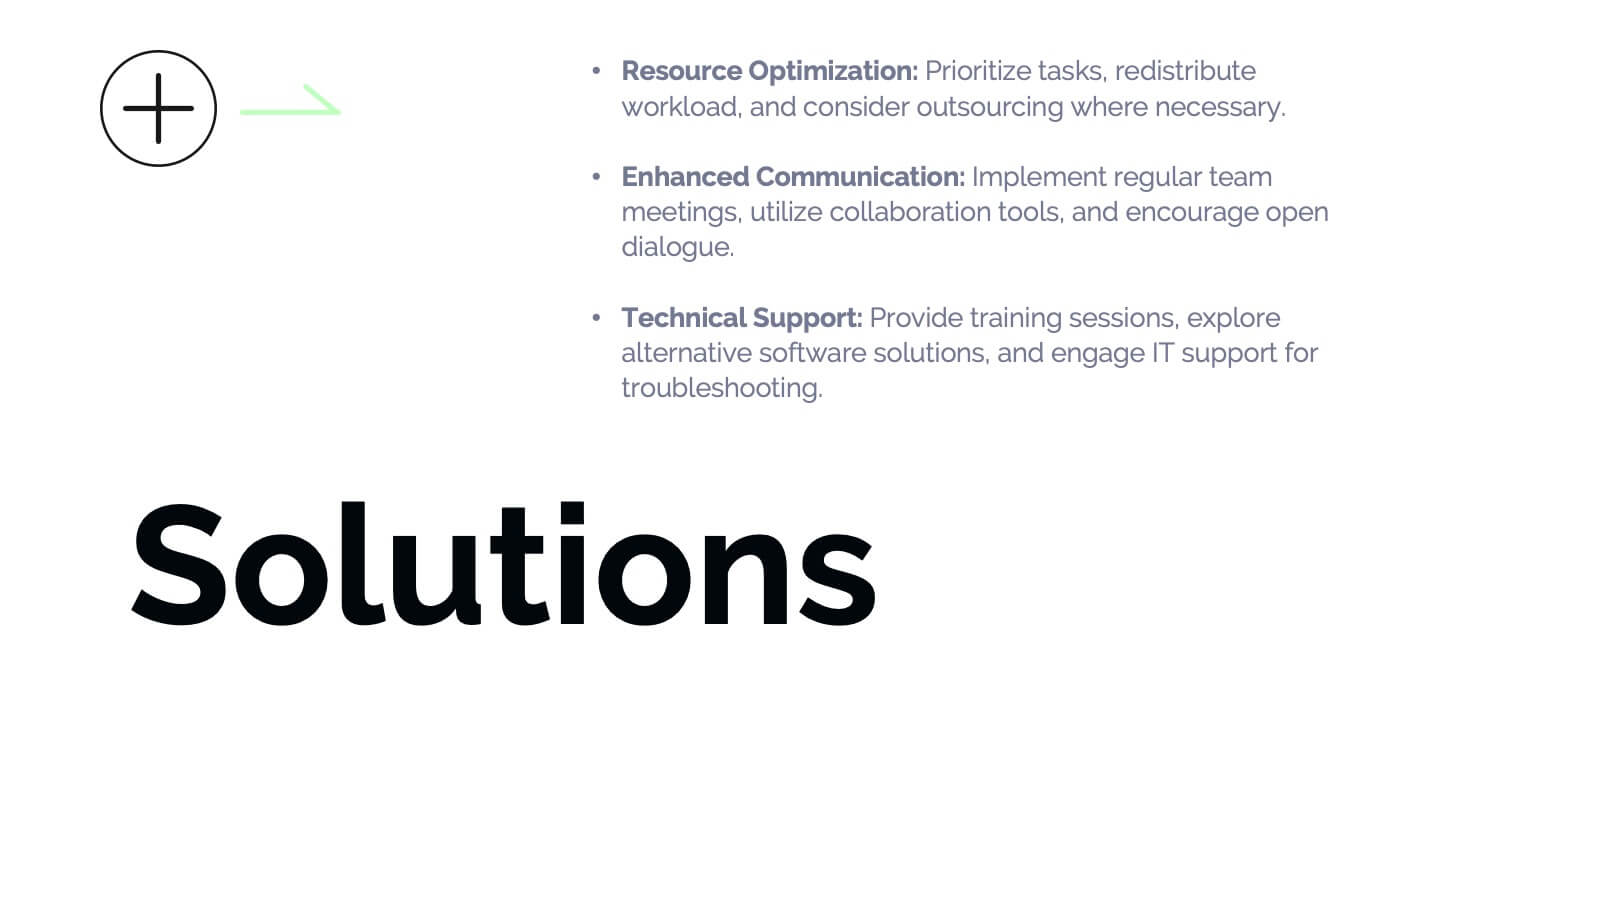
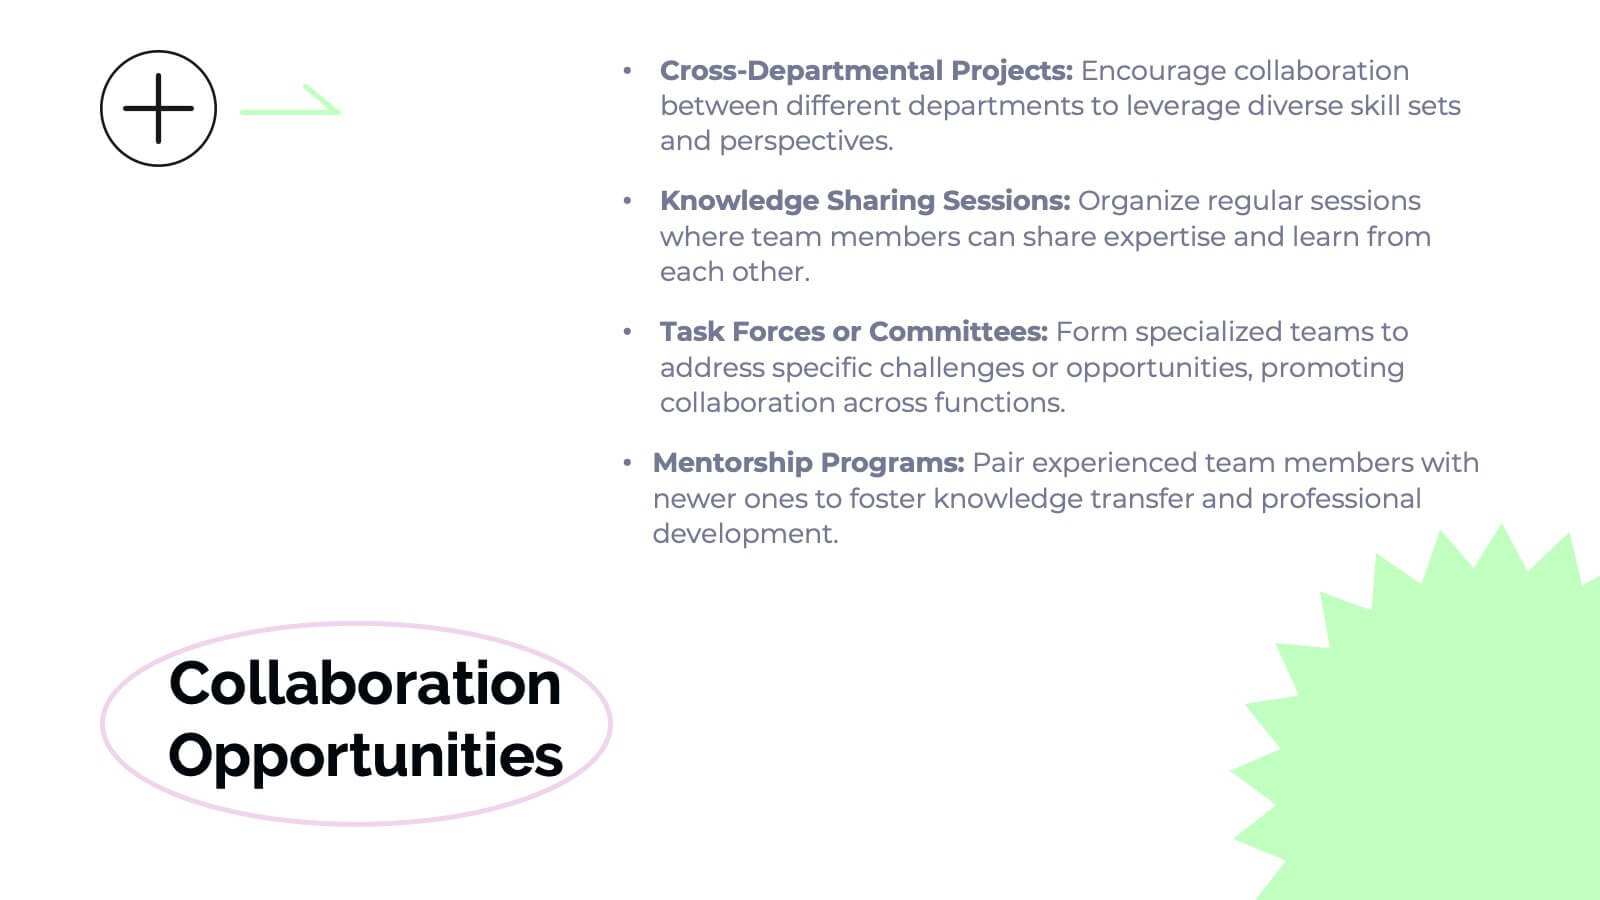
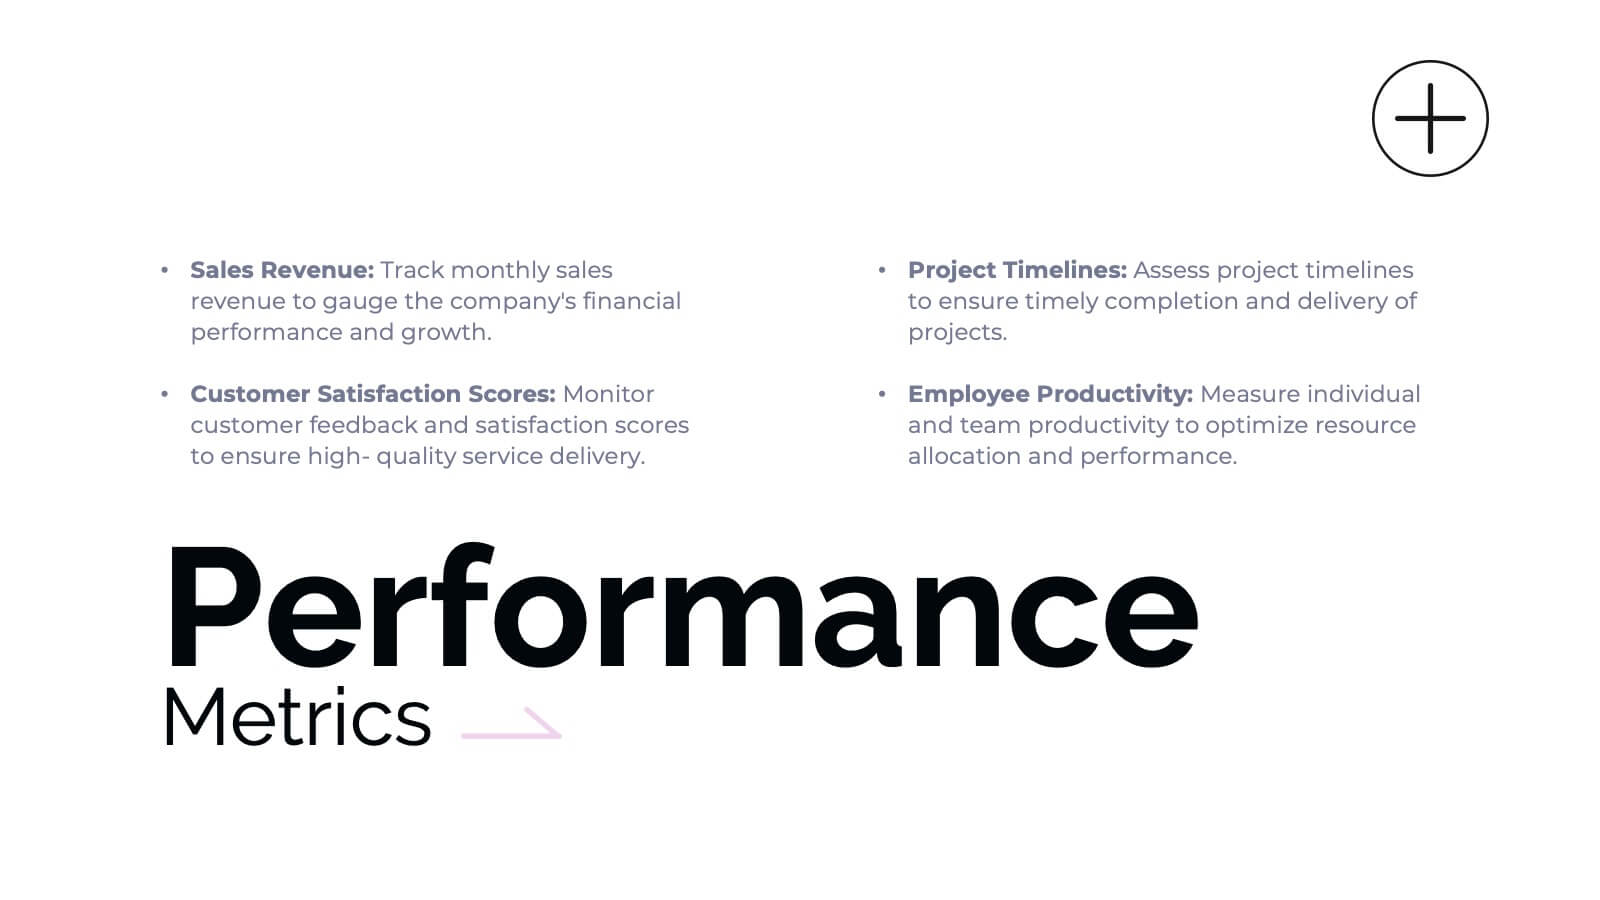
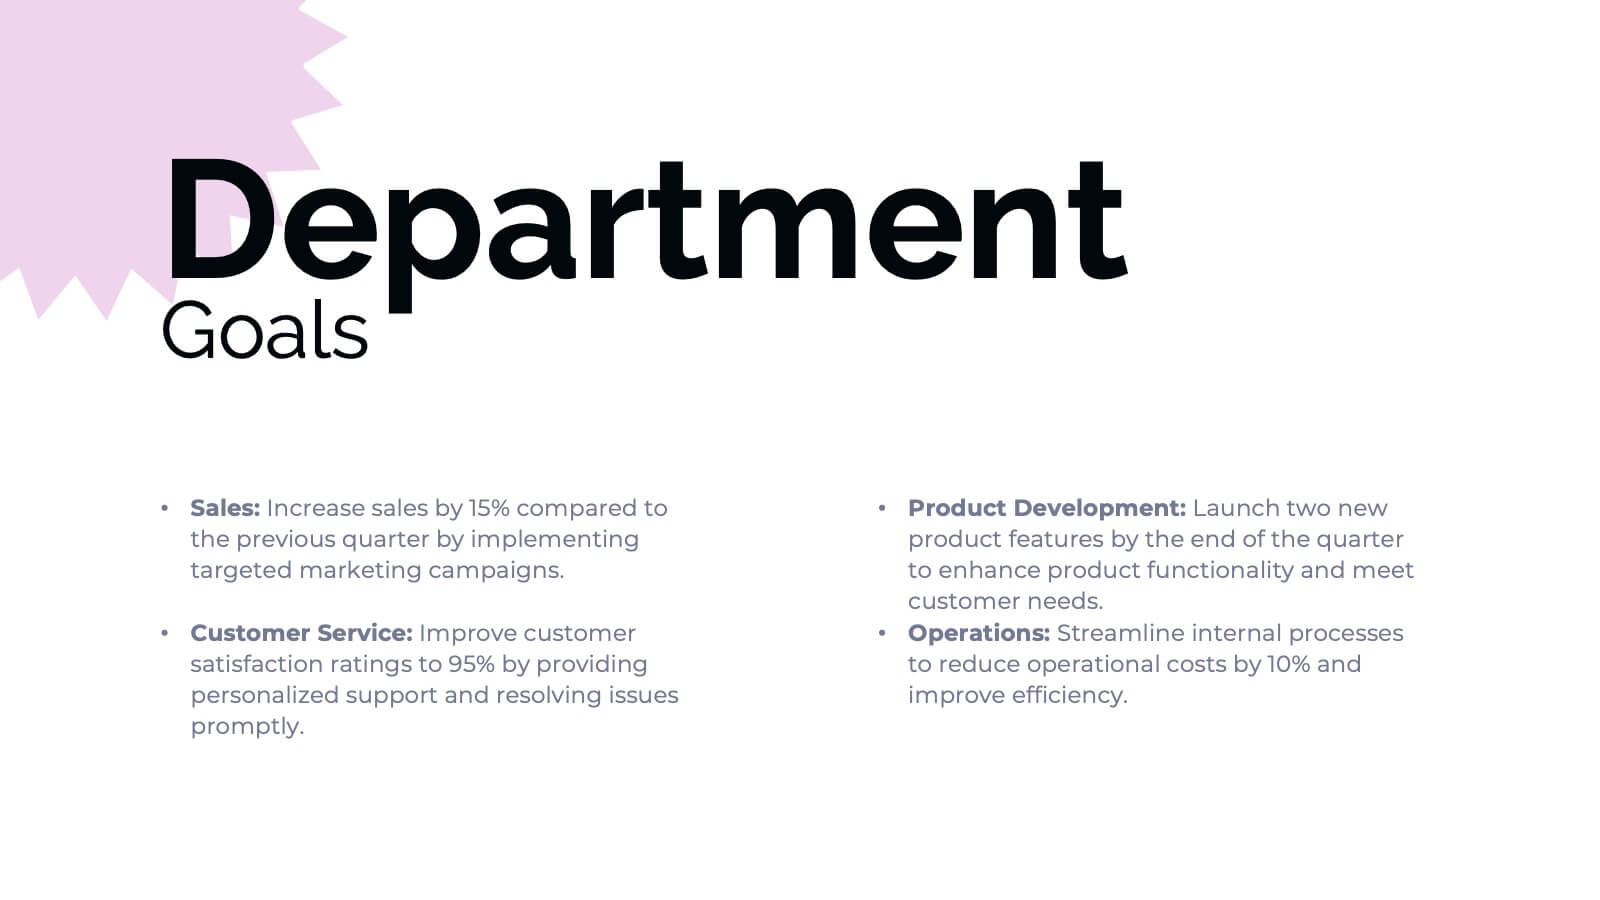
Banshee Business Operations Plan Presentation
Streamline your business operations with this comprehensive presentation template! From team updates and key achievements to challenges and solutions, every aspect of your business plan is covered. Ideal for tracking performance metrics, resource allocation, and upcoming events, this design keeps your operations organized and efficient. Compatible with PowerPoint, Keynote, and Google Slides for seamless integration.


8 diapositivas
Economic Improvement in South America Map Presentation
Highlight regional performance with this South America economic growth map. Featuring 3D bar charts and country-specific markers, it’s ideal for visualizing financial progress, investments, or development trends. Fully editable in PowerPoint, Google Slides, and Keynote, this layout is perfect for reports, forecasts, and business reviews with a geographic focus.


4 diapositivas
Corporate Company Profile Overview Presentation
Present your business story with clarity and impact using this sleek company profile layout. Designed for corporate overviews, it highlights key points alongside a modern visual backdrop. Ideal for executive summaries, strategy decks, or investor briefings—fully editable in PowerPoint, Keynote, and Google Slides for effortless customization and professional results.


6 diapositivas
Professional Company Profile Deck Presentation
Present your business with impact using this modern company profile deck. Designed for clarity and professionalism, it includes structured icons, visual highlights, and customizable content sections. Ideal for pitches, internal briefings, or executive introductions. Fully editable in PowerPoint, Keynote, and Google Slides to match your brand and messaging effortlessly.


20 diapositivas
Sphene Sales Proposal Presentation
Take your sales pitch to the next level with this elegant and structured presentation template! Featuring sections on sales objectives, process, pricing strategies, and performance metrics, this template is ideal for impressing potential clients and closing deals. It’s easy to customize and works seamlessly with PowerPoint, Keynote, and Google Slides for hassle-free presentation creation.


26 diapositivas
Company Profile and Accomplishments Presentation
A company profile is a document that provides an overview of a business entity. This template serves as a company introduction, presenting essential information about company history, products or services, achievements, goals, and other relevant details. This template showcases the milestones and capabilities of a company. This presentation is perfect for businesses, startups, or organizations looking to highlight their success, growth, and overall expertise in their industry. The clean layout, engaging visuals, and comprehensive information, will help your presentation leave a lasting impression on your audience and enhance your company's reputation.


20 diapositivas
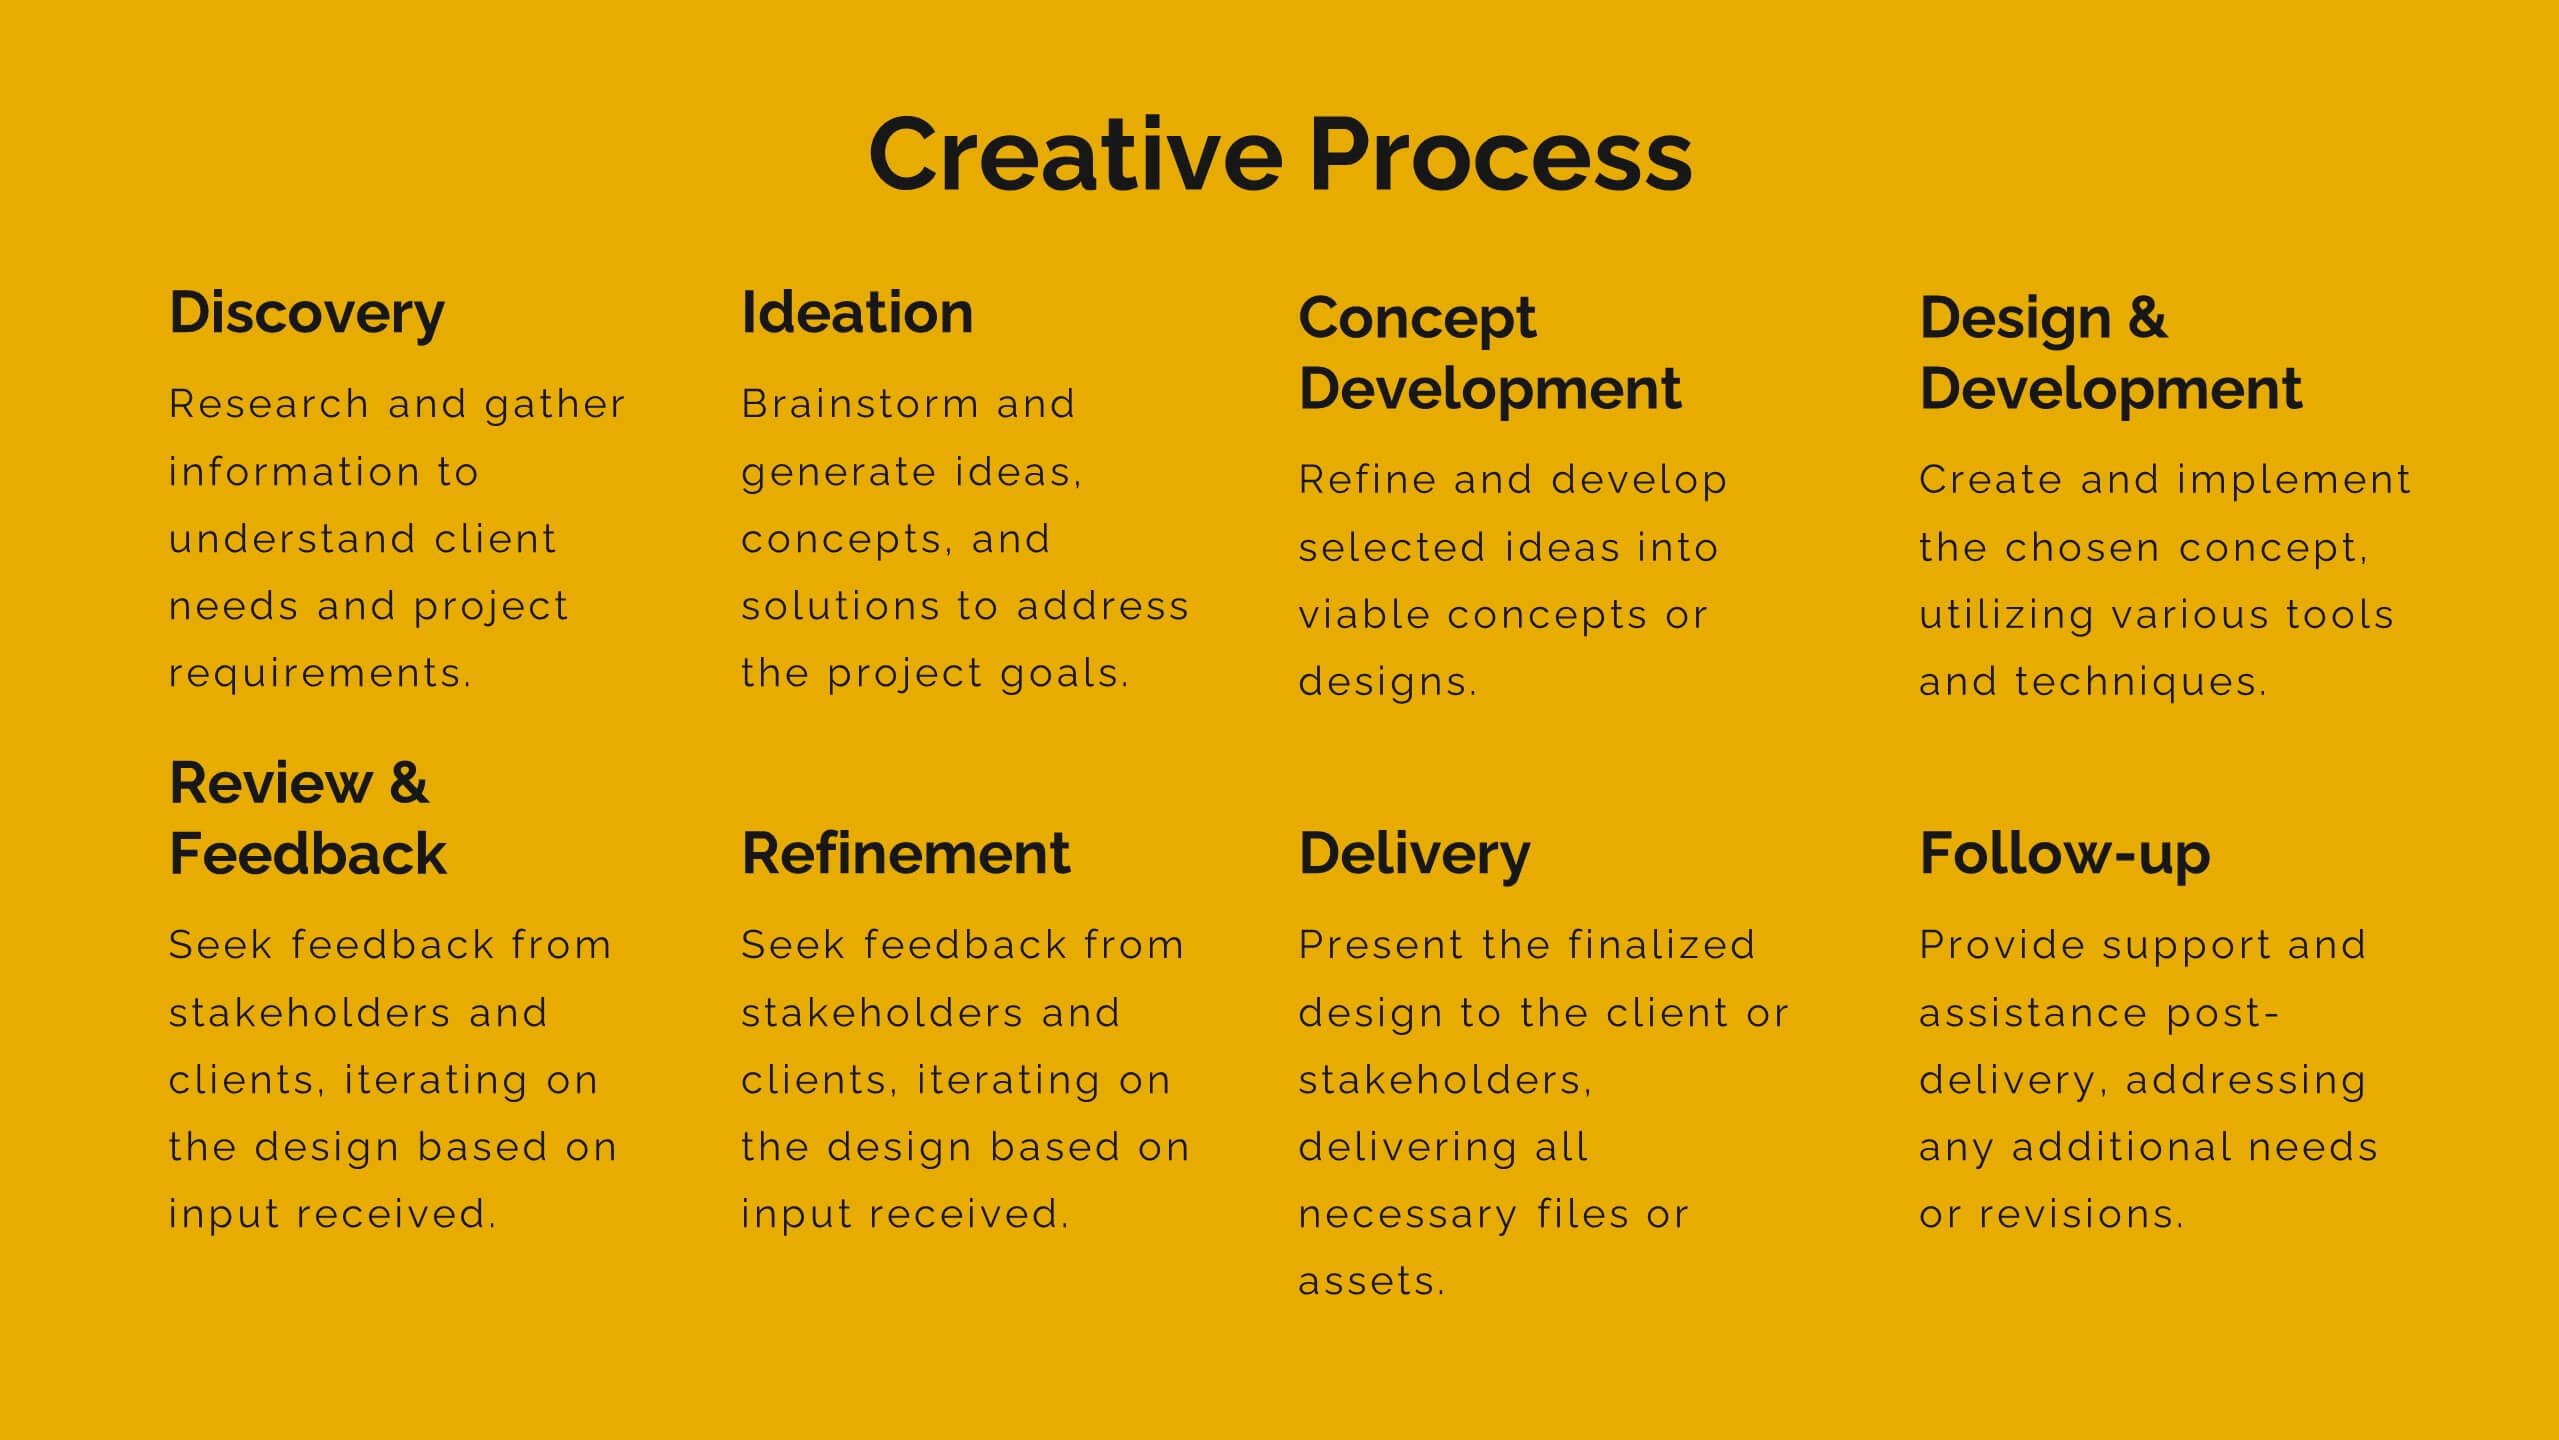
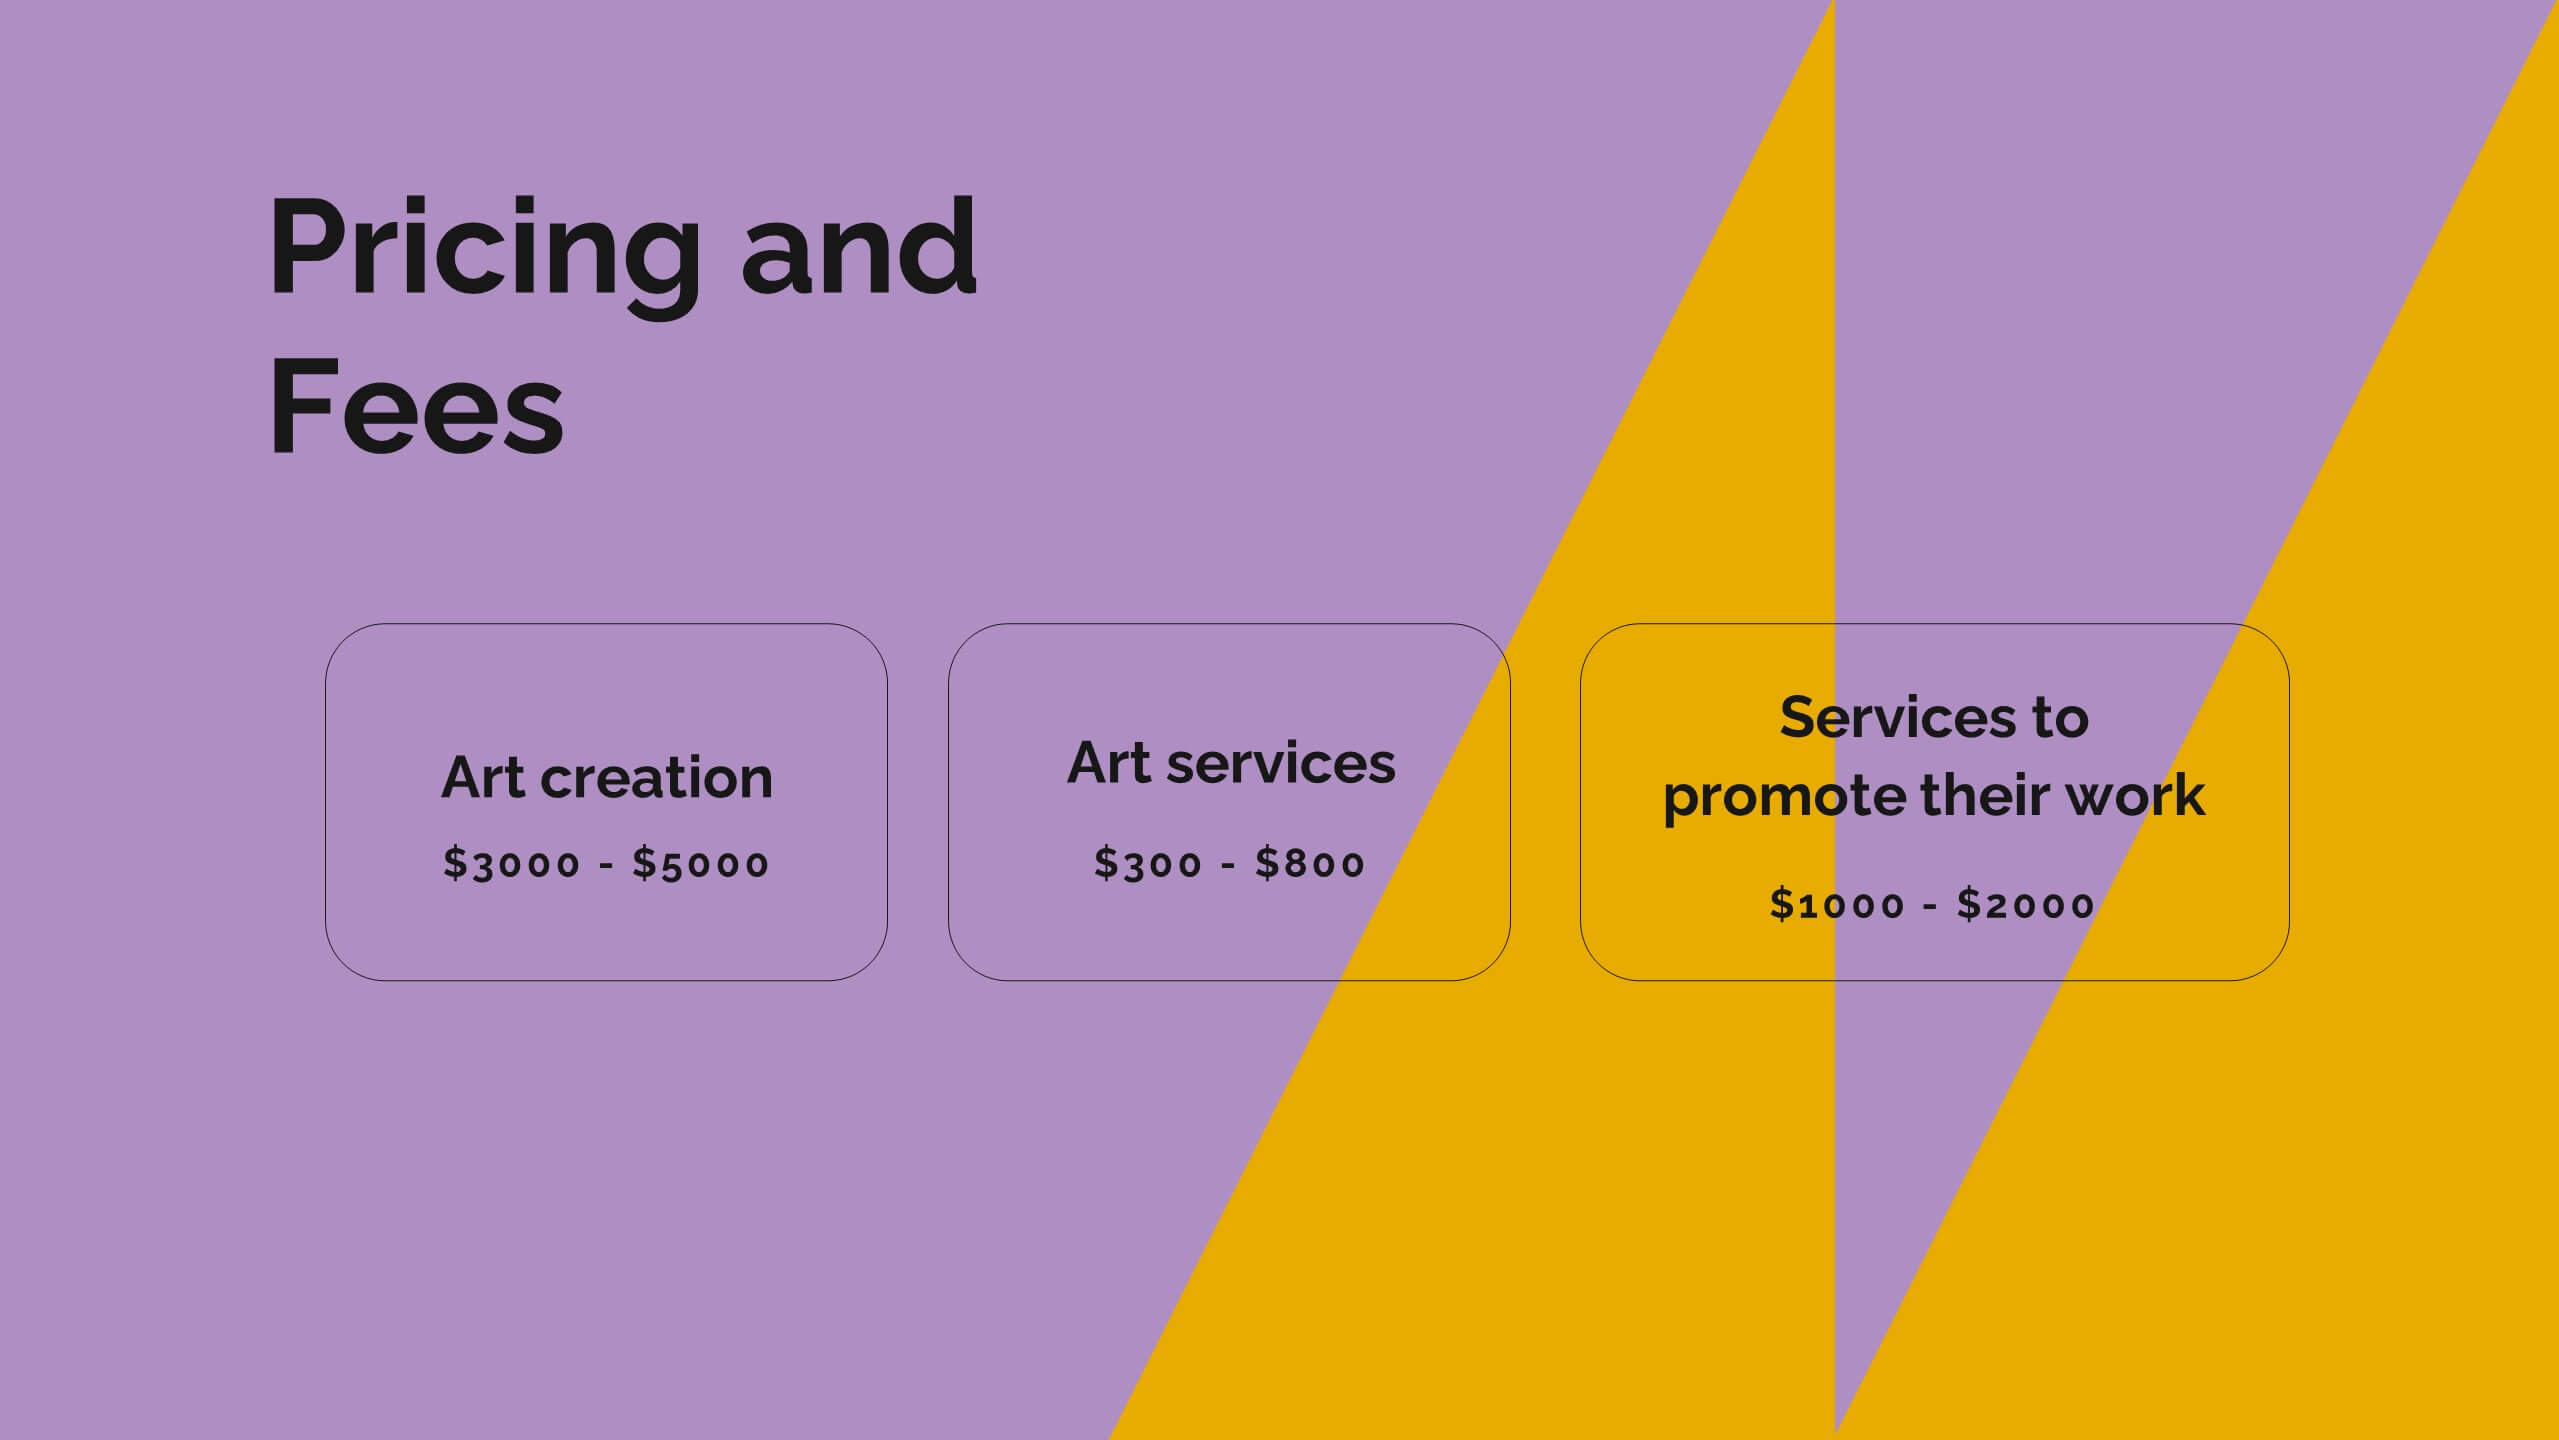
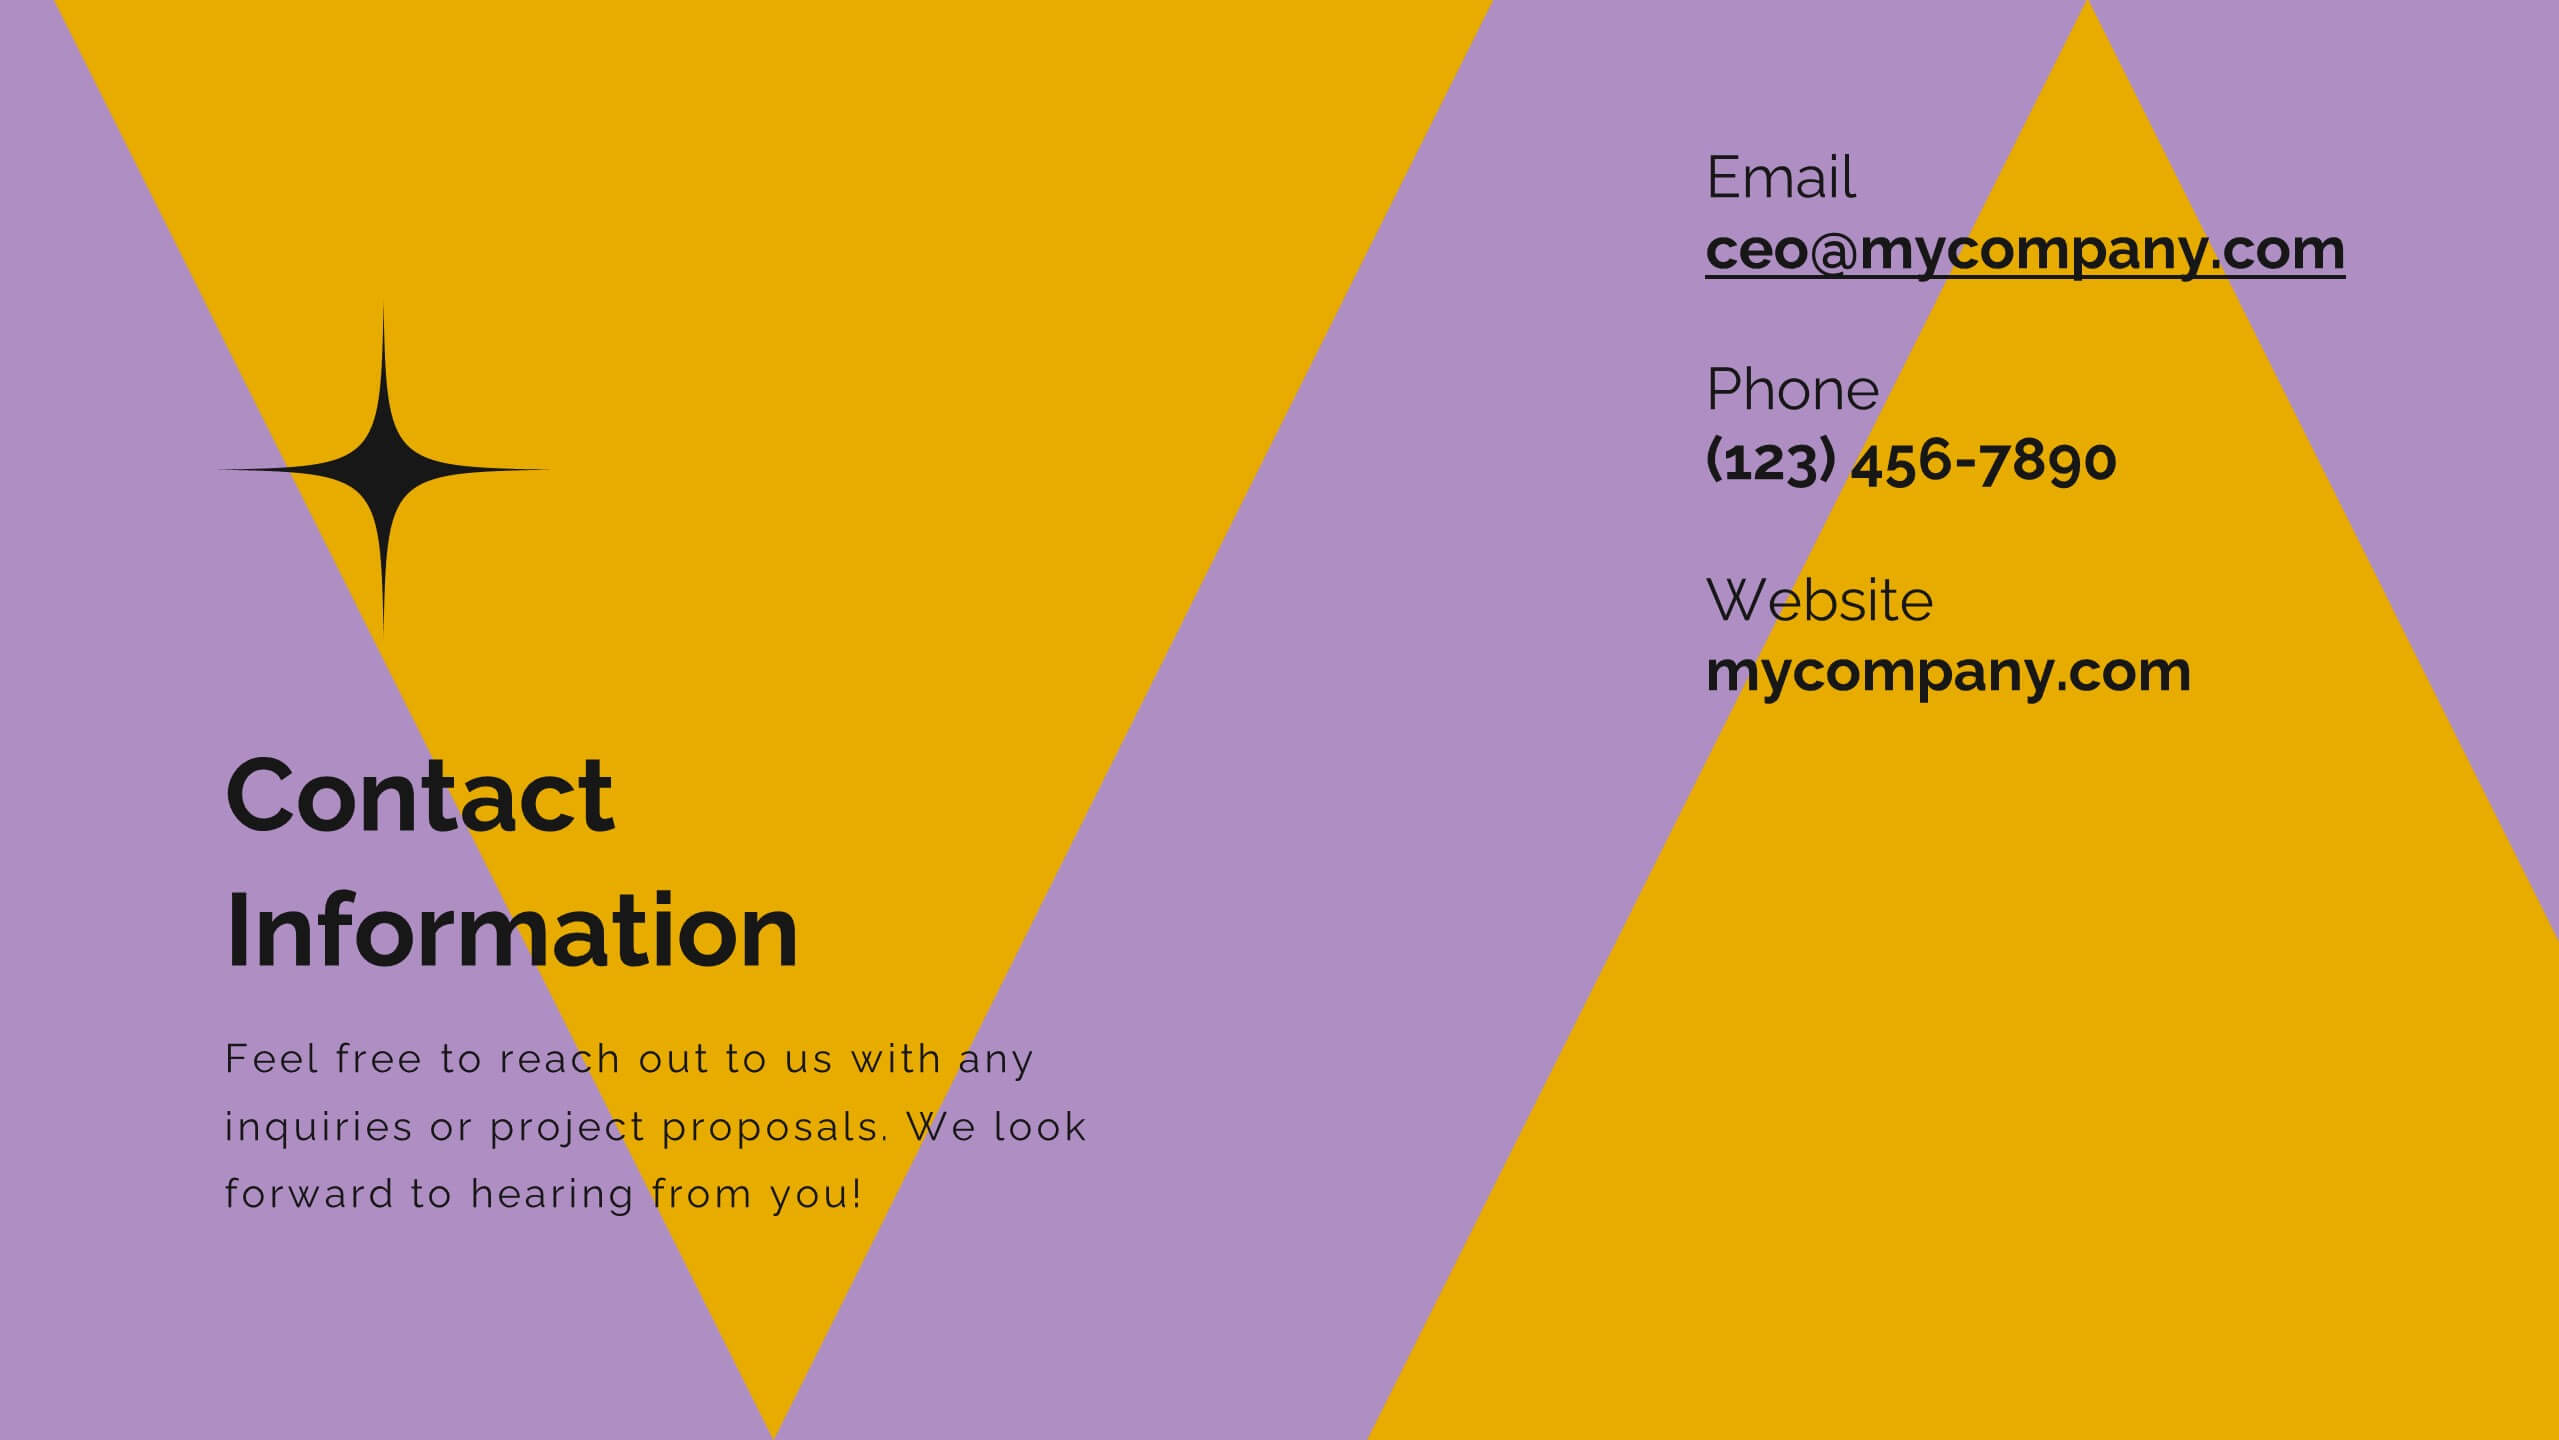
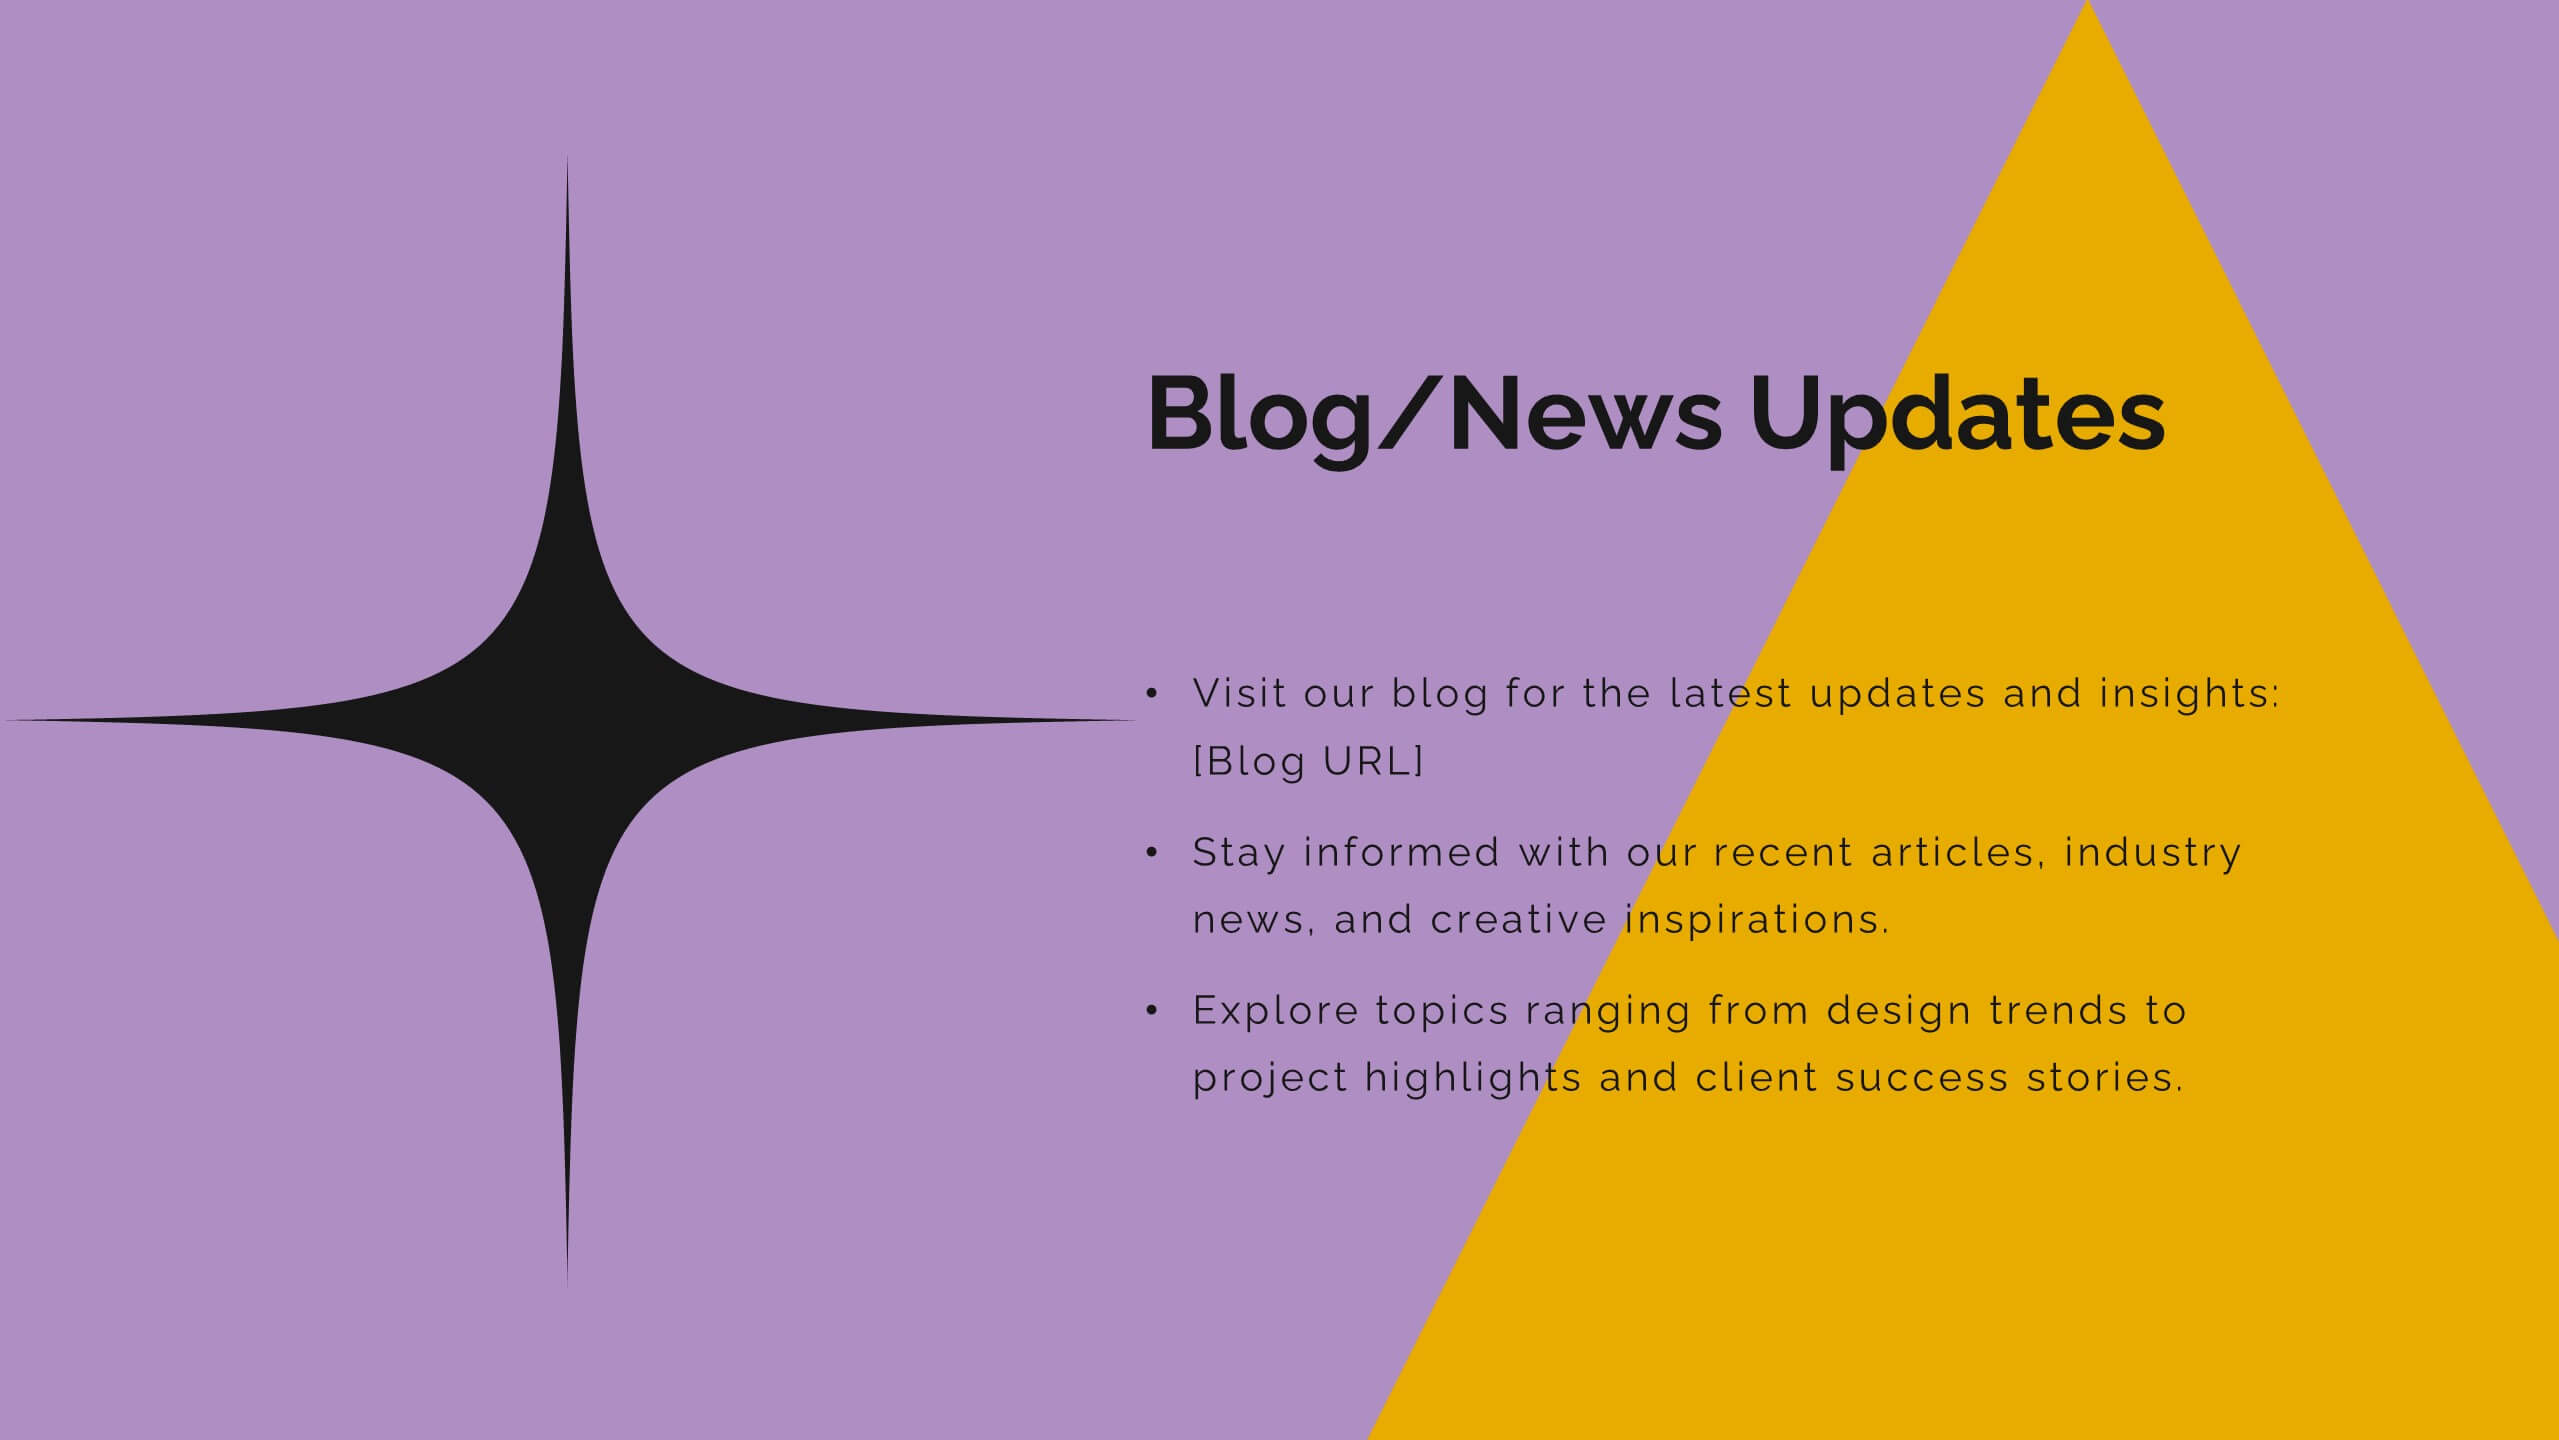
Axisflare Artist Portfolio Presentation
Showcase your creative journey with this vibrant artist portfolio template, featuring sections for project highlights, philosophy, style, and client testimonials. Ideal for presenting your work and artistic approach, this template is compatible with PowerPoint, Keynote, and Google Slides for seamless presentation across various platforms.


5 diapositivas
Skills Gap Assessment Presentation
Spot talent strengths and uncover hidden weaknesses with a clean, visual layout that makes workforce insights easy to understand. This presentation helps teams evaluate current abilities, identify missing competencies, and plan targeted development. Ideal for HR, training, and leadership reviews. Fully compatible with PowerPoint, Keynote, and Google Slides.


22 diapositivas
Arachne Digital Marketing Strategy Plan Presentation
Weave a powerful digital marketing strategy with this sleek, Arachne-inspired presentation! Perfect for outlining your digital marketing plans, this template helps you highlight key strategies, analytics, and campaign goals in a structured and visually engaging way. Its modern design keeps your audience focused. Compatible with PowerPoint, Keynote, and Google Slides.