


Características


¿Tienes alguna pregunta?
Recomendar


5 diapositivas
Future of 5G and Wireless Innovation Presentation
Step into the next era of connectivity with a clean, visual story that highlights how emerging wireless technologies continue to evolve. This presentation helps you explain trends, breakthroughs, and network innovations in a clear, modern layout. Fully compatible with PowerPoint, Keynote, and Google Slides.


6 diapositivas
Data Table Format Presentation
Bring clarity to your data with a clean, modern layout that helps your audience compare details at a glance. This presentation is perfect for pricing, feature breakdowns, or structured business insights, keeping information organized and easy to read. Fully compatible with PowerPoint, Keynote, and Google Slides.


6 diapositivas
Ecommerce KPI Dashboards Infographic
Elevate your eCommerce reporting with our comprehensive KPI Dashboard Infographics. Tailored for seamless integration with PowerPoint, Google Slides, and Keynote, this template offers a clear and colorful representation of key performance indicators critical to online business success. From tracking sales growth to monitoring customer engagement metrics, our infographics provide an intuitive layout to display data-driven insights that drive decision-making. This template transforms complex data sets into straightforward visuals, making it easier to communicate progress with your team. Use this template to keep a pulse on your eCommerce performance and narrate the story behind the numbers.


6 diapositivas
Top Benefits Breakdown Presentation
Showcase your strongest advantages with a clean, structured layout that highlights each benefit clearly and effectively. This modern design is perfect for presenting key selling points, service features, or strategic highlights in a professional way. Fully customizable and compatible with PowerPoint, Keynote, and Google Slides for seamless editing and presentation.


5 diapositivas
SMART Objective Planning for Success Presentation
Turn your goal-setting process into a clear, actionable strategy with this SMART Objective Planning slide. Designed around the SMART framework—Specific, Measurable, Achievable, Relevant, Time-bound—this layout helps you articulate objectives with clarity and focus. Each segment features a bold letter with icons and editable descriptions beneath. Ideal for planning sessions, strategic reviews, and team alignment meetings. Compatible with PowerPoint, Keynote, and Google Slides.


2 diapositivas
Bold and Minimal Opening Presentation Layout
Make your first slide speak volumes with this bold yet minimal opening layout. Designed to grab attention while keeping things simple, this template helps you introduce your presentation with clarity and confidence. Great for modern business decks, it’s fully customizable and works seamlessly in PowerPoint, Keynote, and Google Slides.


5 diapositivas
Regional Development in Oceania Map Presentation
The Regional Development in Oceania Map template provides a comprehensive visualization of growth and development metrics across various regions in Oceania. This template is designed to aid in presenting demographic data, economic indicators, or development status in a clear, easily understandable format. It's suitable for reports, presentations, and educational materials. Compatible with PowerPoint, Keynote, and Google Slides.


4 diapositivas
Corporate Hierarchy Levels Diagram Presentation
Visualize organizational structures clearly with this Corporate Hierarchy Levels Diagram Presentation. Designed for showcasing leadership flow, team divisions, or reporting relationships, each slide features a simple tiered layout with editable icons and placeholders. Great for business planning, team introductions, or org chart overviews. Fully customizable in PowerPoint, Keynote, Canva, and Google Slides.


4 diapositivas
Management Levels Hierarchy
Illustrate your team’s structure using this modern pyramid-style hierarchy chart. Featuring space for names, roles, and profile photos, it’s ideal for highlighting top, middle, and lower-level management. Fully editable in PowerPoint, Keynote, and Google Slides.


7 diapositivas
Business Plan Process Infographic
Unveil the roadmap to entrepreneurial success with our business plan process infographic. This simple and streamlined infographic encapsulates the quintessential steps to draft a robust business plan, guiding entrepreneurs and business professionals on their journey to creating a successful enterprise. This infographic is an indispensable tool for budding entrepreneurs, business consultants, educators, and anyone looking to gain insights into the formulation of a business plan. Designed for seamless integration with PowerPoint, Keynote, or Google Slides, this template promises a presentation that is both engaging and educative.


26 diapositivas
Navigating the Creative Industry Presentation
Unlock the secrets to success in the creative industry with this dynamic and visually engaging presentation. Covering essential topics like career pathways, industry trends, collaboration strategies, and personal branding, this template helps you present insights with clarity and impact. Fully customizable and compatible with PowerPoint, Keynote, and Google Slides for a seamless experience.


20 diapositivas
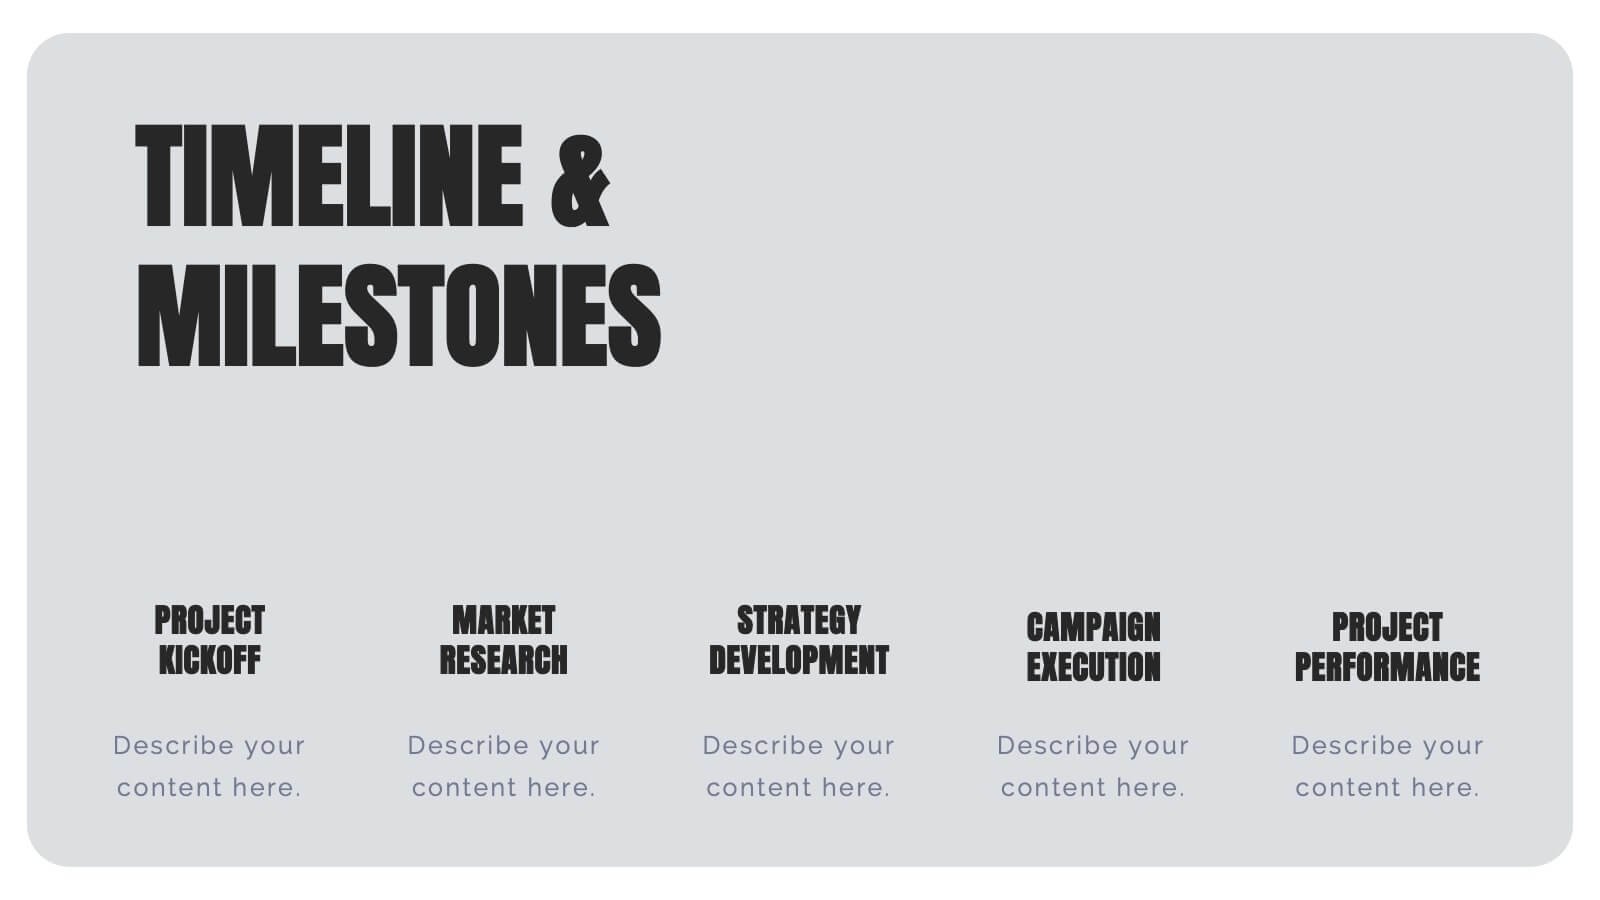
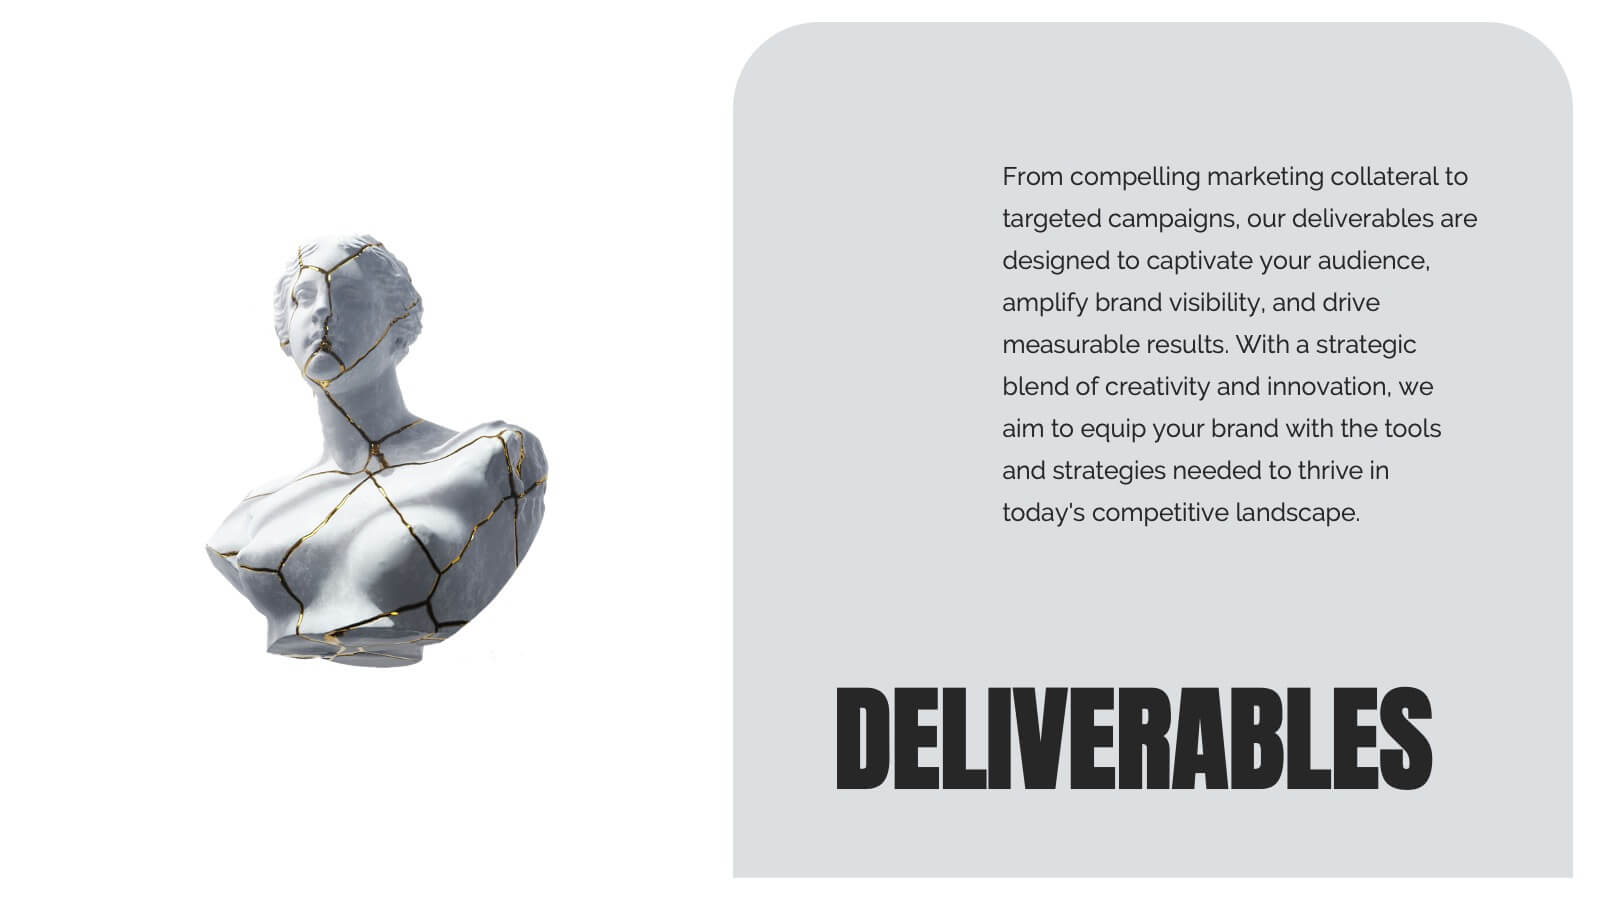
Venus Design Proposal Presentation
Present your design proposal with confidence using this sleek and professional layout! It includes everything from problem statements and proposed solutions to budget breakdowns, milestones, and team expertise, ensuring every detail is covered. Ideal for client presentations or internal project pitches, this template is fully compatible with PowerPoint, Keynote, and Google Slides.


4 diapositivas
Social and Professional Networking
Visualize global connections and collaborative ecosystems with this Social and Professional Networking presentation. Ideal for HR teams, marketers, or networking strategists, it showcases relationship-building and engagement across key hubs. Fully customizable in PowerPoint, Keynote, and Google Slides for maximum flexibility in any professional setting.


7 diapositivas
Sustainability Management Infographics Presentation Template
Sustainability management is a management discipline that enables organizations to understand and integrate the environmental, social and economic aspects of sustainability in all their activities. A community will be more likely to reduce energy, water and waste if they have the management available to set goals for their business. This template is perfect if you are looking for sustainability and elements needed to meet your goals. This template is designed to support an organization's efforts to improve its performance, packed with illustrations you can customize and add your own tips too.


7 diapositivas
Data-Driven Market Segmentation Presentation
Visualize customer segments with clarity using the Data-Driven Market Segmentation Presentation. This template features a structured, interconnected diagram with six customizable data points, ideal for audience targeting, persona mapping, or campaign planning. Clean, modern, and easy to edit in PowerPoint, Keynote, or Google Slides.


20 diapositivas
Aeneas Sales Proposal Presentation
Seal your next deal with this professional sales proposal template. It covers key sections like objectives, pricing strategy, and target market, offering a comprehensive layout for your pitch. Ideal for impressing clients, it's compatible with PowerPoint, Keynote, and Google Slides for smooth, impactful presentations.


7 diapositivas
Company Vision Infographic
Discover a suite of Slide Templates designed to articulate strategic goals and company ethos. These templates vary in design, from minimalistic and professional layouts to vibrant and dynamic presentations. Each template integrates elements that allow for a clear depiction of objectives, facilitating effective communication across your organization. These templates are perfect for executives and team leaders looking to present long-term strategies and unify their team's vision. They come equipped with customizable features to align with your company’s branding, ensuring a coherent and impactful presentation. Ideal for corporate presentations, stakeholder meetings, and internal communications, these templates provide a sophisticated tool to express and reinforce your strategic direction.