


Características


¿Tienes alguna pregunta?
Recomendar


26 diapositivas
Philp Presentation Template
Our Philp template is perfect for presenting your furniture shop business. It has a modern design, allowing you to make your product/service stands out from the crowd, and it’s easily customizable so that it can be tweaked to your exact needs. This template contains slides with beautiful graphics and captions describing the most important aspects of your business. Our presentation template can be used to promote your products, services, benefits and much more! This template can also be used to present your company's vision and mission, business strategy, portfolio and more.


7 diapositivas
PESTEL Framework for External Analysis Presentation
Evaluate external factors with ease using the PESTEL Framework for External Analysis Presentation. This structured layout helps you assess Political, Economic, Social, Technological, Environmental, and Legal influences on your business. Perfect for market research, risk assessment, and strategic planning. Fully customizable in PowerPoint, Canva, and Google Slides.
22 diapositivas
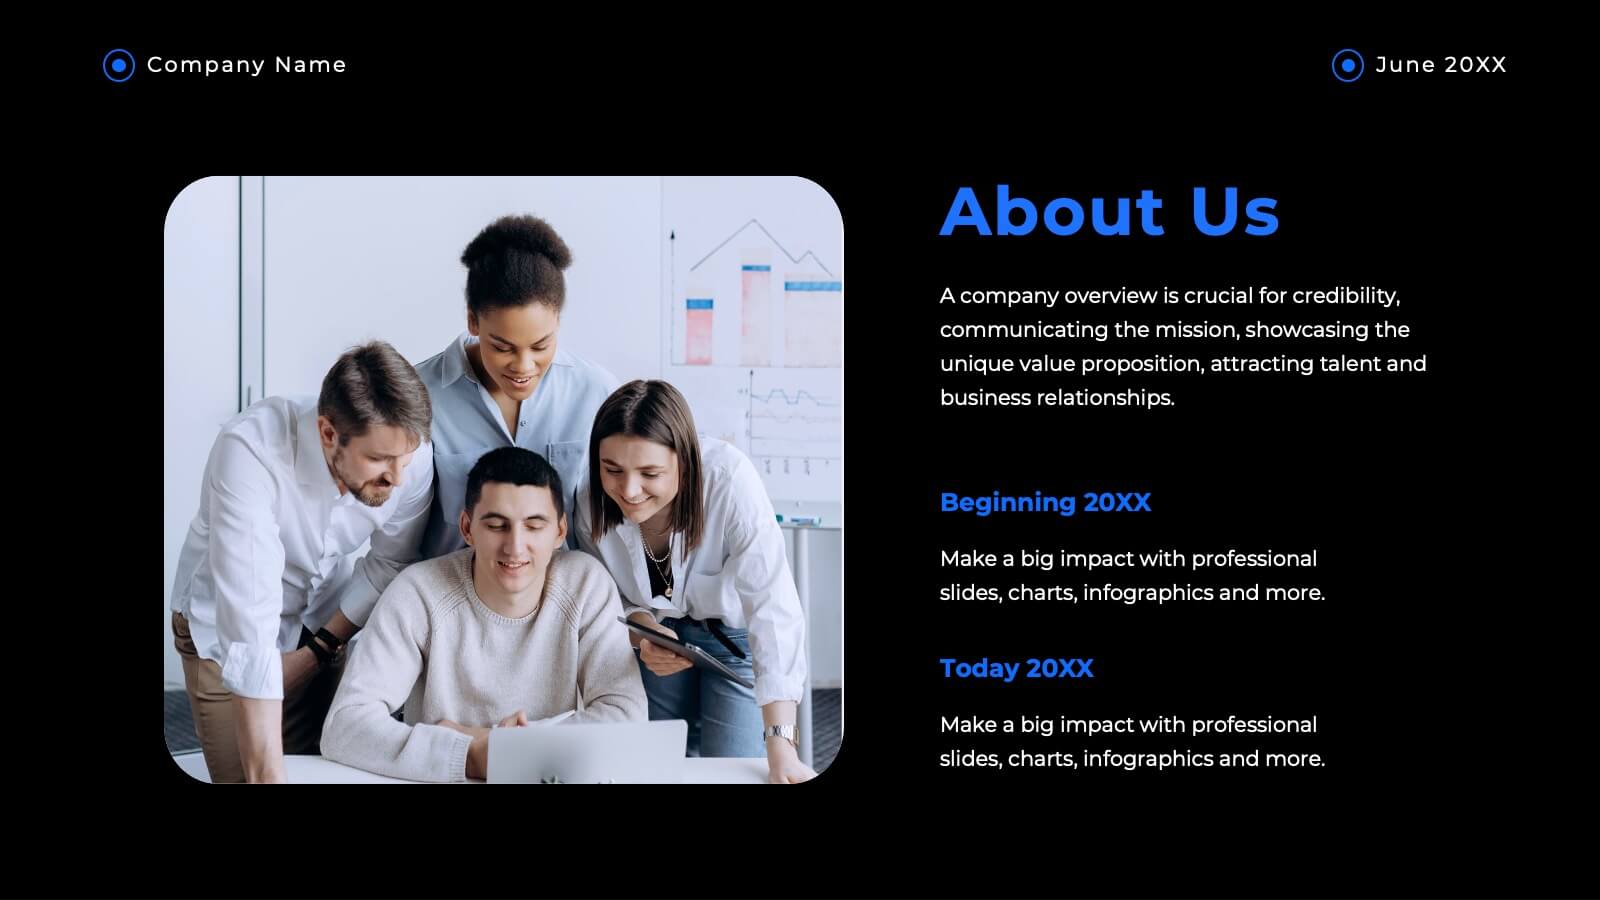
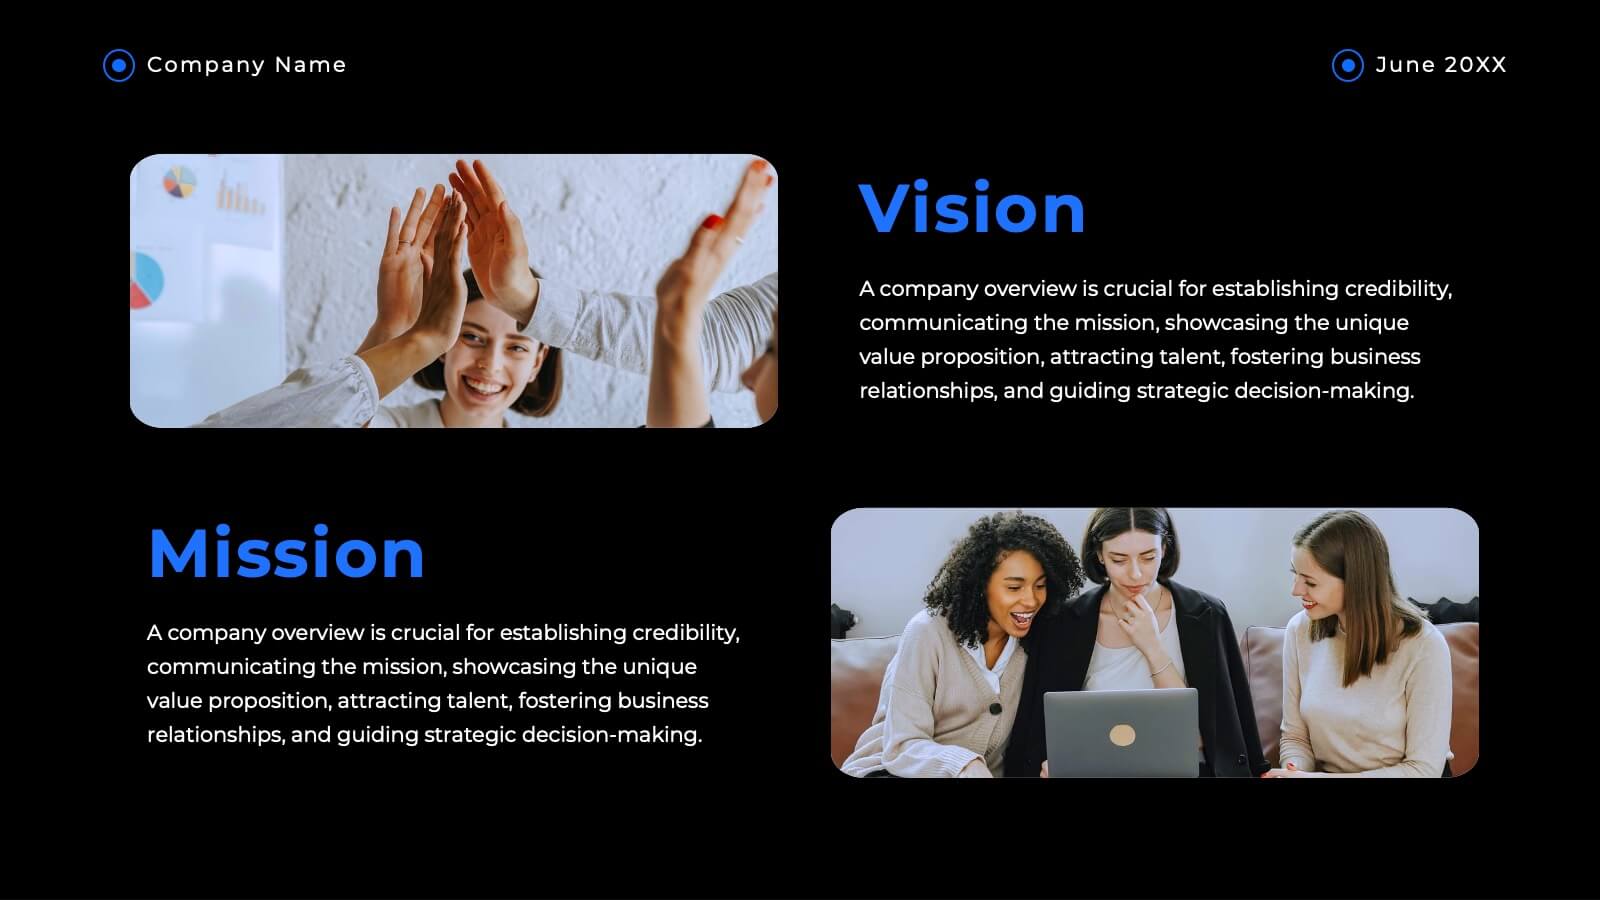
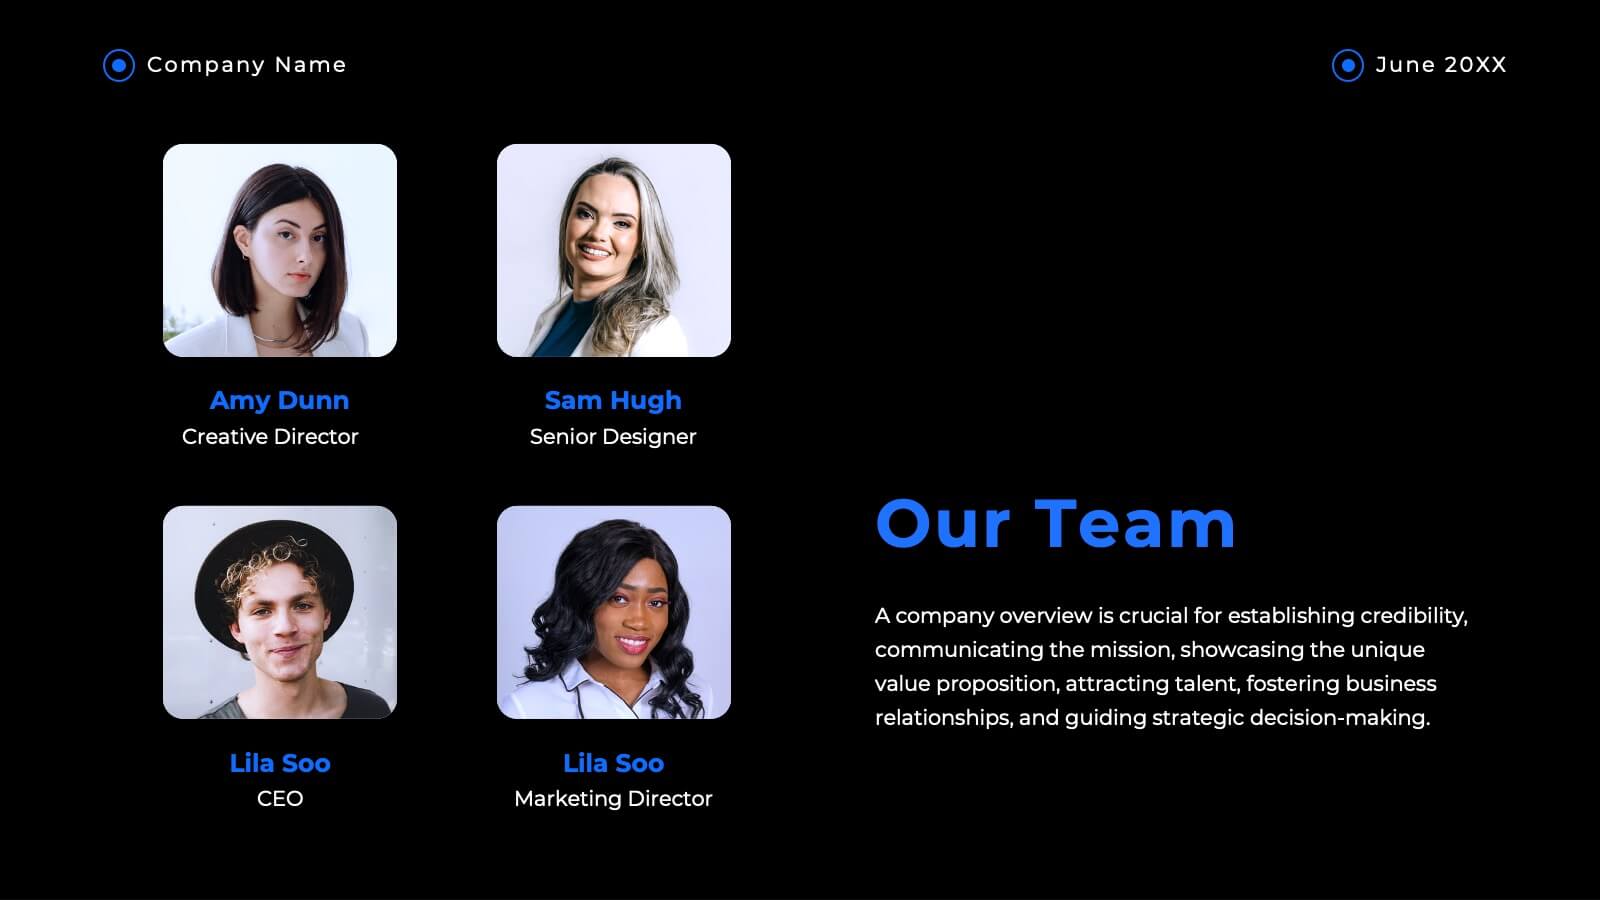
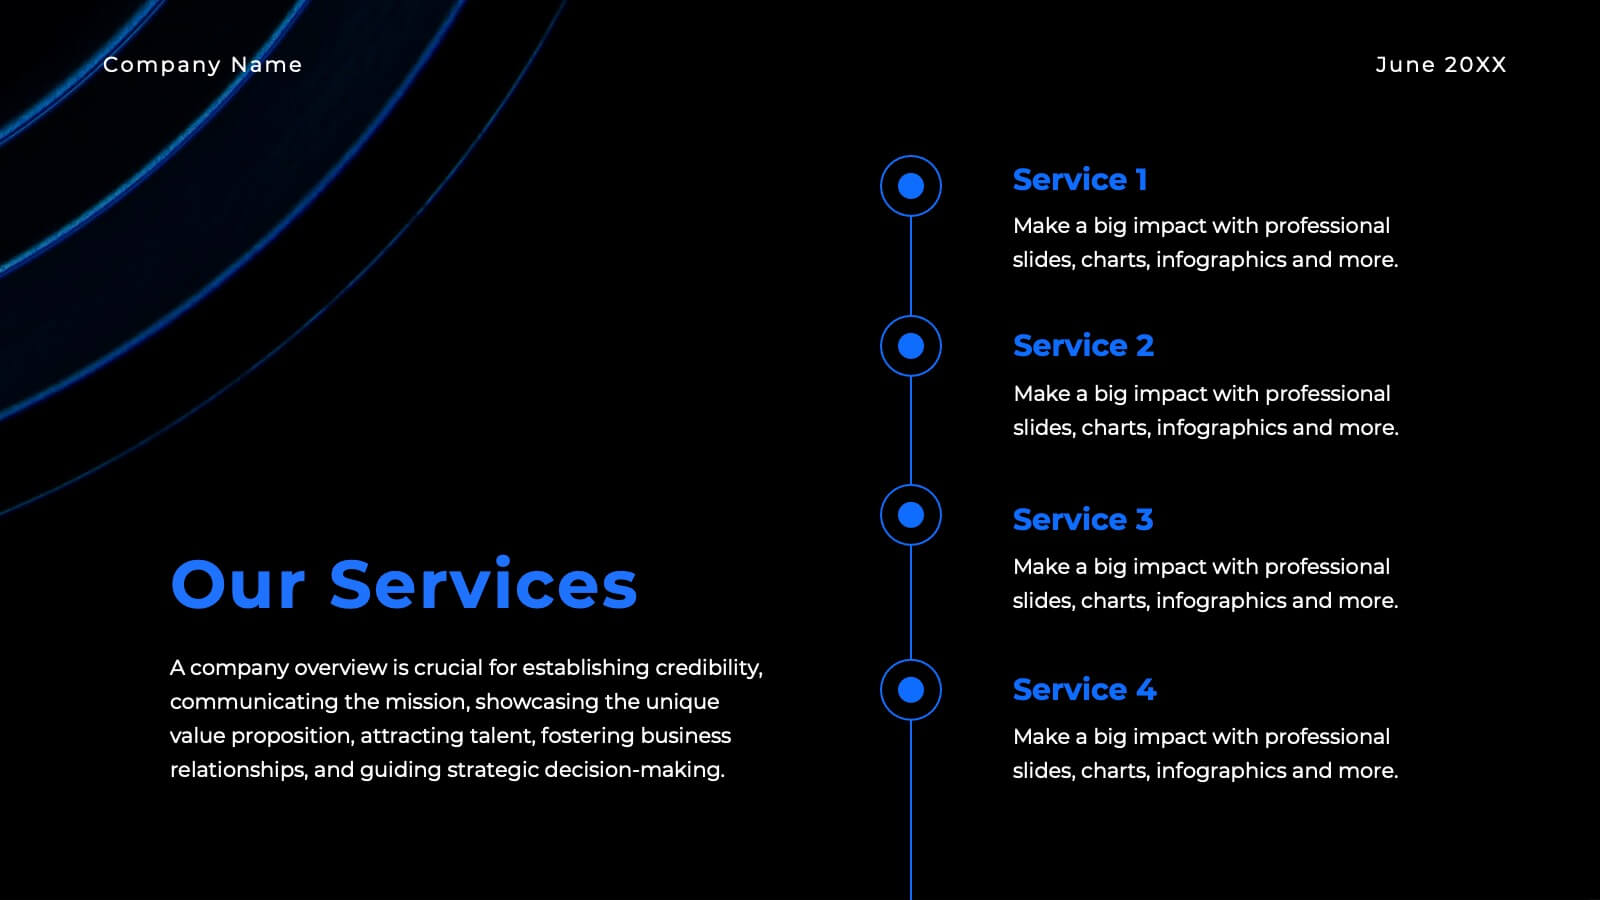
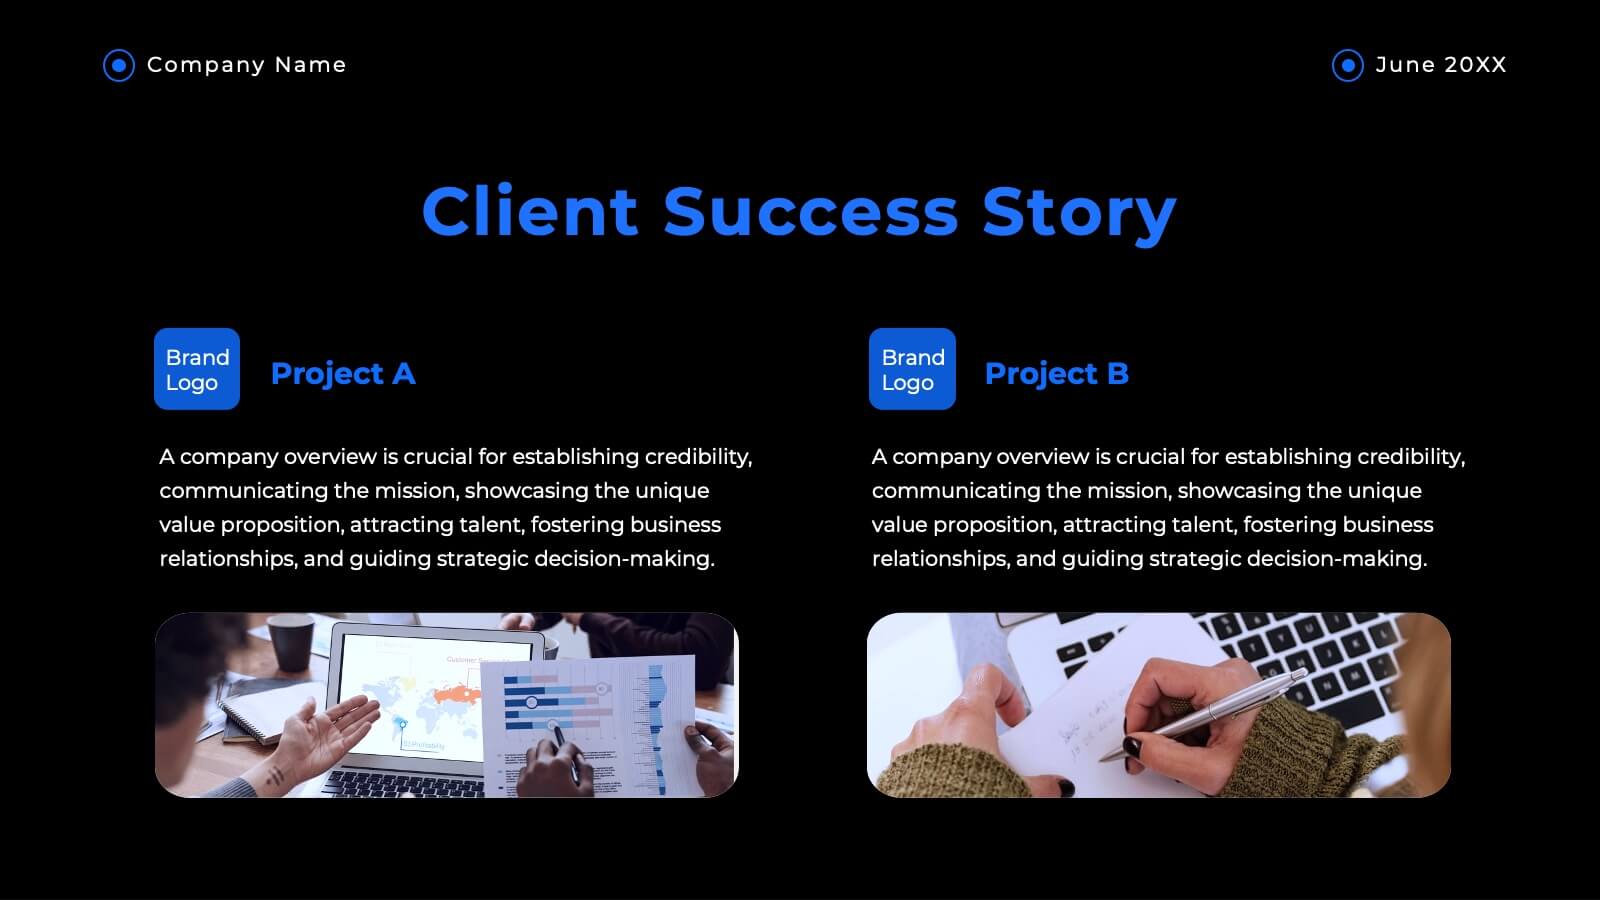
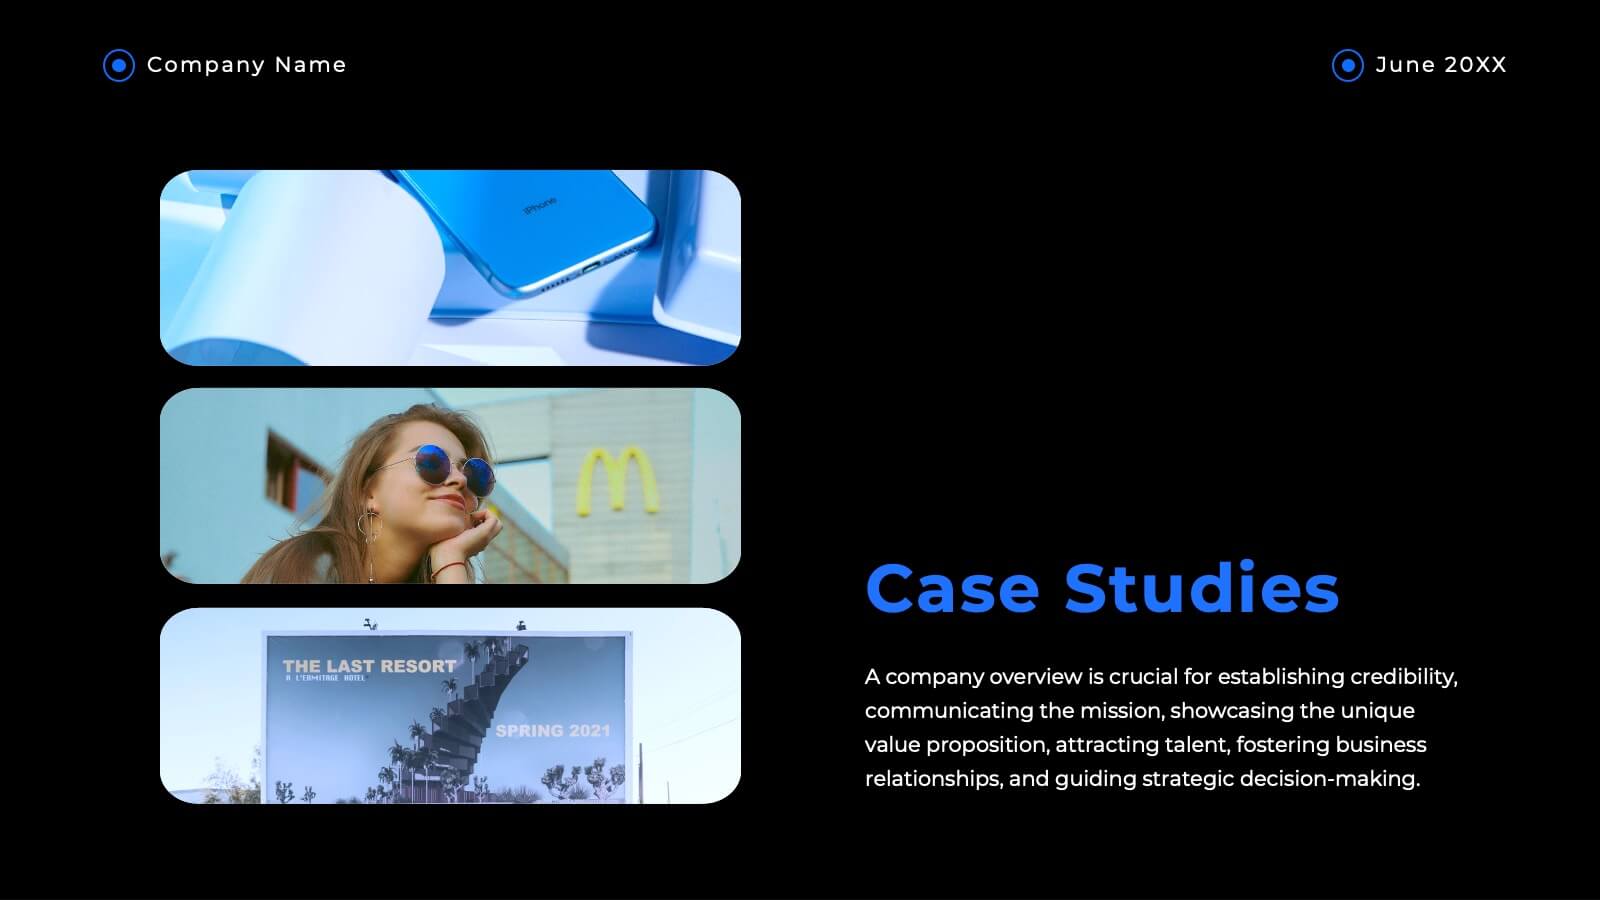
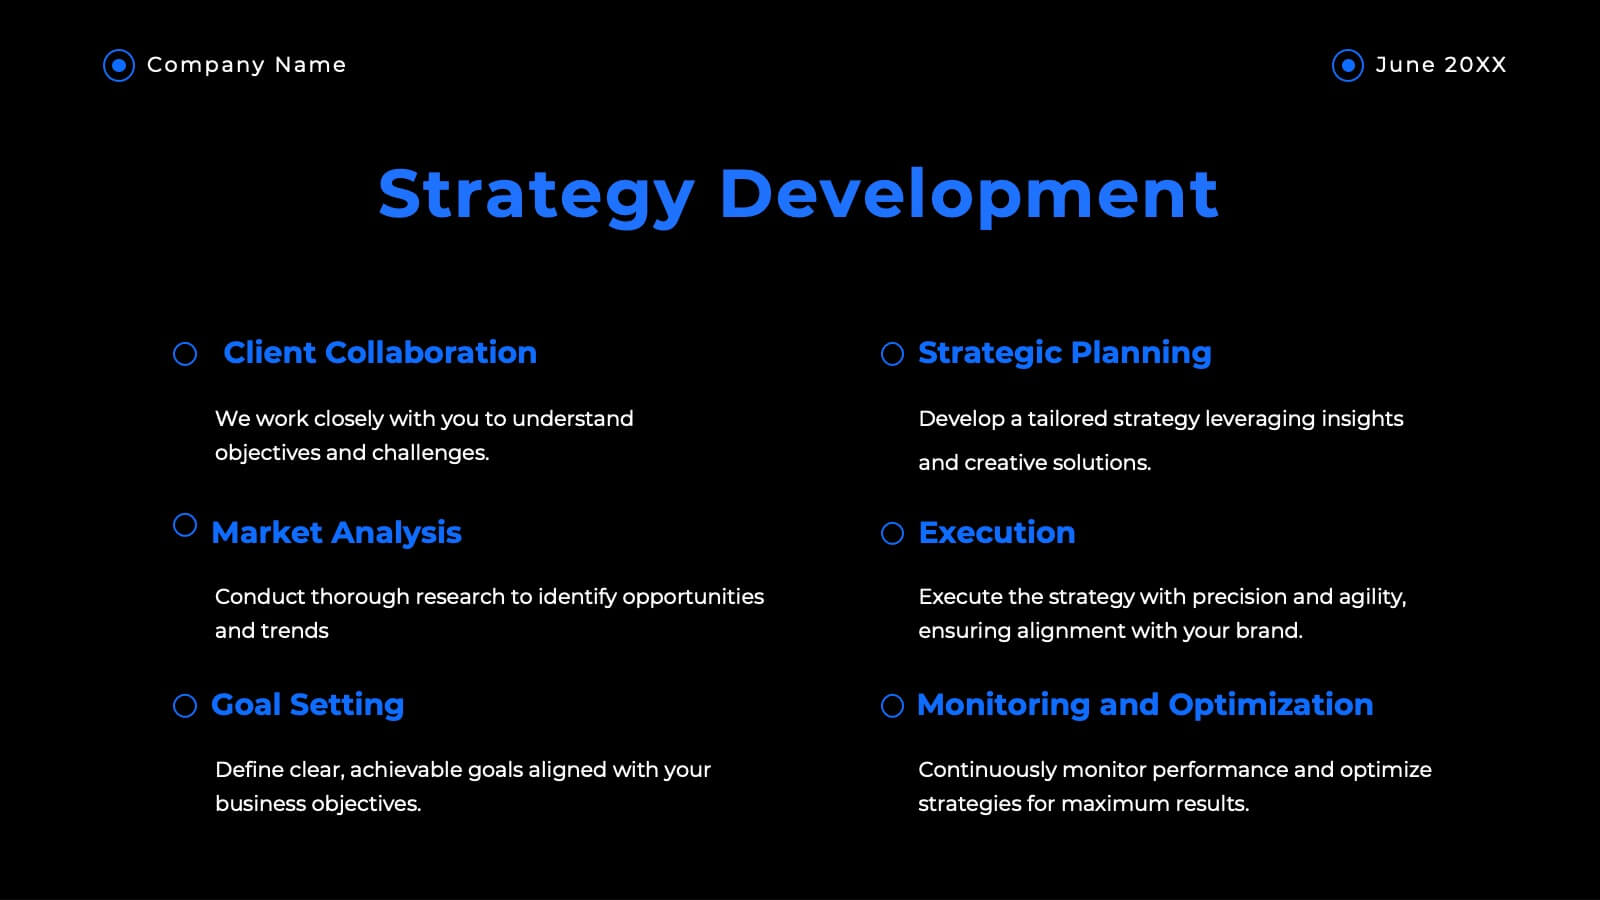
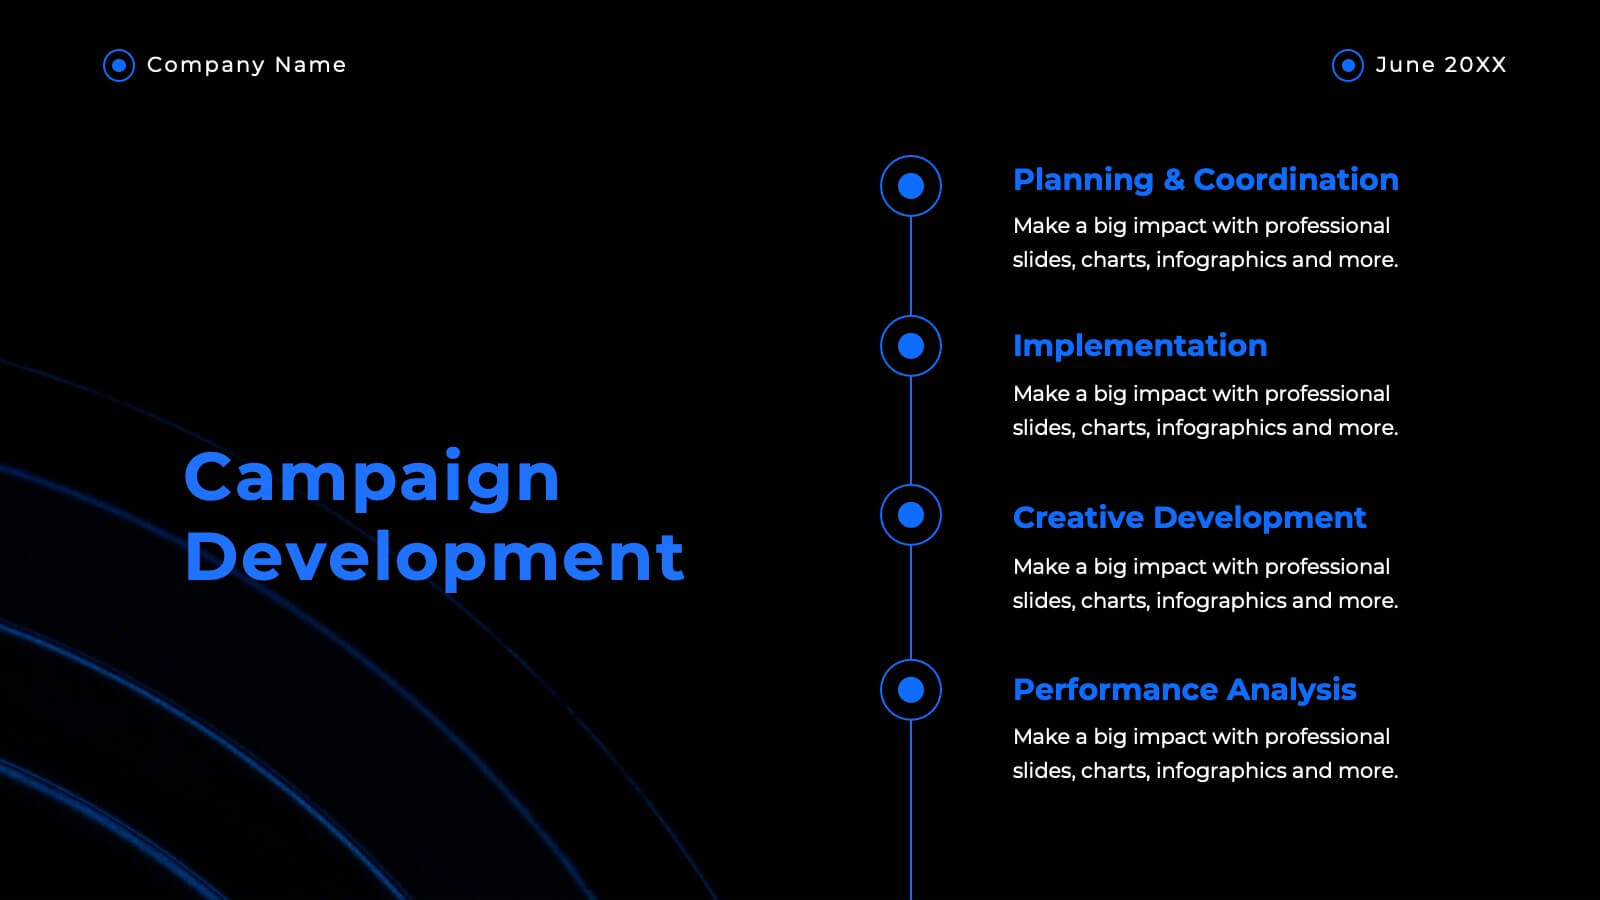
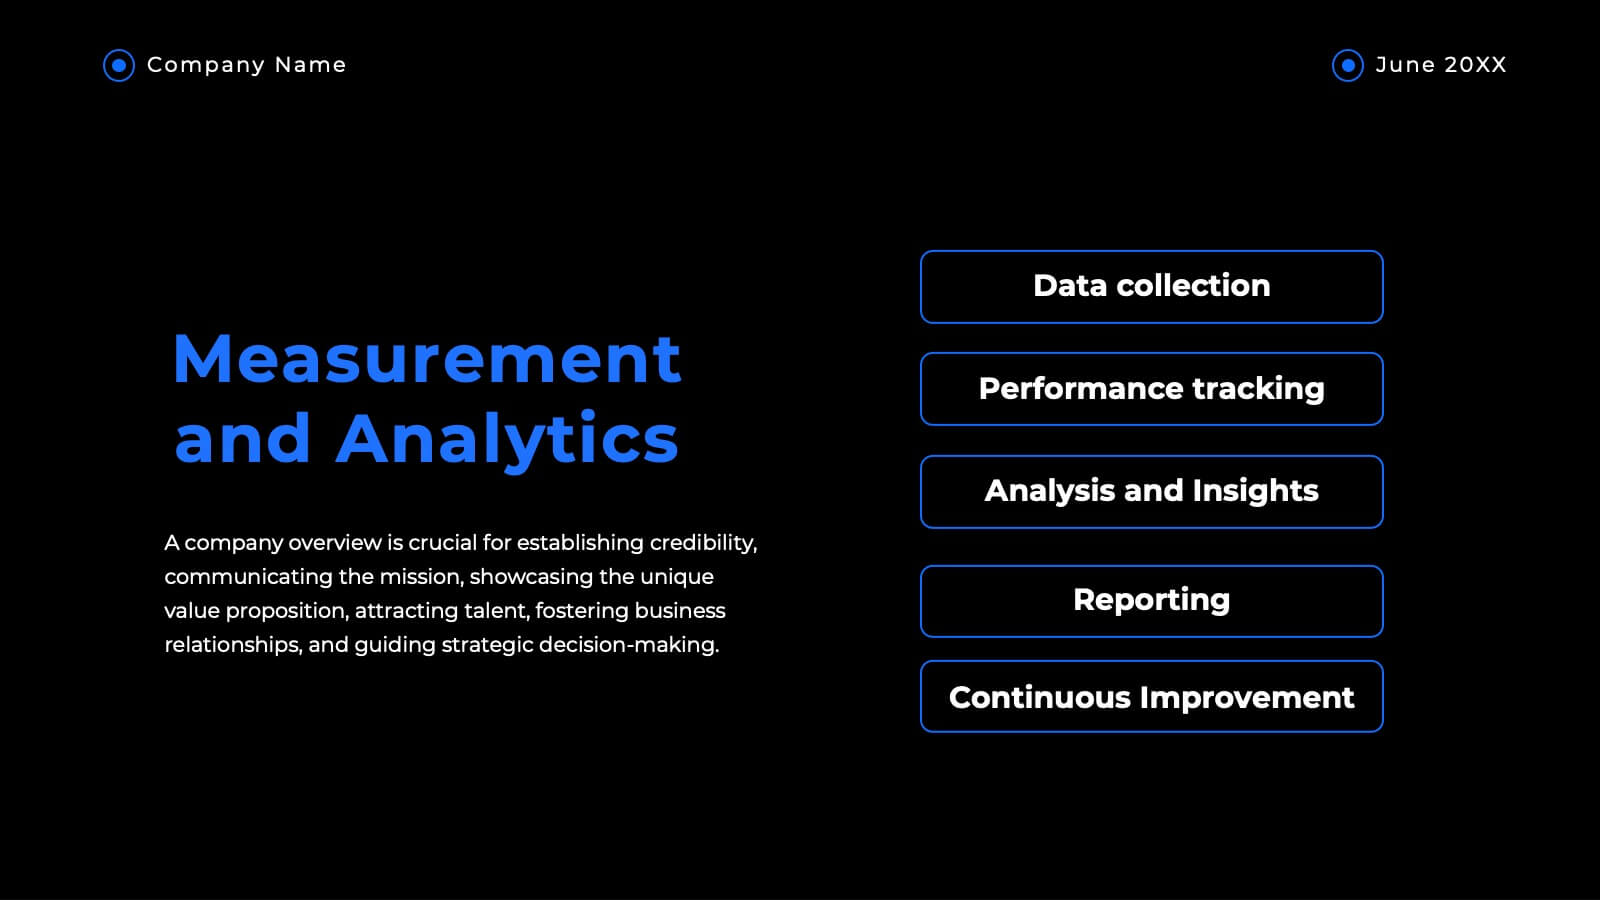
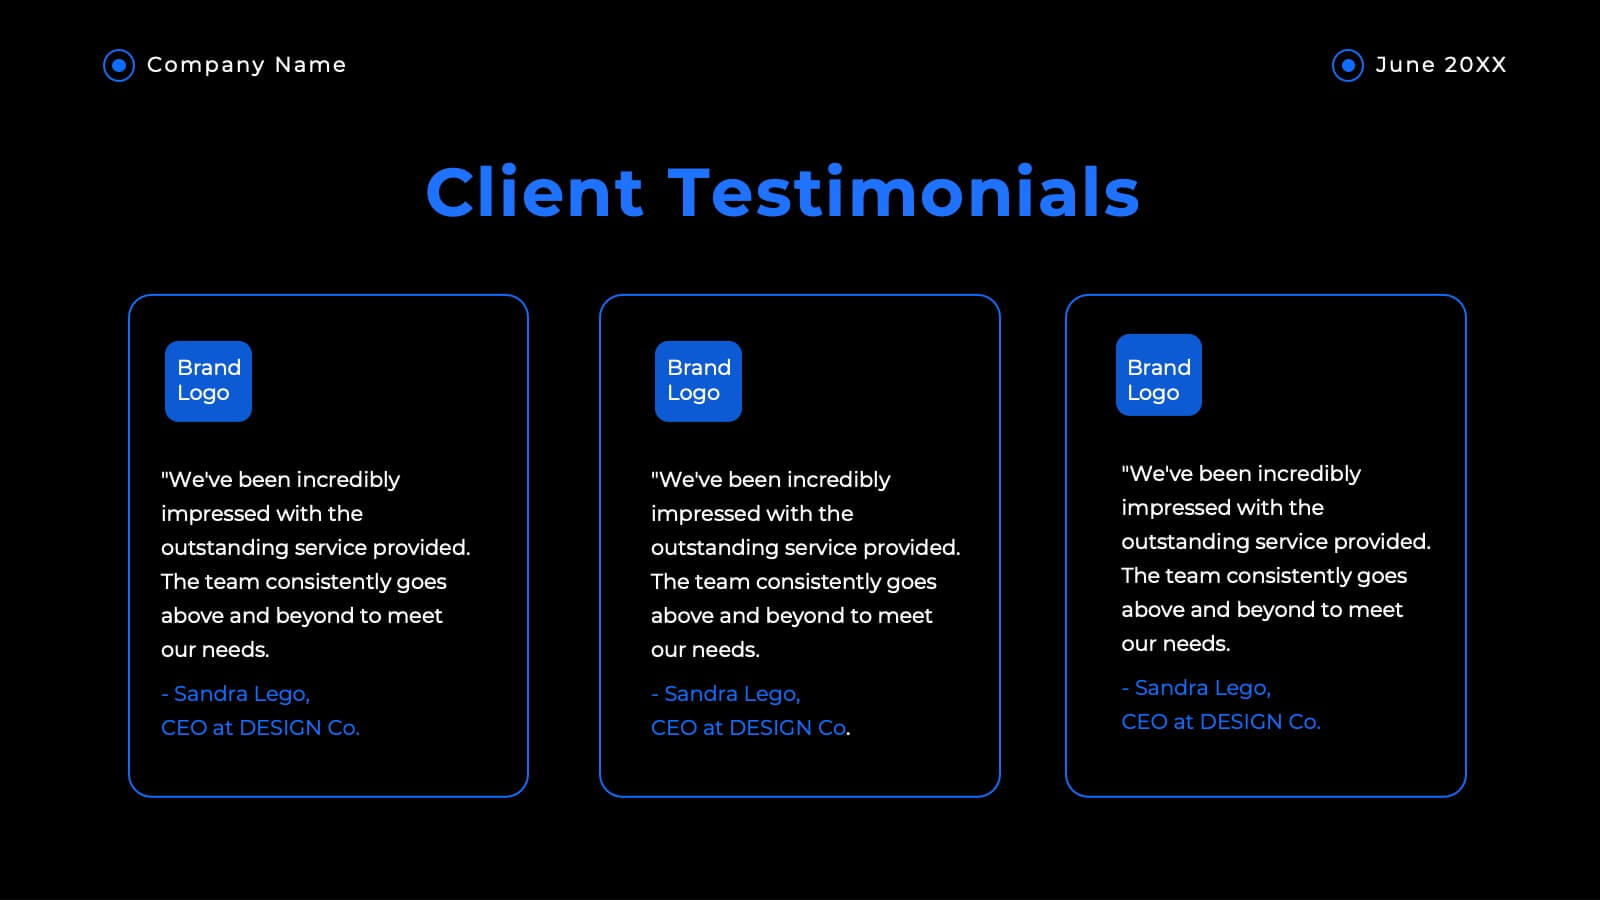
Haven Advertising Agency Proposal Presentation
Wow your clients with this sophisticated agency presentation template! Perfect for showcasing your services, client success stories, and market analysis. Ideal for agencies looking to impress and secure new business. Compatible with PowerPoint, Keynote, and Google Slides, this template ensures your proposals stand out with professional elegance. Perfect for any pitch or proposal.
4 diapositivas
Arrow Path Business Journey Presentation
Visualize growth, decisions, and direction with the Arrow Path Business Journey Presentation. This dynamic slide is designed to illustrate key stages, multiple outcomes, or strategic forks in the road. Great for showing parallel team tracks, phased development, or transformation journeys. Fully editable and works seamlessly in PowerPoint, Google Slides, and Canva.


4 diapositivas
Real Estate Business Proposal
Make a lasting impression with this key-and-houses layout, perfect for unlocking your property pitch. Designed for real estate professionals, agencies, and consultants presenting market strategies or service offerings. Easily customizable in PowerPoint, Keynote, and Google Slides.


3 diapositivas
Service and Product Benefits Overview Presentation
Clearly contrast key features with the Service and Product Benefits Overview Presentation. This modern split-layout design helps you showcase differences between service offerings and tangible products in a clean, side-by-side format. Use it to highlight value propositions, customer benefits, or decision-making factors. Fully editable and compatible with PowerPoint, Keynote, and Google Slides.


2 diapositivas
Elegant Thank You Slide
Leave a lasting impression with this modern and refined thank-you slide. Designed with clean lines, professional typography, and an image placeholder to showcase your team, workspace, or branding. Ideal for closing business decks and project presentations. Compatible with PowerPoint, Keynote, and Google Slides.


6 diapositivas
Real Estate and Building Development Presentation
Present key insights into the real estate market with the Real Estate and Building Development template. Designed for property investors and urban planners, this visual framework highlights financial trends, project phases, and market analysis. Fully customizable and compatible with PowerPoint, Keynote, and Google Slides for seamless presentation delivery.


3 diapositivas
Agile Workflow and Team Roles Presentation
Visualize team roles, responsibilities, and task flow using this agile loop diagram. Ideal for Scrum teams, project managers, and product owners. Clearly outline percentages, priorities, and stages in the process. Fully editable in PowerPoint, Keynote, and Google Slides—perfect for training, team updates, or workflow overviews.

20 diapositivas
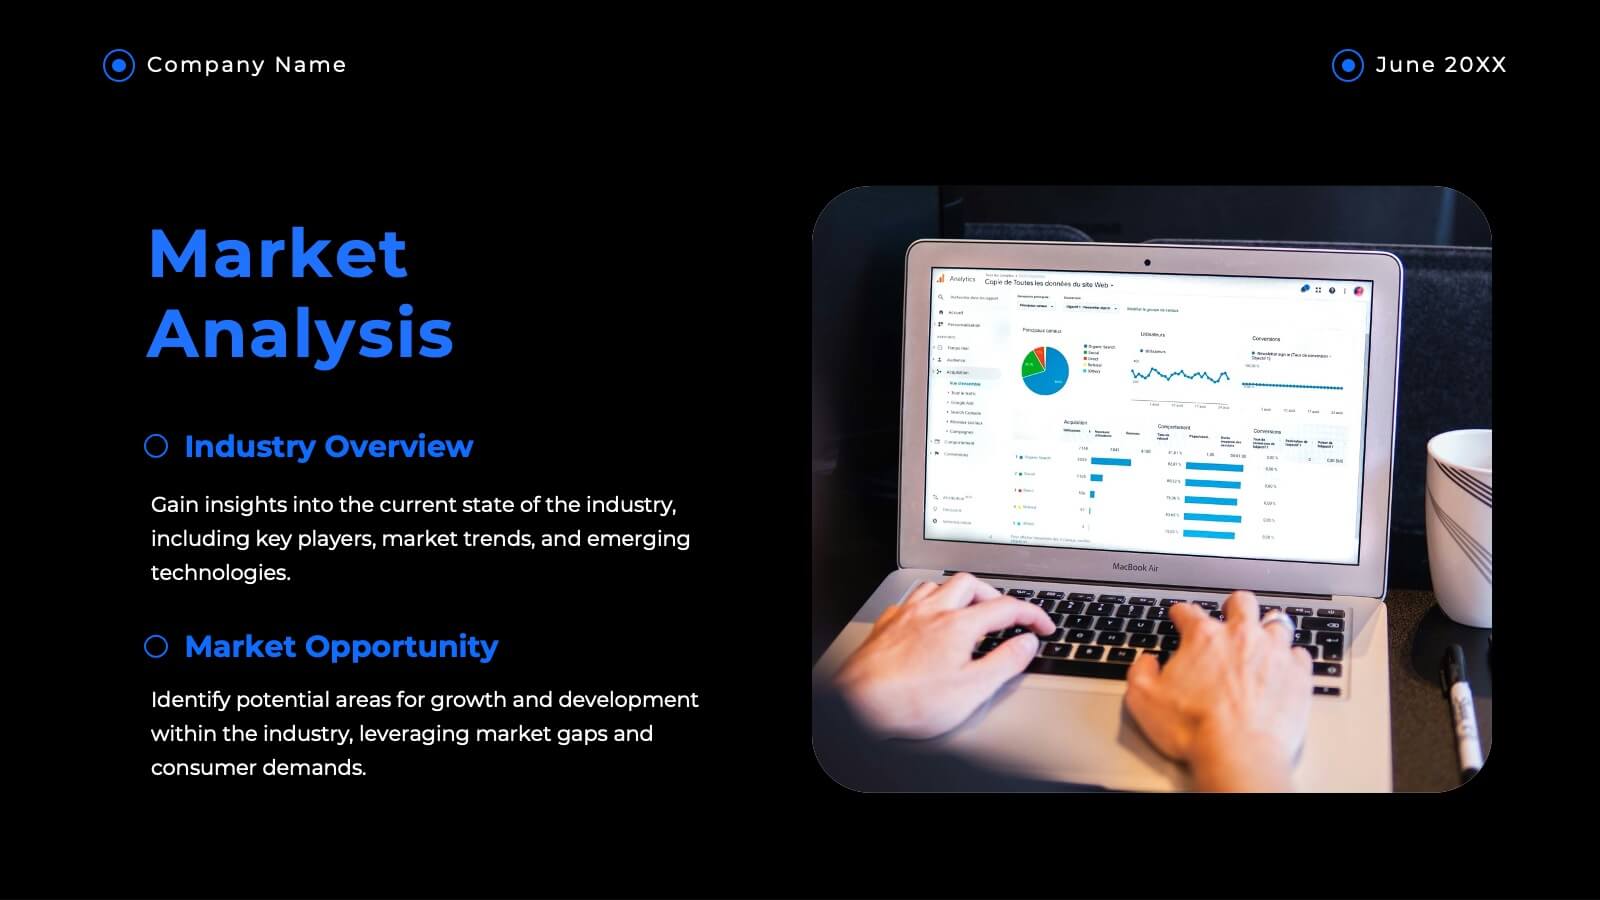
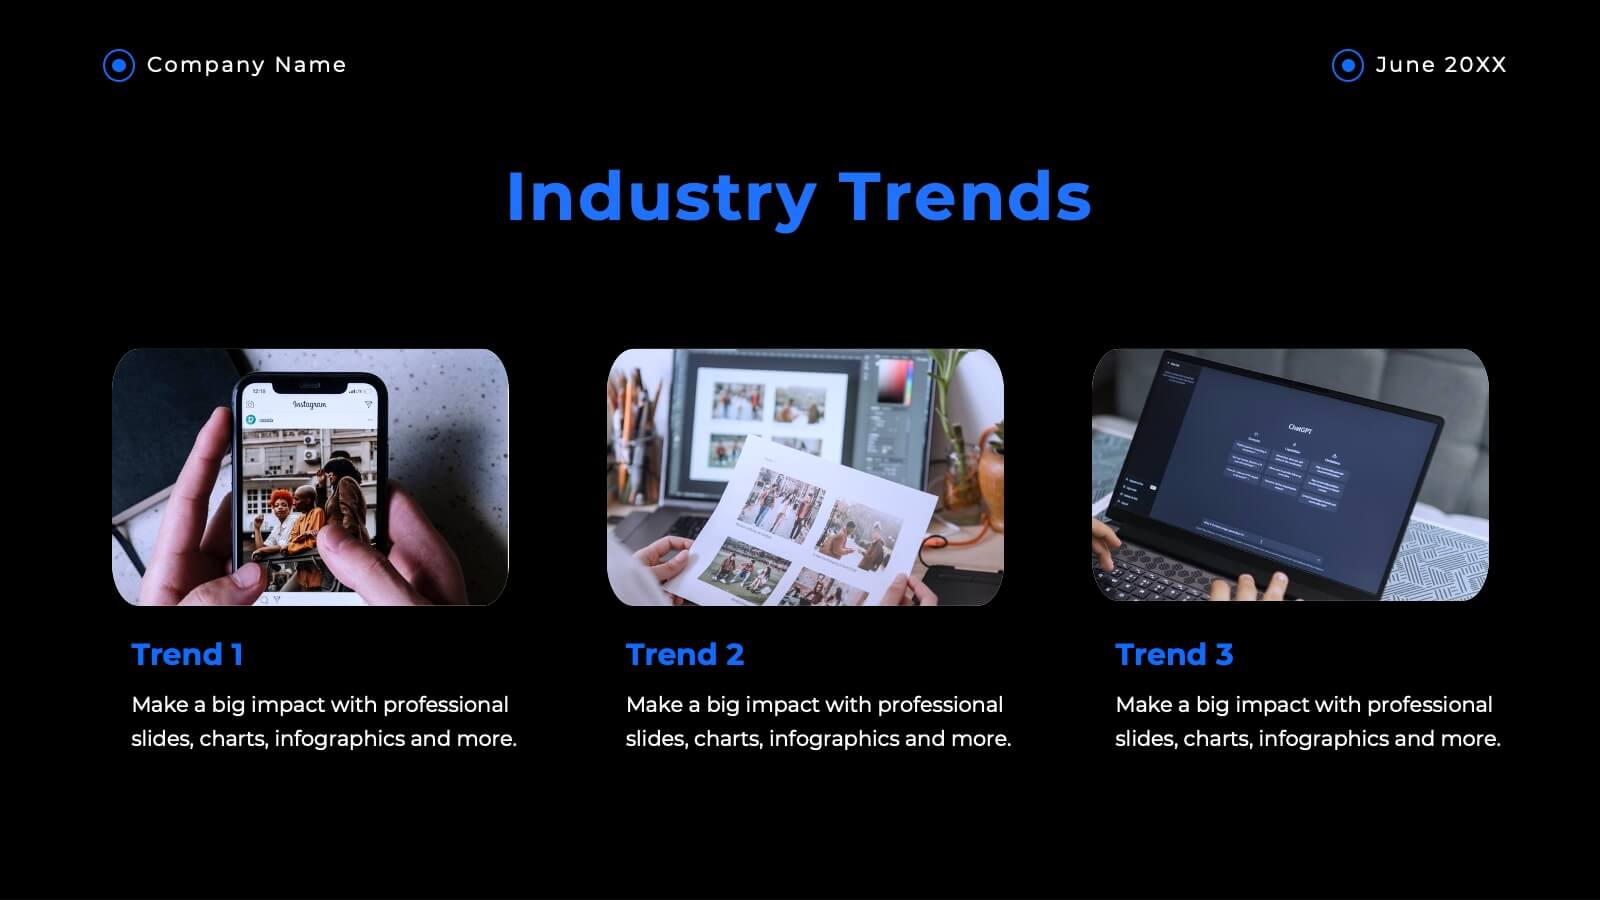
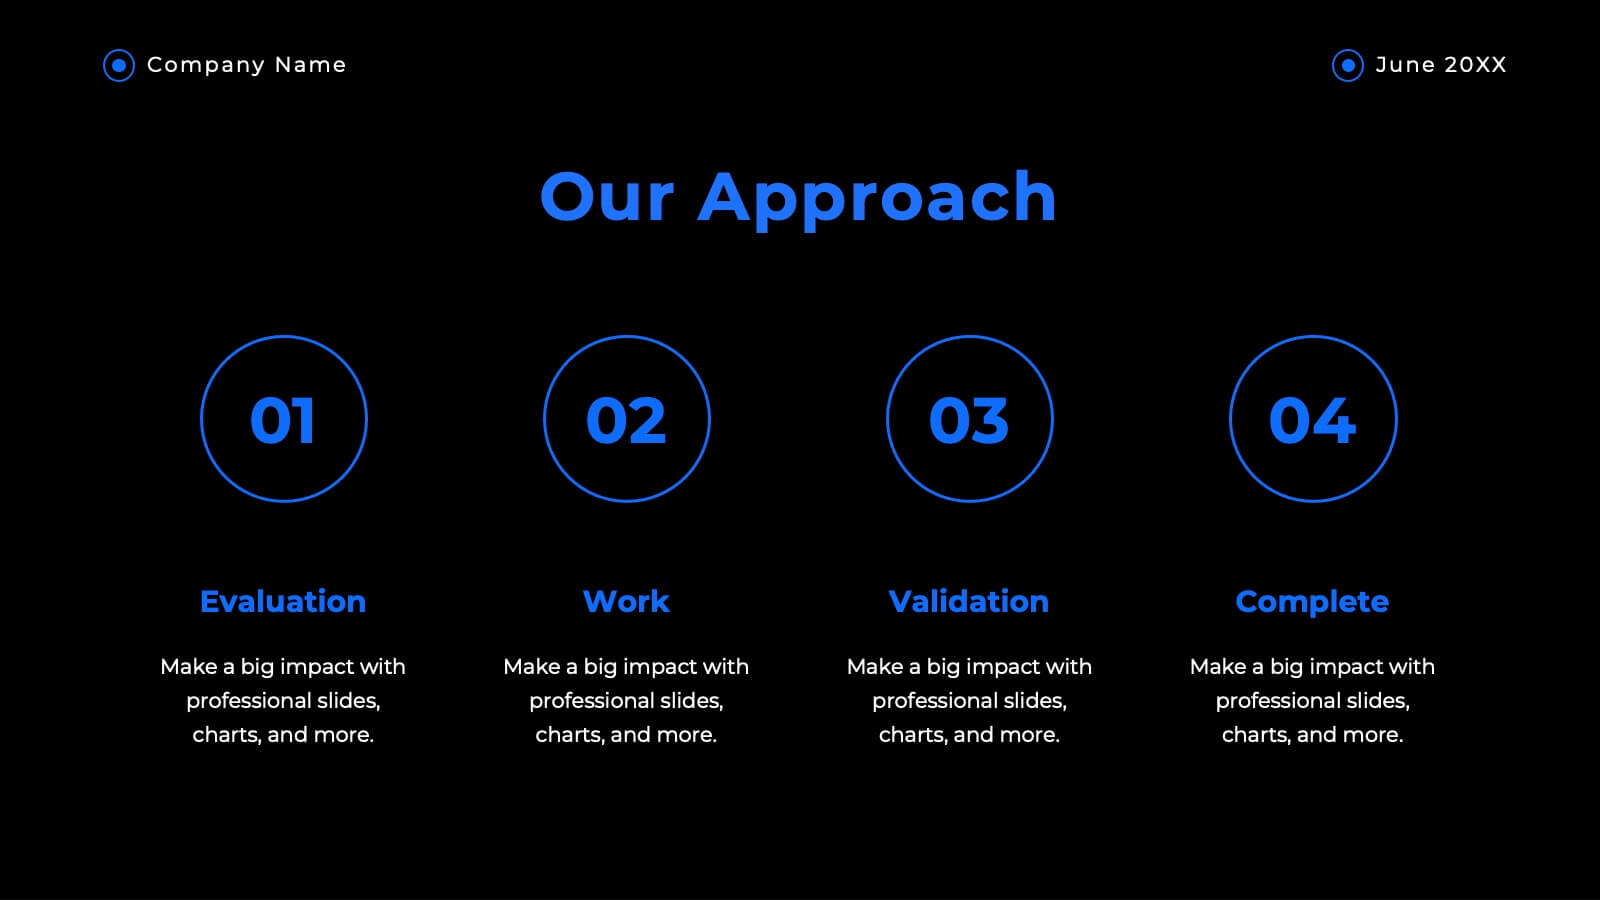
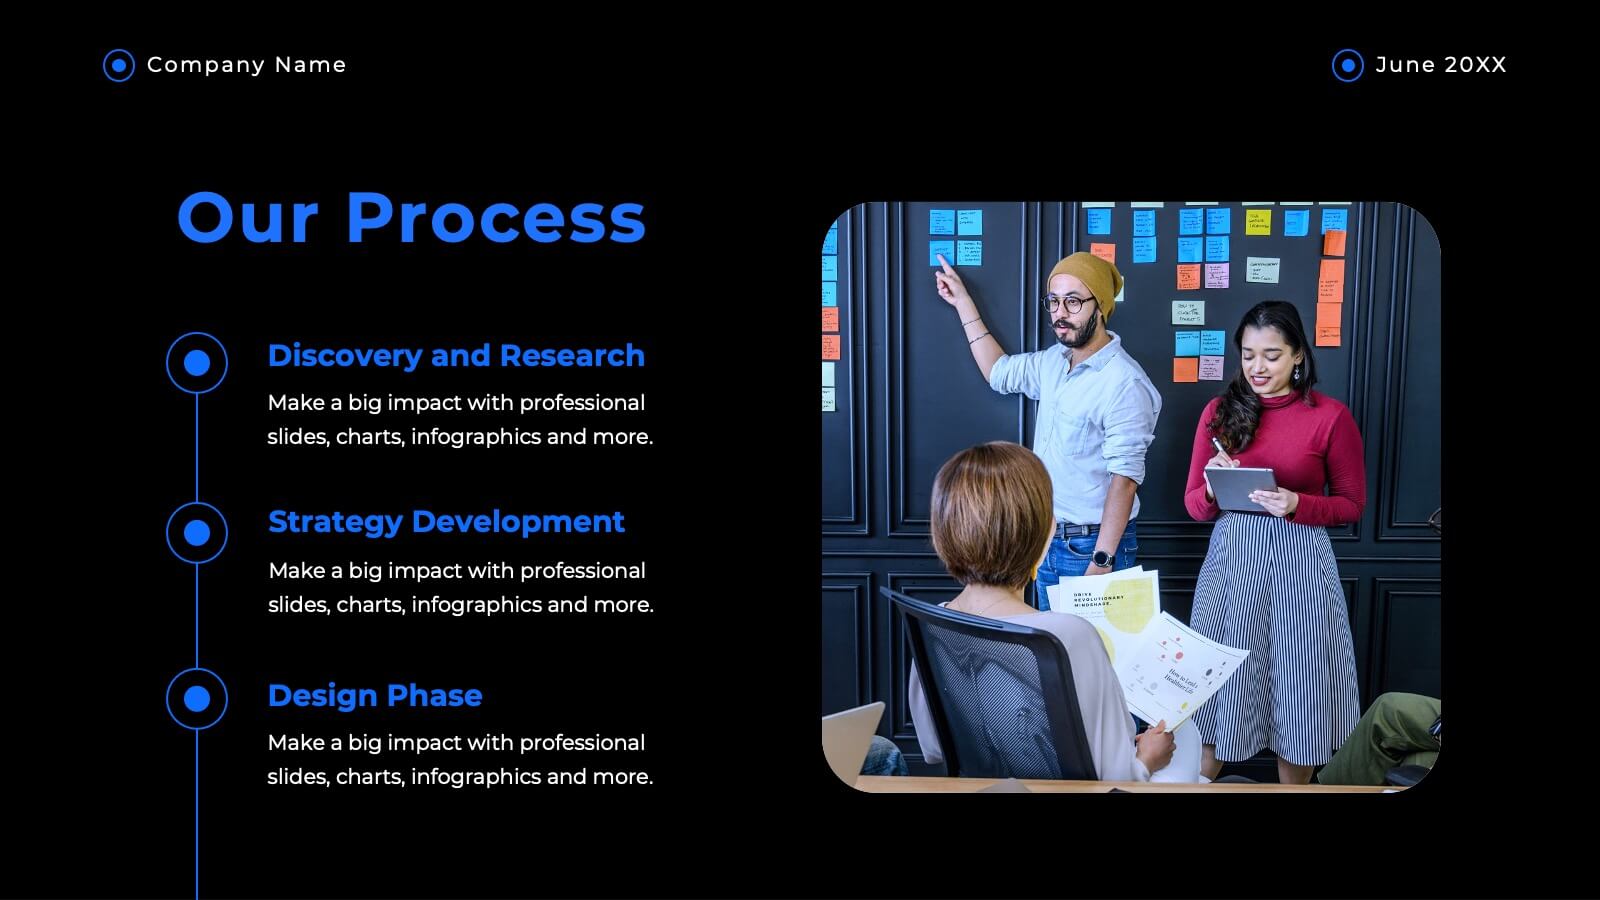
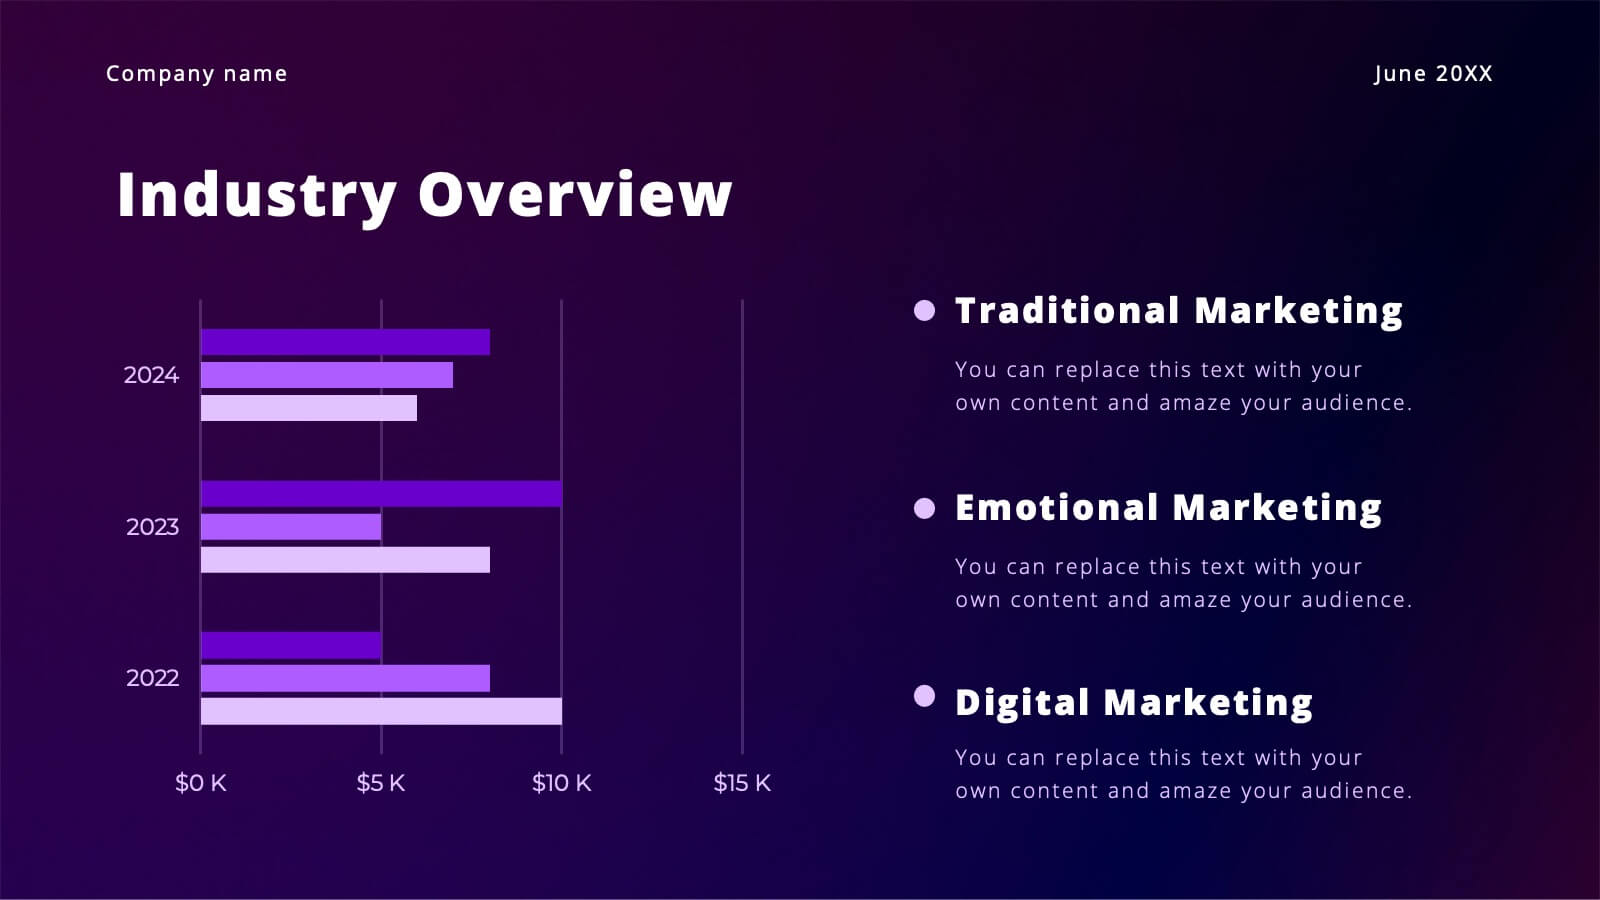
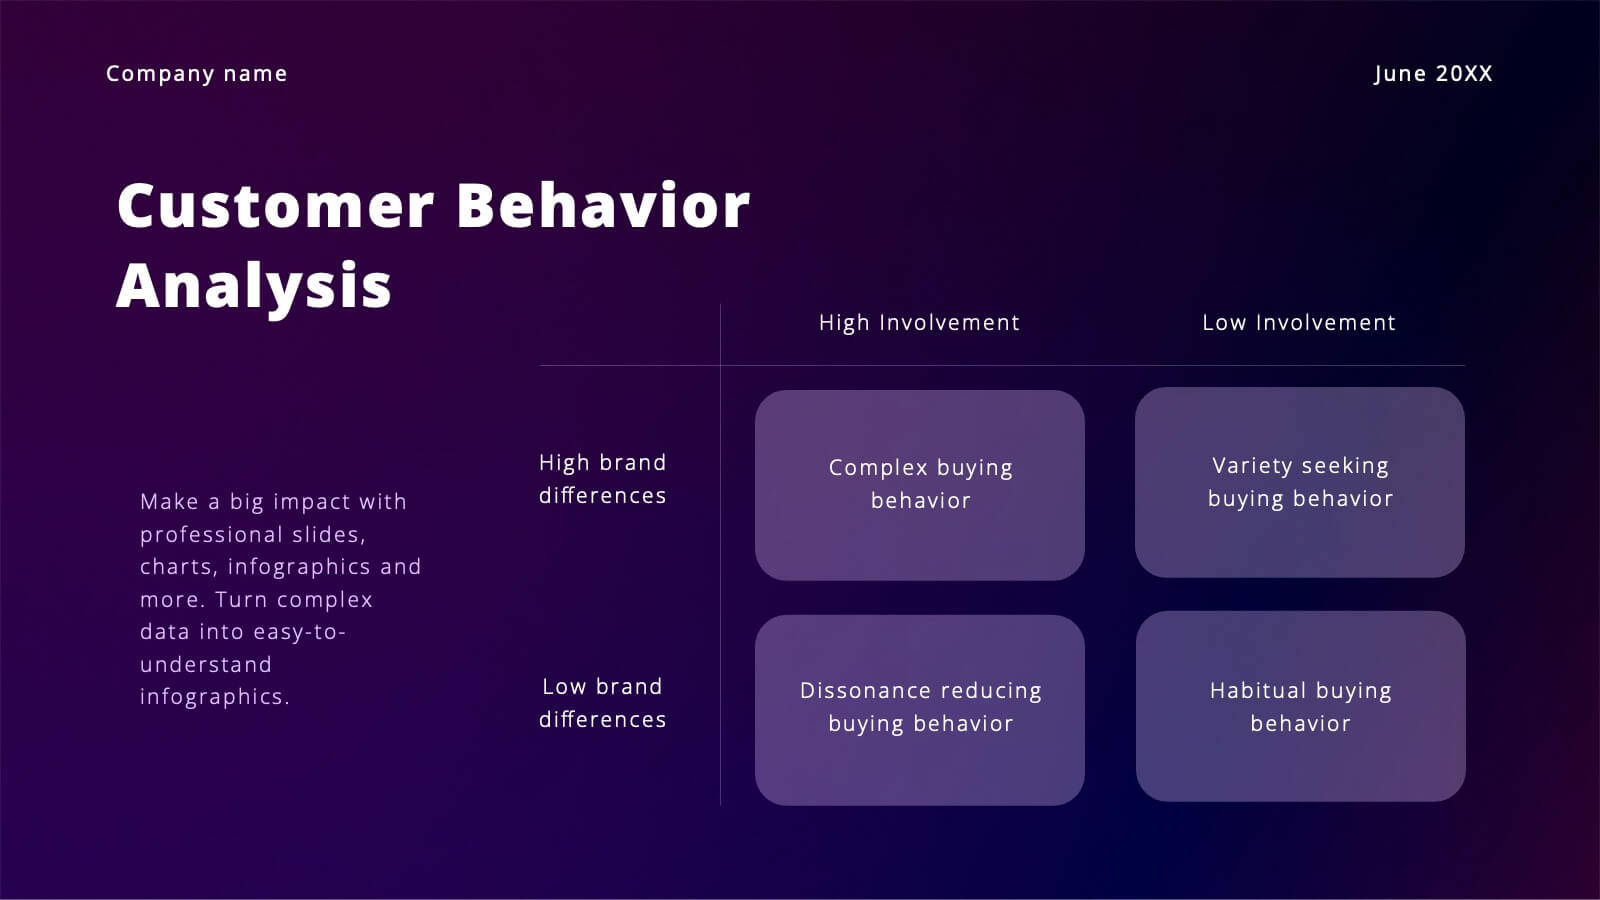
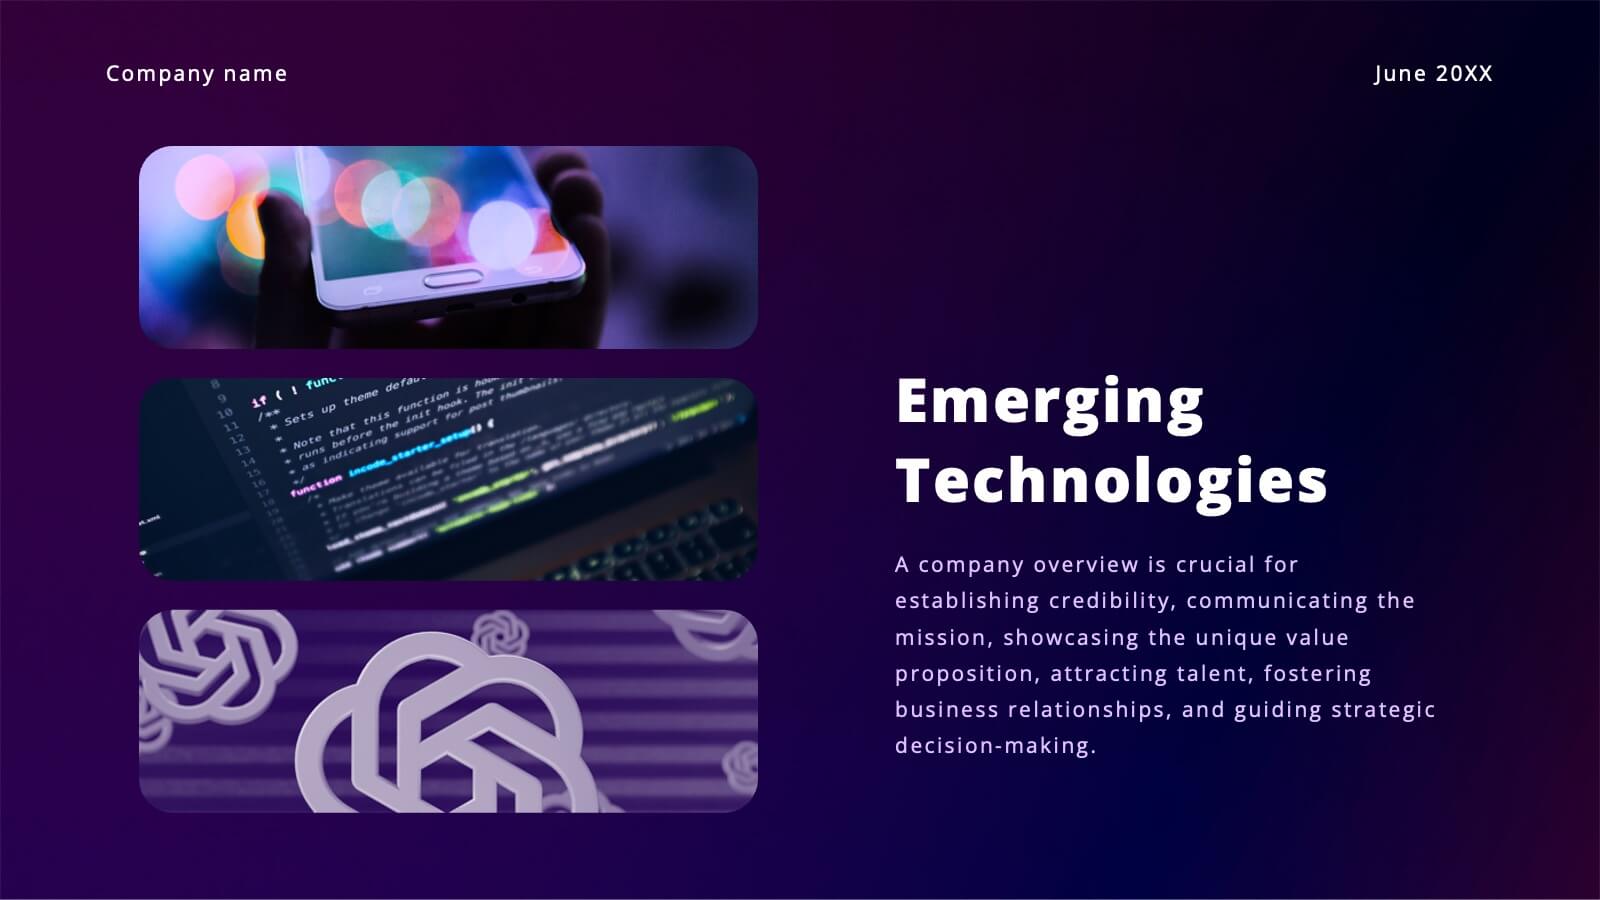
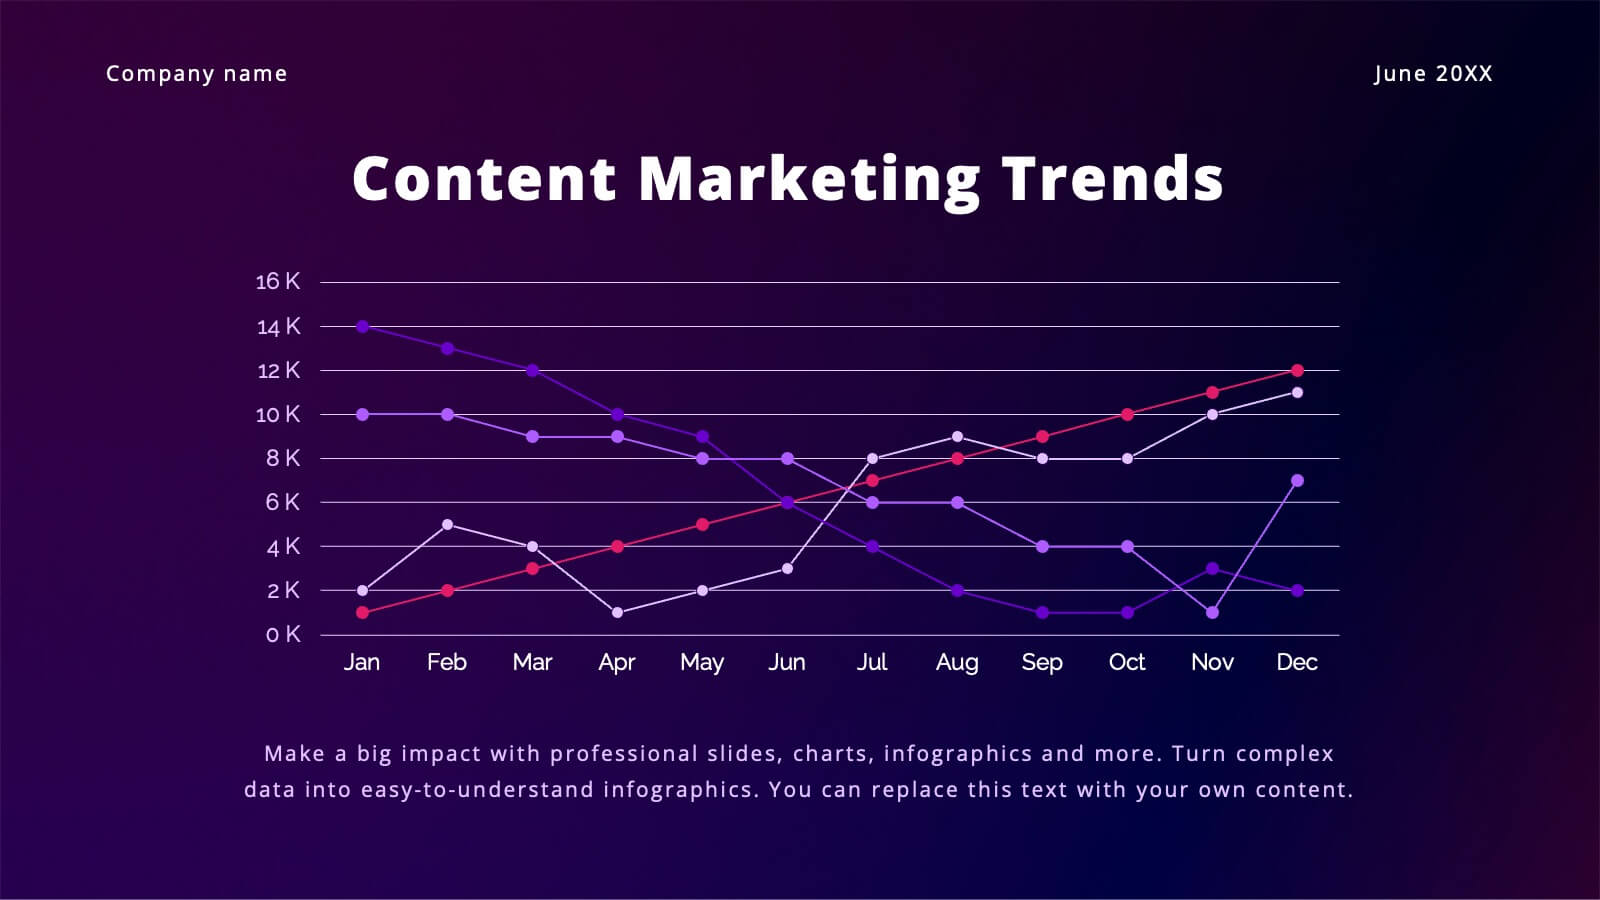
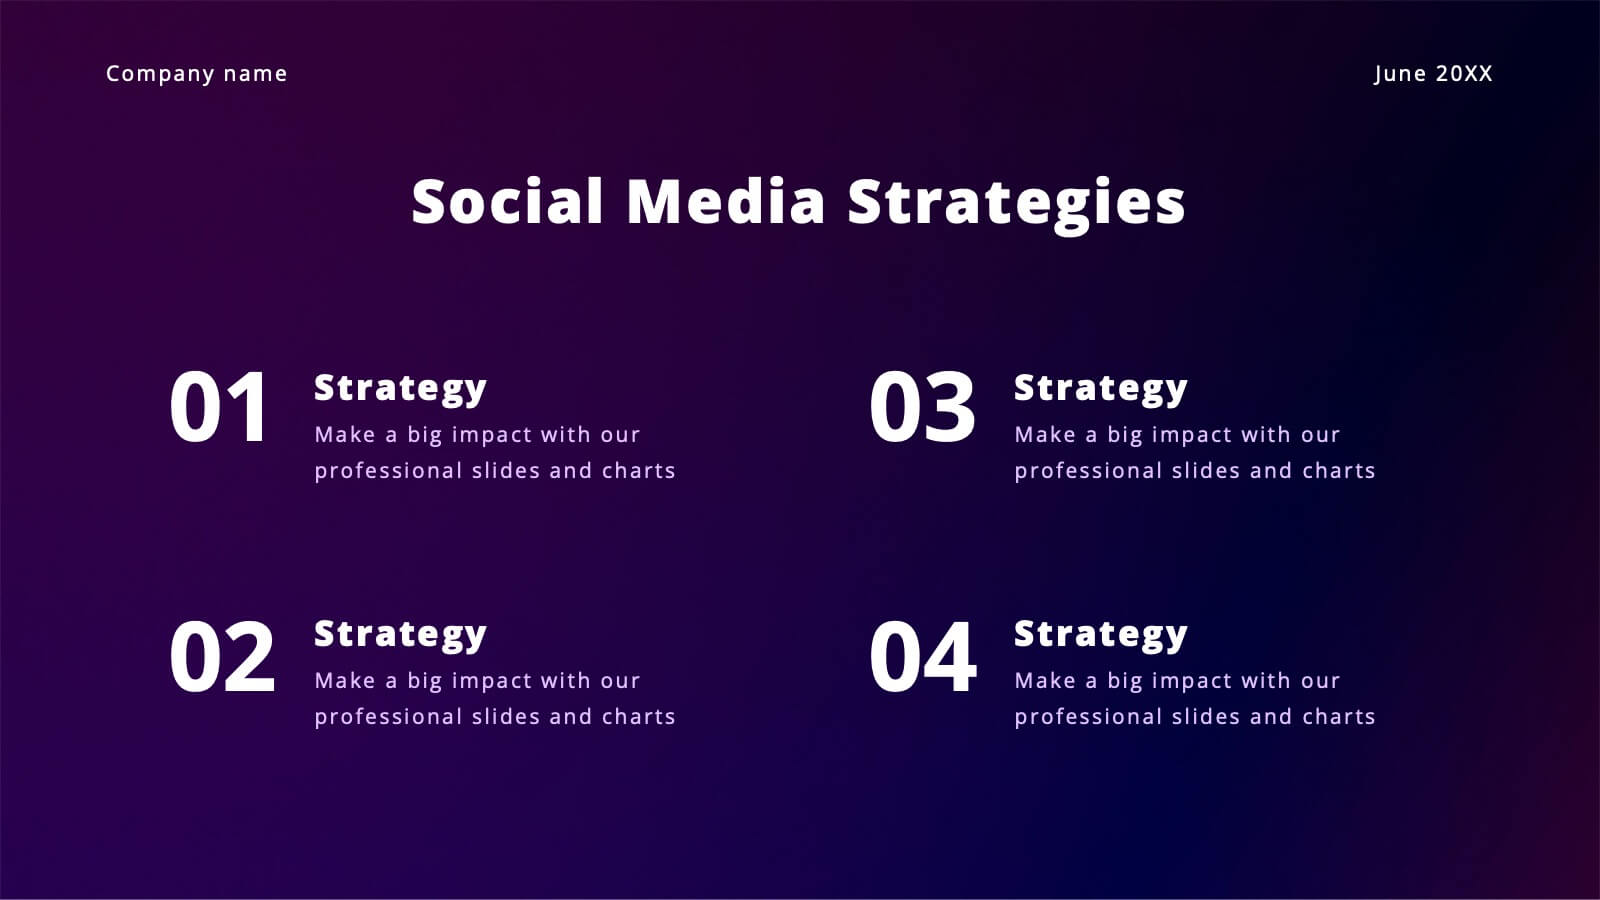
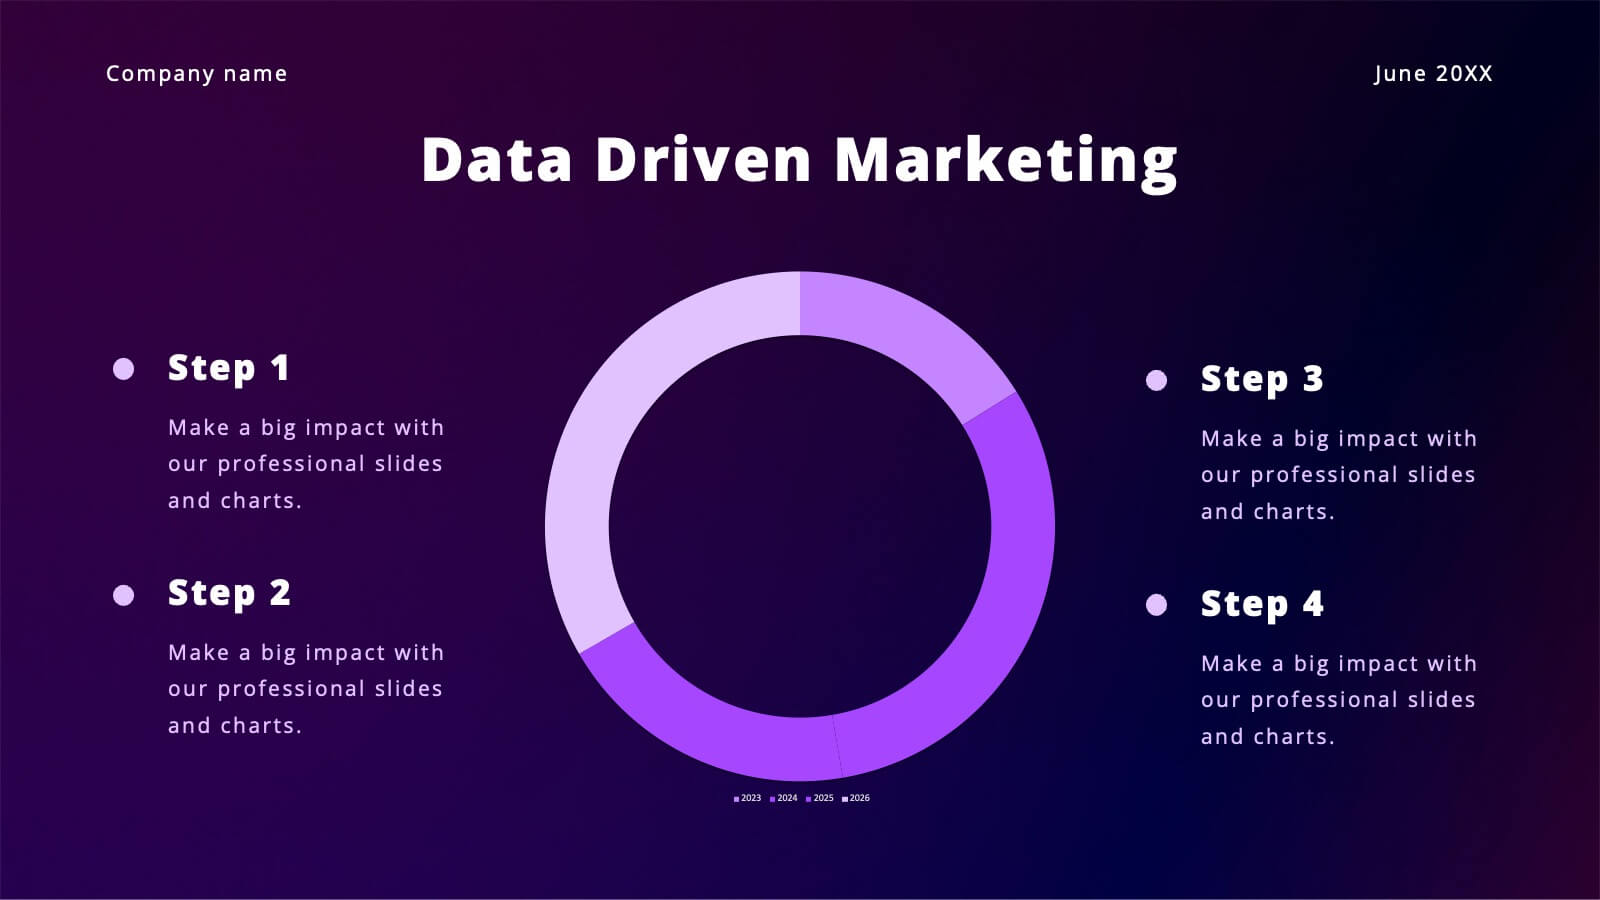
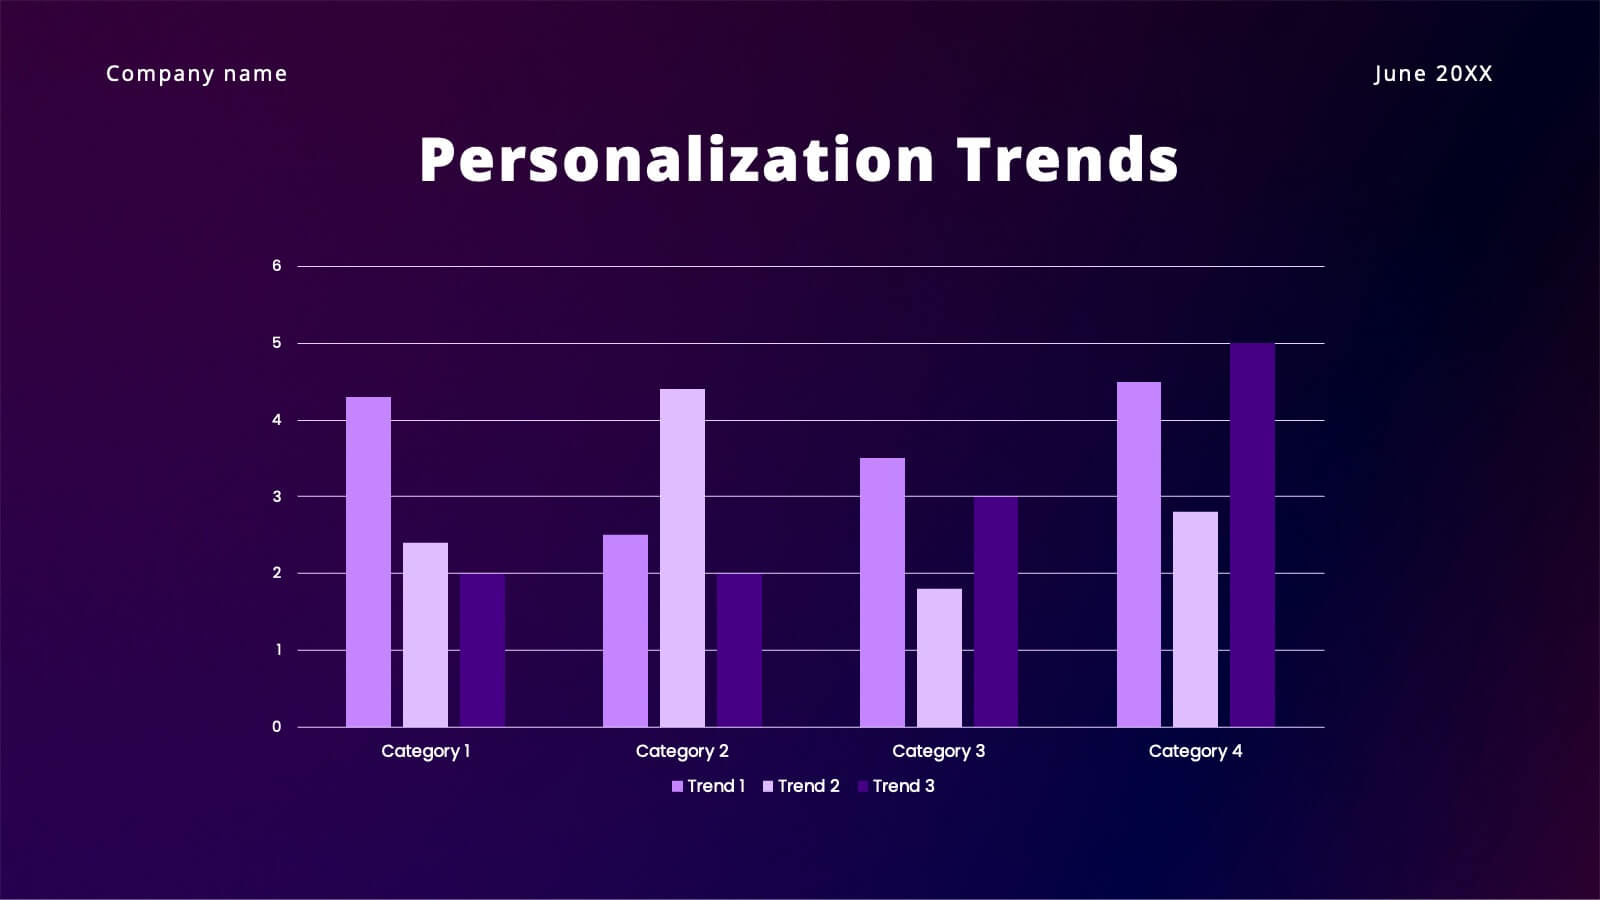
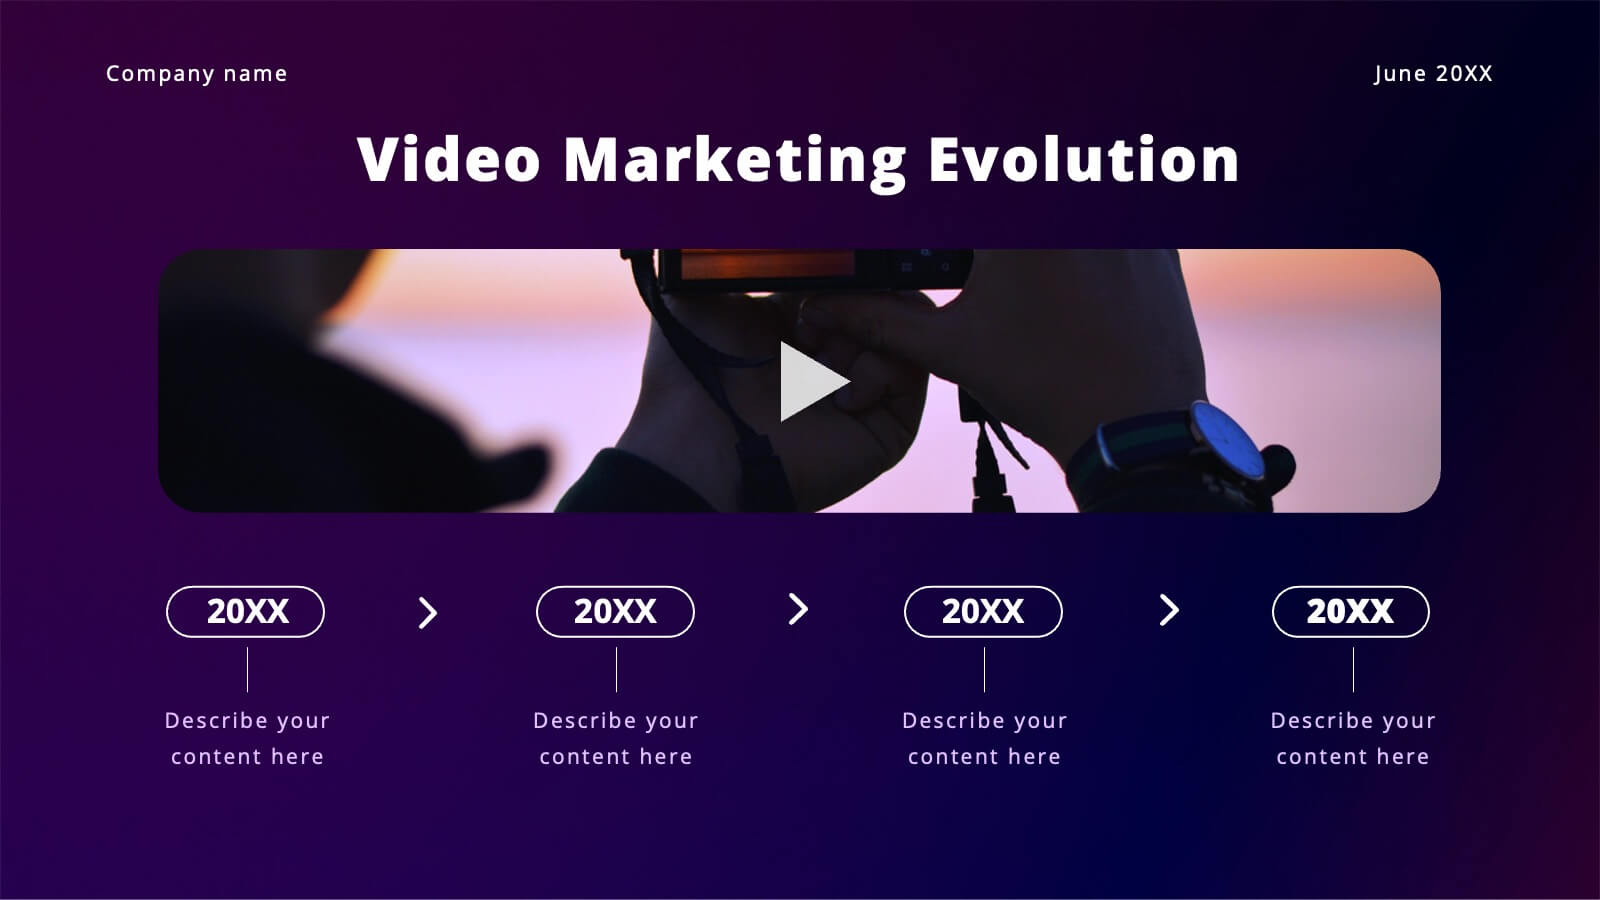
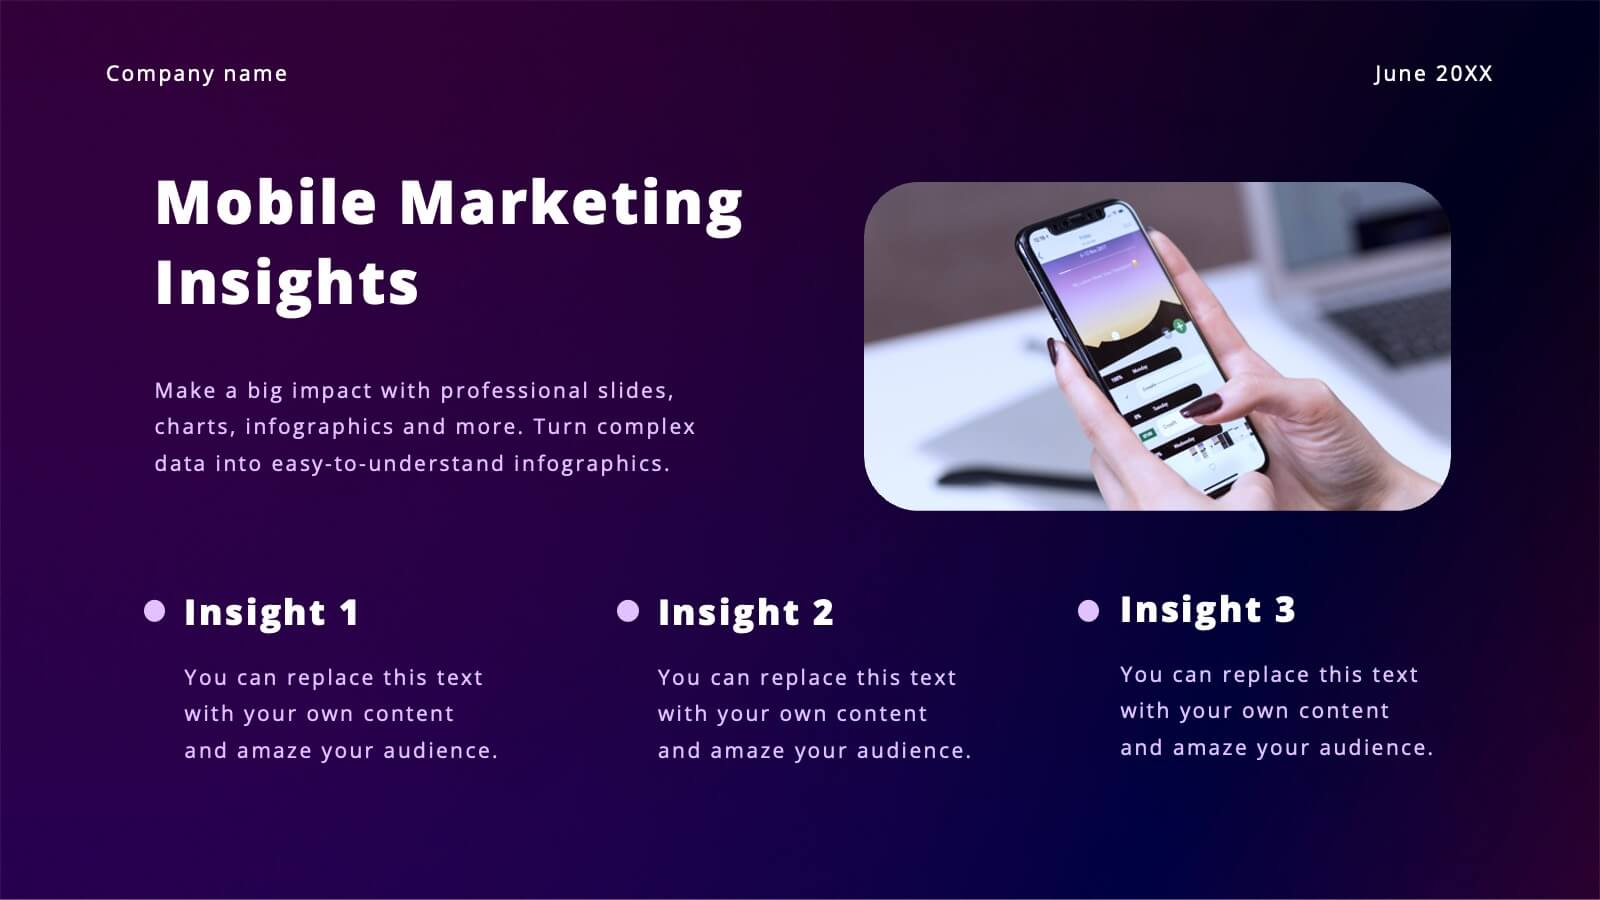
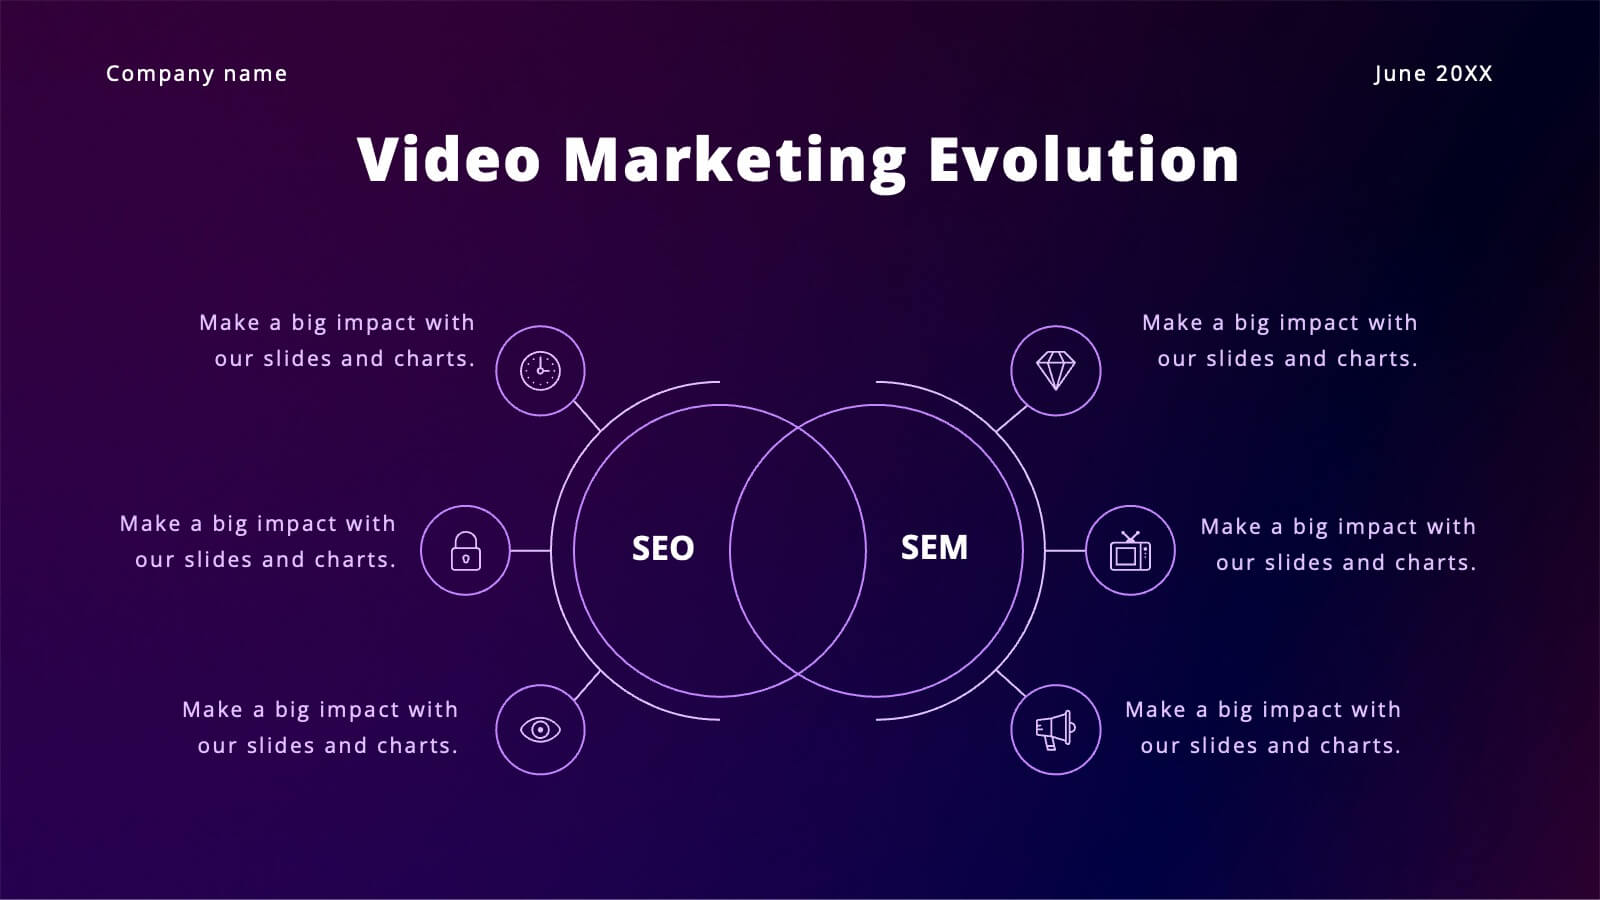
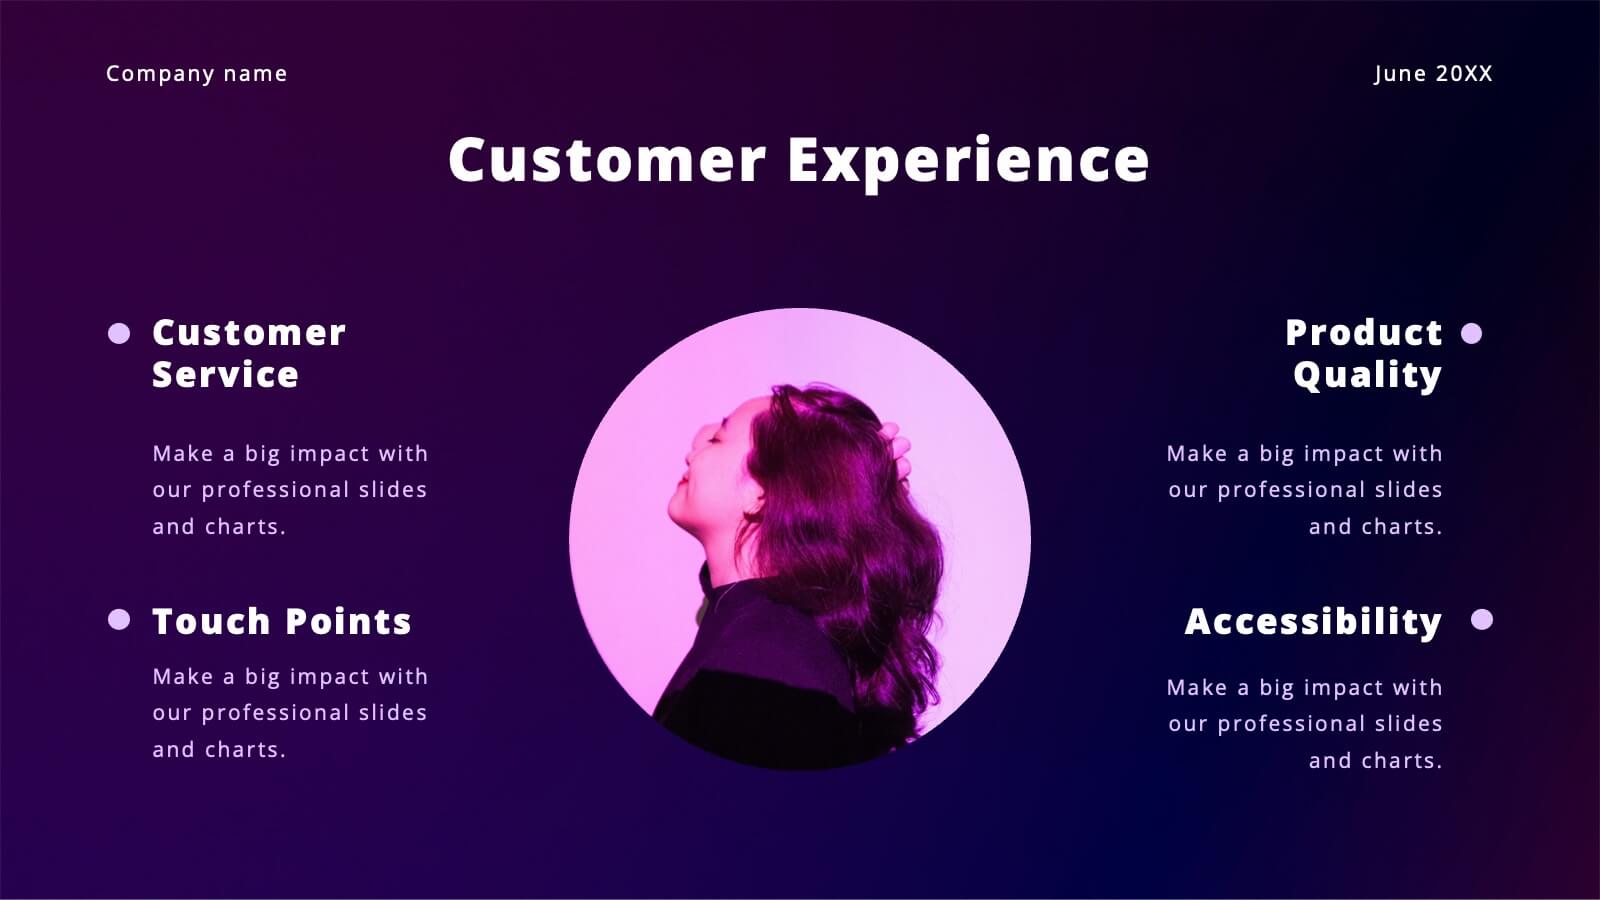
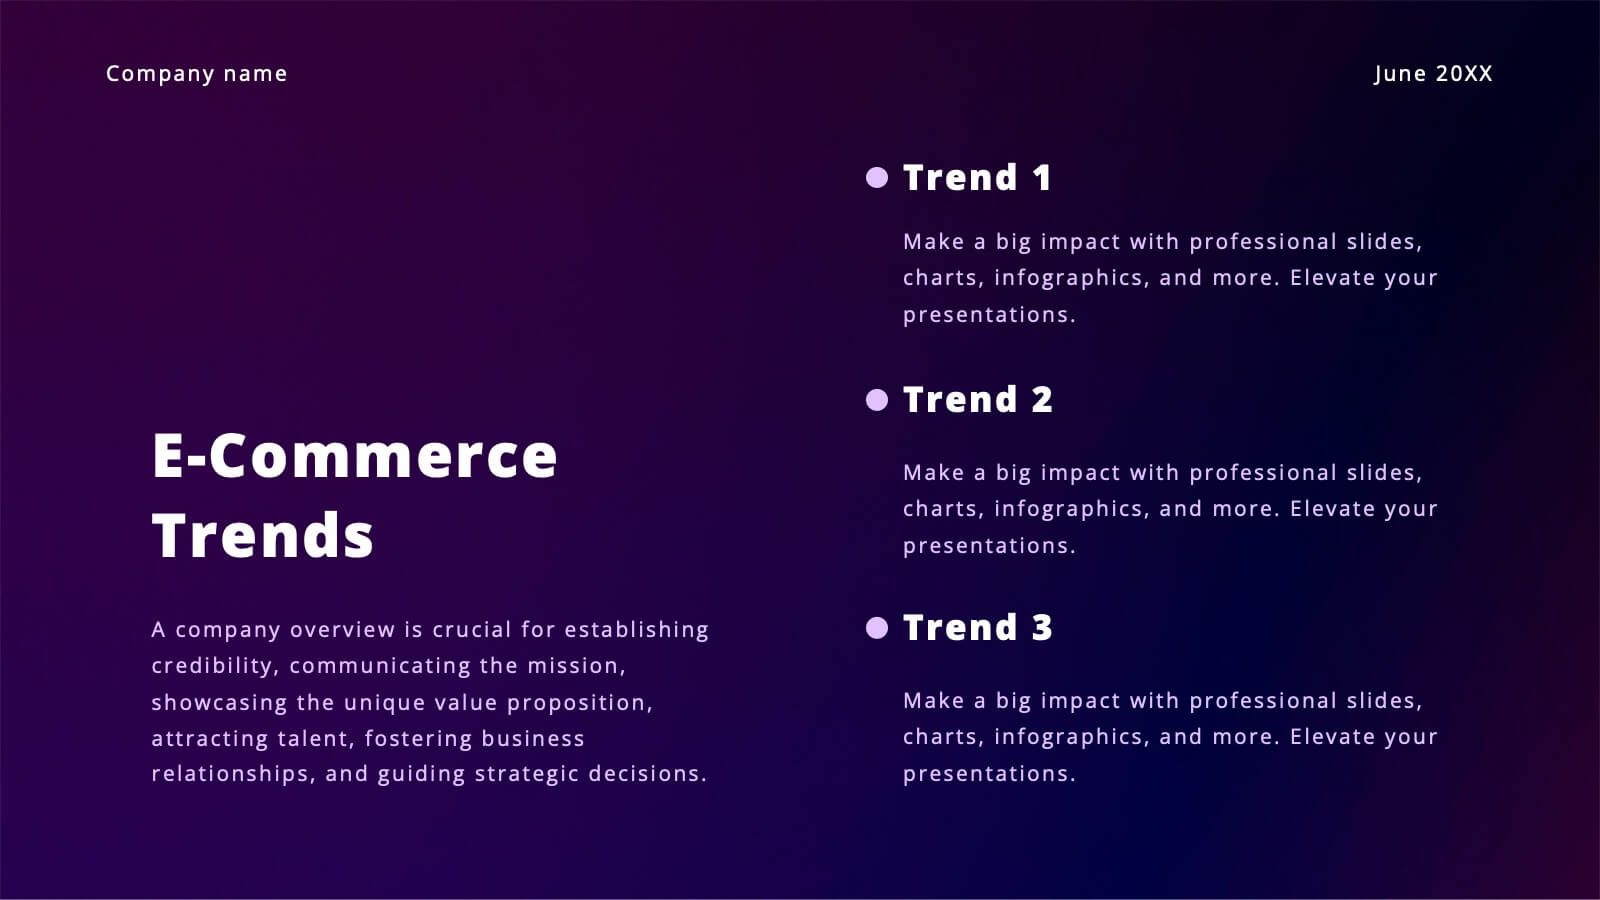
Vibrant Content Marketing Pitch Deck Presentation
Boost your marketing pitch with this vibrant deck! Covering industry overviews, customer behavior analysis, and emerging technologies, it’s designed to captivate your audience. Highlight social media strategies, data-driven marketing, and e-commerce trends effortlessly. Perfect for presenting a comprehensive marketing plan. Compatible with PowerPoint, Keynote, and Google Slides. Make your next pitch stand out!


8 diapositivas
Monthly and Weekly Planning Calendar Presentation
Stay ahead of your schedule with this all-in-one monthly and weekly planner template. Designed for professionals and teams who need to balance long-term goals with daily priorities, this presentation offers a 6-week overview, to-do list, notes section, and weekday breakdown. With sleek color-coded tabs and editable labels, it’s perfect for time-blocking, campaign tracking, or event coordination. Easily customizable in PowerPoint, Keynote, and Google Slides.


3 diapositivas
Project Status Report Overview Presentation
Bring clarity to your progress updates with this clean, easy-to-read template designed to track milestones, performance, and project goals at a glance. Ideal for team meetings and executive summaries, it turns data into visual insight. Fully compatible with PowerPoint, Keynote, and Google Slides for effortless customization and presentation.


26 diapositivas
Summer Sale Presentation
Soak up the bright, sunny vibes of a presentation template that’s perfectly tailor-made for the lively summer season. Its radiant design, infused with the essence of summer sales and tropical aesthetics, is a perfect match for retail campaigns, travel promotions, or any topic that aims to bring the sizzle of summer into a room. Bright colors, playful graphics, and beach-inspired backgrounds set the stage for vibrant storytelling, whether you're introducing a seasonal team, showcasing hot vacation spots, or highlighting the latest summer fashion. The template not only captures the casual, cheerful spirit of the season but also ensures that your content makes a splash with clear, concise data displays and infographics. It’s a breeze to use across various platforms like PowerPoint, Keynote, and Google Slides, ensuring your summer message is as refreshing as a cool ocean wave.


8 diapositivas
Workforce Engagement Strategy Presentation
Visualize employee engagement plans with the Workforce Engagement Strategy Presentation. This template includes timeline-style layouts to communicate team initiatives, motivation tactics, and HR strategies effectively. Ideal for team leads, HR managers, and consultants. Fully customizable in PowerPoint, Keynote, and Google Slides to suit your brand and communication goals.


7 diapositivas
Big Data Analytic Infographics
Big Data are the large and complex data sets that are difficult to process and analyze using traditional data processing methods. This template will allow you to visualize key data points and insights in an appealing and easy to digest way. Your information is presented in a clear manner with a variety of graphs, to convey the fundamentals of big data analytics. Customize this infographic with your own data in the bullet points and graphics. Quickly edit text and colors for your next presentation. All the slide in this template are fully editable in Powerpoint, Keynote, and Google Slides.


23 diapositivas
Quest Qualitative Research Findings Presentation
This dynamic and sleek research template presents qualitative findings with style and clarity. Dive into research objectives, data collection, key findings, and future directions, all showcased with a minimalist black-and-white design. Perfect for impactful presentations, this template is compatible with PowerPoint, Keynote, and Google Slides, making it versatile for any audience!


6 diapositivas
Role-Based Responsibility Matrix Presentation
Clarify team roles and accountability with this structured responsibility matrix. Perfect for RACI models and project task alignment, this template features customizable categories, color-coded rows, and editable role labels. Ideal for project managers and team leads. Fully compatible with PowerPoint, Google Slides, and Keynote for easy customization and collaboration.