


Características


¿Tienes alguna pregunta?
Recomendar


6 diapositivas
Geometric Patterns Infographics
Step into the fascinating realm of geometric patterns! This infographic invites you to explore the captivating world of shapes and symmetries. From the mesmerizing allure of intricate designs to the mathematical precision behind each pattern, we'll reveal the secrets that make geometric patterns a timeless art form. Delve into the core principles of geometric patterns. Gain insights into the geometry behind these intricate designs, from basic shapes like circles and squares to more complex constructions. Uncover the history and cultural significance of these patterns, from ancient civilizations to contemporary art and design. With this captivating infographic, compatible with PowerPoint, Keynote, and Google Slides, sharing your enthusiasm for geometric patterns has never been easier. Empower yourself with the knowledge to appreciate and create these mesmerizing designs. Dive into the world of geometric patterns and embark on a journey of artistic exploration and appreciation.


6 diapositivas
Executive Summary Slide Deck Presentation
Kick off your message with a slide that instantly pulls everything together in a clean, engaging flow. This presentation helps you highlight key insights, outline major updates, and present essential takeaways with clarity and structure. Ideal for meetings, reports, and leadership briefs. Fully compatible with PowerPoint, Keynote, and Google Slides.


5 diapositivas
Competitor Features Comparison Matrix Presentation
Clearly highlight competitive advantages with the Competitor Features Comparison Matrix Presentation. This sleek, easy-to-read slide lets you compare product features or service offerings across up to four competitors. Use checkmarks and icons to visually emphasize strengths and gaps. Fully editable in Canva, PowerPoint, and Google Slides—perfect for strategy, sales, or pitch decks.


6 diapositivas
Sports Equipment Infographics
The "Sports Equipment" infographic template is a dynamic and engaging tool, perfectly crafted for PowerPoint, Keynote, and Google Slides. This template is an excellent choice for sports retailers, equipment manufacturers, and fitness enthusiasts who wish to showcase a range of sports gear and its features. The template vividly displays various types of sports equipment, detailing their use, benefits, and technical specifications. It's designed to highlight product features, usage tips, and maintenance advice, making it highly useful for product demonstrations, sales presentations, and customer education. With a vibrant and energetic design, the color scheme of the template is tailored to capture the spirit of sports and fitness. This not only makes the presentation visually striking but also aligns with the themes of activity, energy, and health. Whether used in a retail setting, a trade show, or a fitness workshop, this template ensures that the diverse range of sports equipment is presented in a visually appealing, organized, and informative manner.


6 diapositivas
Execution Strategy and Action Plan Breakdown Presentation
Clarify your business roadmap with the Execution Strategy and Action Plan Breakdown Presentation. This template helps visualize each strategic step using a clean, linear layout with colorful icons. Perfect for outlining processes, task flows, or operational plans. Easily editable in Canva, PowerPoint, and Google Slides for maximum flexibility.


7 diapositivas
Health Science Infographic
Dive deep into the realm of health science with our health science infographic. Merging the meticulousness of a laboratory with health, this infographic is crafted in pristine white complemented by refreshing green shades. The design captures the essence of both the clinical and nurturing facets of health science. Integrated within the template are tailored graphics symbolizing various aspects of health science. Compatible with PowerPoint, Keynote, and Google Slides. The icons are designed to convey complex scientific concepts with clarity, while the strategically placed image placeholders allow for the incorporation of real-life visuals or explanatory diagrams.


8 diapositivas
User-Centered Design with Empathy Map
Step into your user's shoes—literally. This engaging empathy map slide helps you visualize user behavior, thoughts, emotions, and needs in one clean layout. Ideal for UX strategies, product development, or customer journey sessions. Fully editable and works seamlessly with PowerPoint, Keynote, and Google Slides.


7 diapositivas
Blue Ocean Diagram Presentation
The Blue Ocean Strategy goal is to create a market space that is untapped, and in doing so, break away from the competition, create new demand, and increase profits. This template is designed for use in Powerpoint, Keynote, and Google Slides, and is perfect for anyone looking to create an informative and engaging presentation on this topic. This template is a useful tool for professionals and students. It provides informative illustration and information about the Blue Ocean Strategy to help you visually present your research, build a strategy or deliver a presentation on blue ocean strategies.


6 diapositivas
6-Stage Business Cycle Presentation
The "6-Stage Business Cycle Presentation" template expertly outlines the progression of business processes through a visually appealing circular diagram, perfect for detailed strategic presentations. This template features six interconnected stages, each distinguished by unique colors and intuitive icons, simplifying complex business concepts into digestible segments. Central placeholders allow for concise titles and brief descriptions, enhancing clarity and comprehension. Ideal for business analysts, strategists, and educators, this tool facilitates the effective communication of developmental cycles, operational processes, and strategic evaluations. Use this template in board meetings, workshops, or educational sessions to convey the cyclical nature of business tasks and strategies efficiently.


12 diapositivas
Market Analysis PESTEL Presentation
The "Market Analysis PESTEL" presentation efficiently segments essential factors that affect market trends into six categories: Political, Economic, Social, Technological, Environmental, and Legal. Each category is visually represented with a distinct color, allowing easy identification and organization of related data. The layout provides clear placeholders for inserting detailed information, making it a practical tool for presenting comprehensive market analyses. This visual framework supports strategic decision-making by highlighting external factors that might impact business environments.


21 diapositivas
Aetherial UX Research Report Presentation
A professional and modern template for UX research presentations. Highlight key elements such as user personas, journey mapping, wireframes, and testing processes. Includes slides for accessibility considerations, design systems, and feedback iteration. Fully customizable and compatible with PowerPoint, Keynote, and Google Slides to deliver impactful insights and research findings.


4 diapositivas
Audience Segmentation by Persona Presentation
Make data talk with personality! This vibrant slide set helps you visually compare buyer personas and their unique traits to refine audience targeting strategies. Whether you’re mapping user types or customer behaviors, these editable slides are perfect for strategic marketing. Fully compatible with PowerPoint, Keynote, and Google Slides.


21 diapositivas
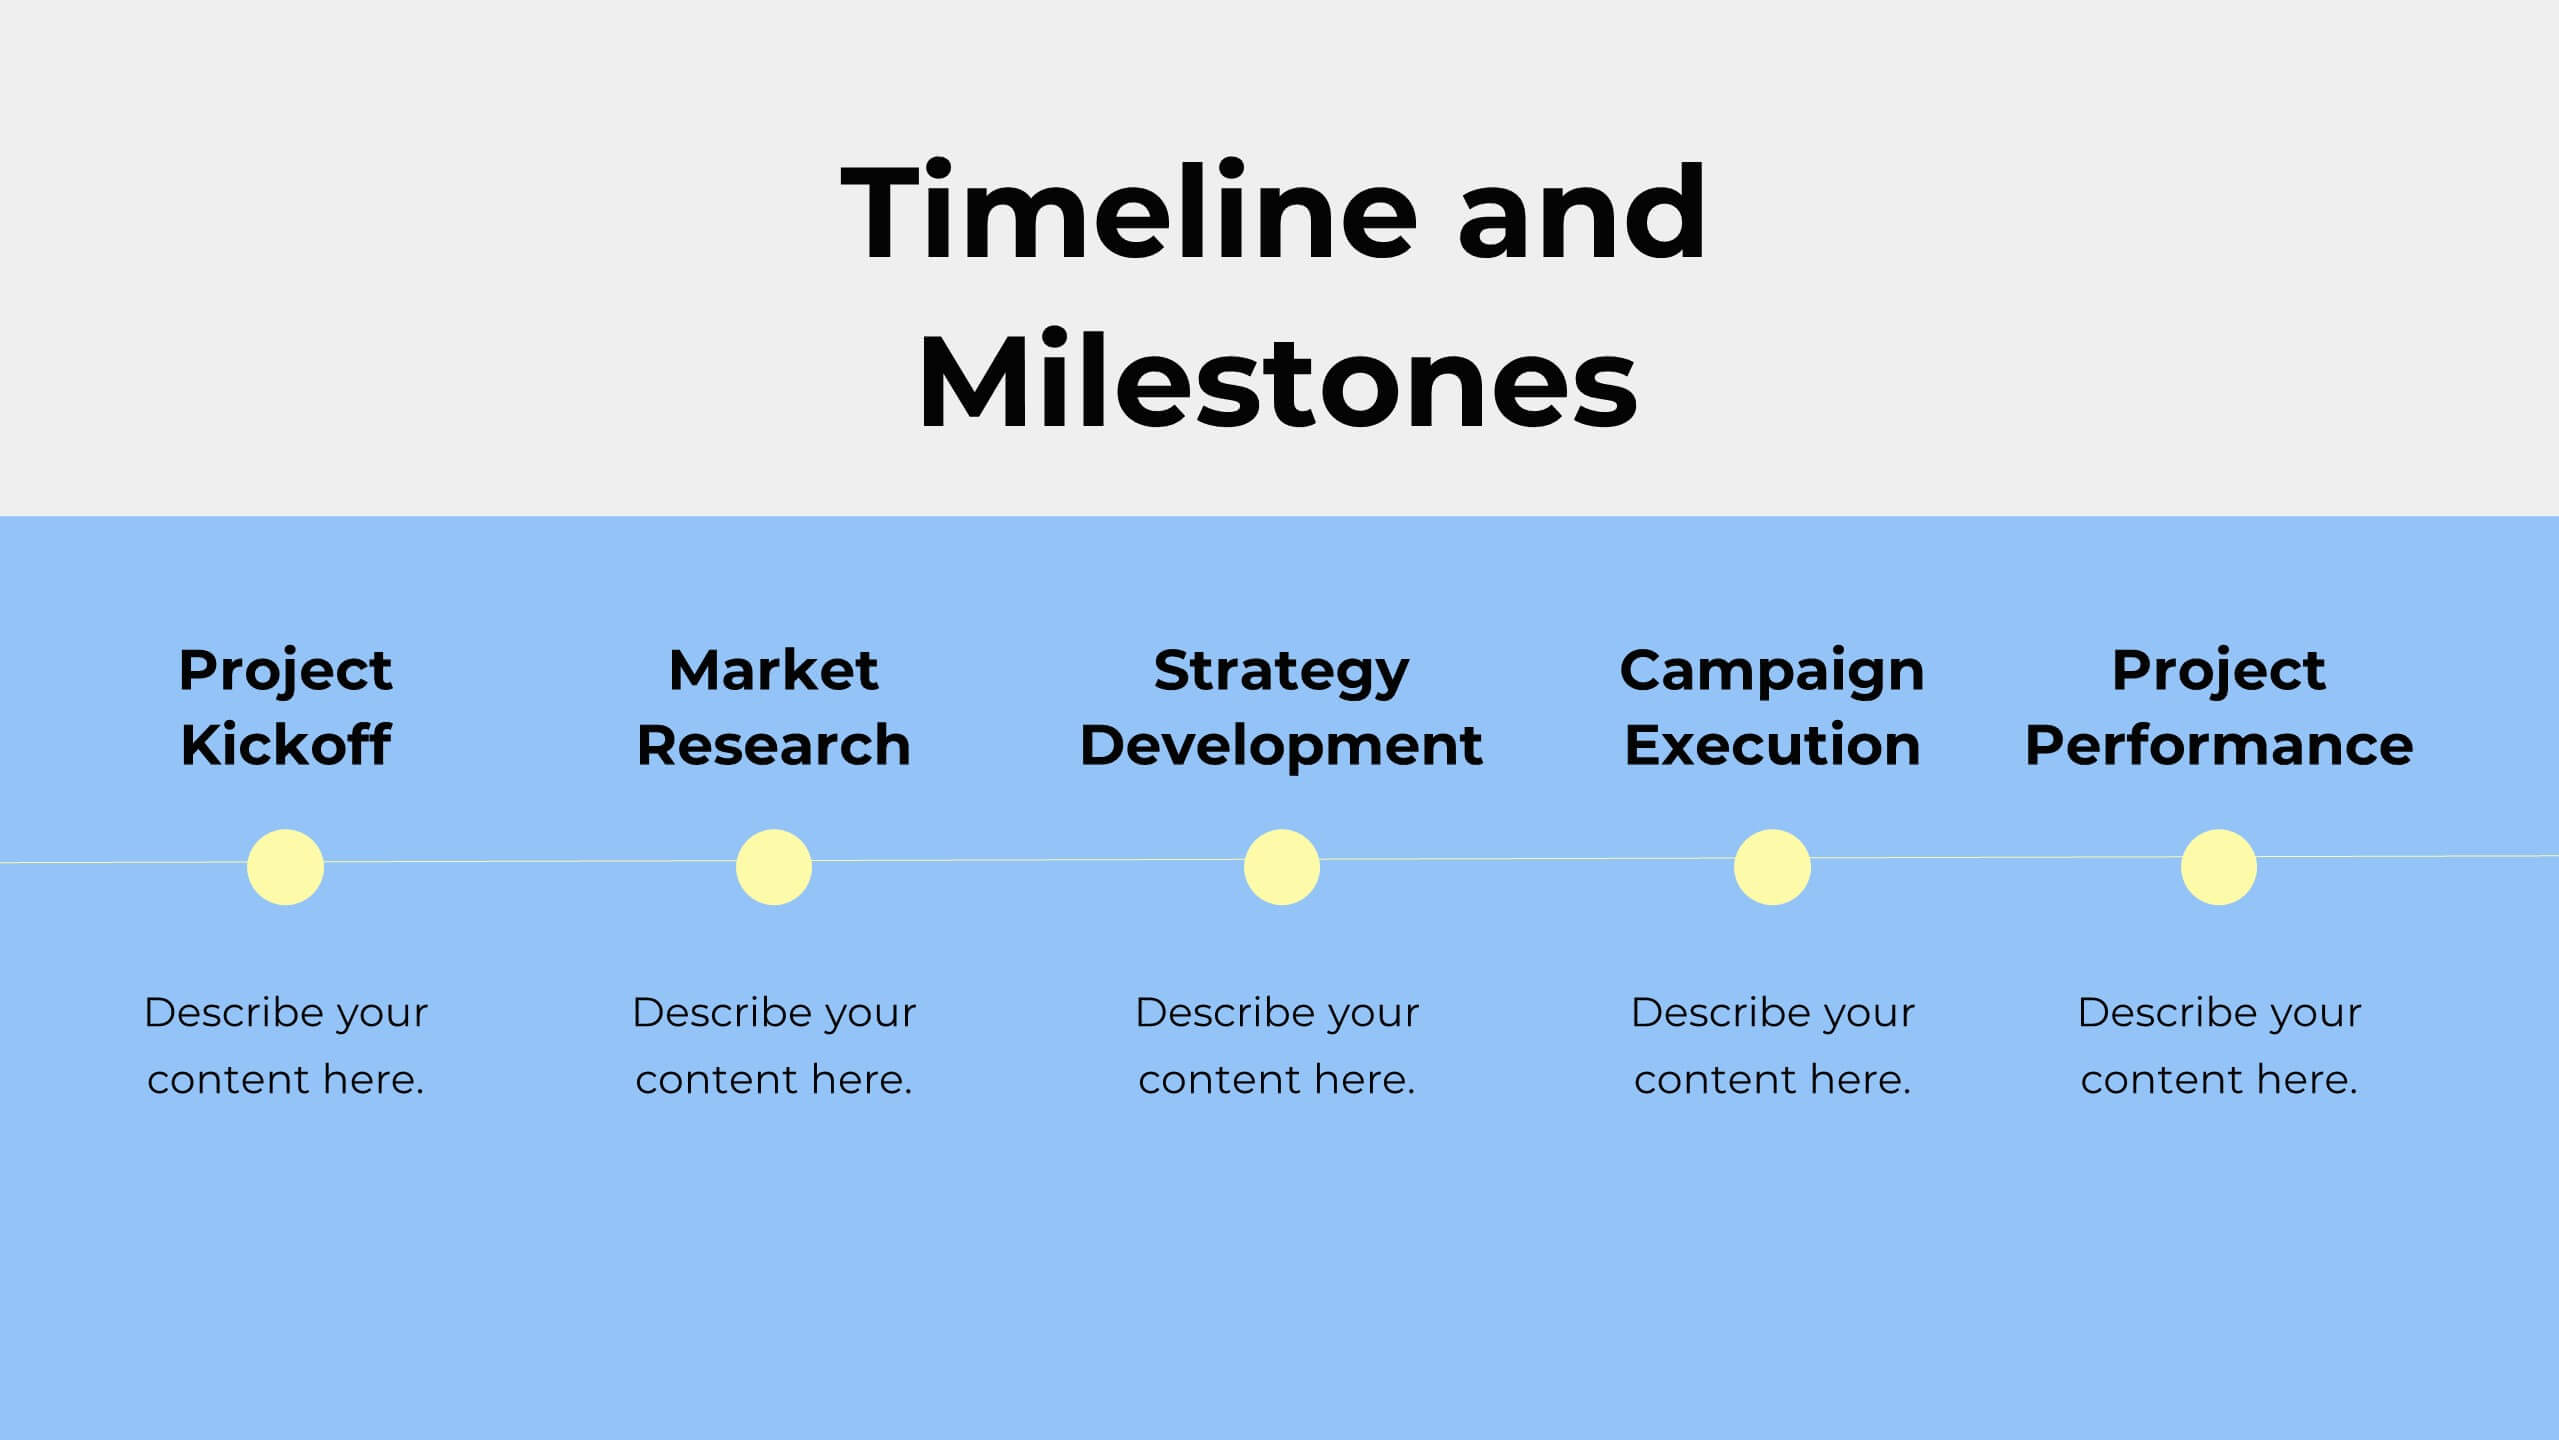
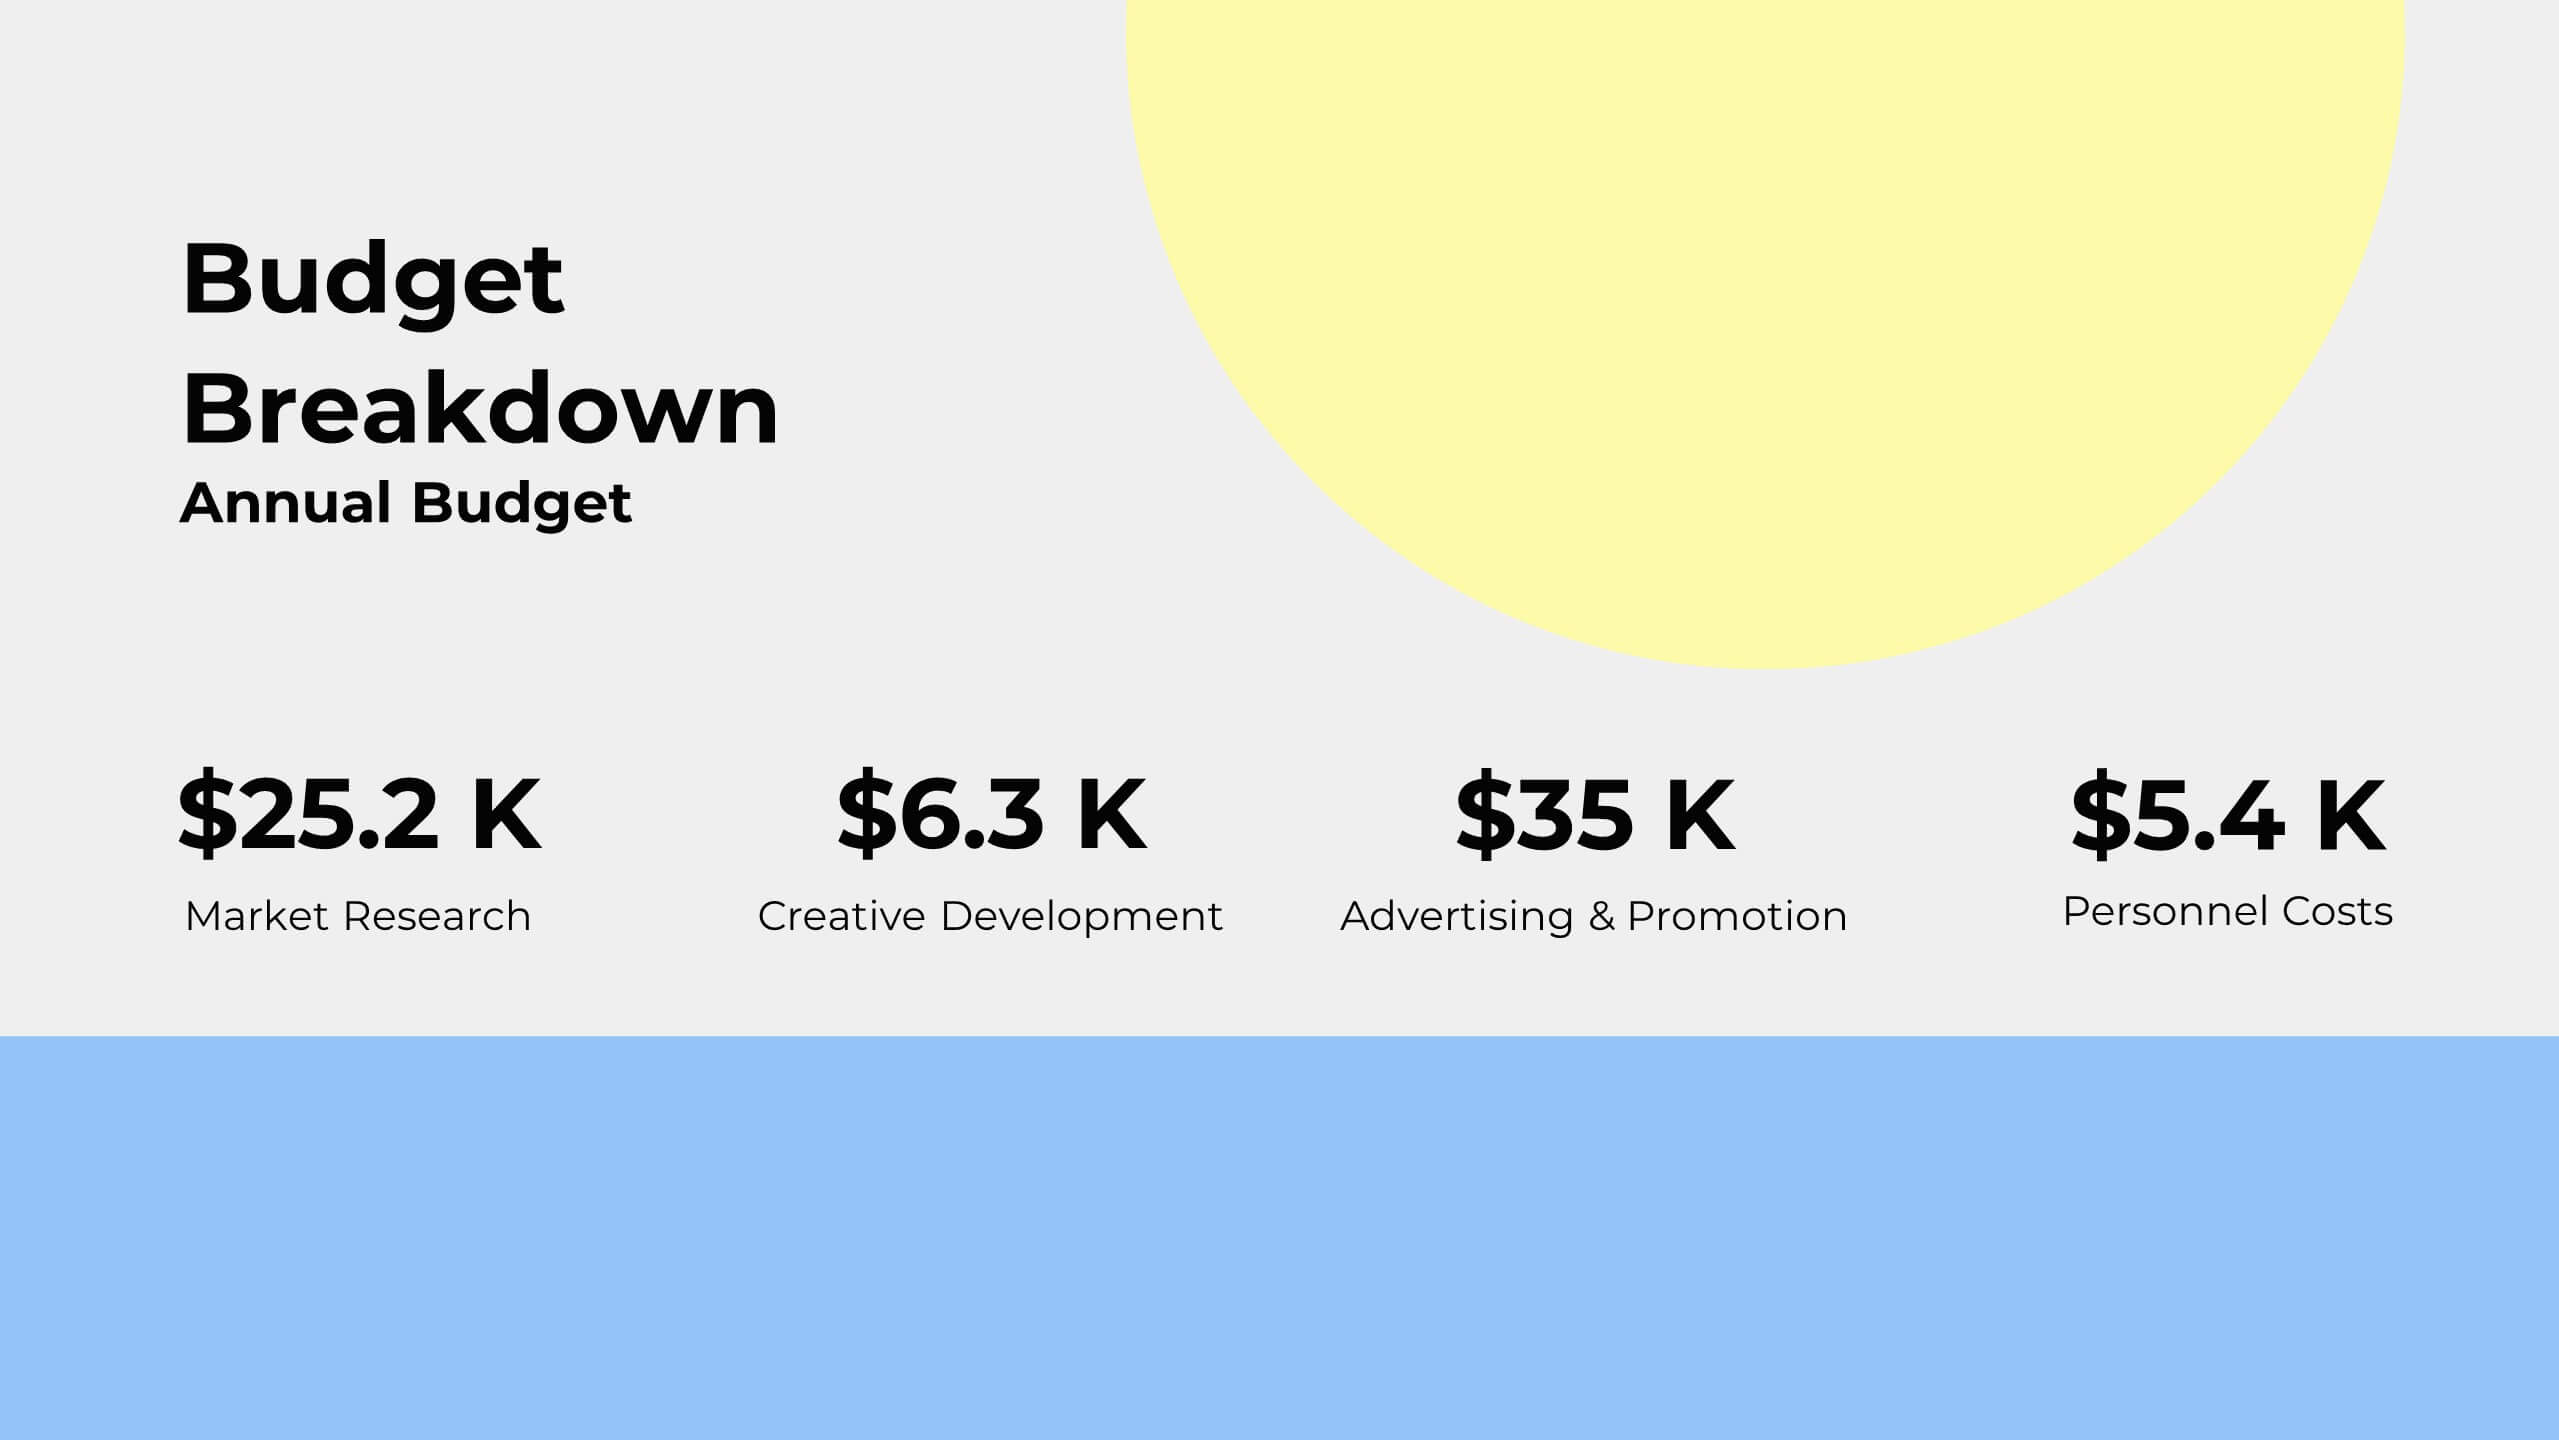
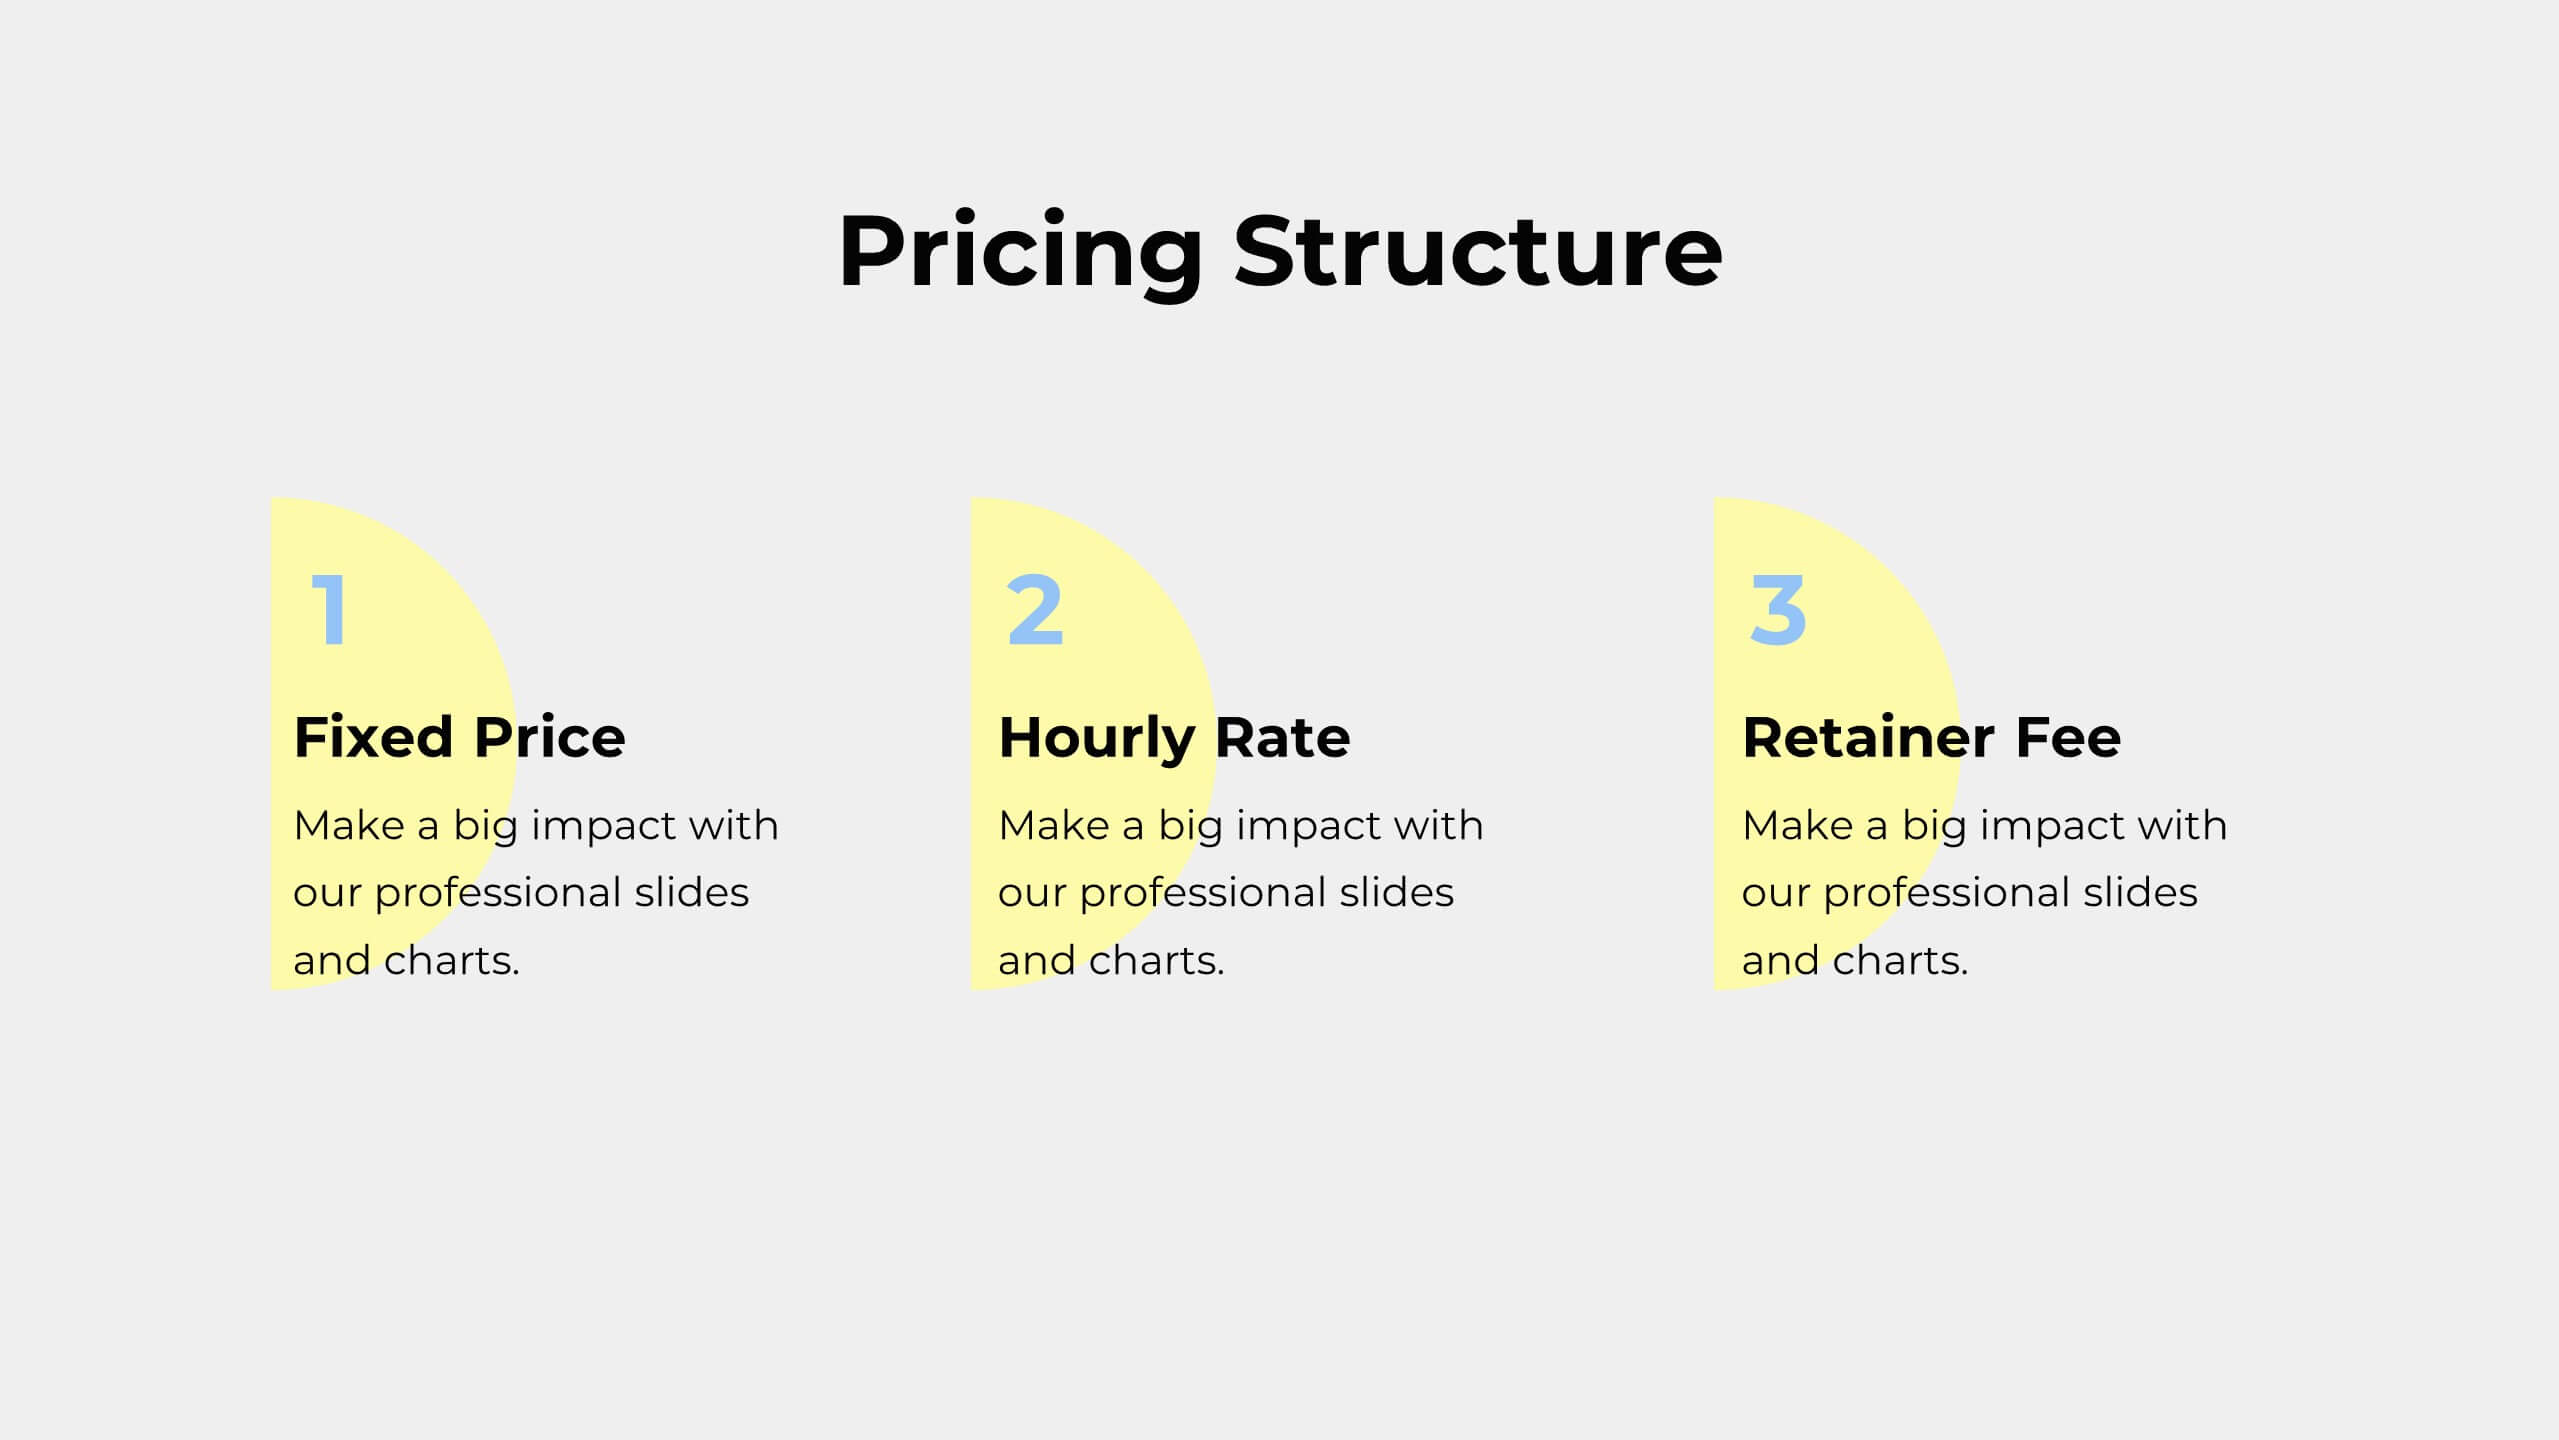
Flare Project Management Plan Presentation
Unleash the full potential of your projects with a dynamic plan template that makes every detail shine! This vibrant and clear design is built to guide your team and stakeholders through every phase of your project with confidence and clarity. Starting with a compelling introduction and project overview, this template captures attention and sets the stage for success. Dive deep into problem statements, objectives, and the scope of work, all presented in a visually appealing and easy-to-digest format. With sections dedicated to timelines, milestones, budget breakdowns, and resource allocation, this template ensures every aspect of your project is meticulously planned and communicated. The inclusion of stakeholder analysis, risk management, and quality assurance plans showcases your thorough approach to project management. Perfectly compatible with PowerPoint, Keynote, and Google Slides, this template is your go-to tool for creating project plans that are both inspiring and effective. Get ready to impress and lead your projects to success!


20 diapositivas
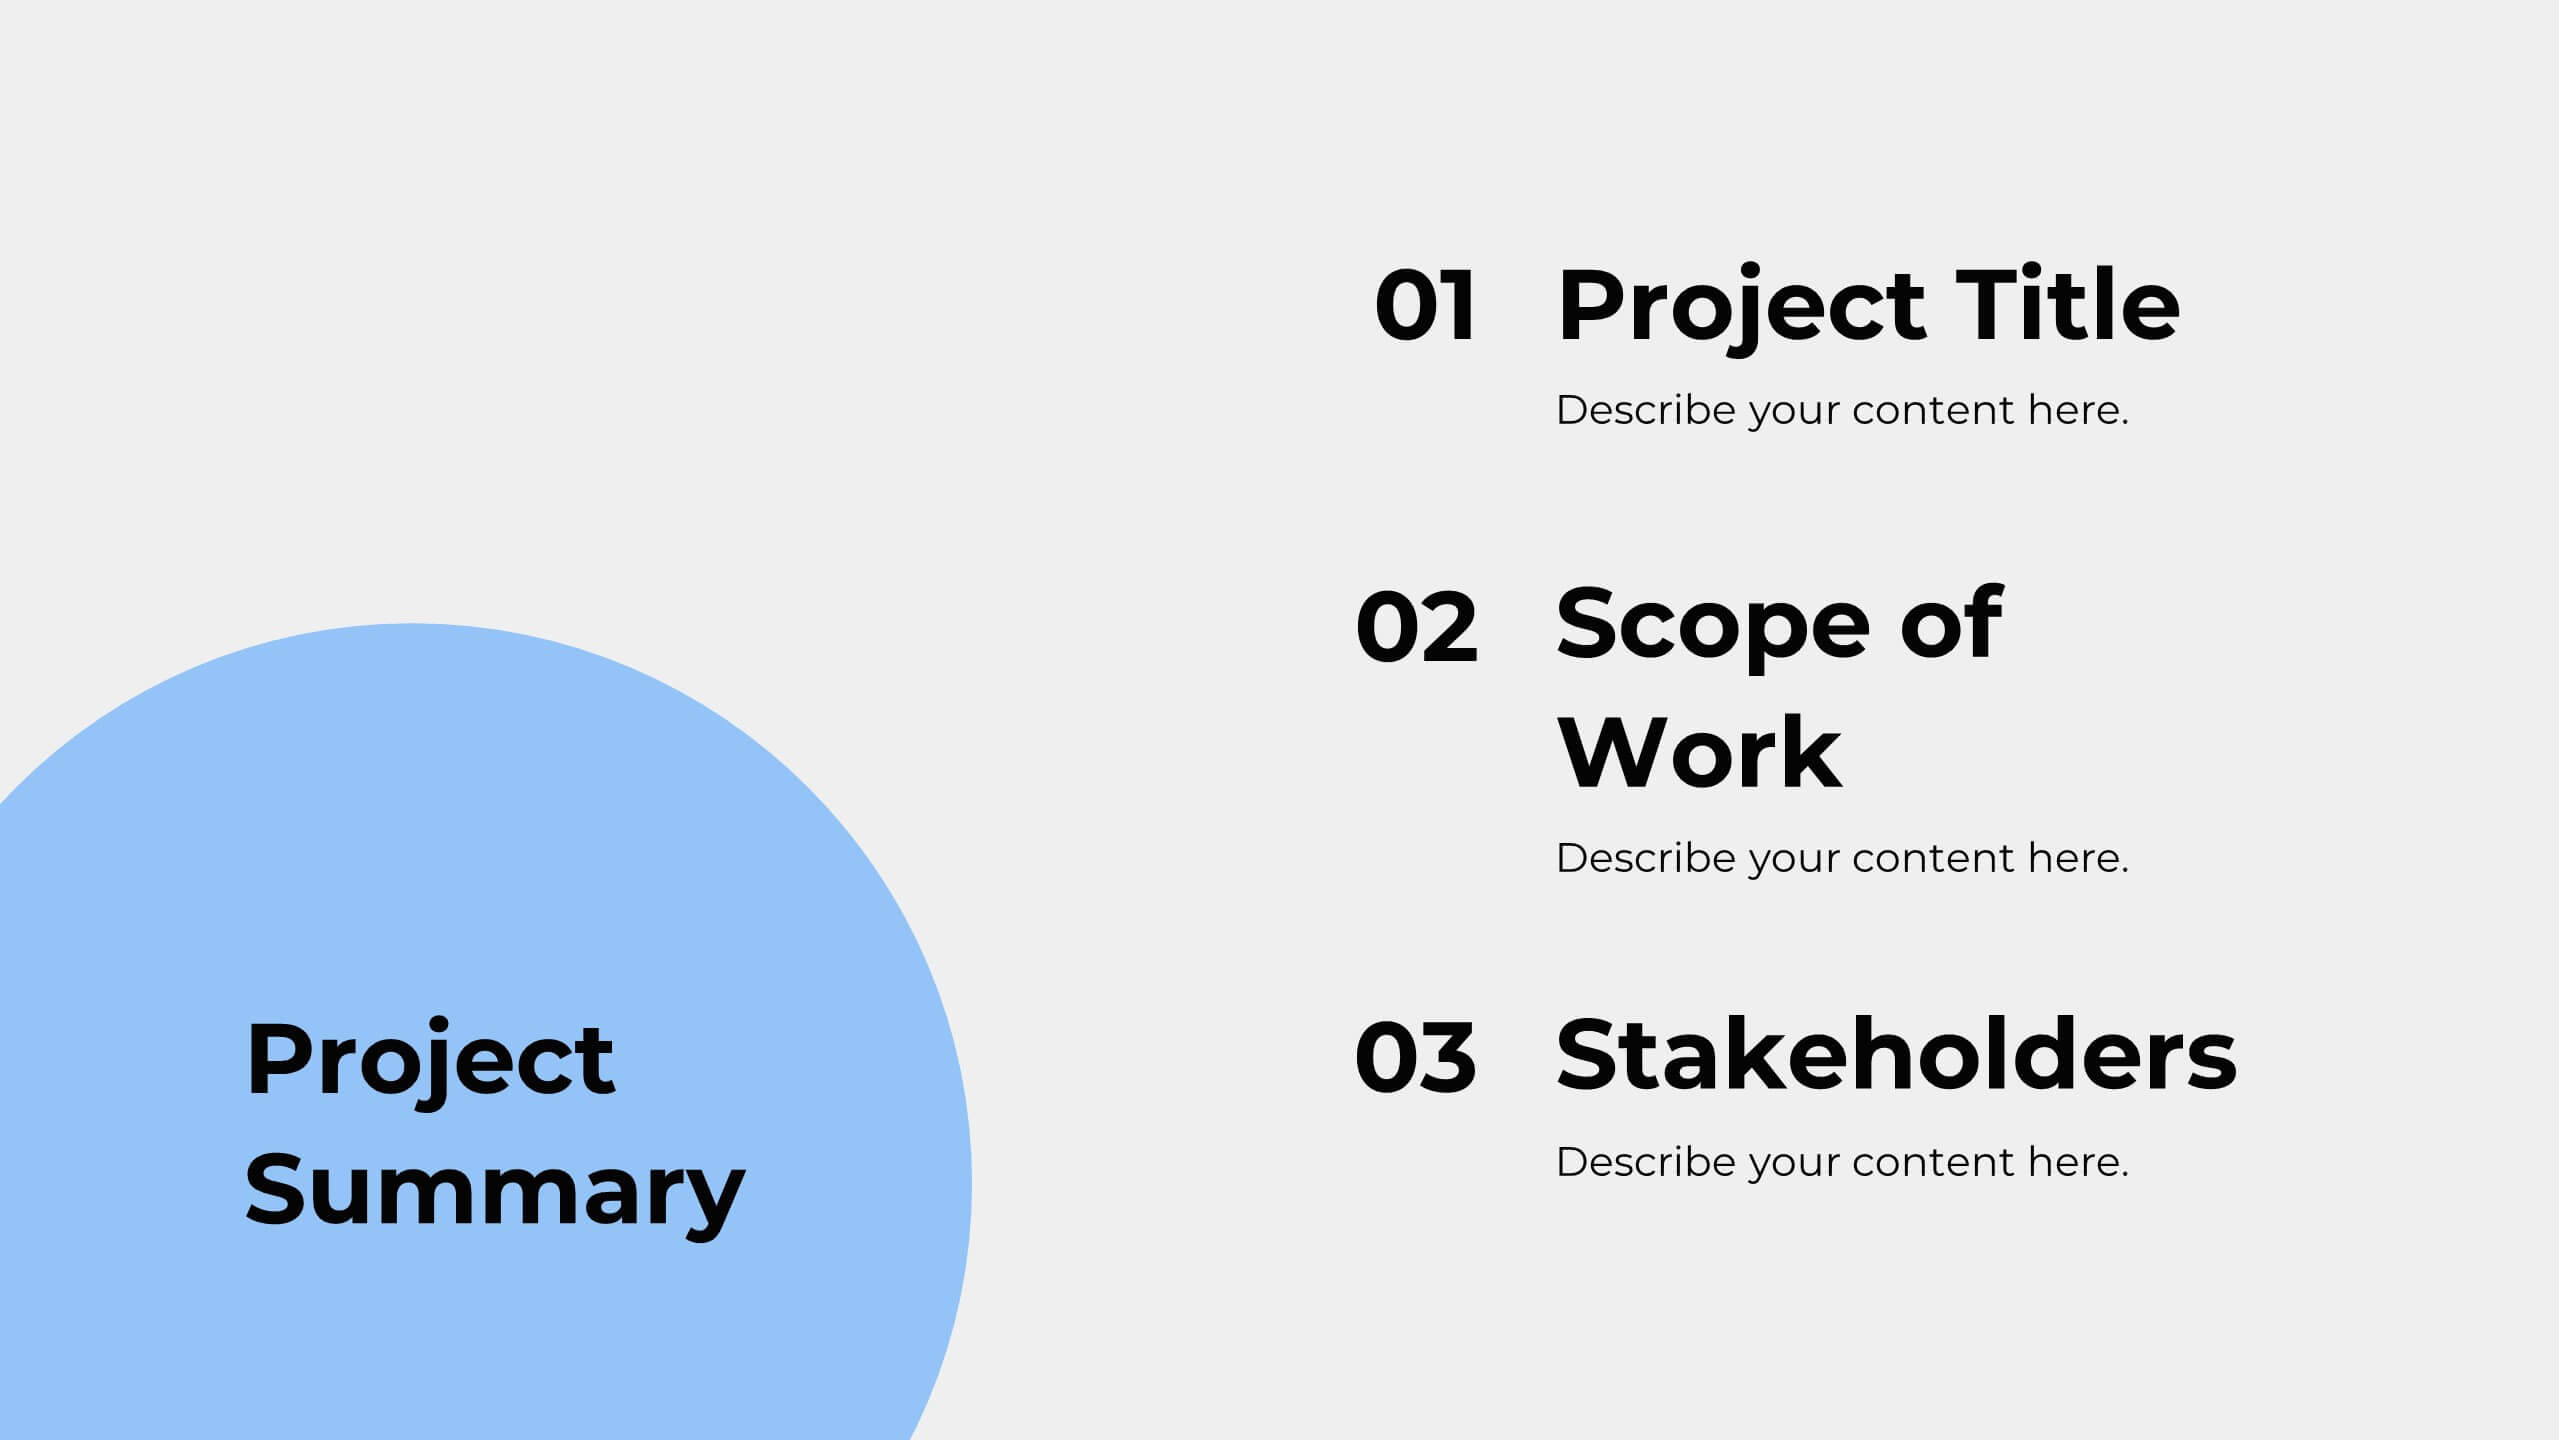
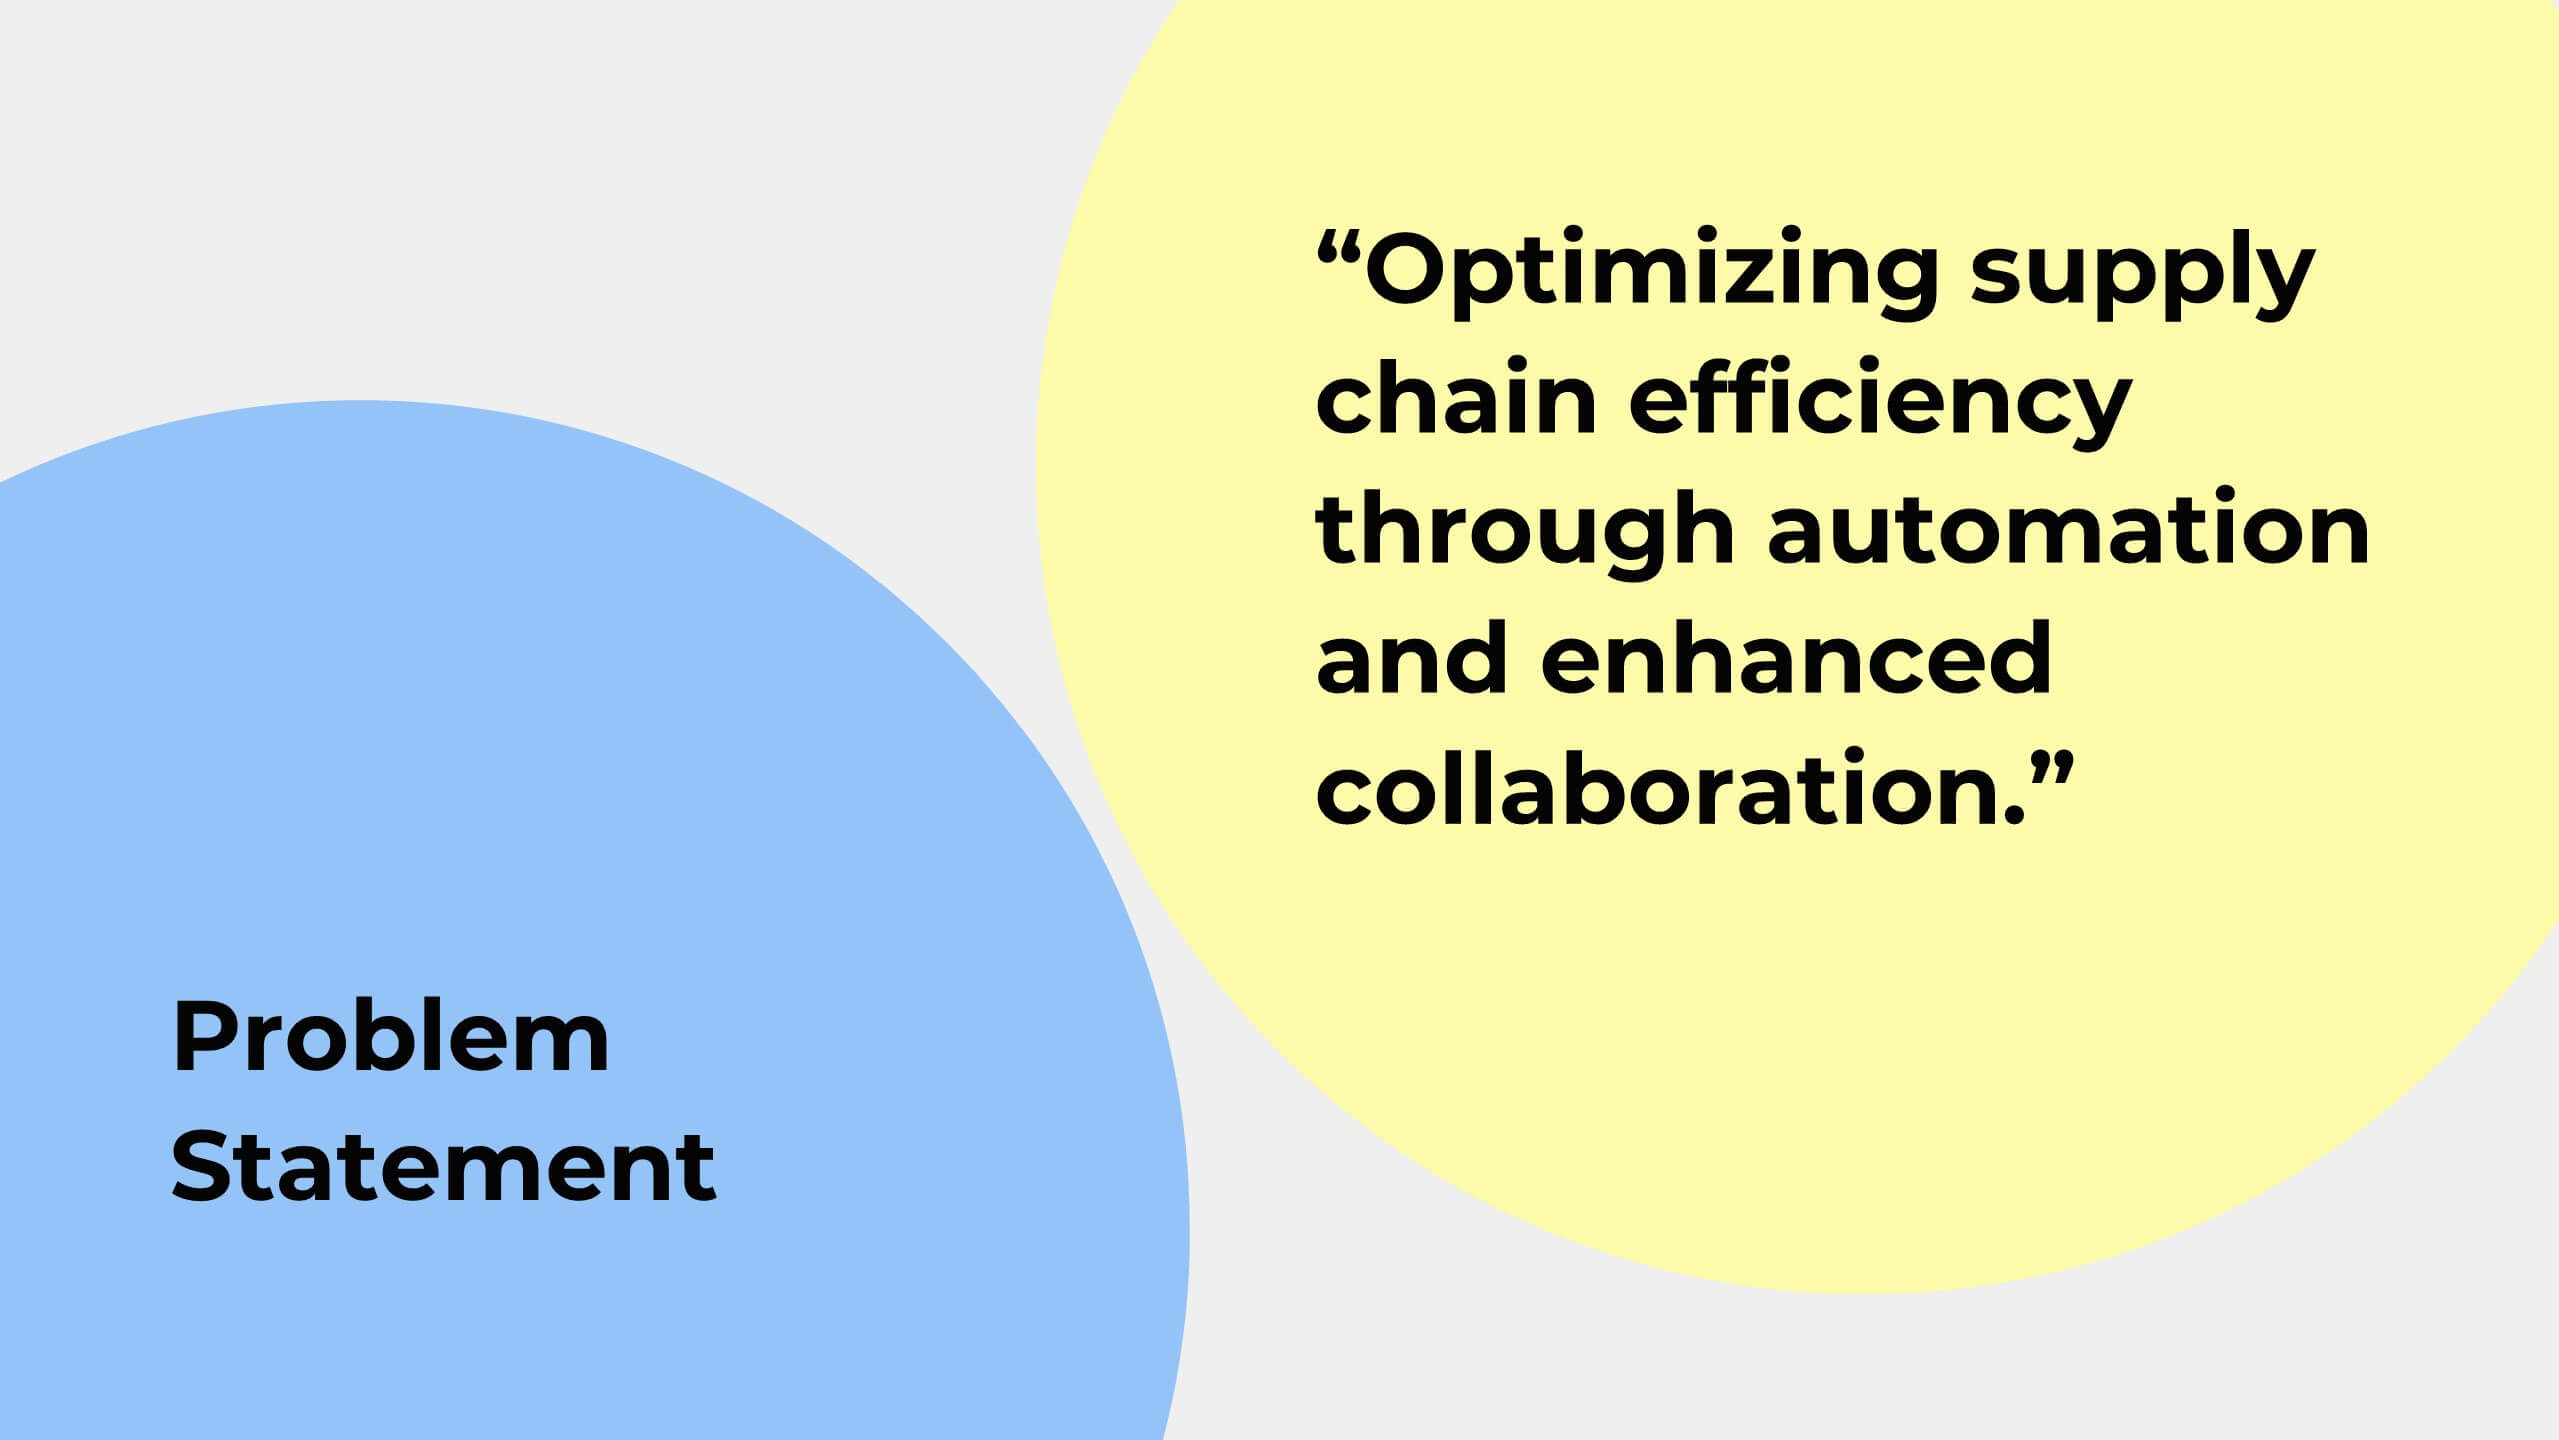
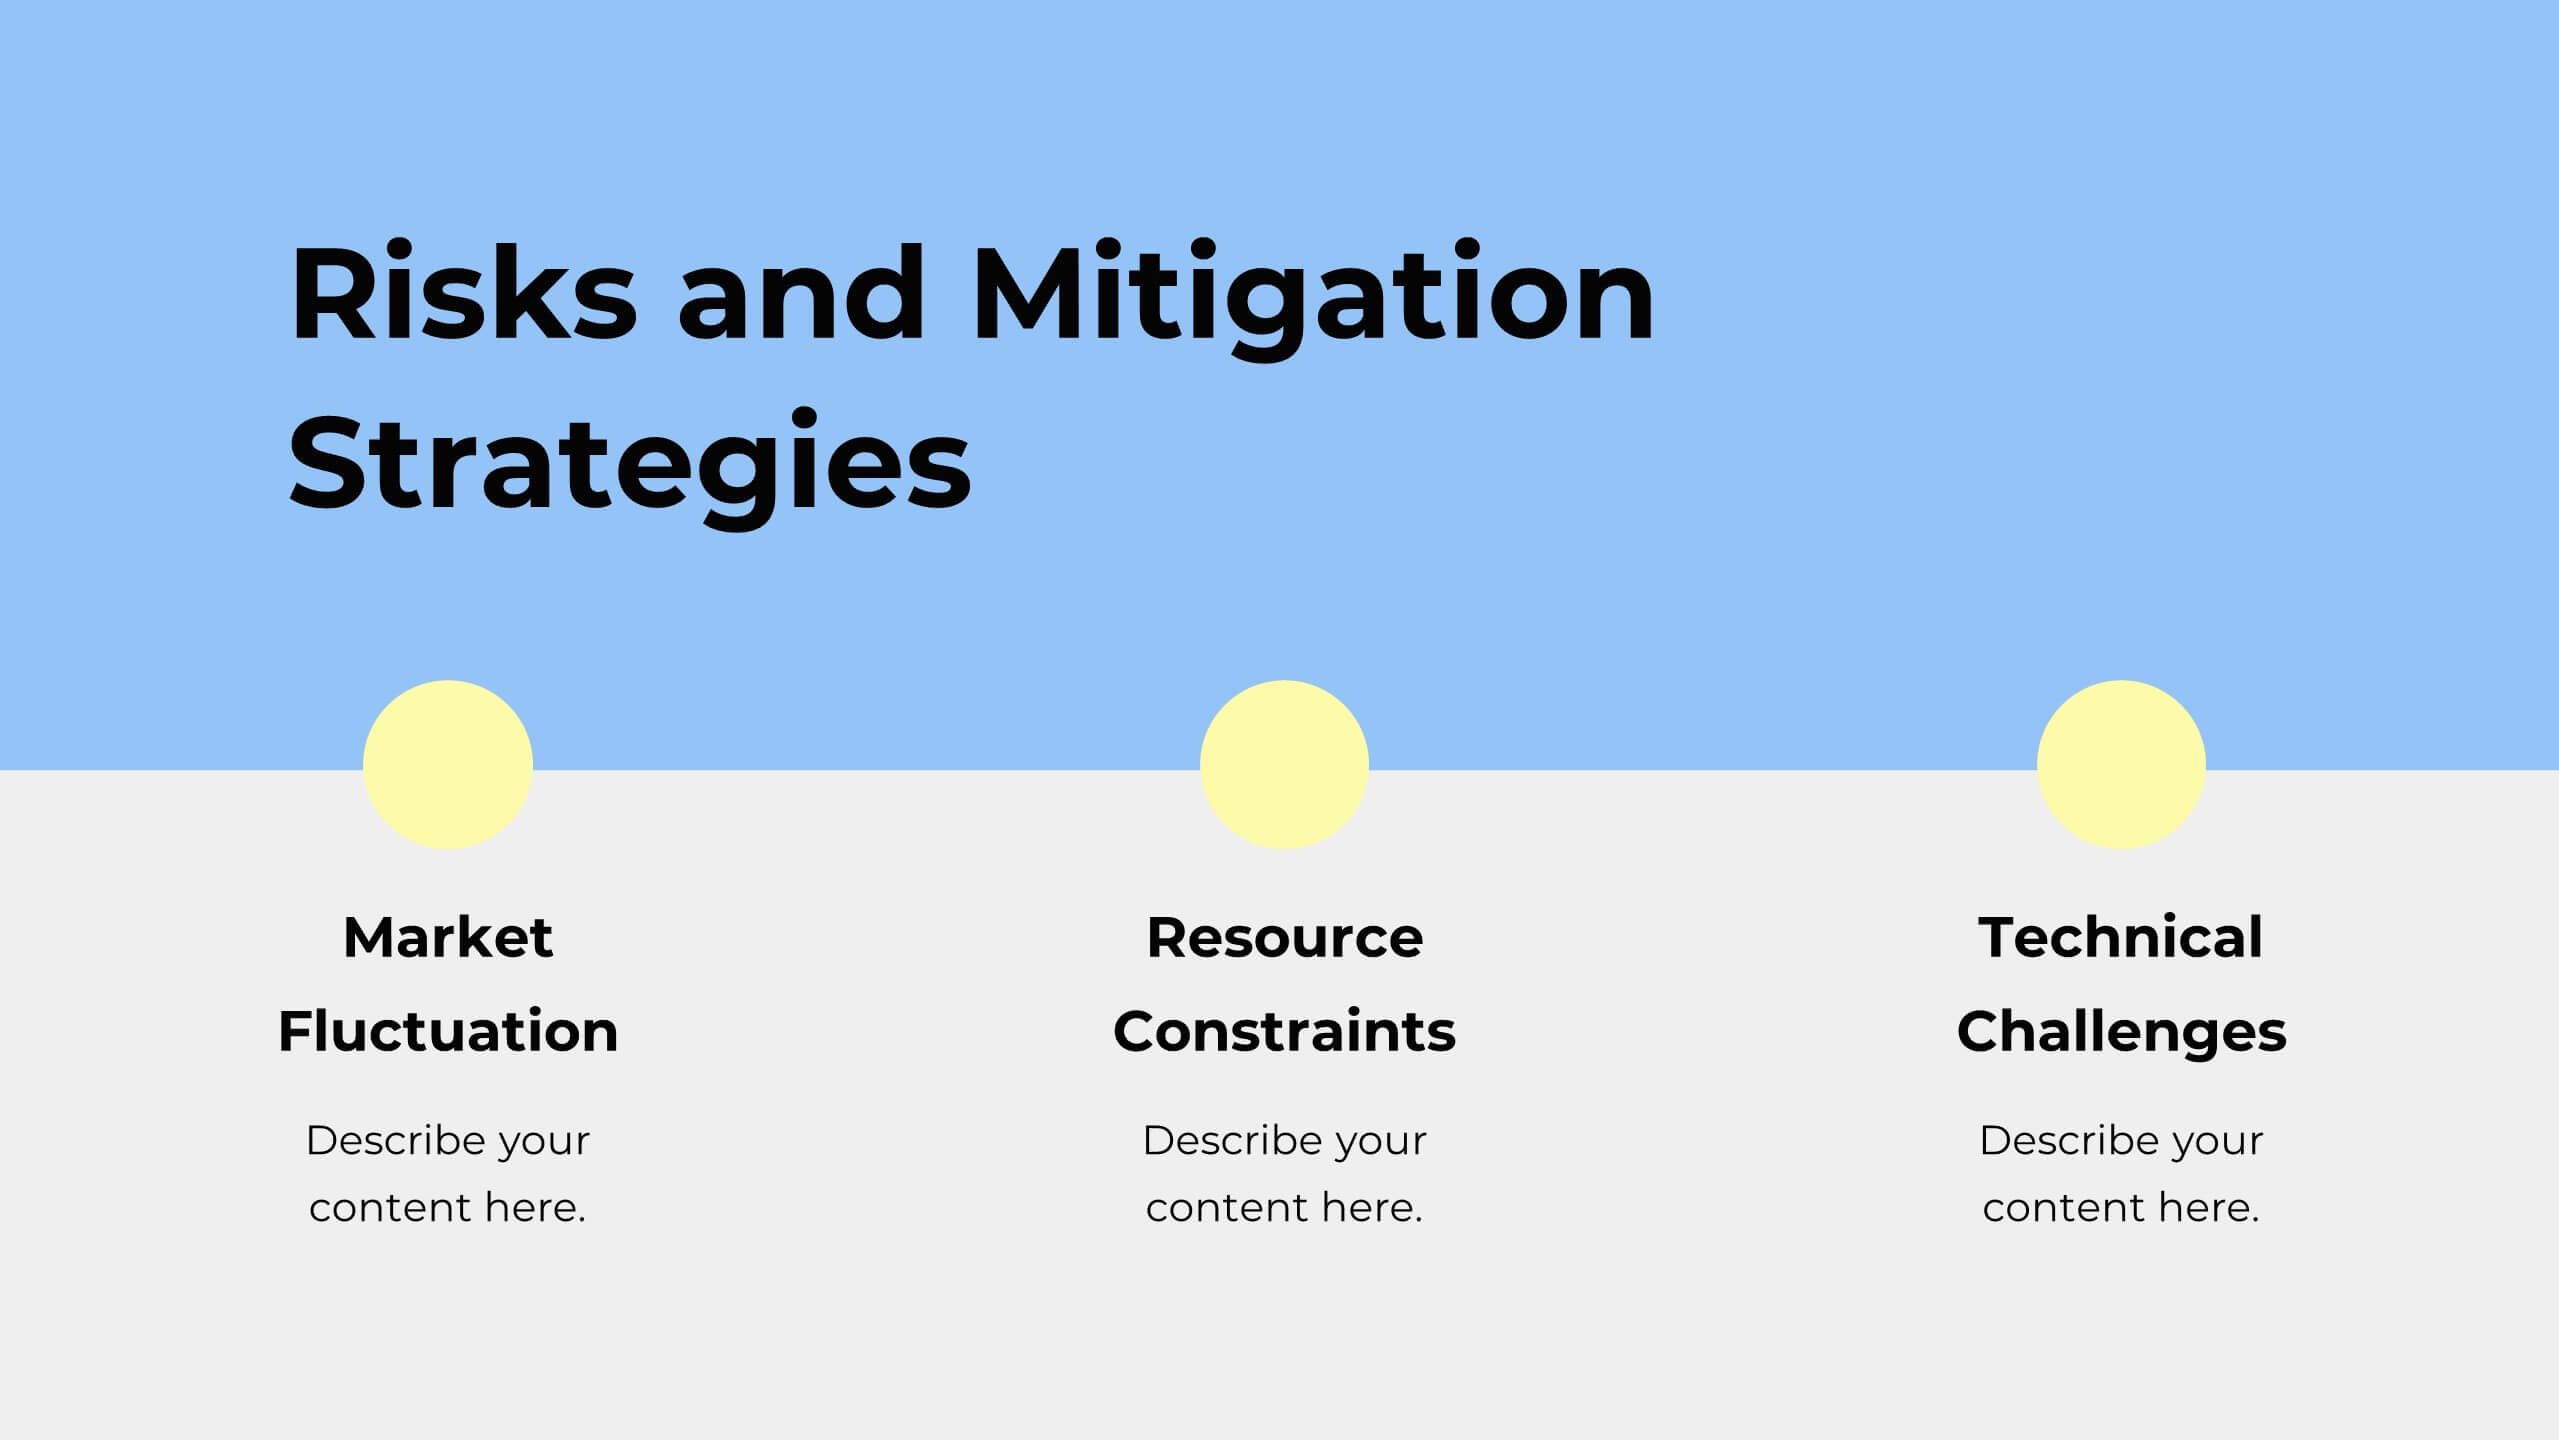
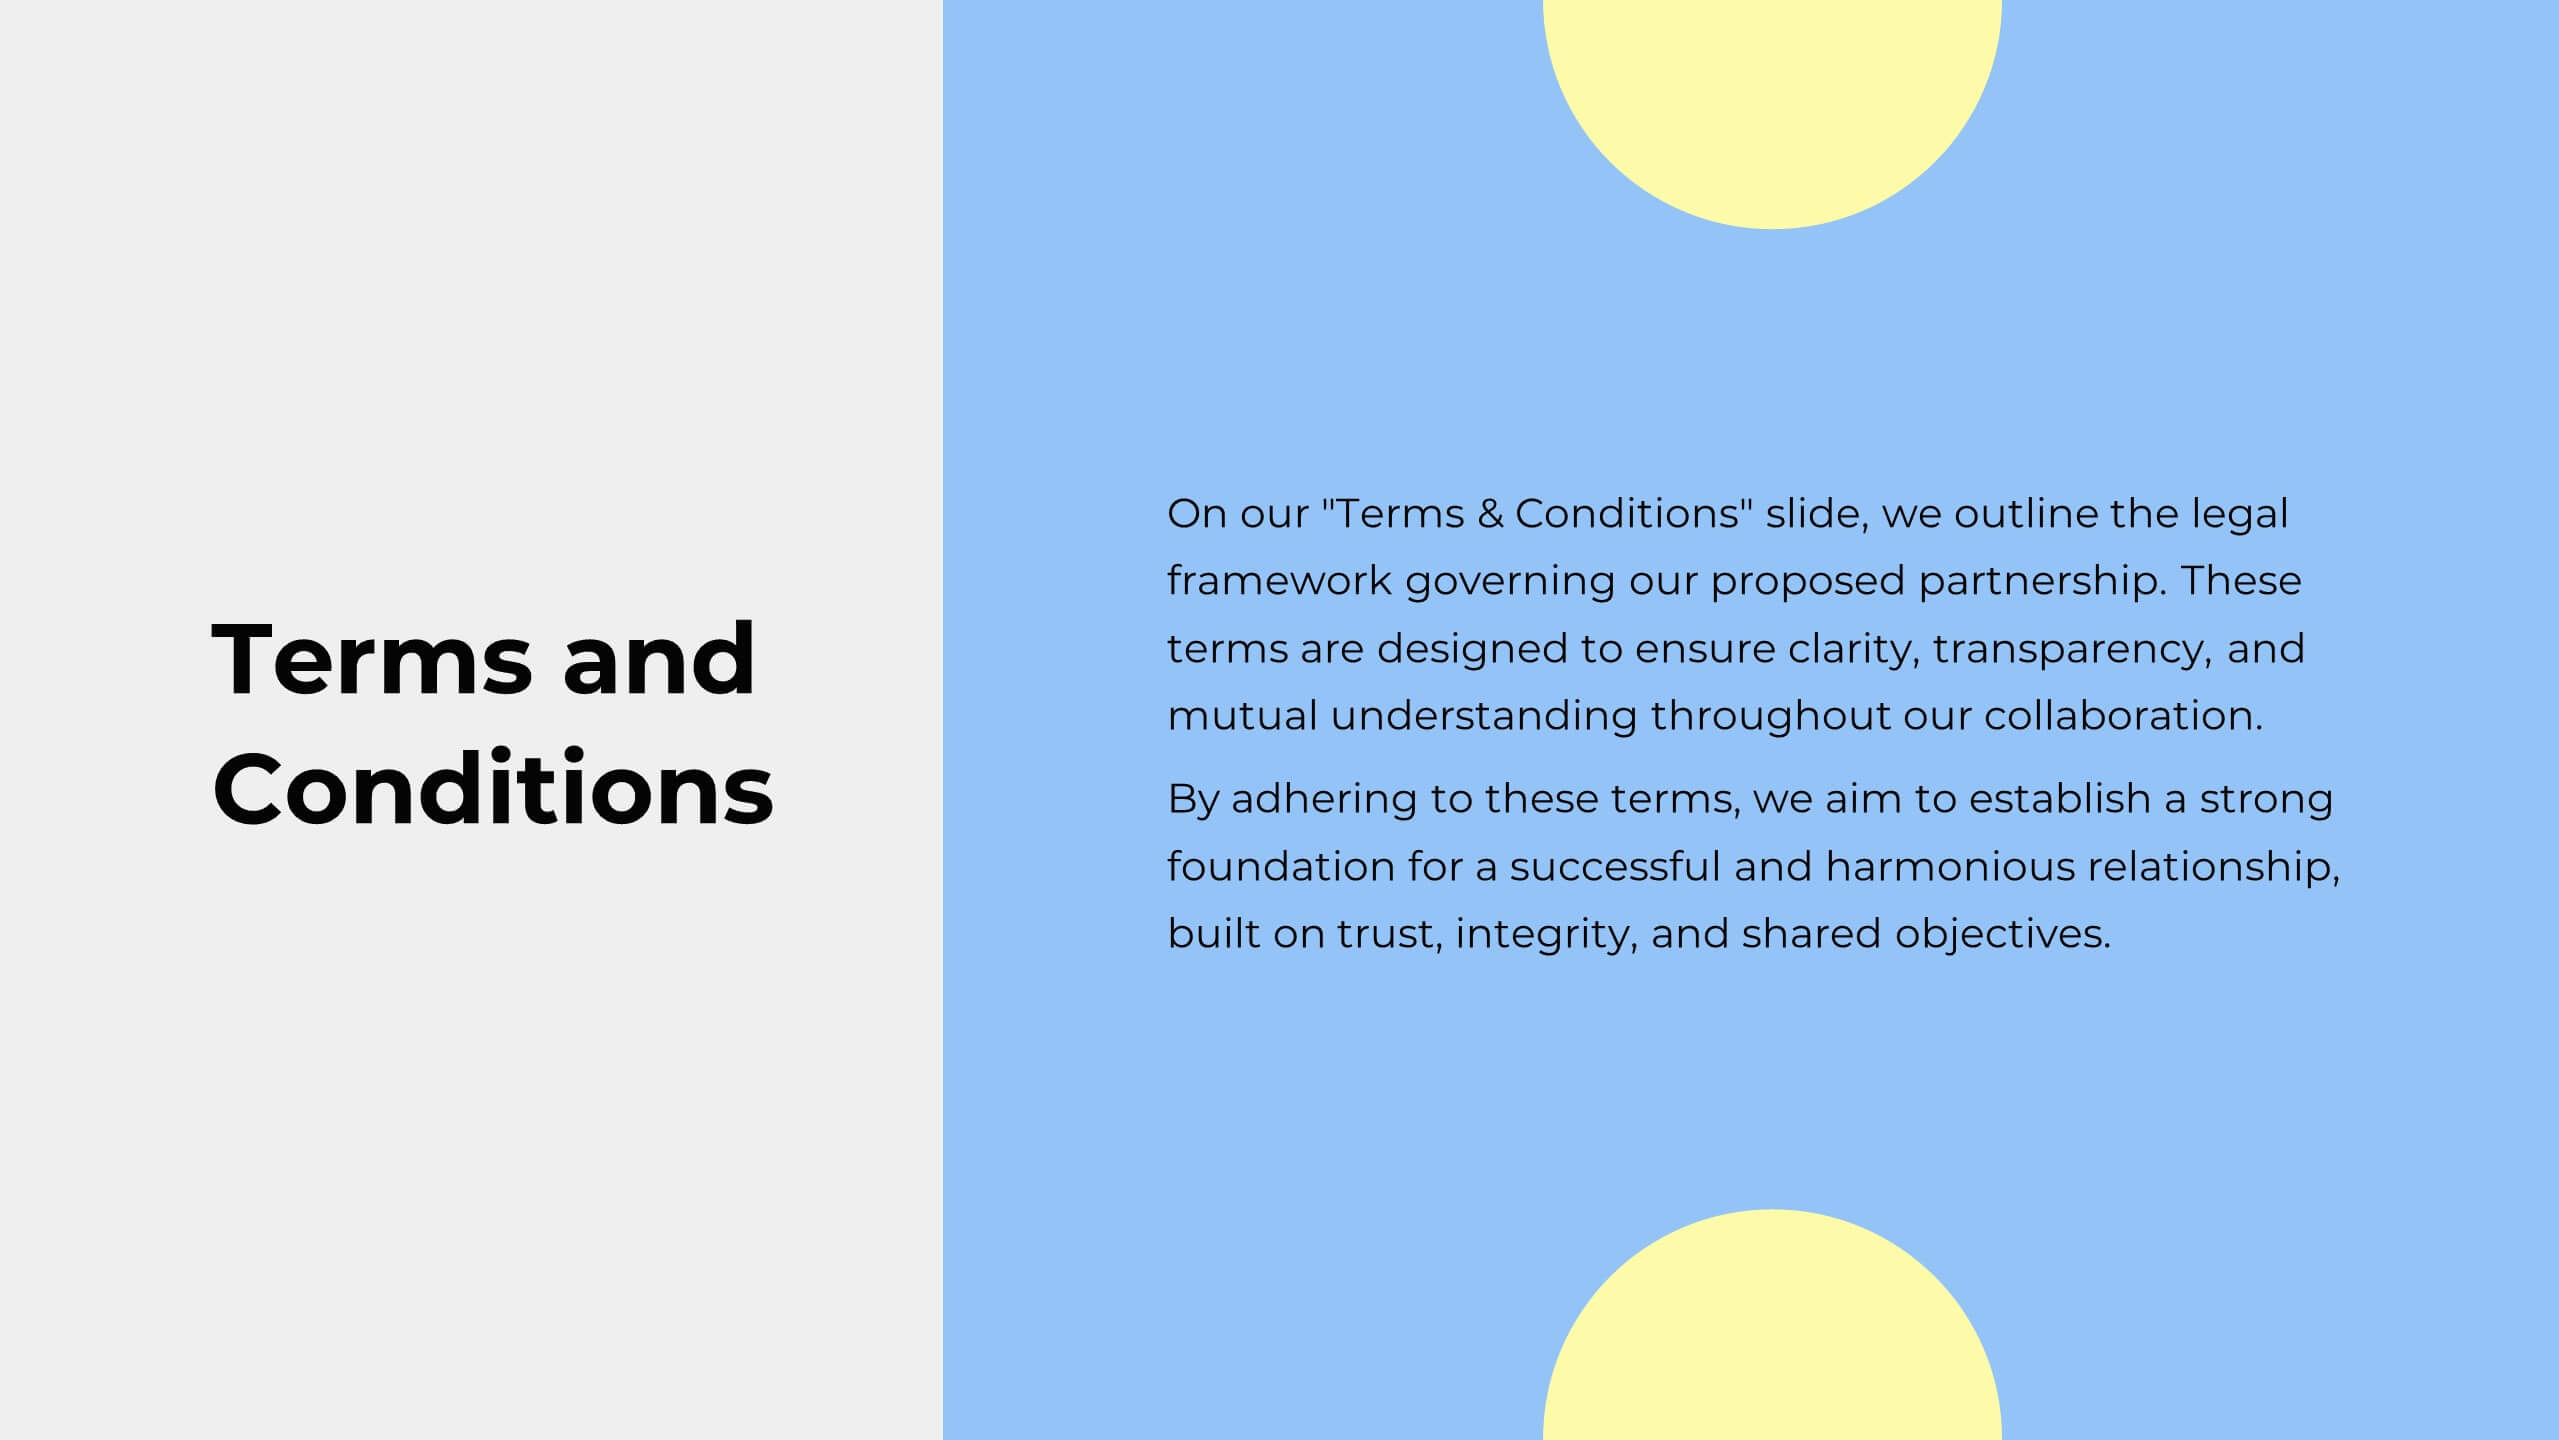
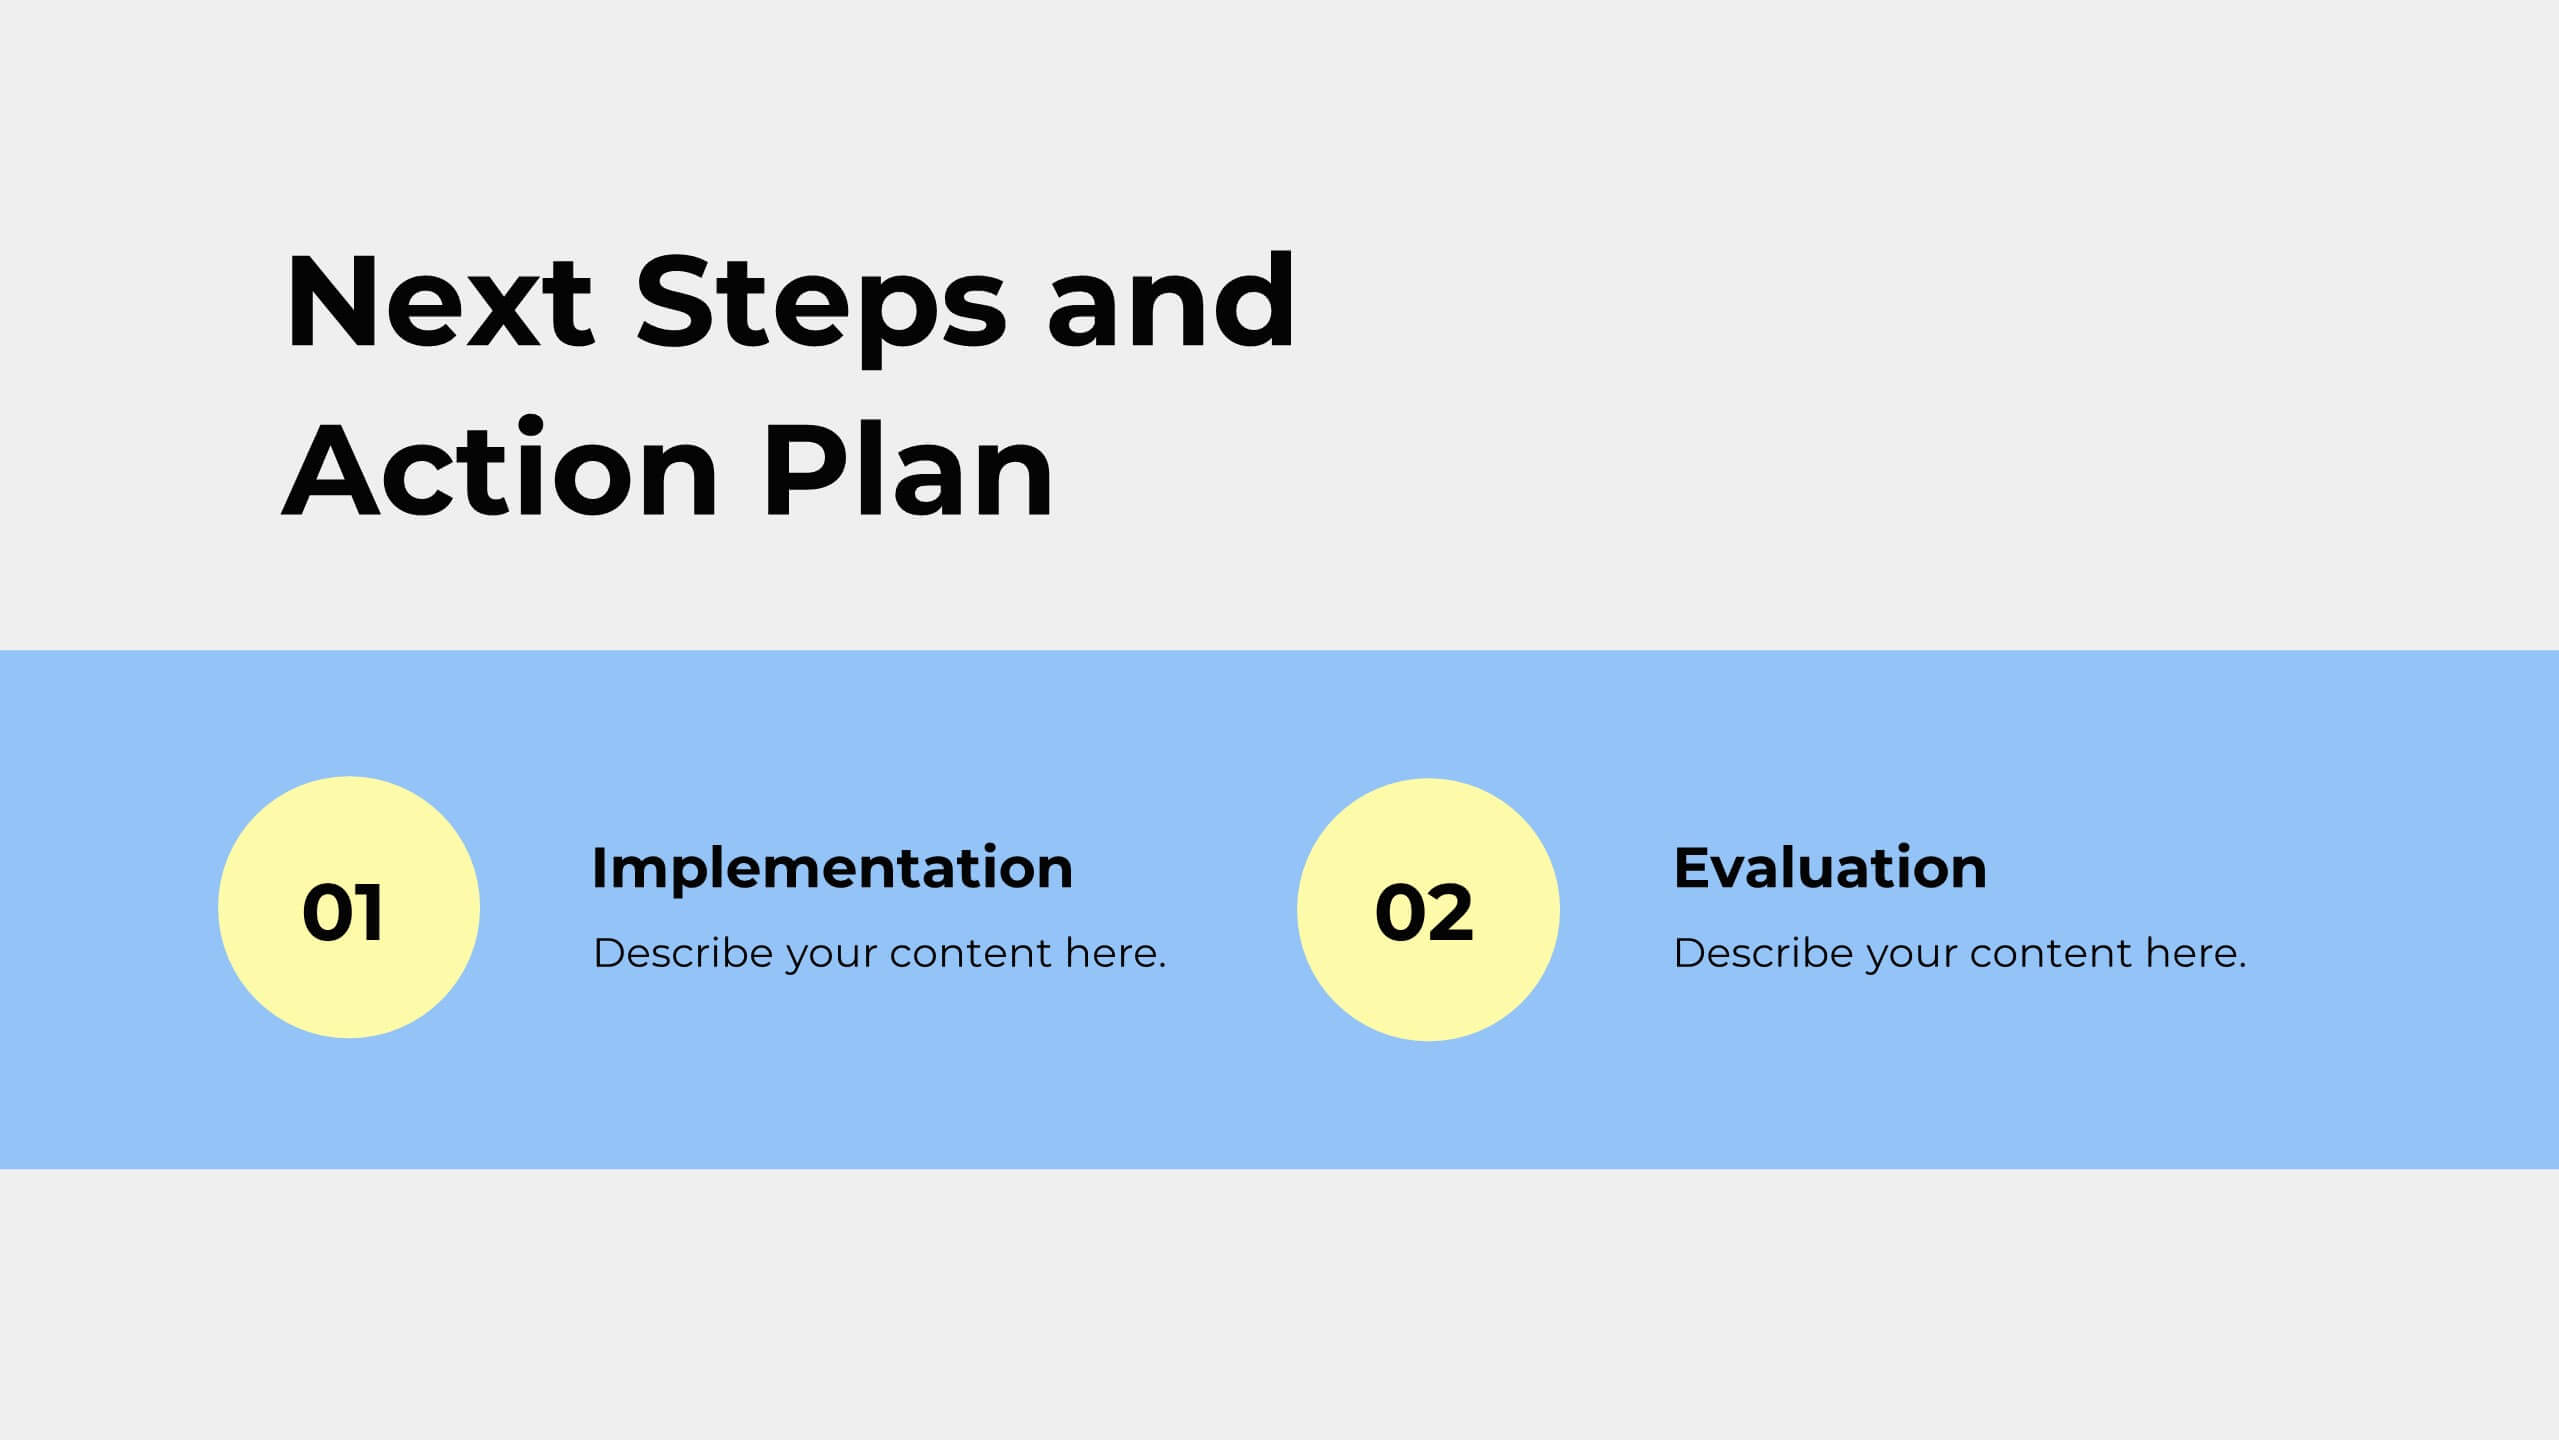
Inspire Business Proposal Presentation
Excite your audience with a compelling business proposal! This template includes sections for objectives, scope of work, timeline, budget, and more. Present your business plan clearly and effectively. Compatible with PowerPoint, Keynote, and Google Slides, it’s designed to impress stakeholders and secure approval for your project. Transform ideas into reality today!


7 diapositivas
Modern Artificial Intelligence Infographic
Modern Artificial Intelligence refers to the contemporary state of AI technology, methods, and applications that have evolved significantly in recent years, especially from the early 21st century onwards. This infographic template is designed to present complex information in a clear and engaging manner. This template uses visuals like charts, graphs, icons, and text to enhance understanding. The objective of this infographic is to provide a visual and informative snapshot of the contemporary landscape of artificial intelligence, making complex concepts accessible to a broad audience.


8 diapositivas
Winning Strategies for Professional Success Presentation
Showcase your top performers, strategic milestones, or ranked insights with this podium-style template. Featuring vibrant visuals and structured layout, it’s ideal for performance reviews, leadership presentations, and competitive analysis. Fully editable in PowerPoint, Keynote, and Google Slides—perfect for professional success stories, rankings, and progress highlights.


3 diapositivas
Visual Breakdown with Tree Diagram Format Presentation
Illustrate growth stages, concepts, or layered development with the Visual Breakdown with Tree Diagram Format Presentation. This creative design uses three tree icons—seedling, sapling, and mature tree—to represent progression or hierarchy. Ideal for timelines, product evolution, or strategic planning. Fully editable in PowerPoint, Keynote, and Google Slides.