


Características


¿Tienes alguna pregunta?
Recomendar
22 diapositivas
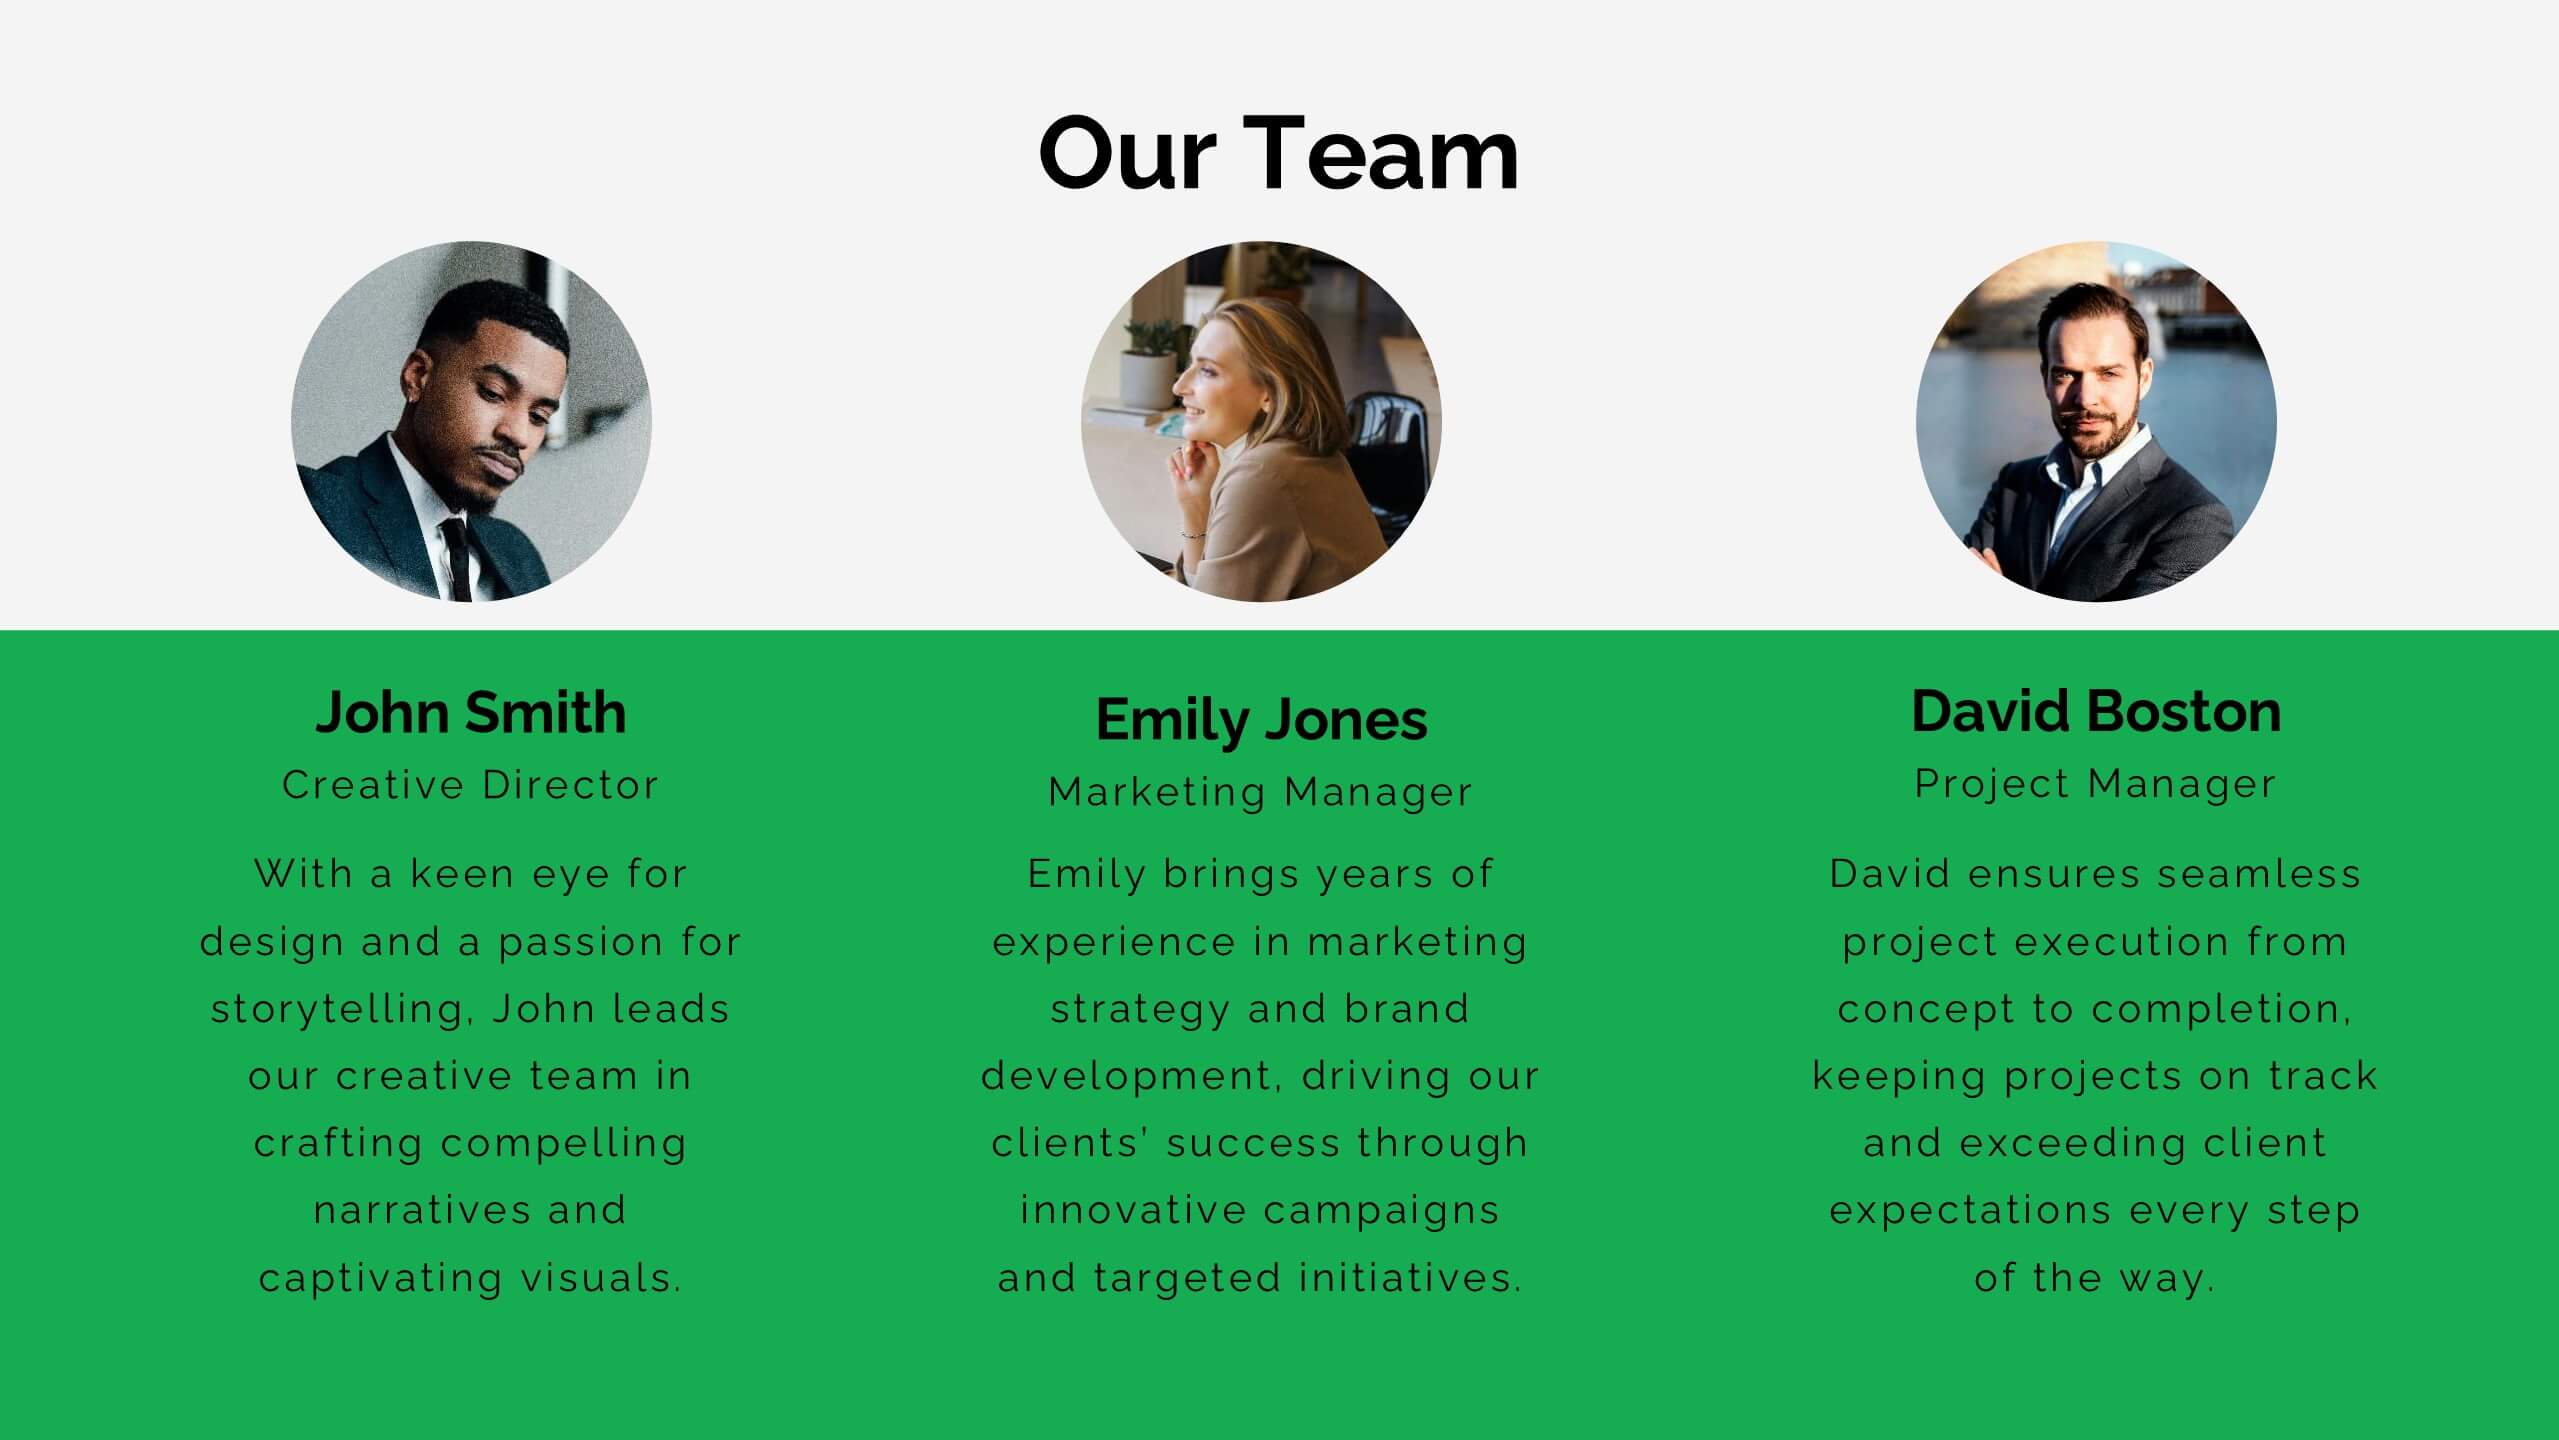
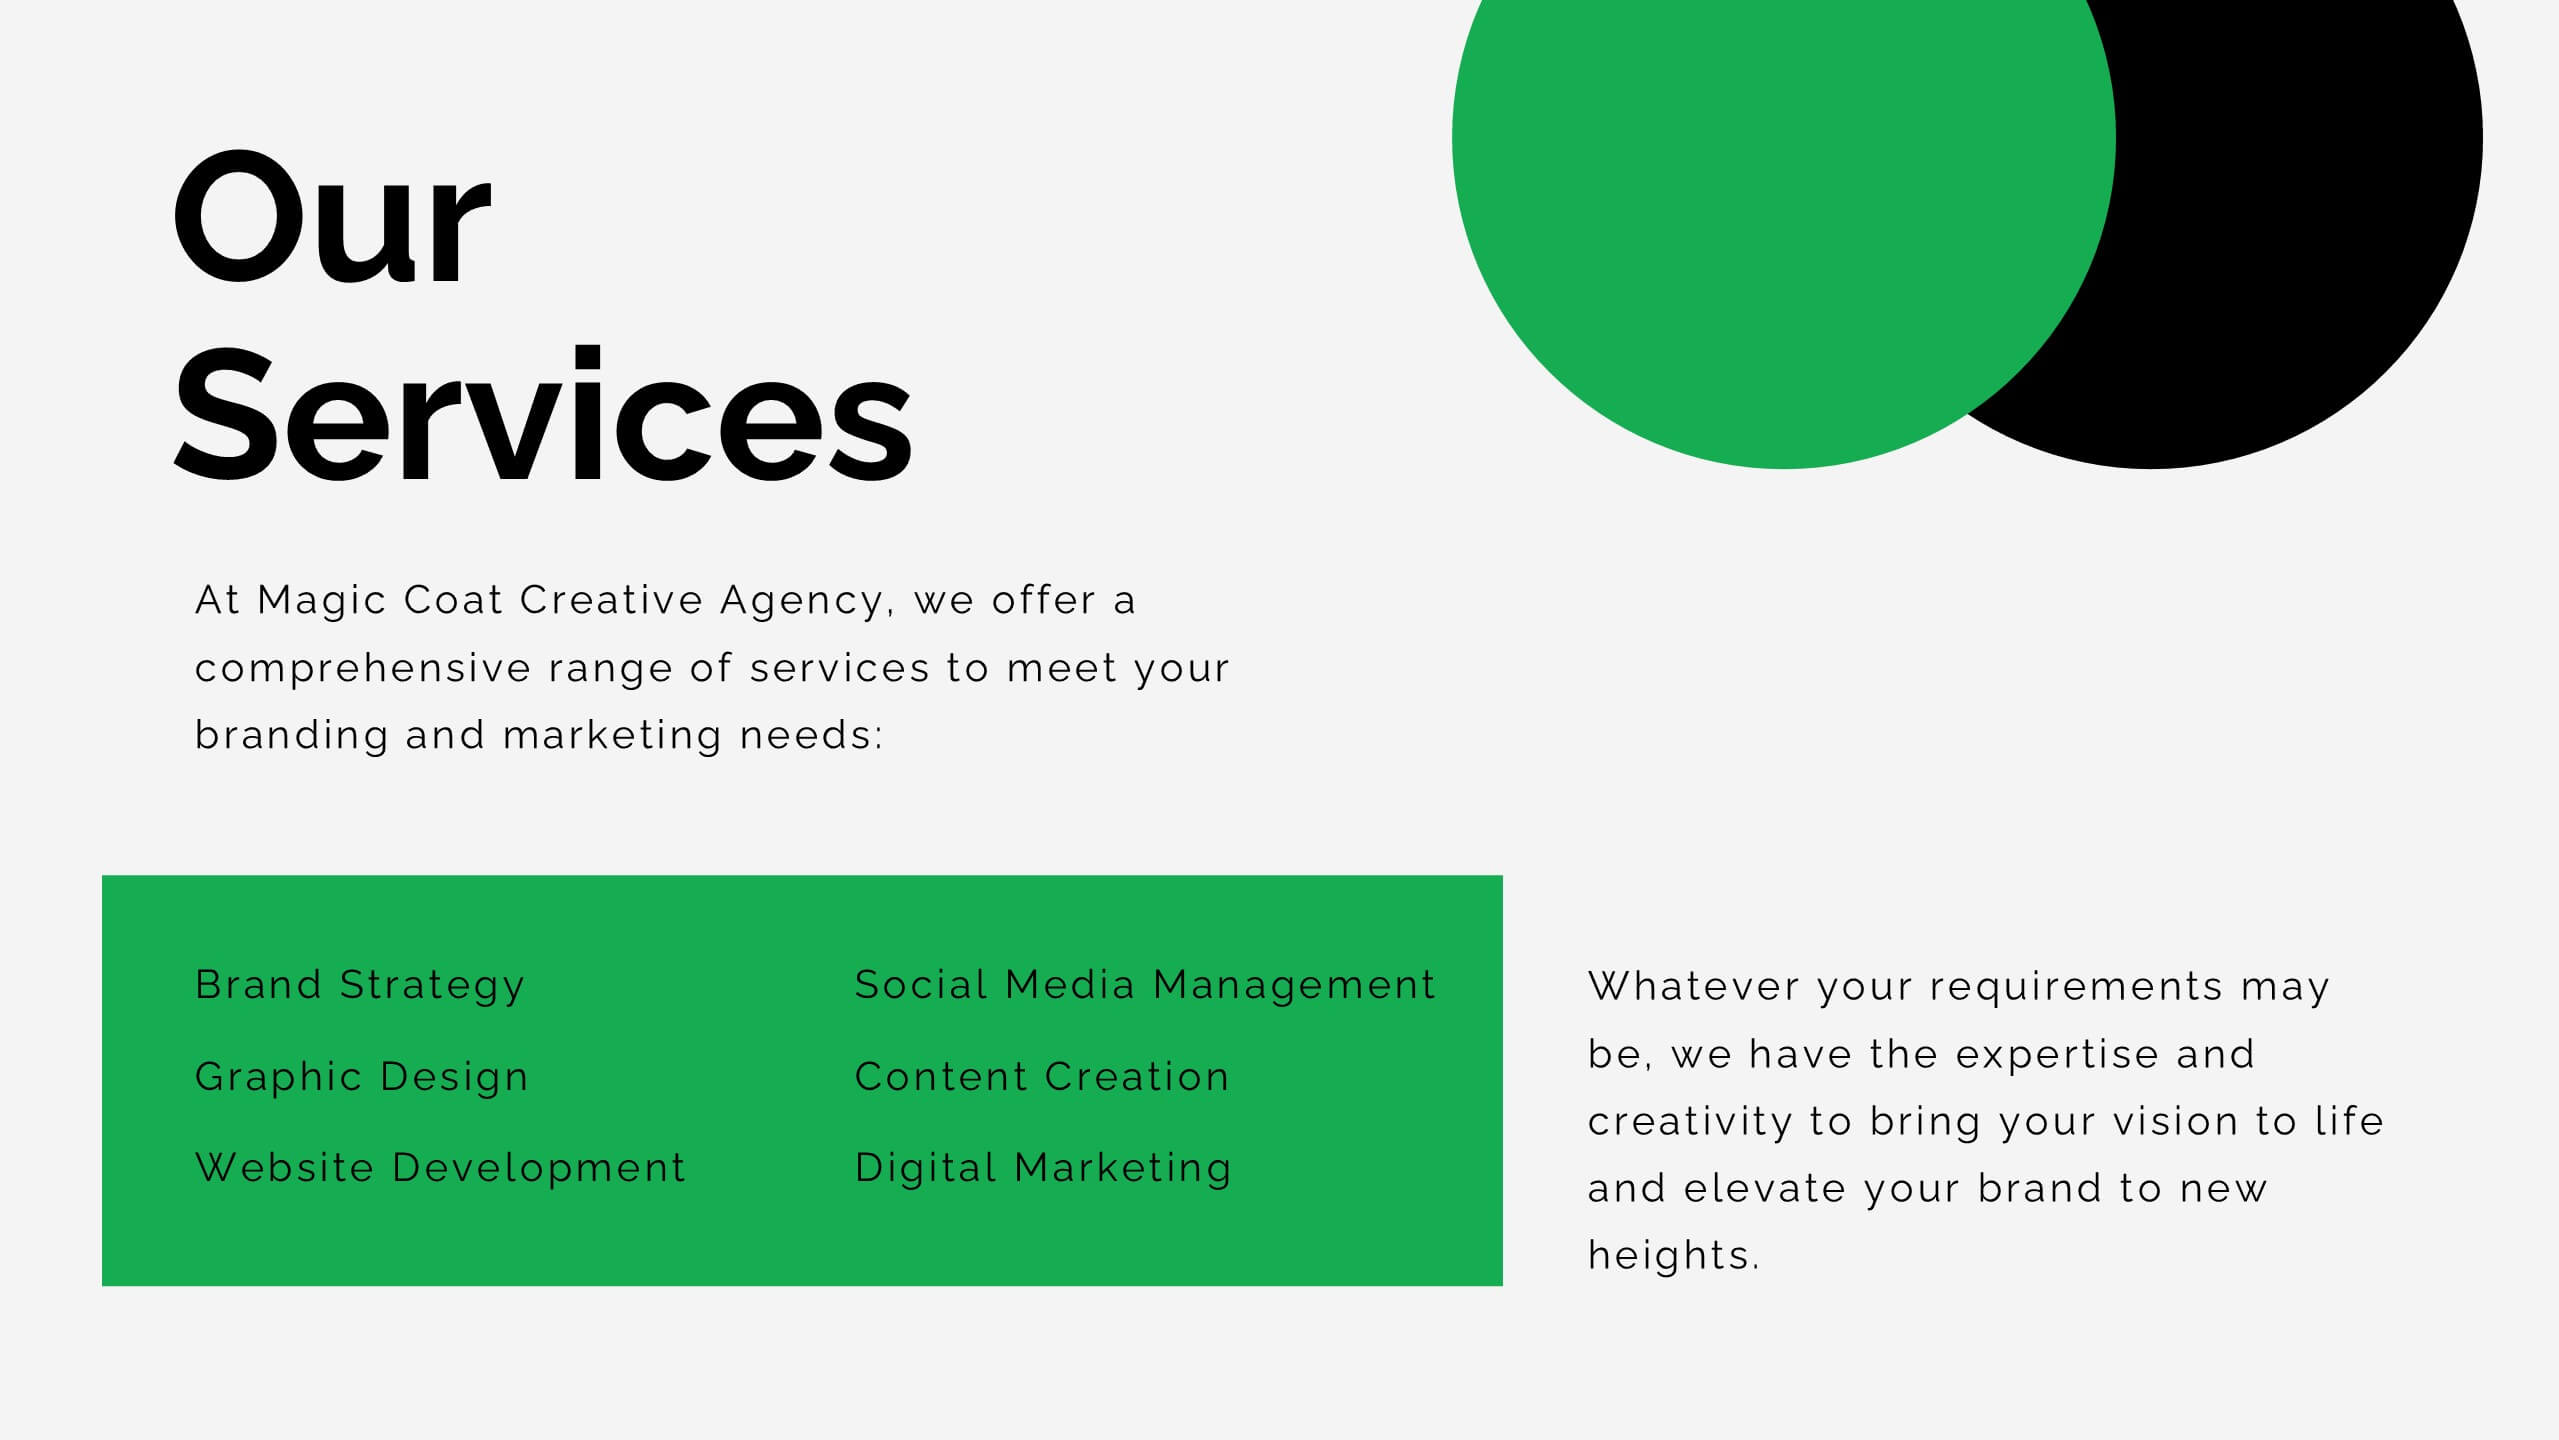
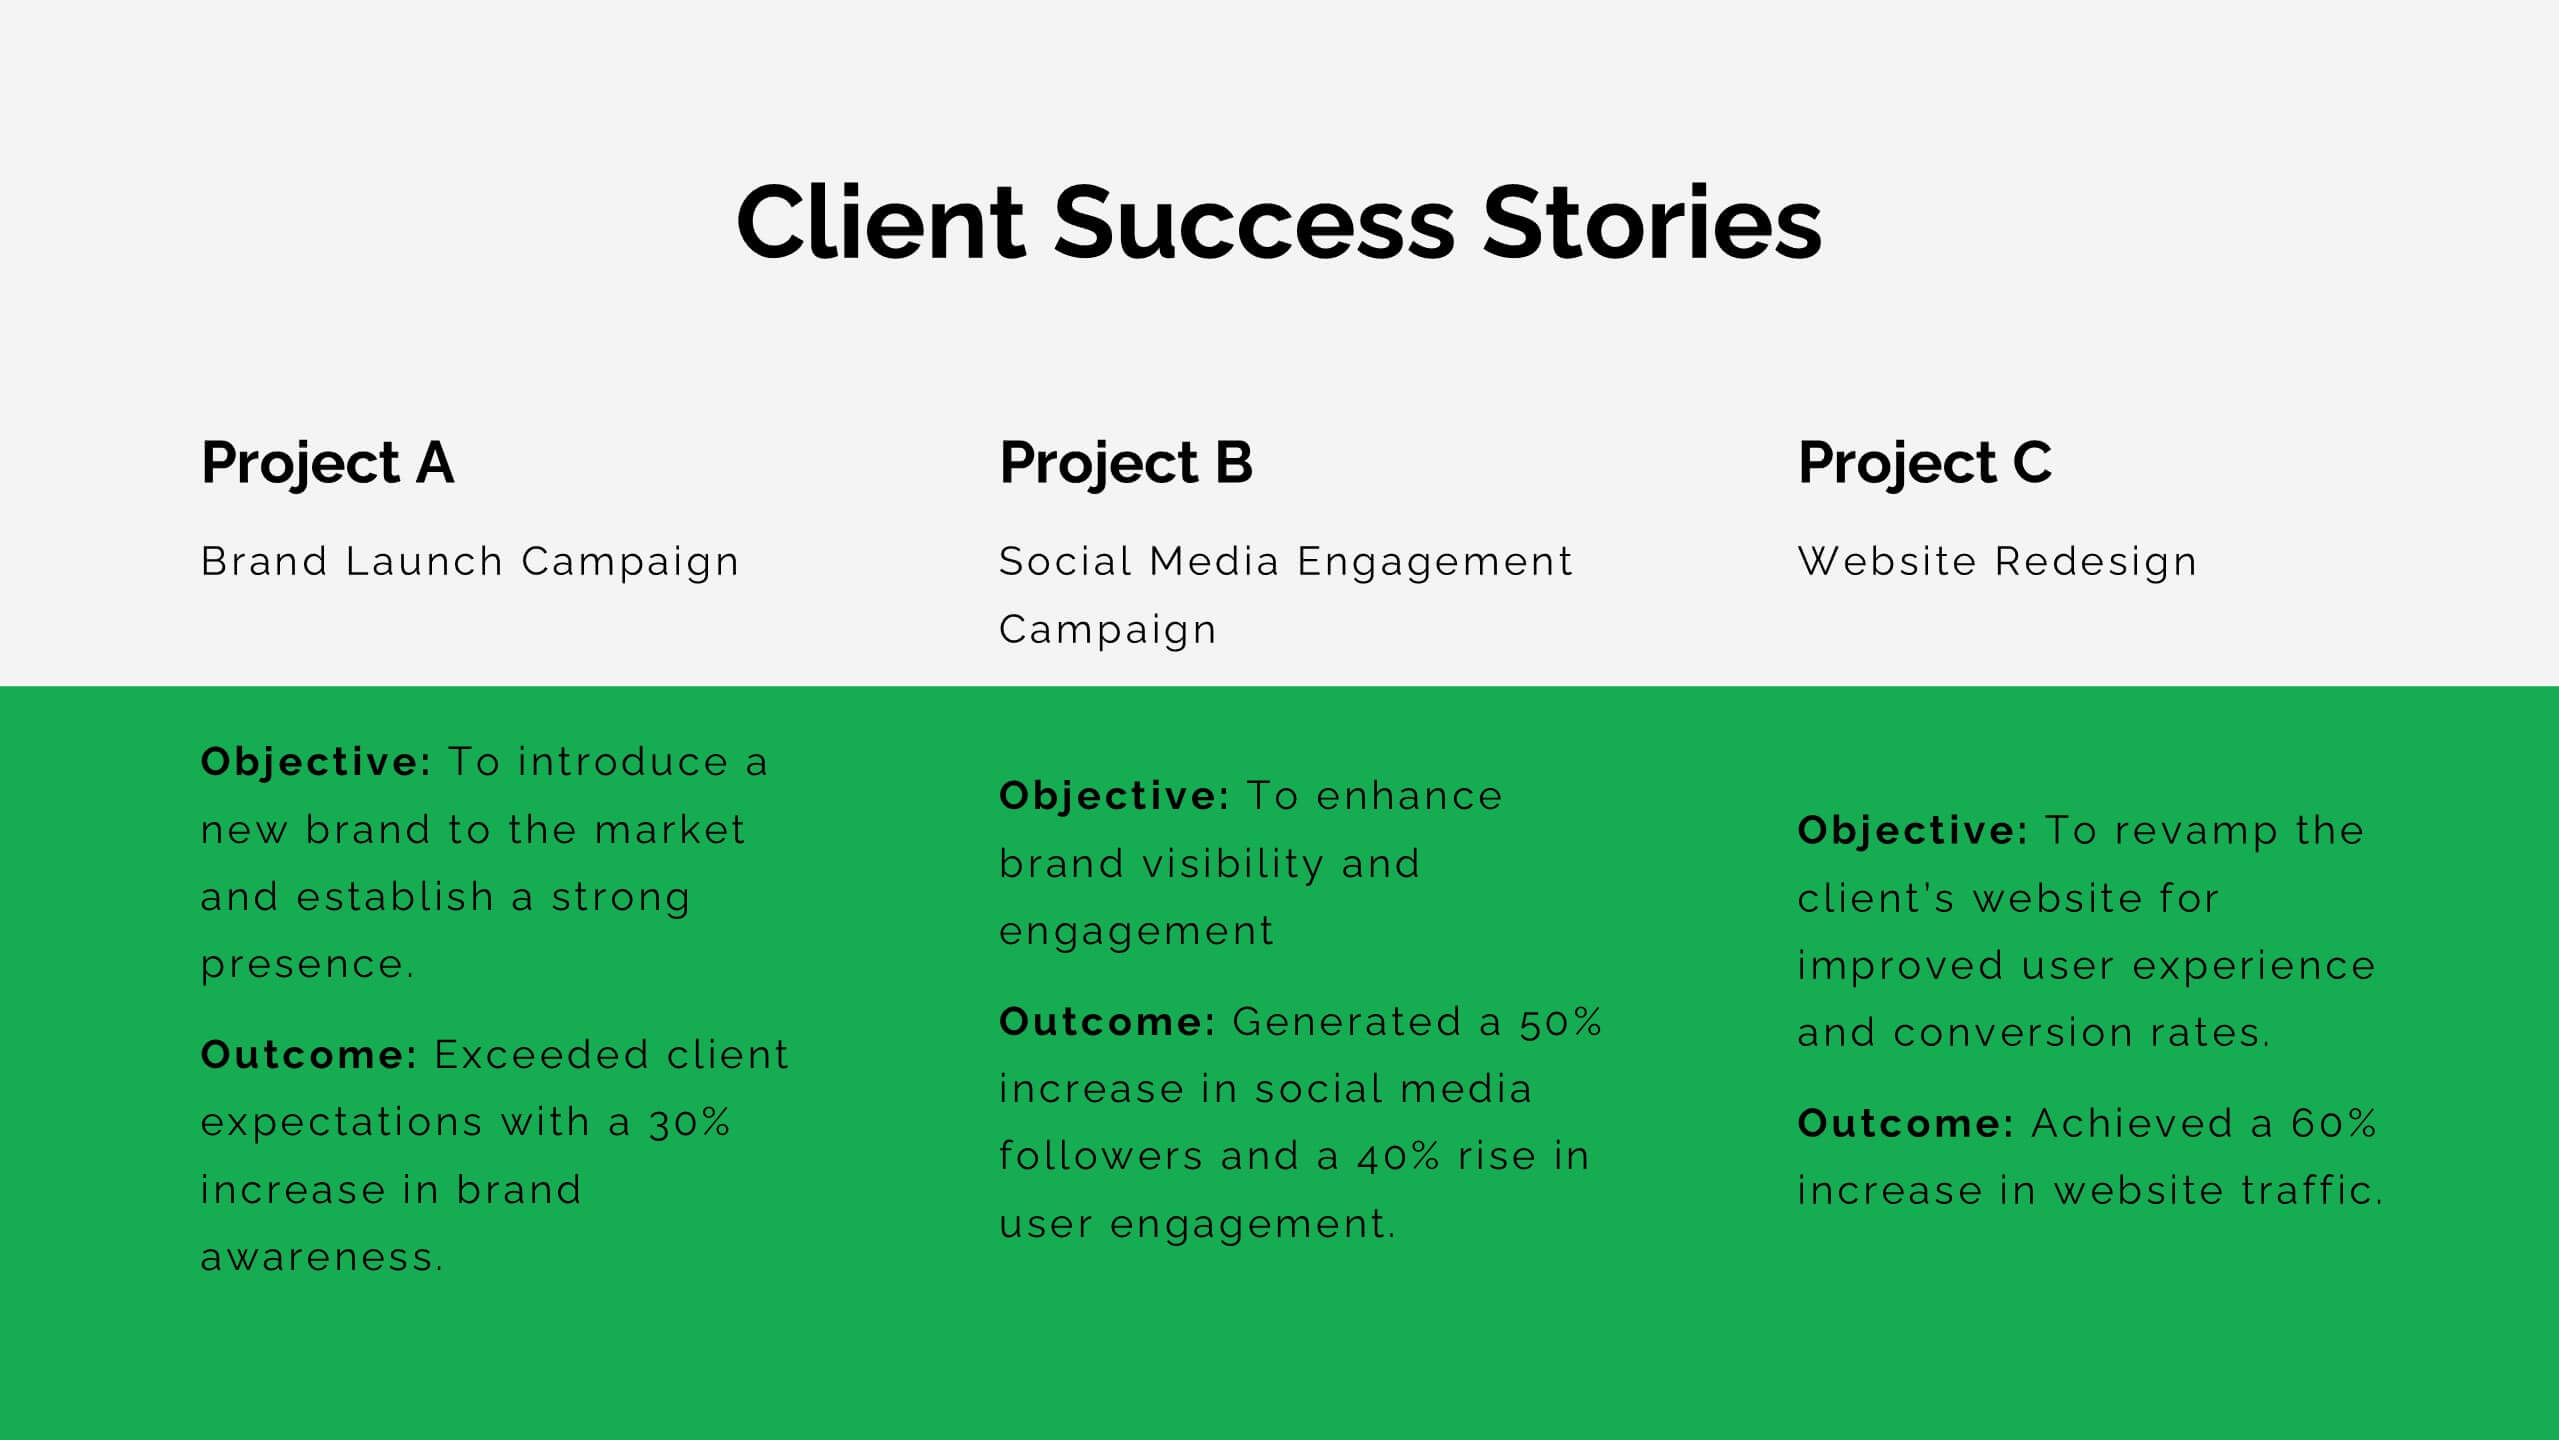
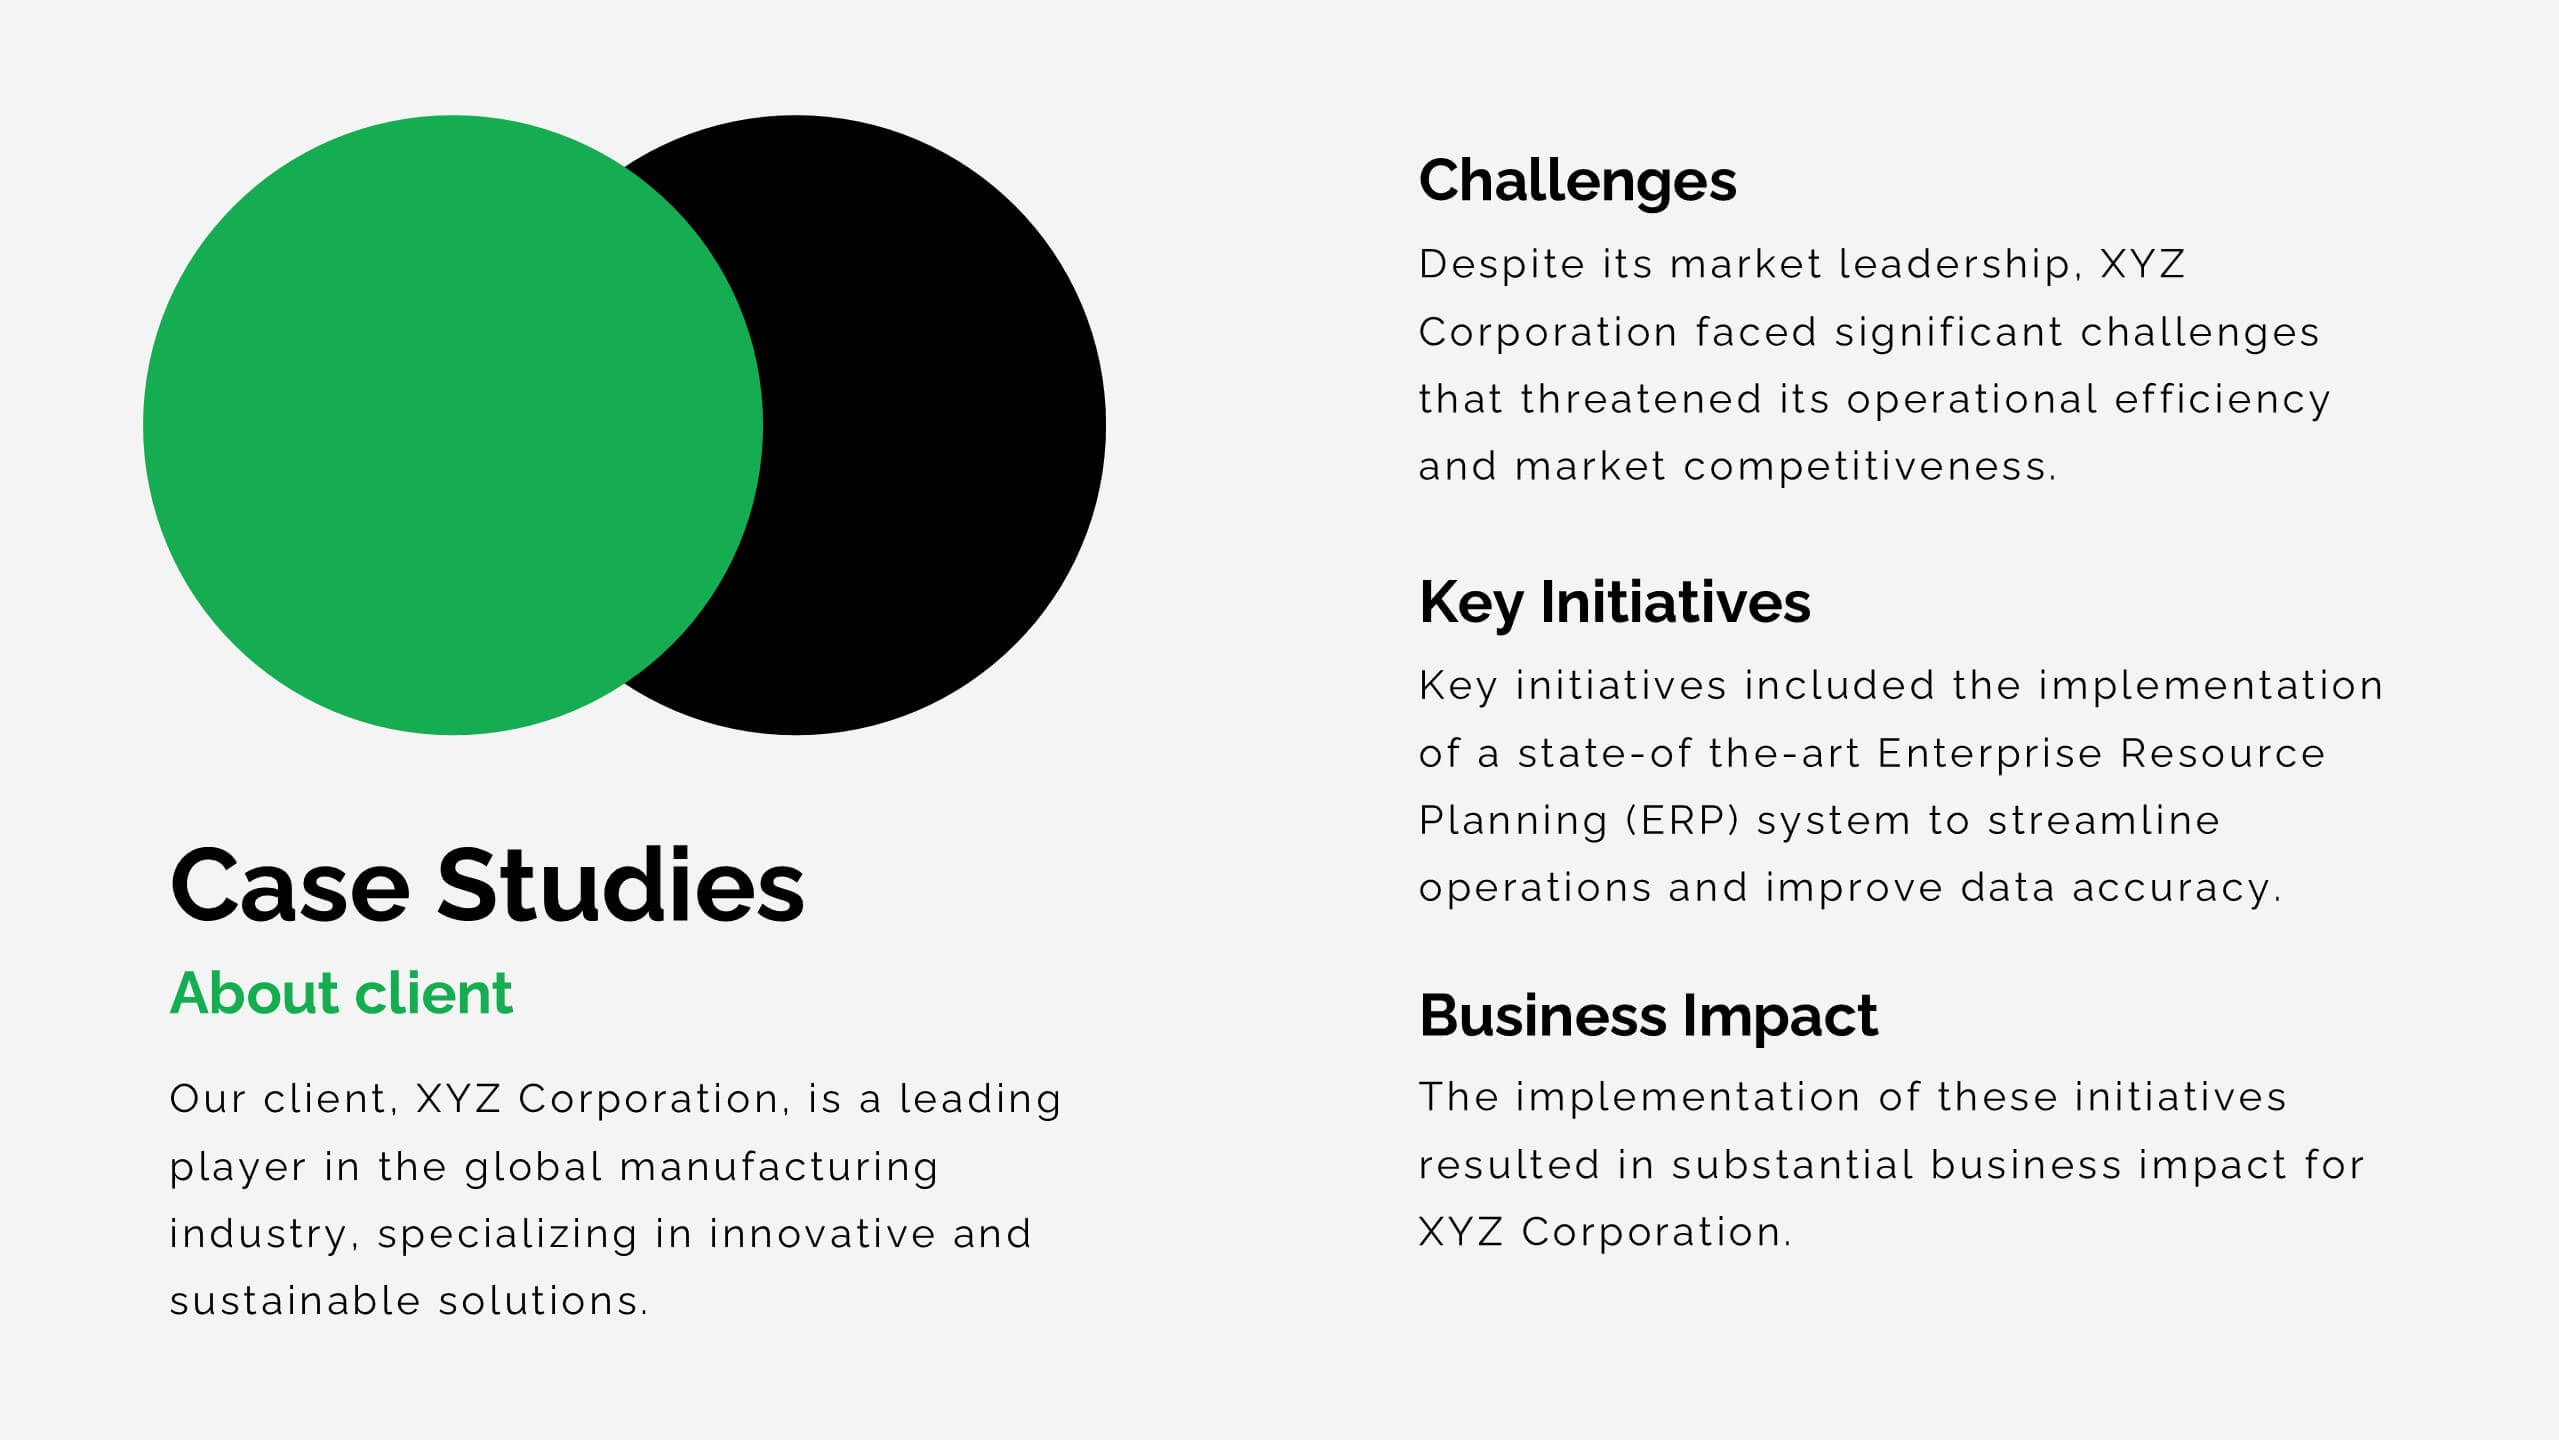
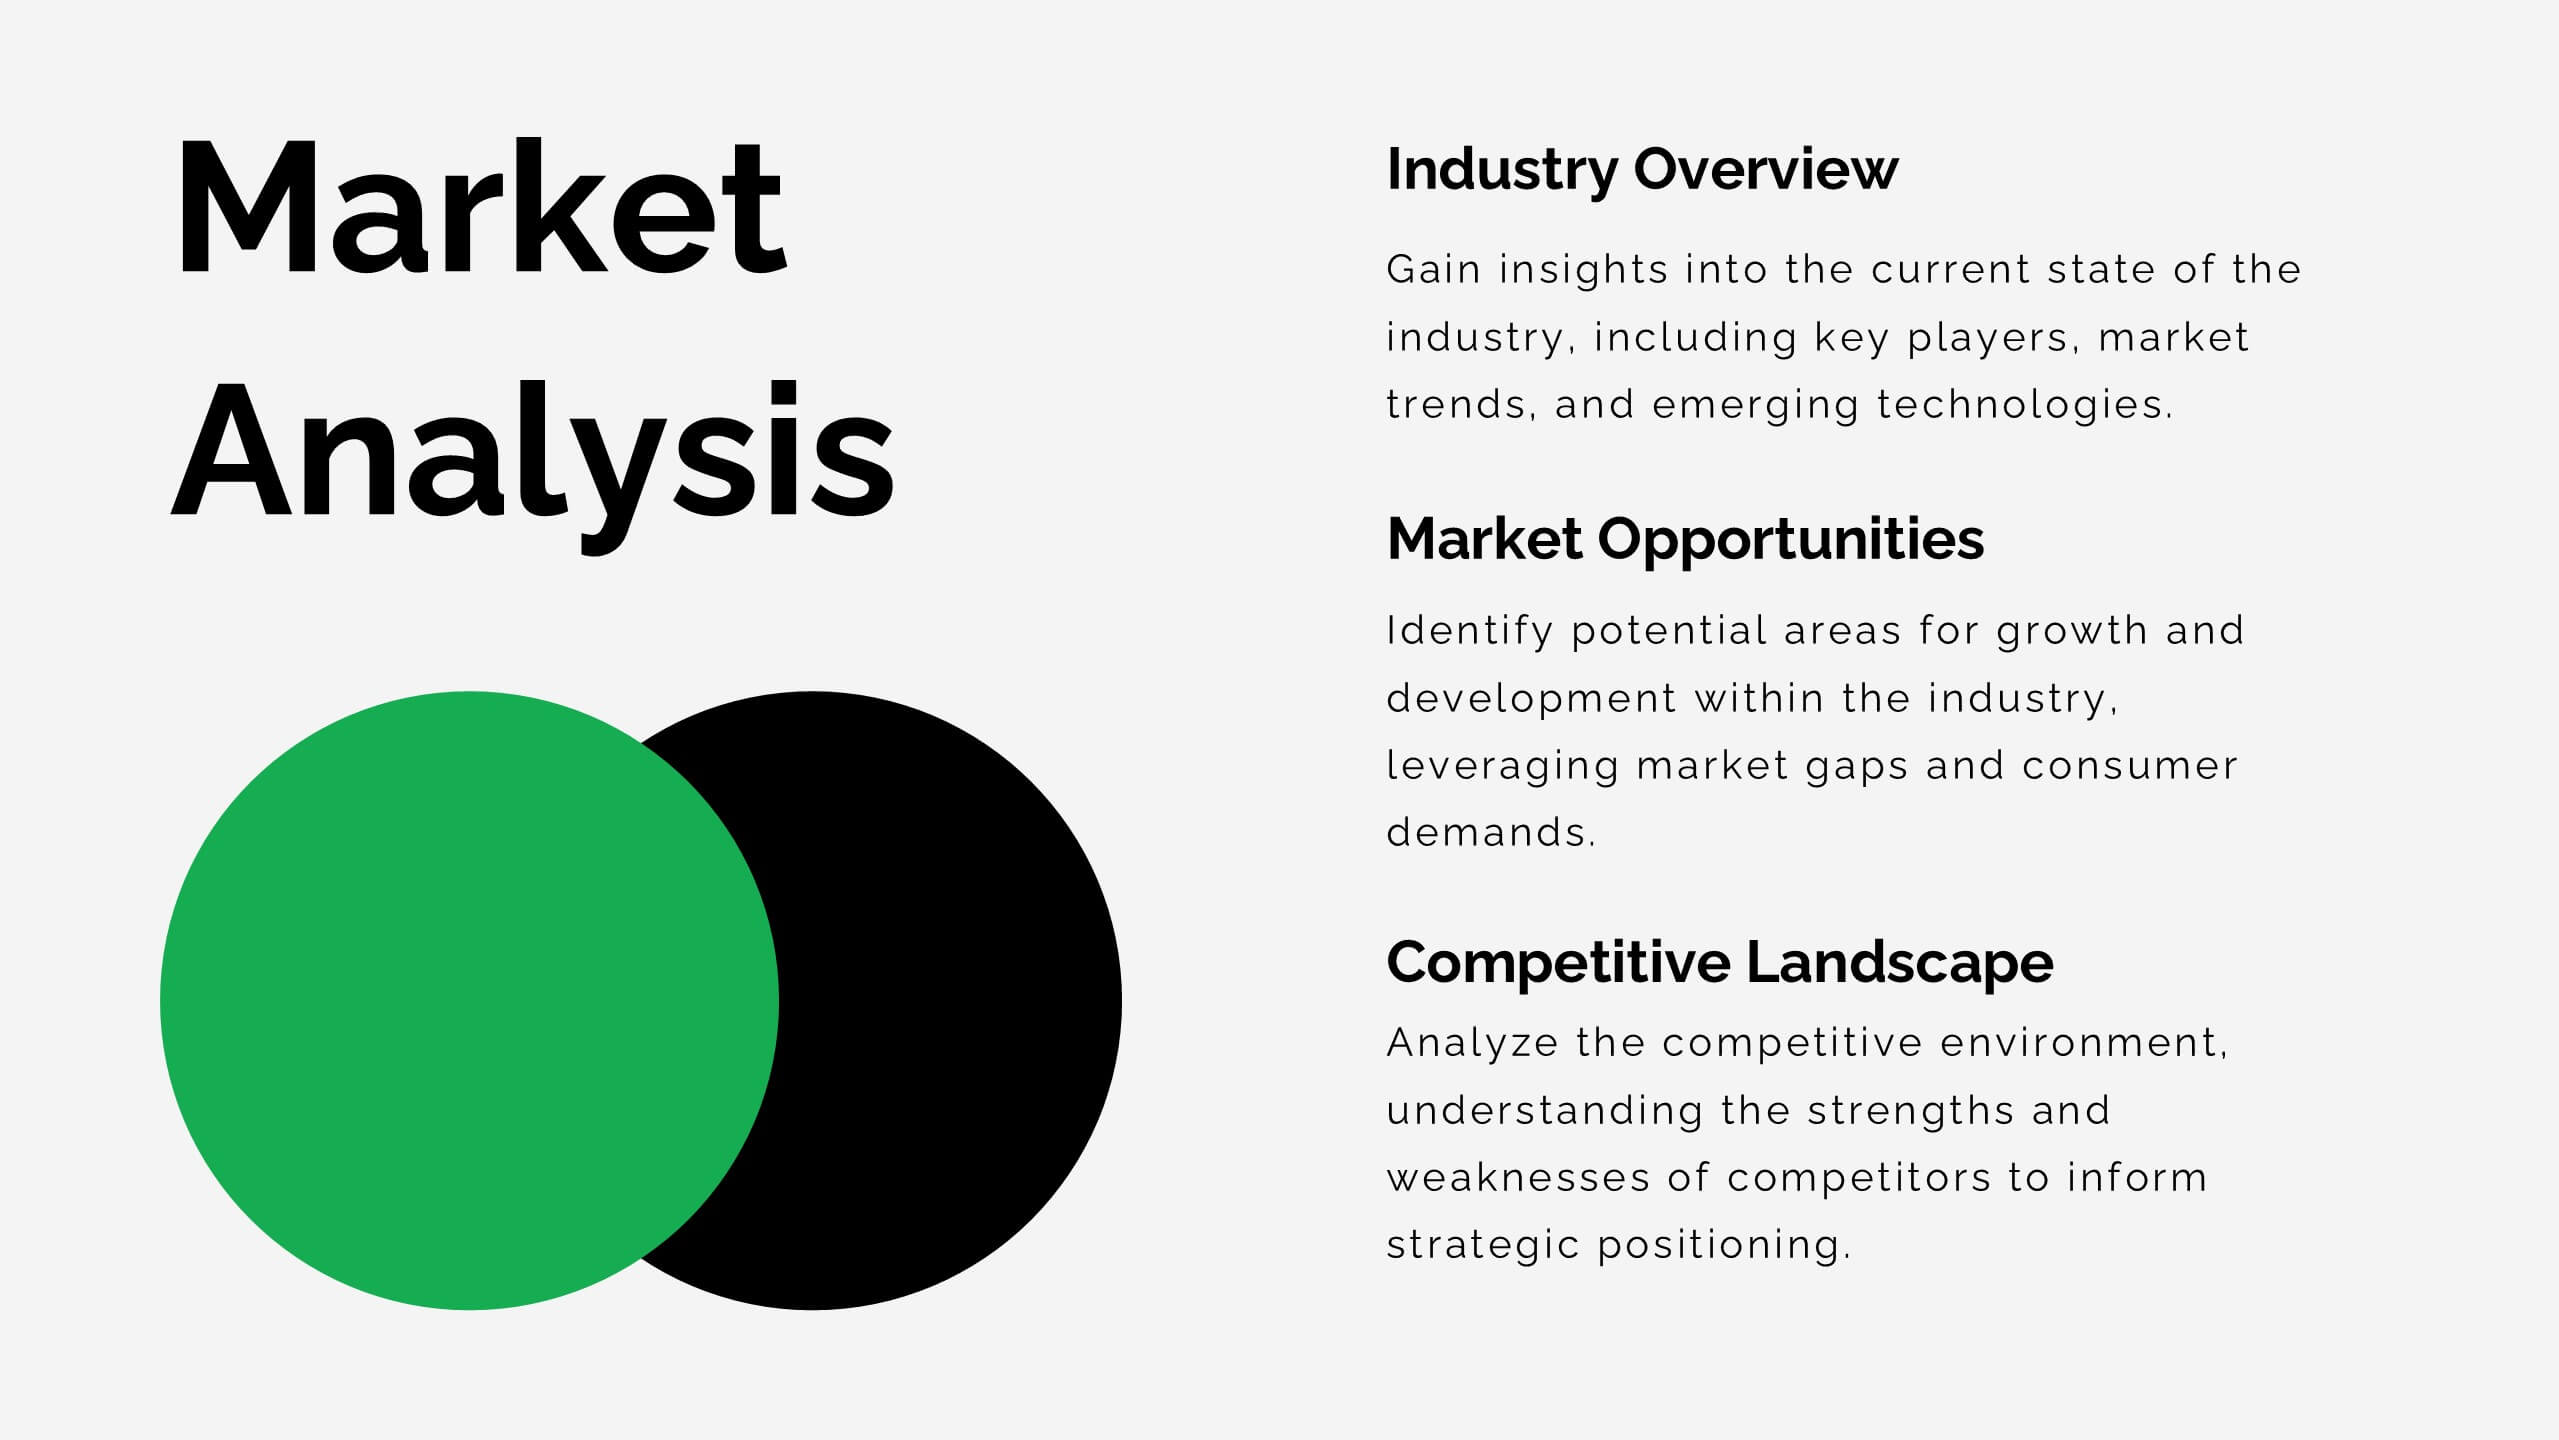
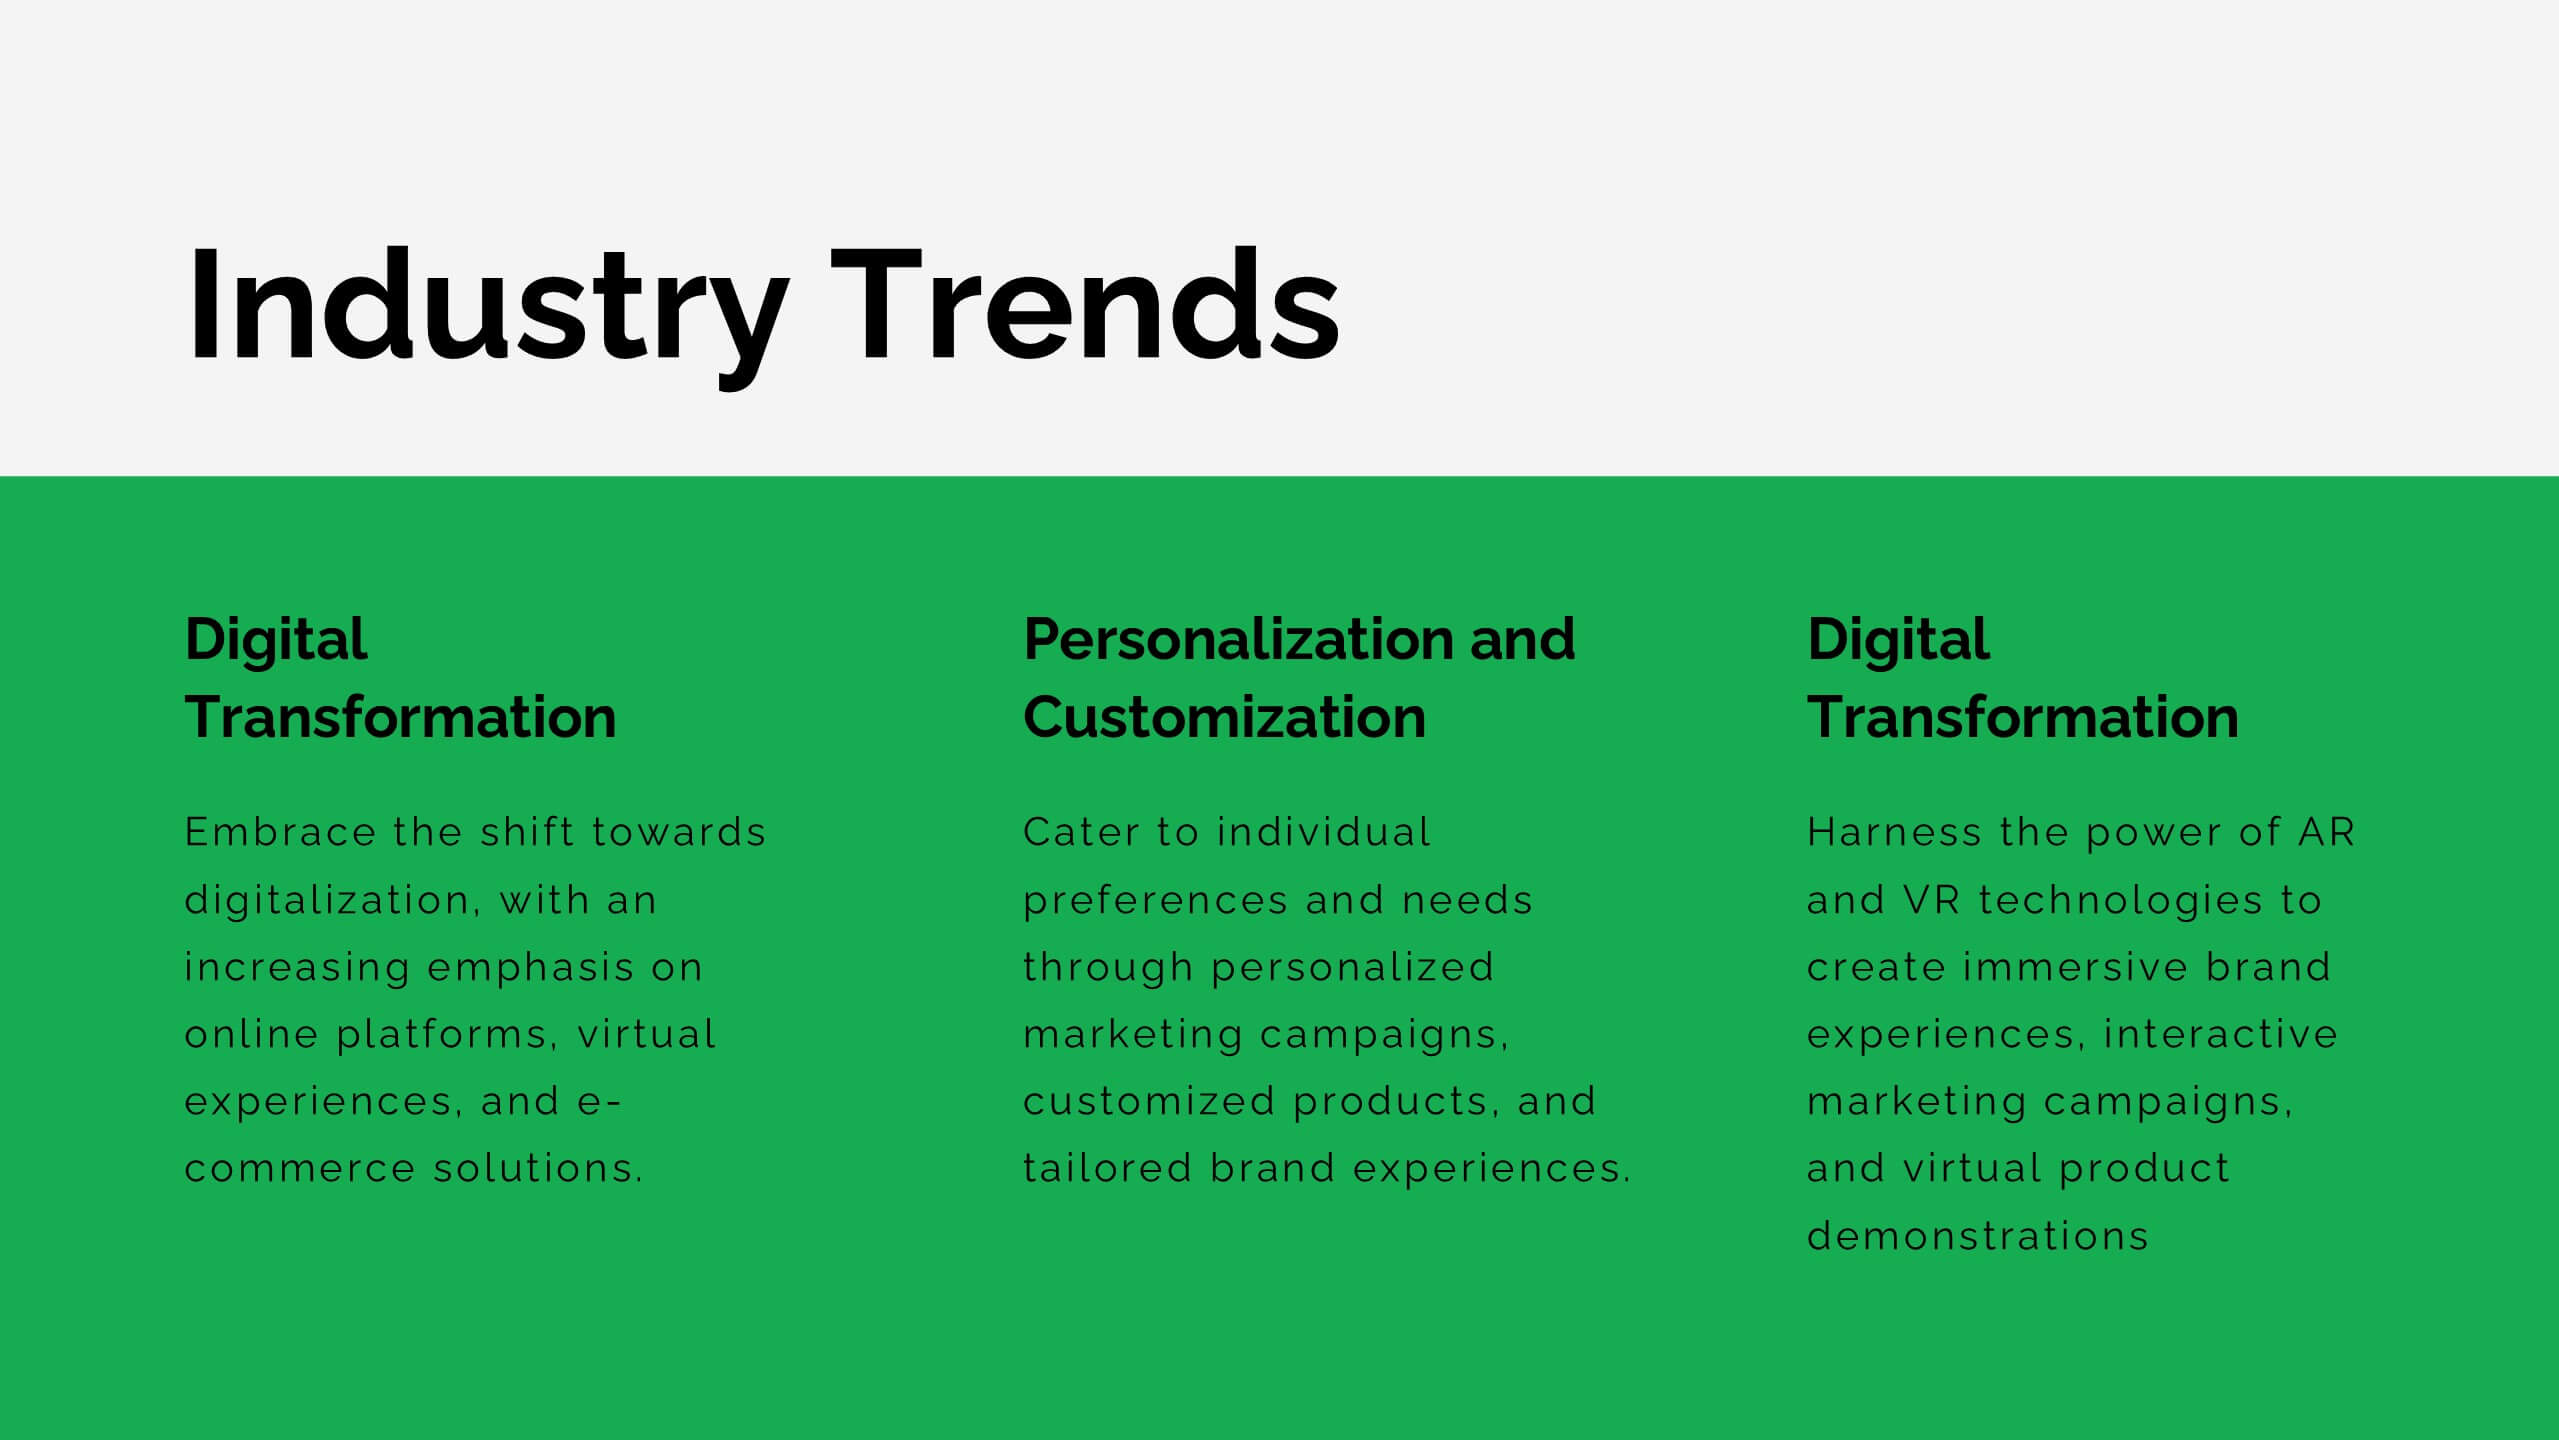
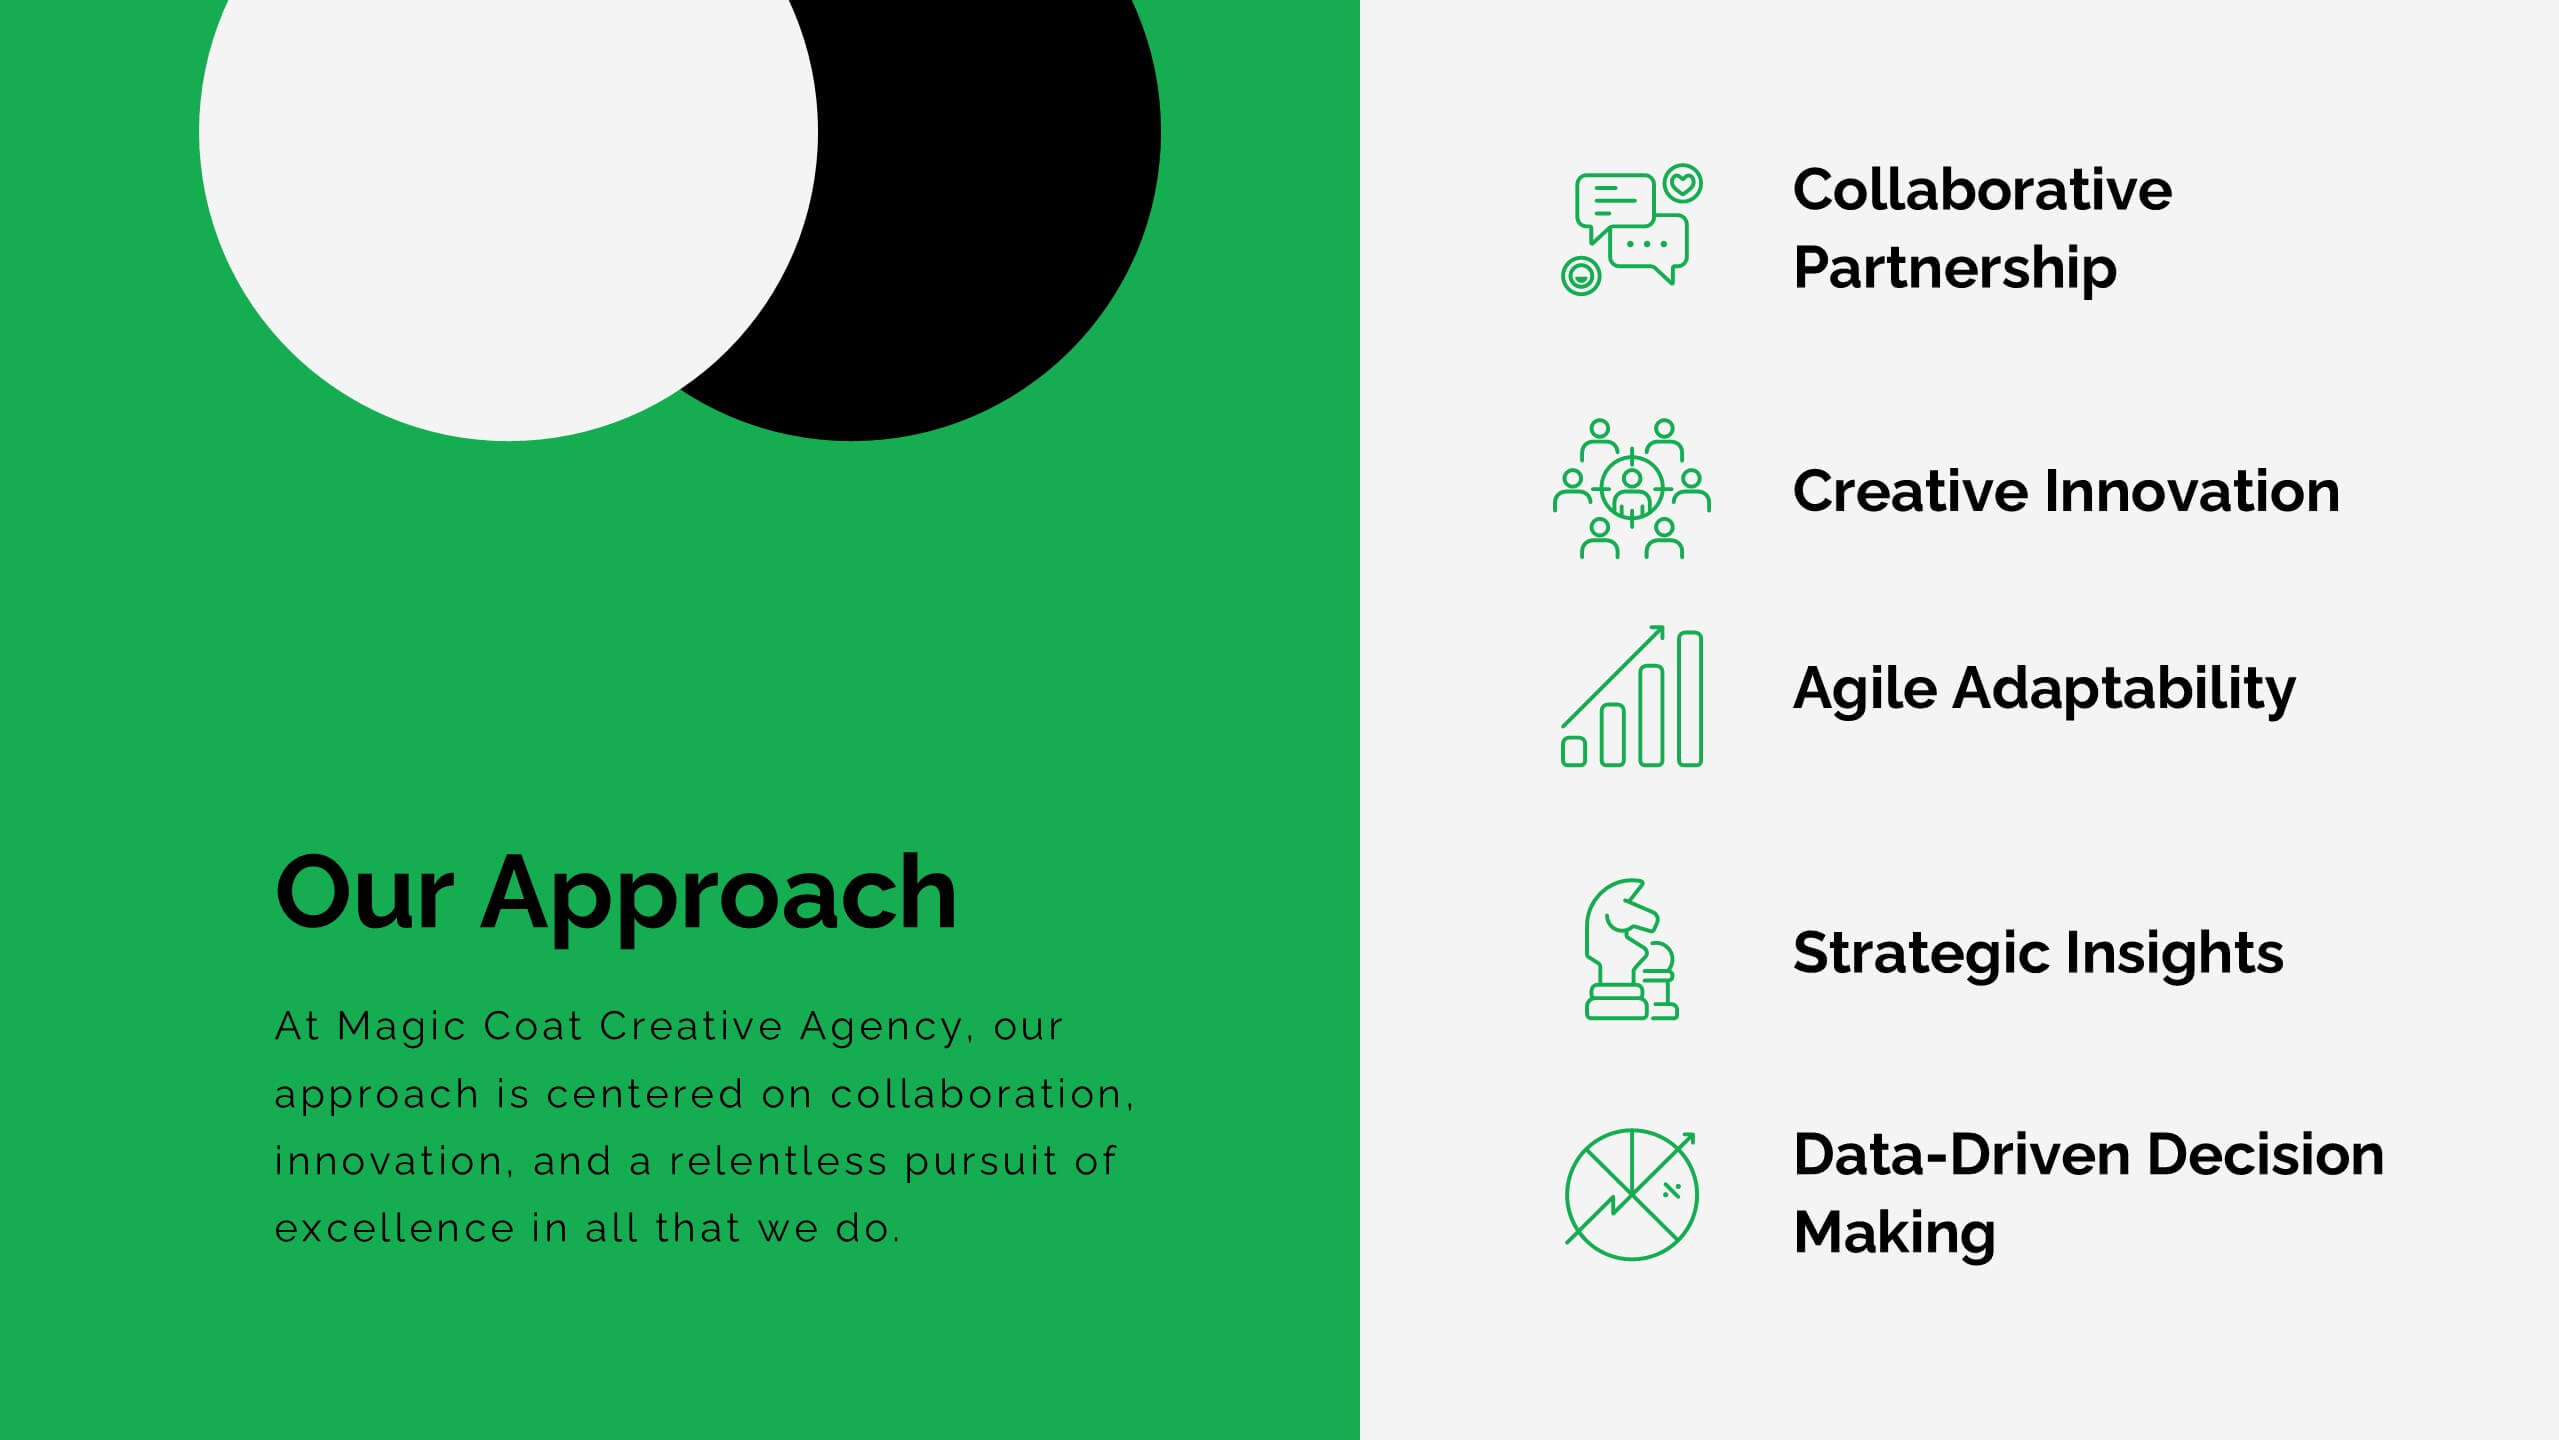
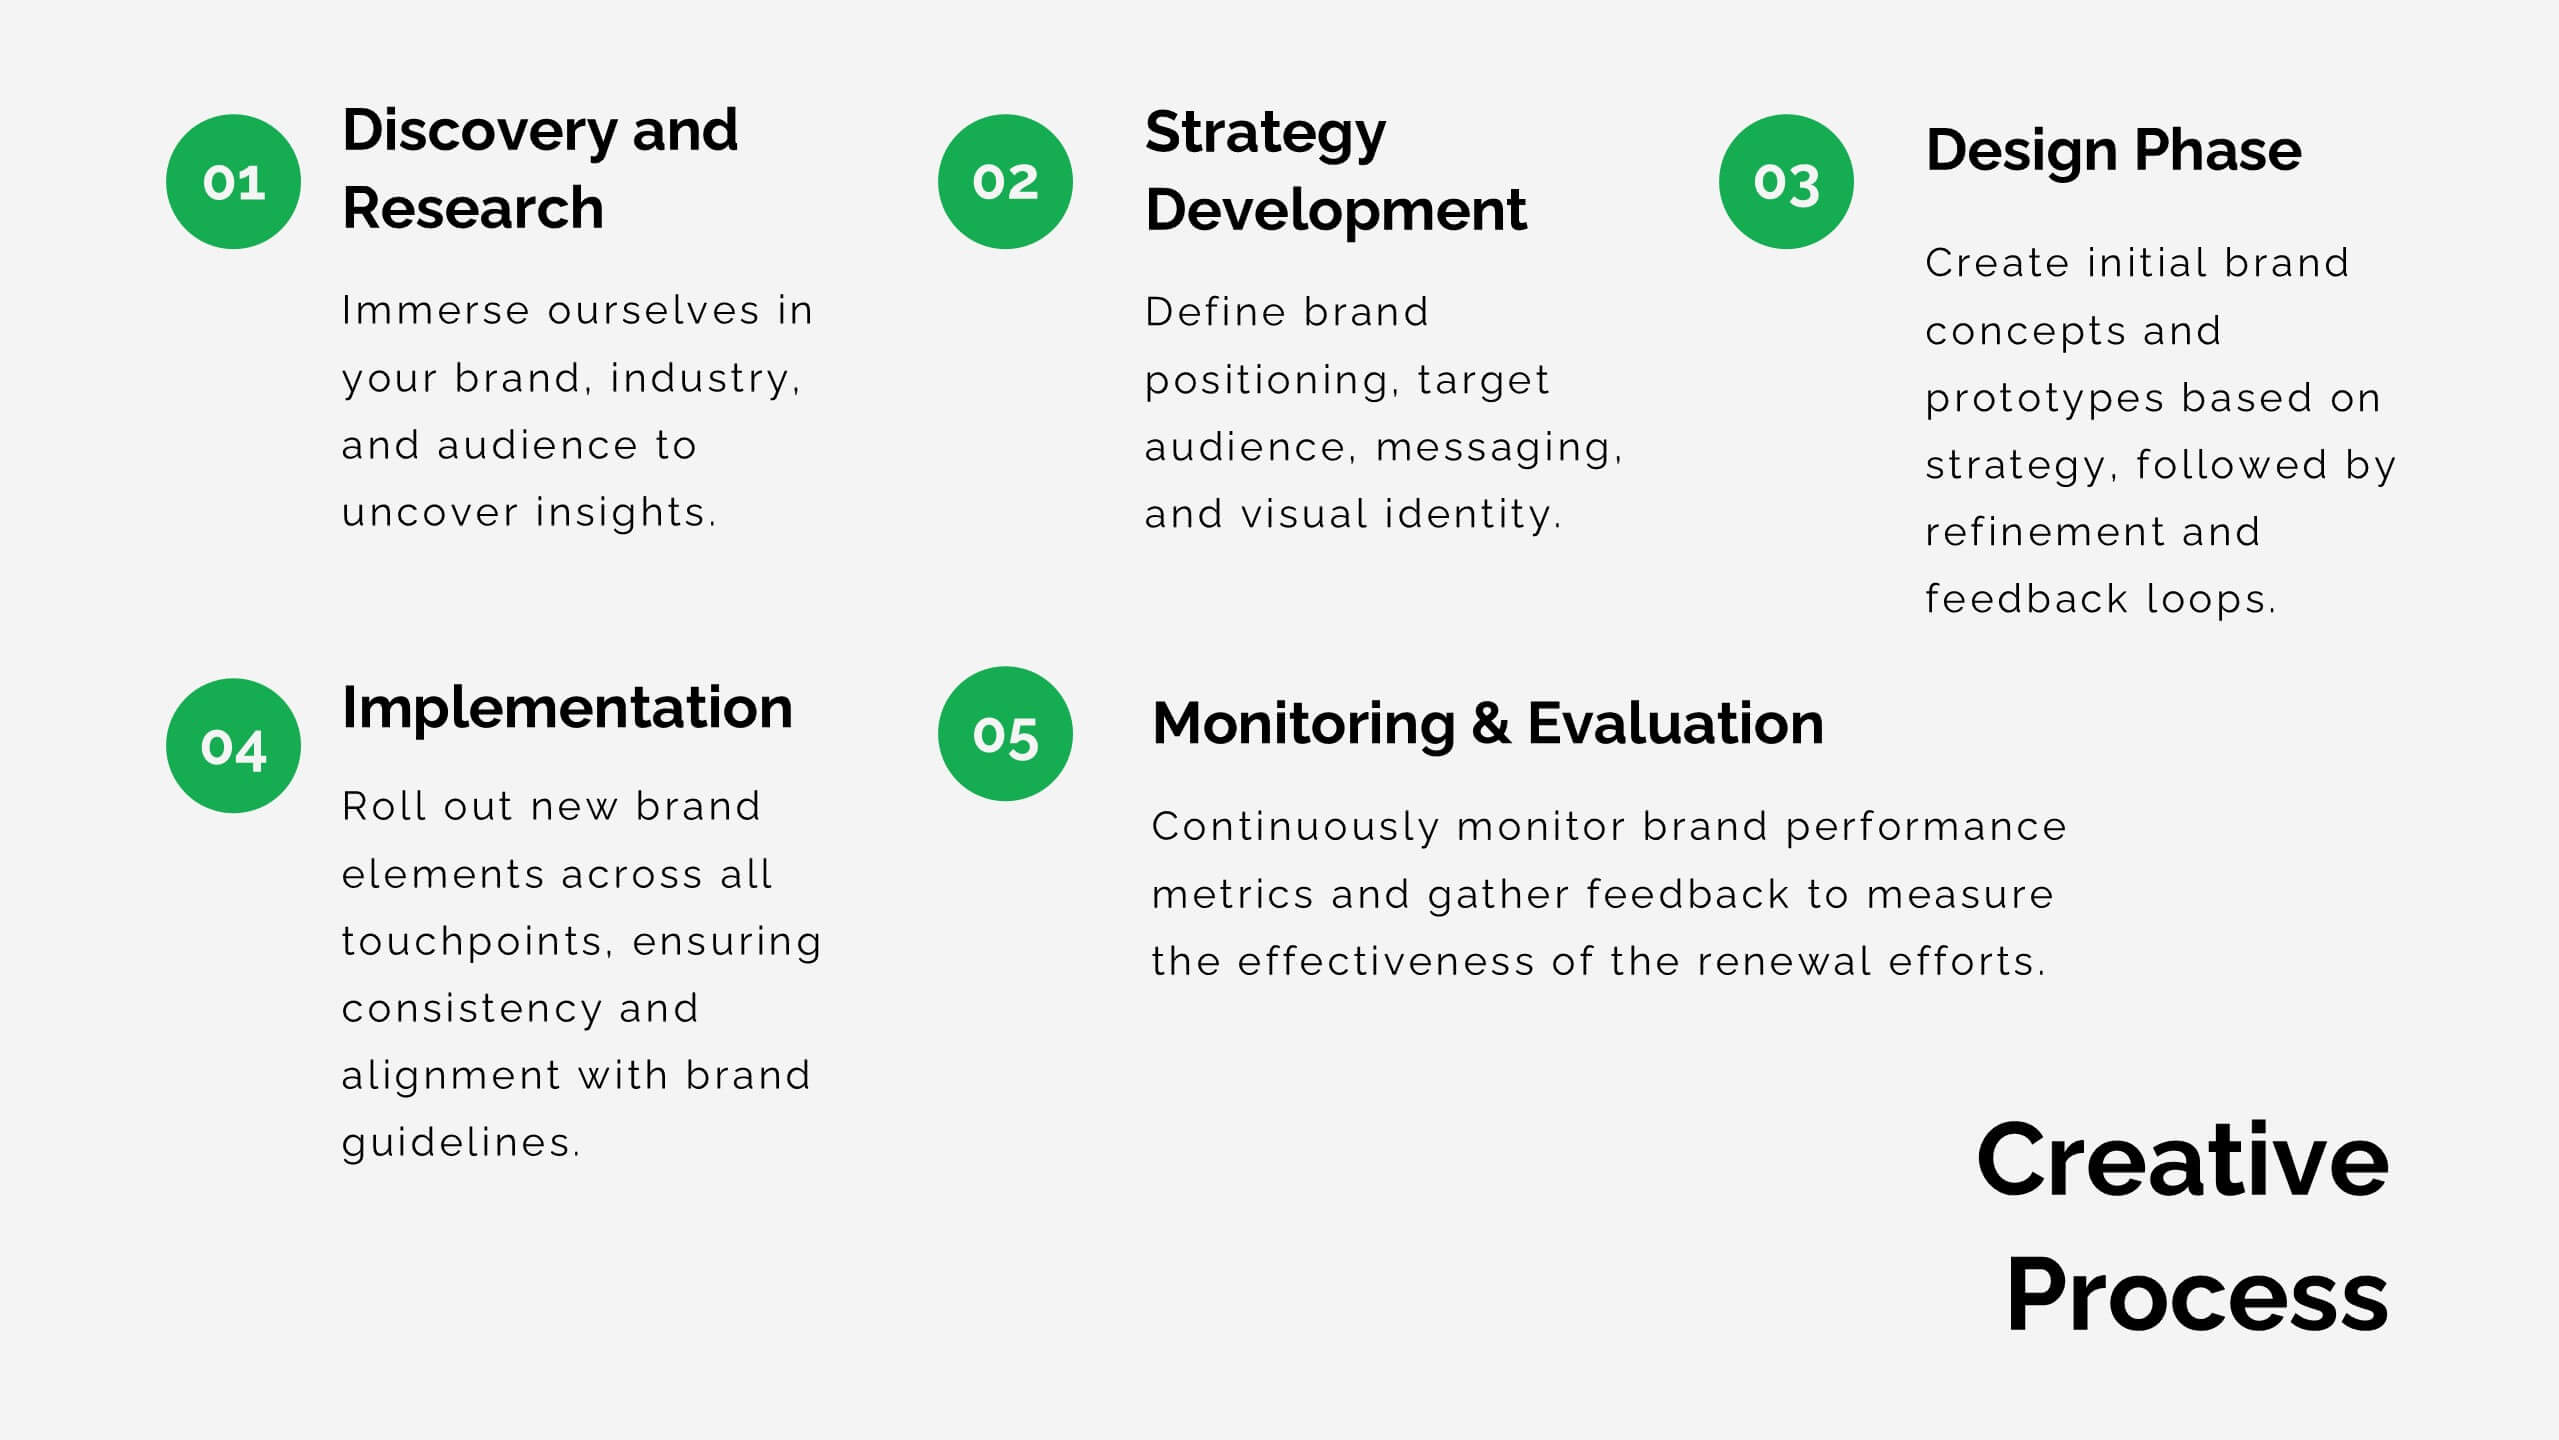
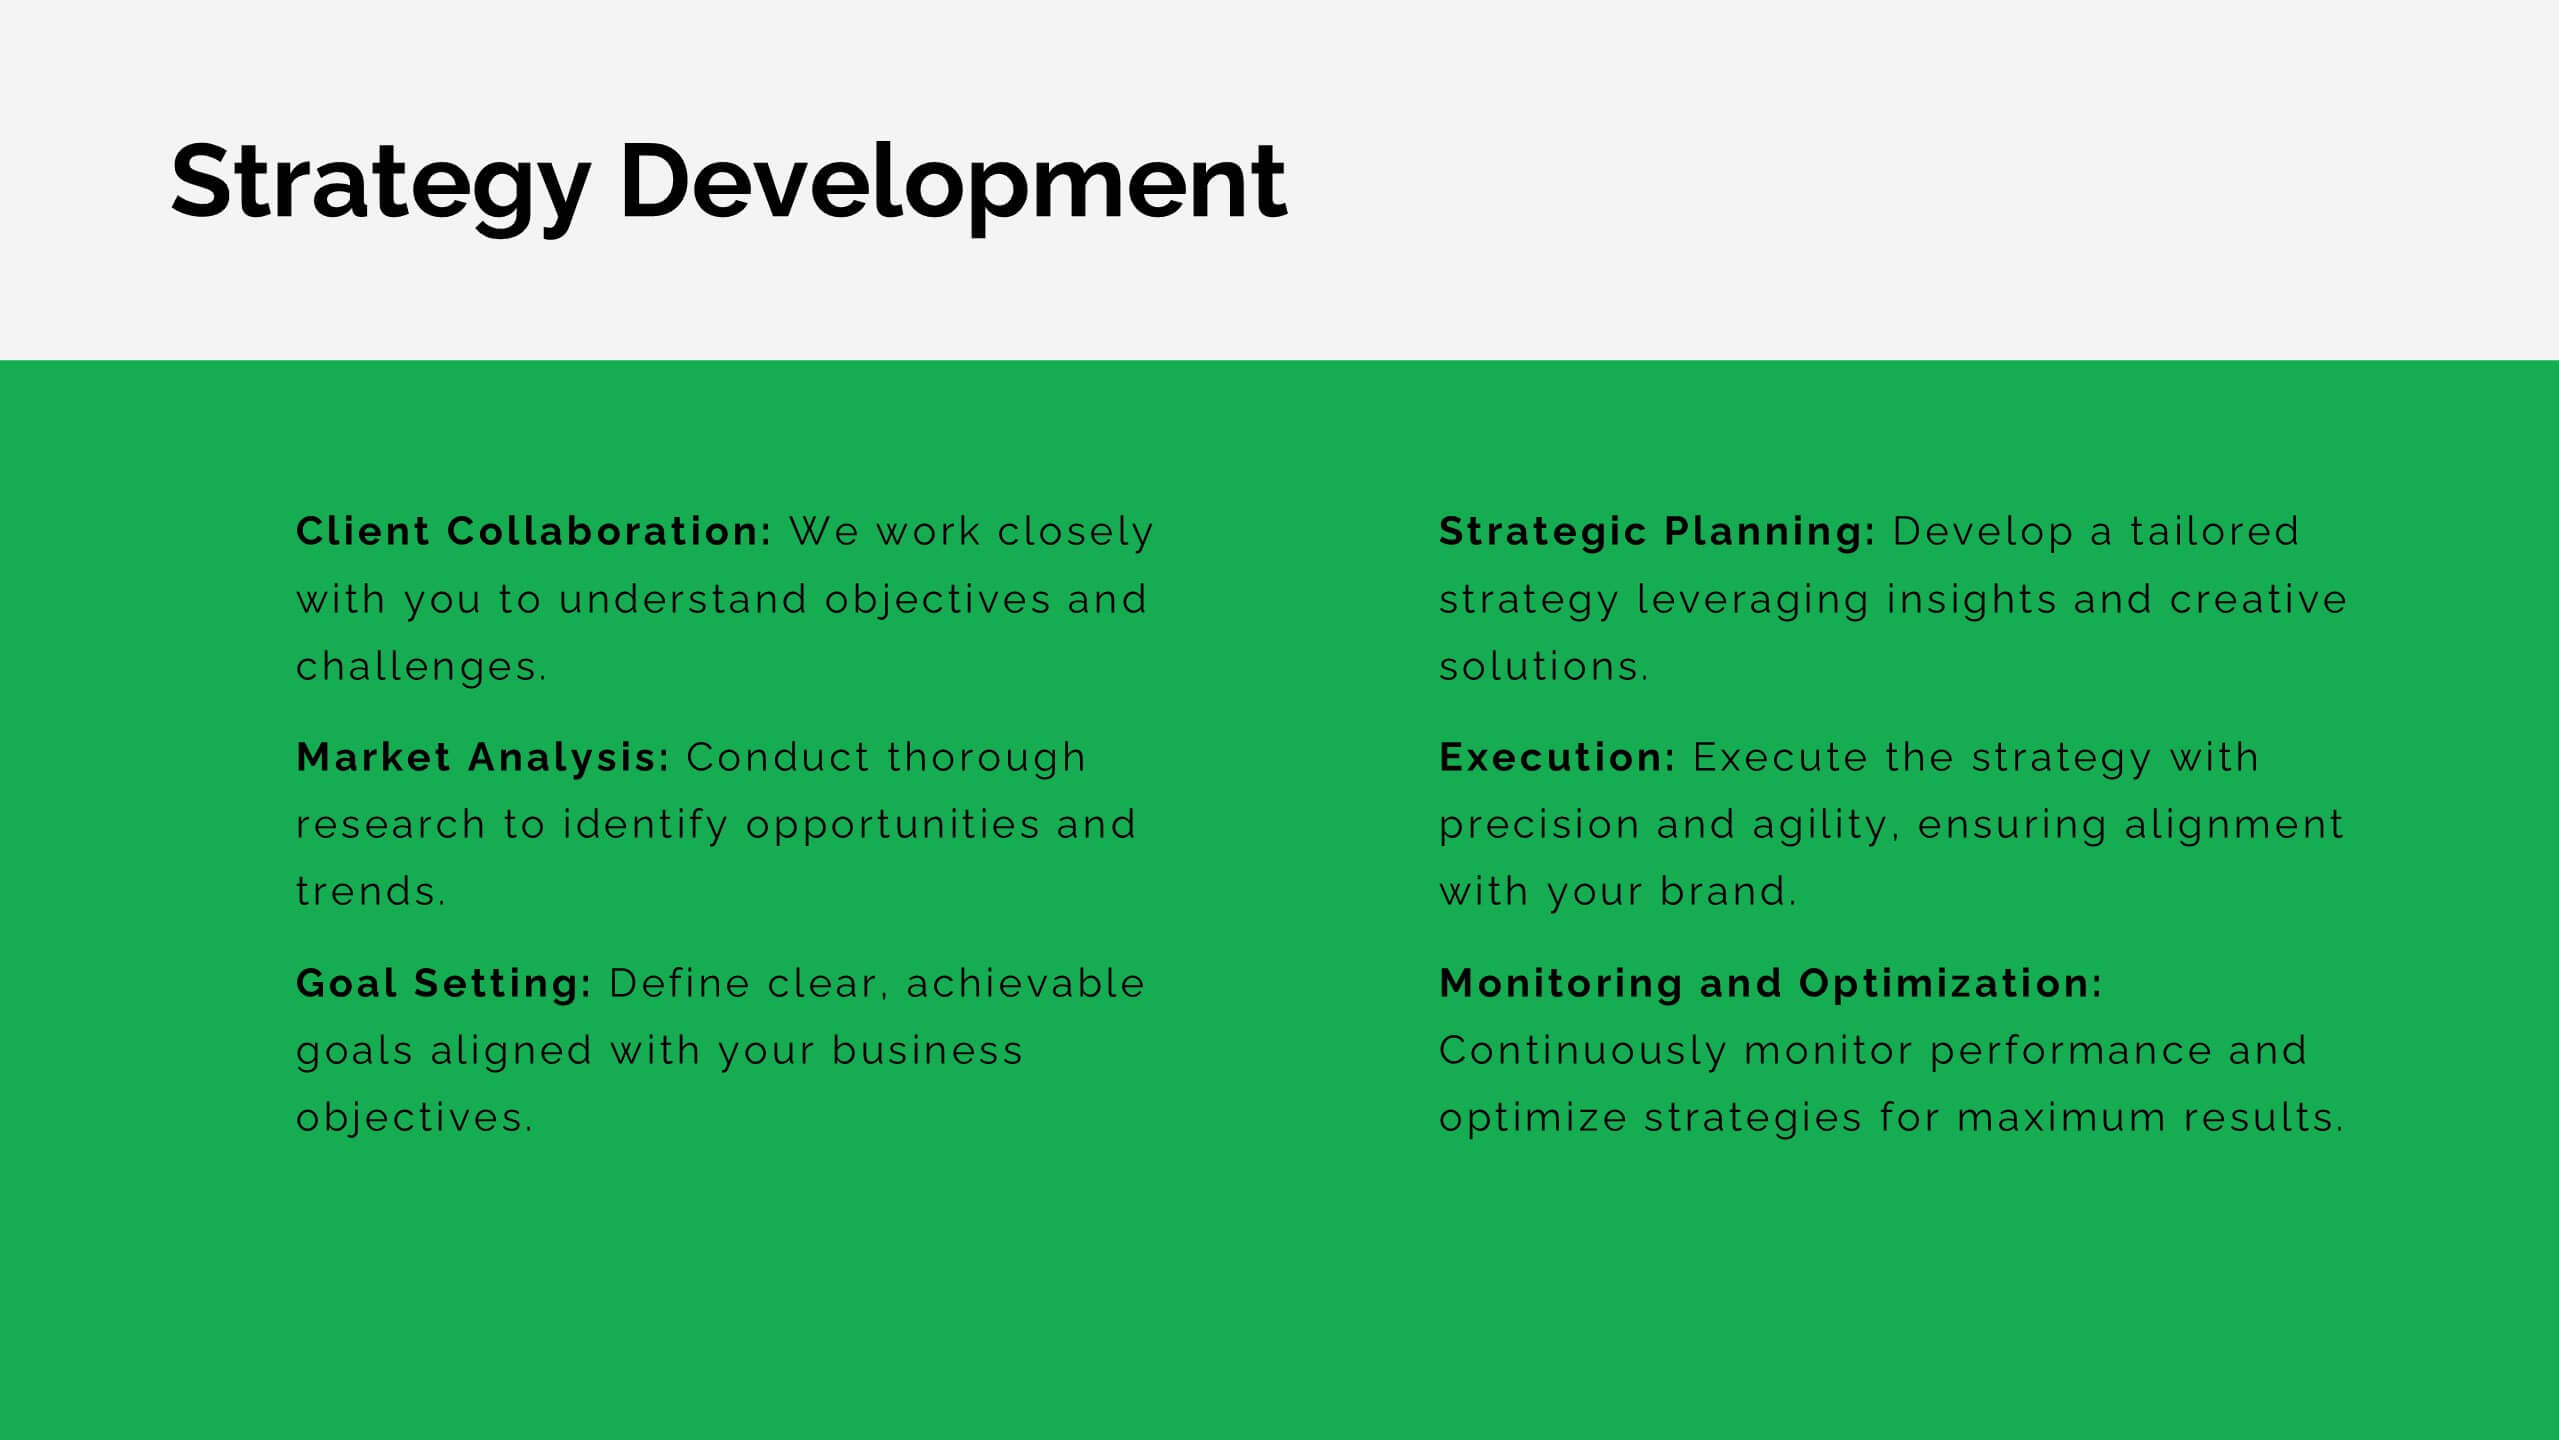
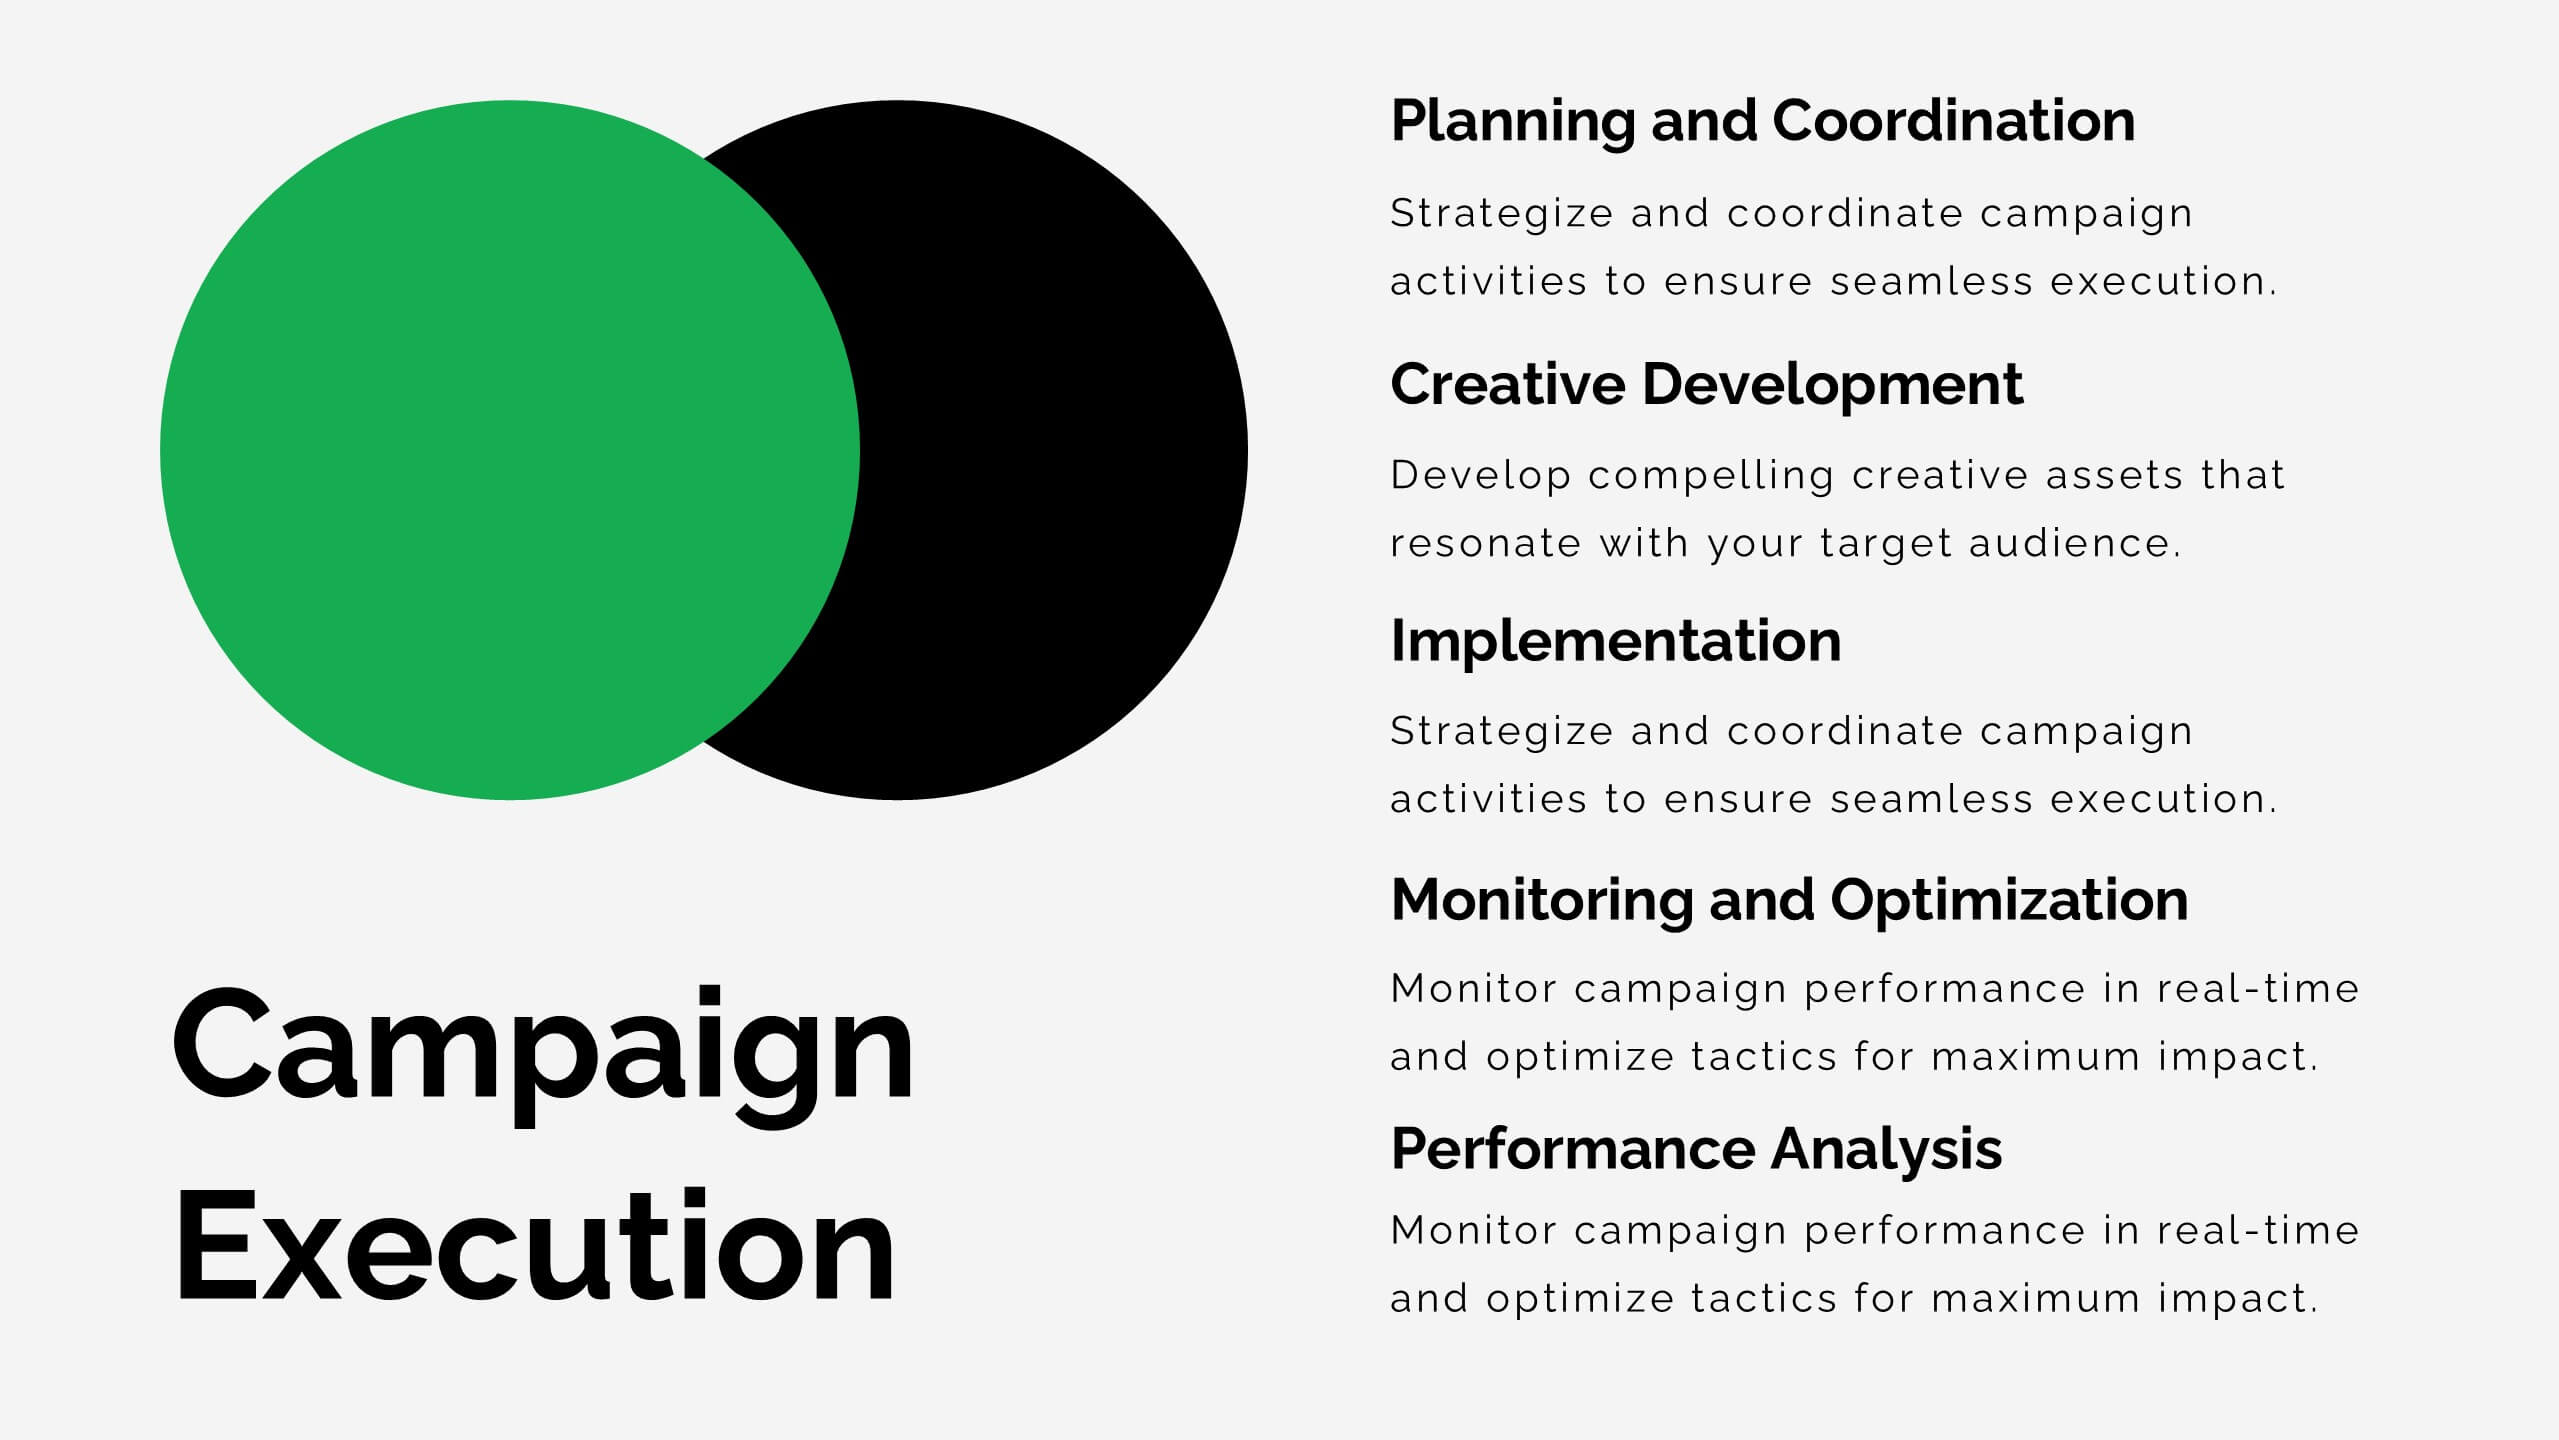
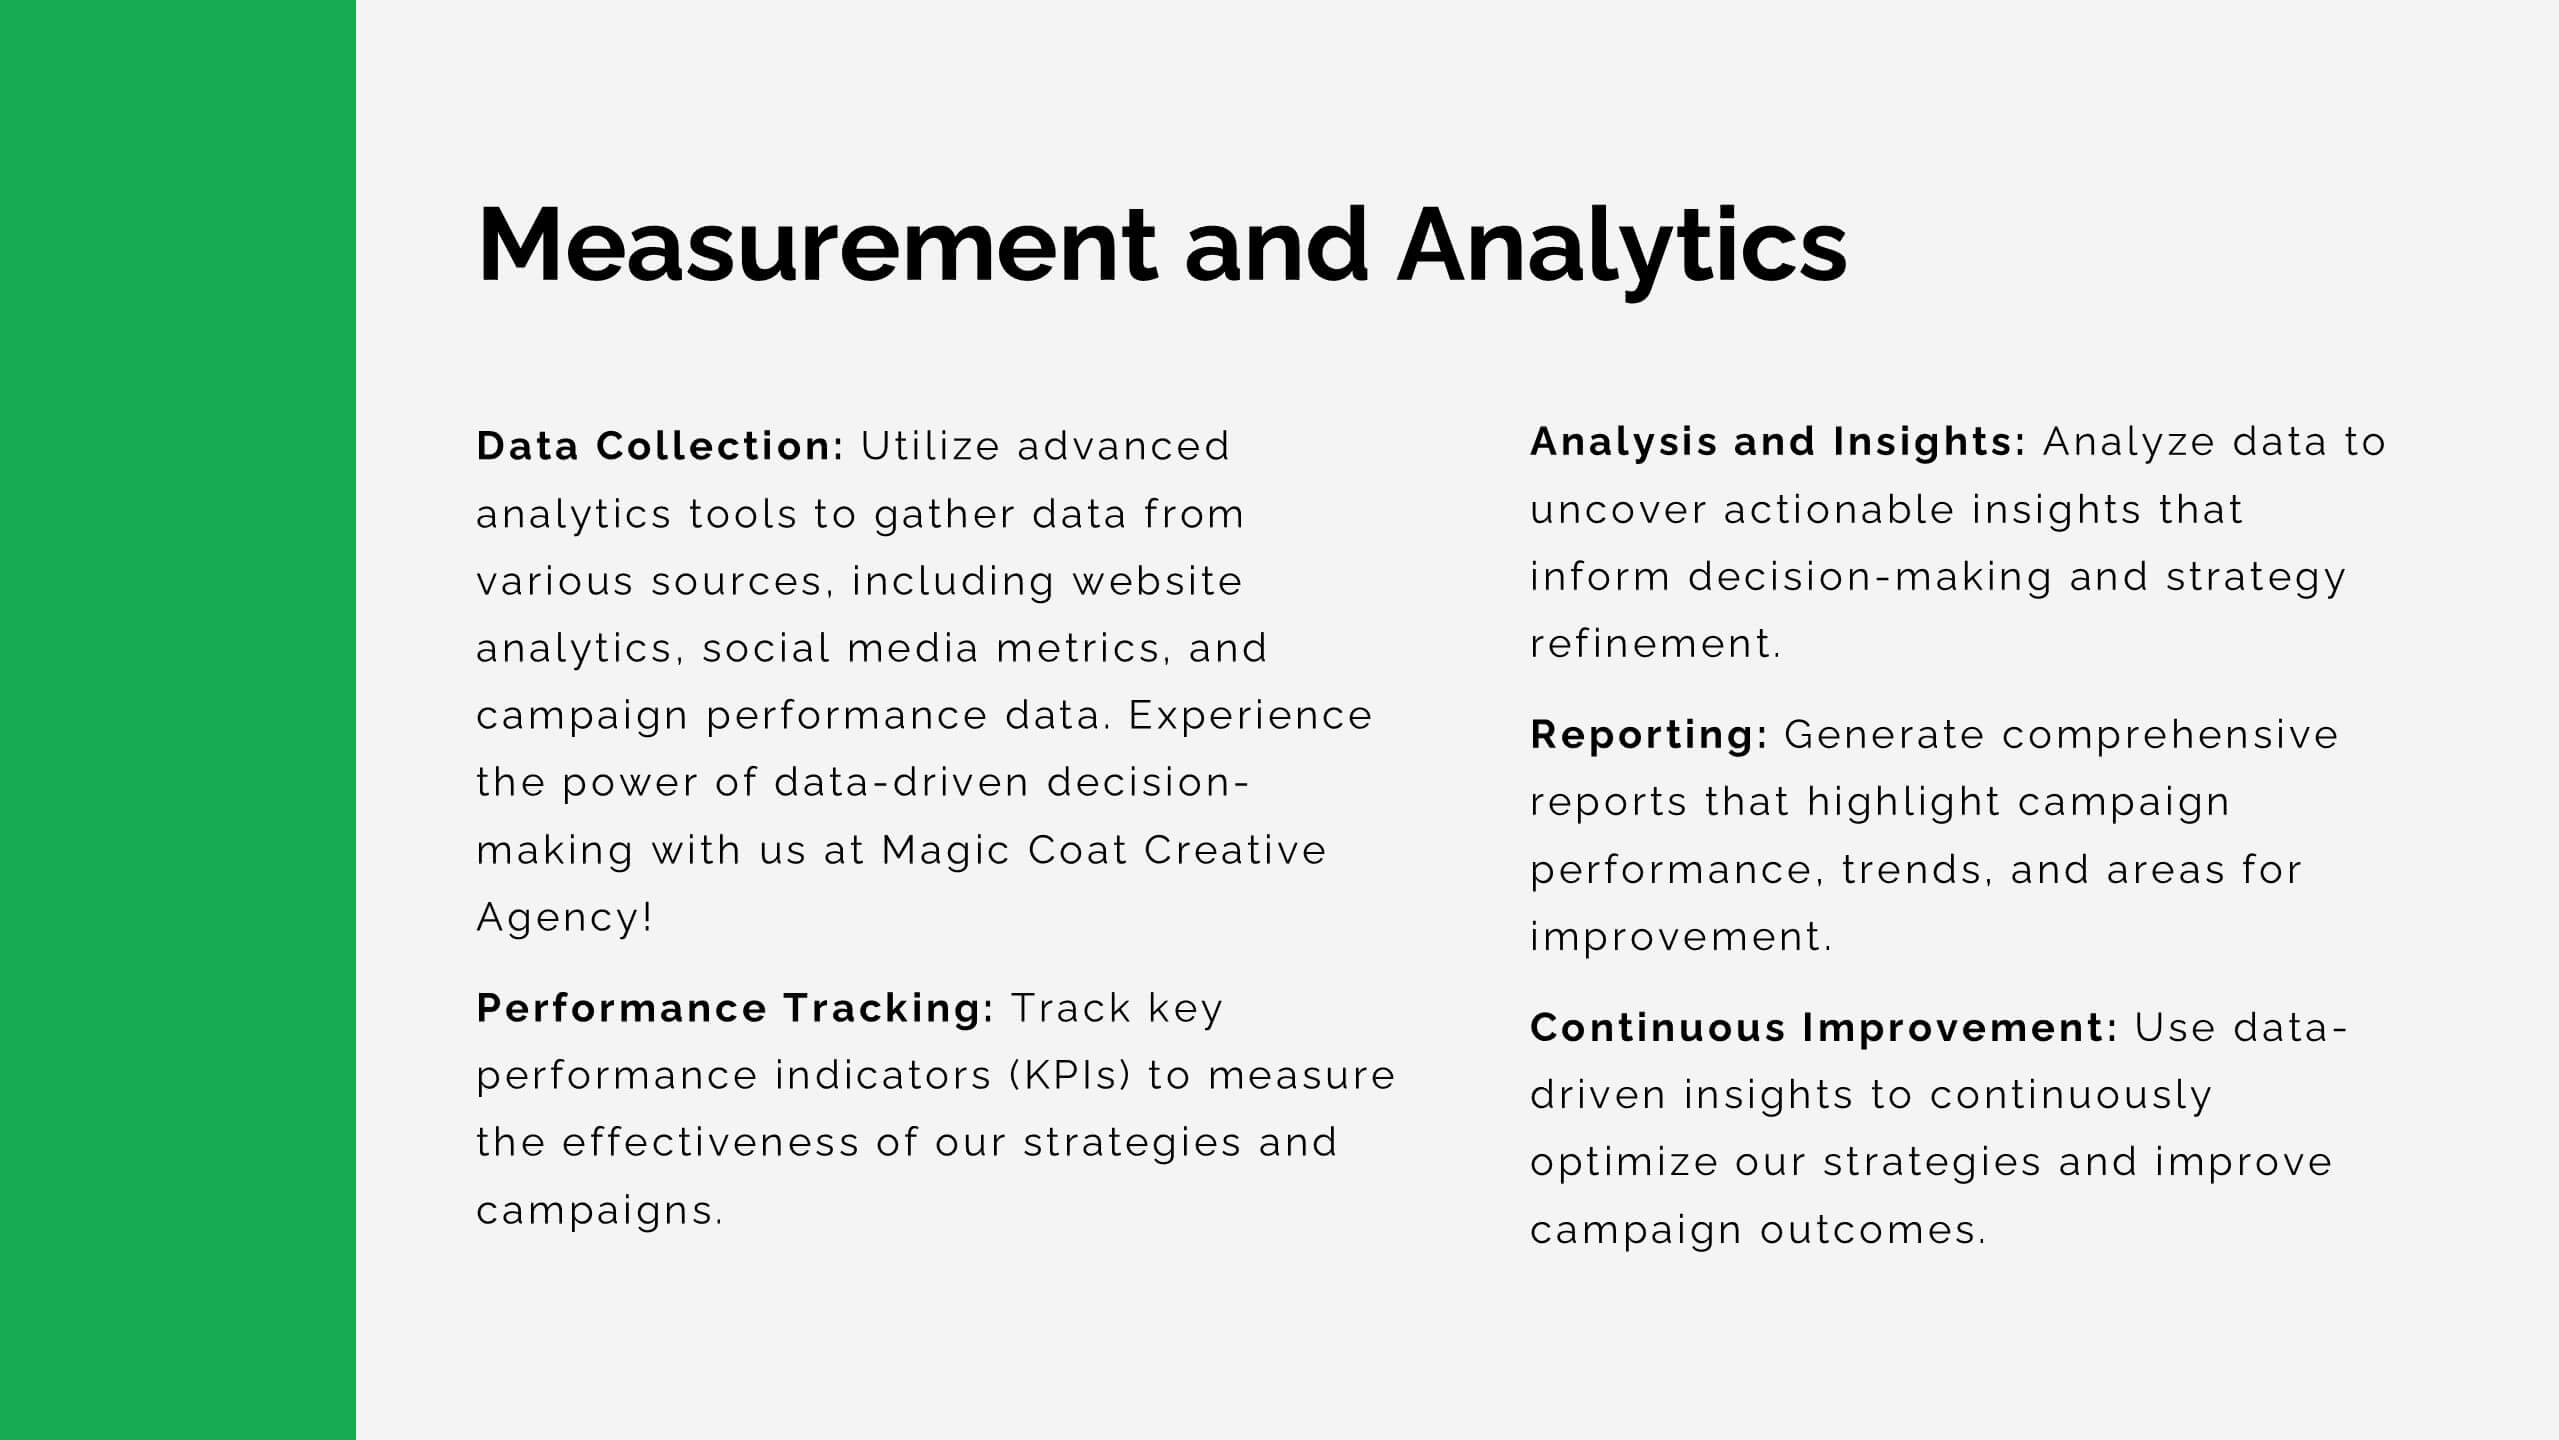
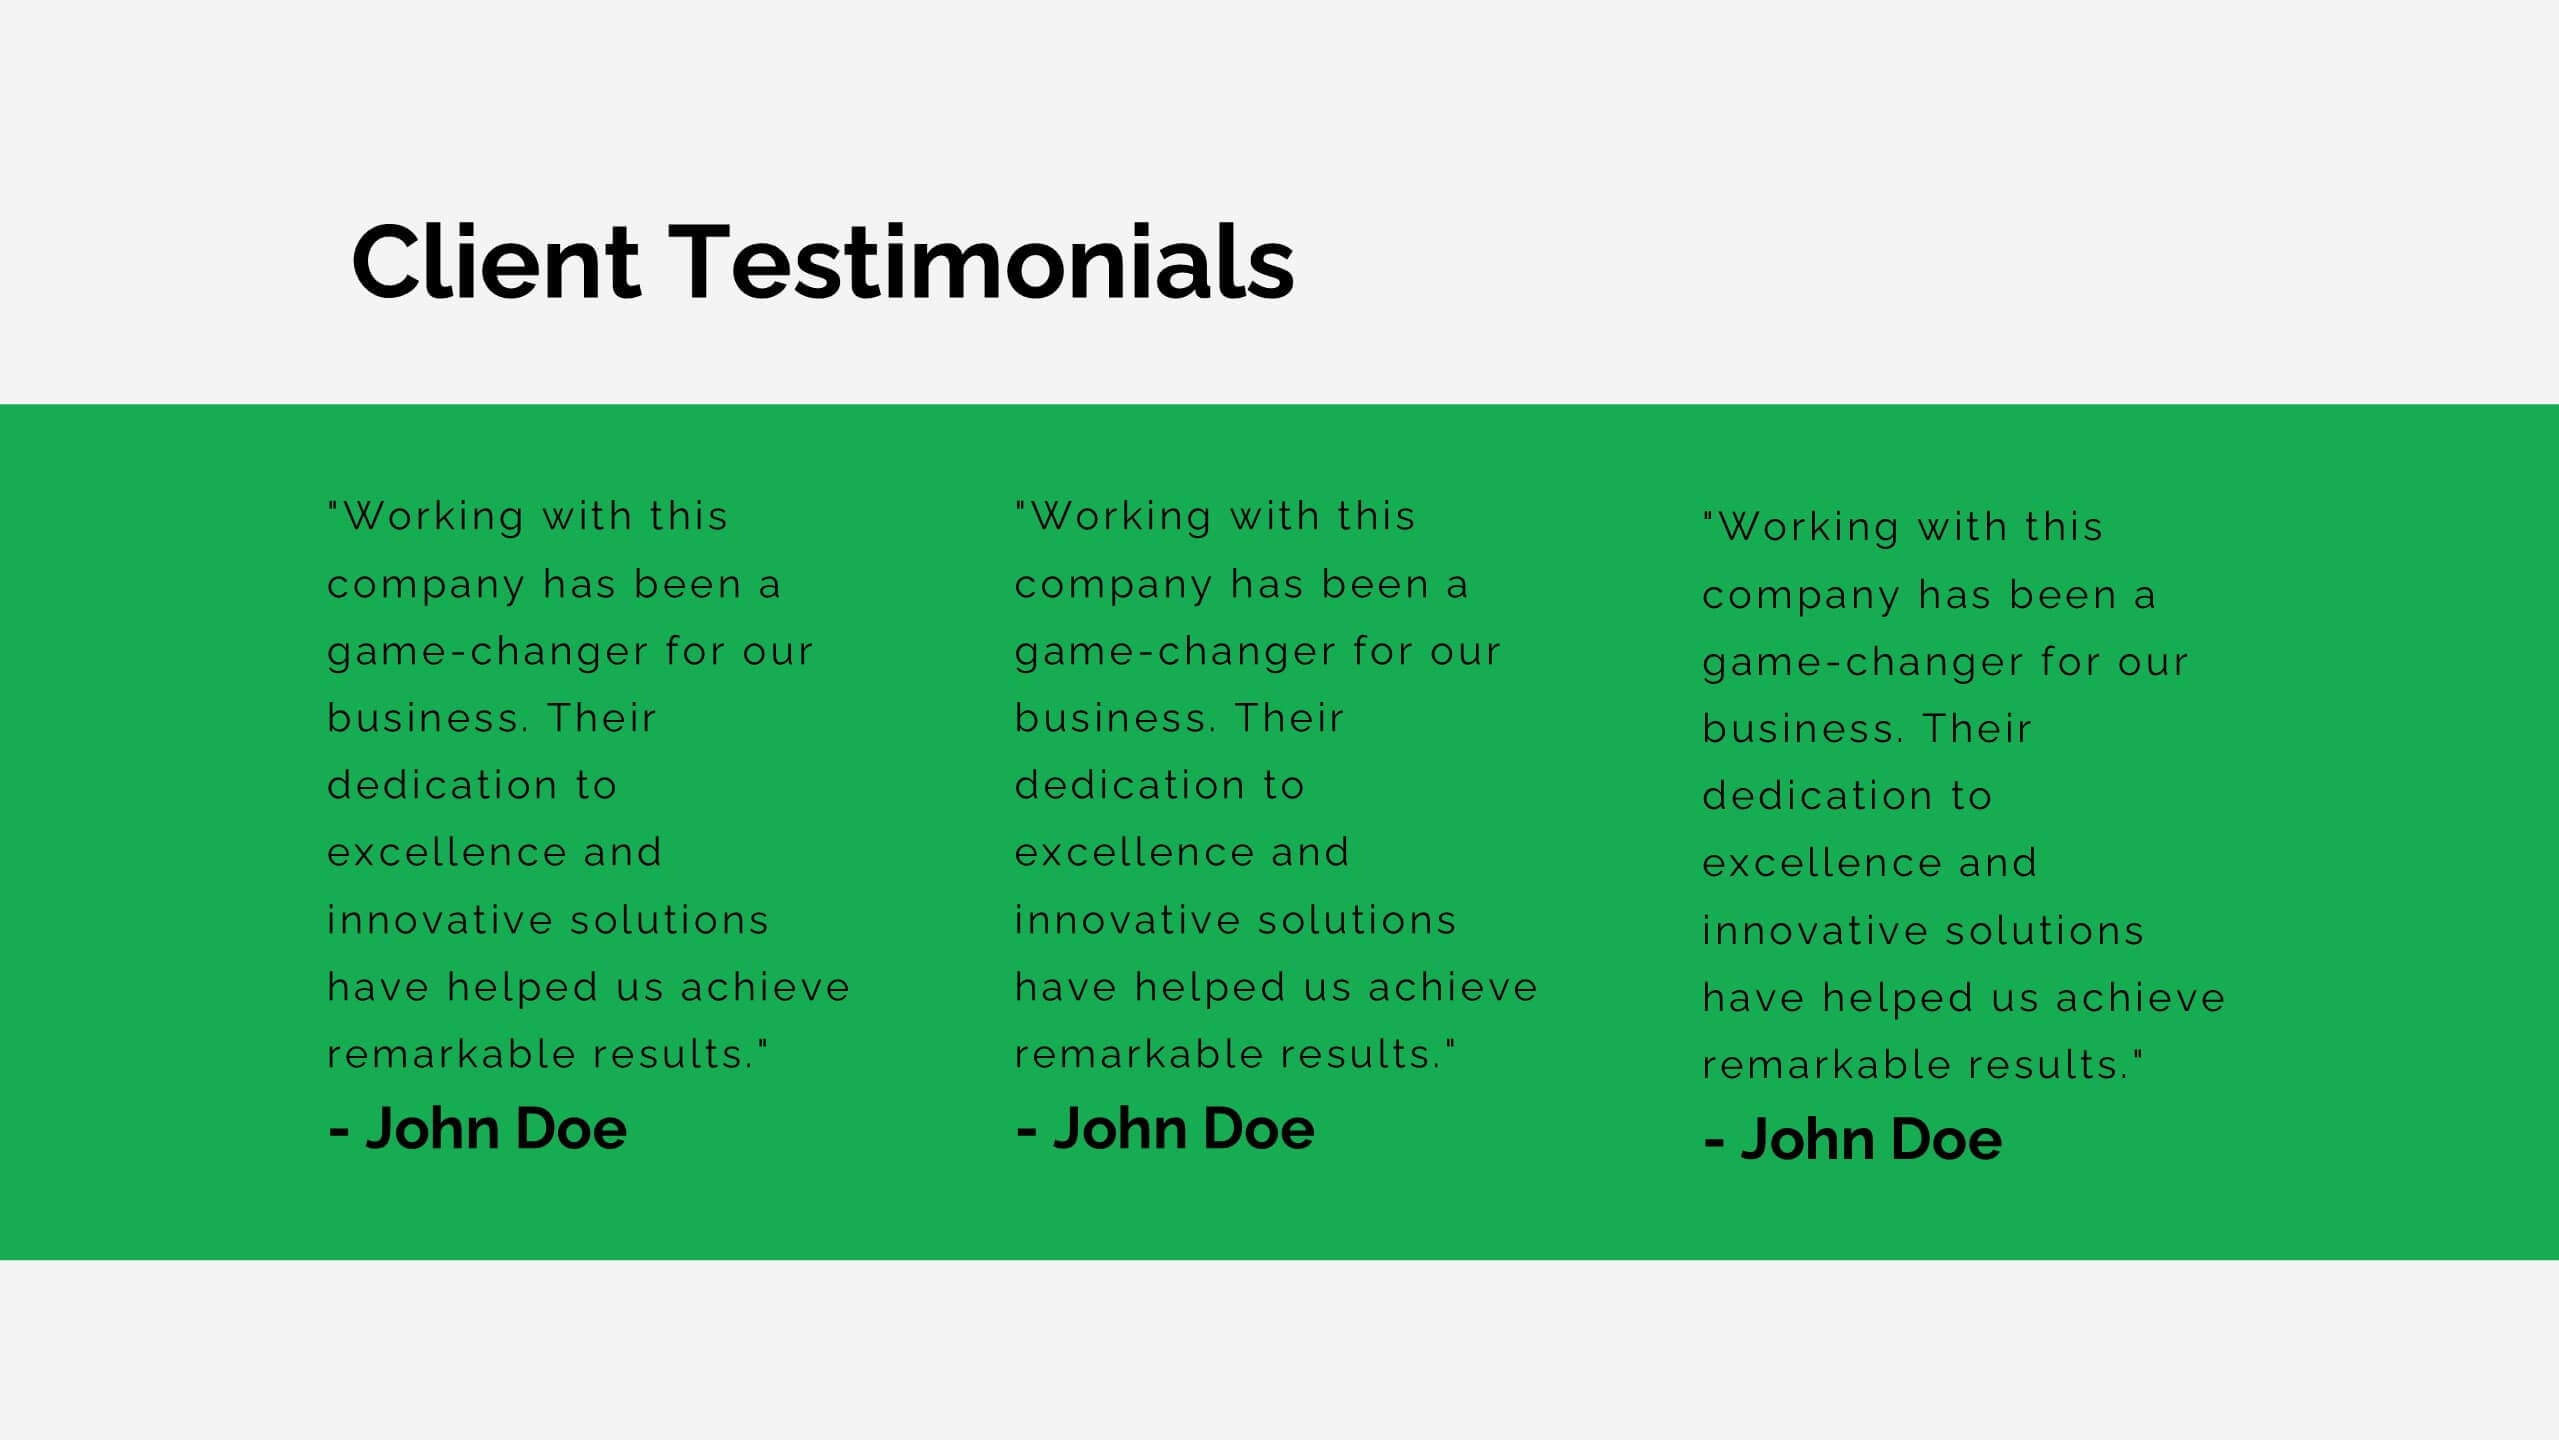
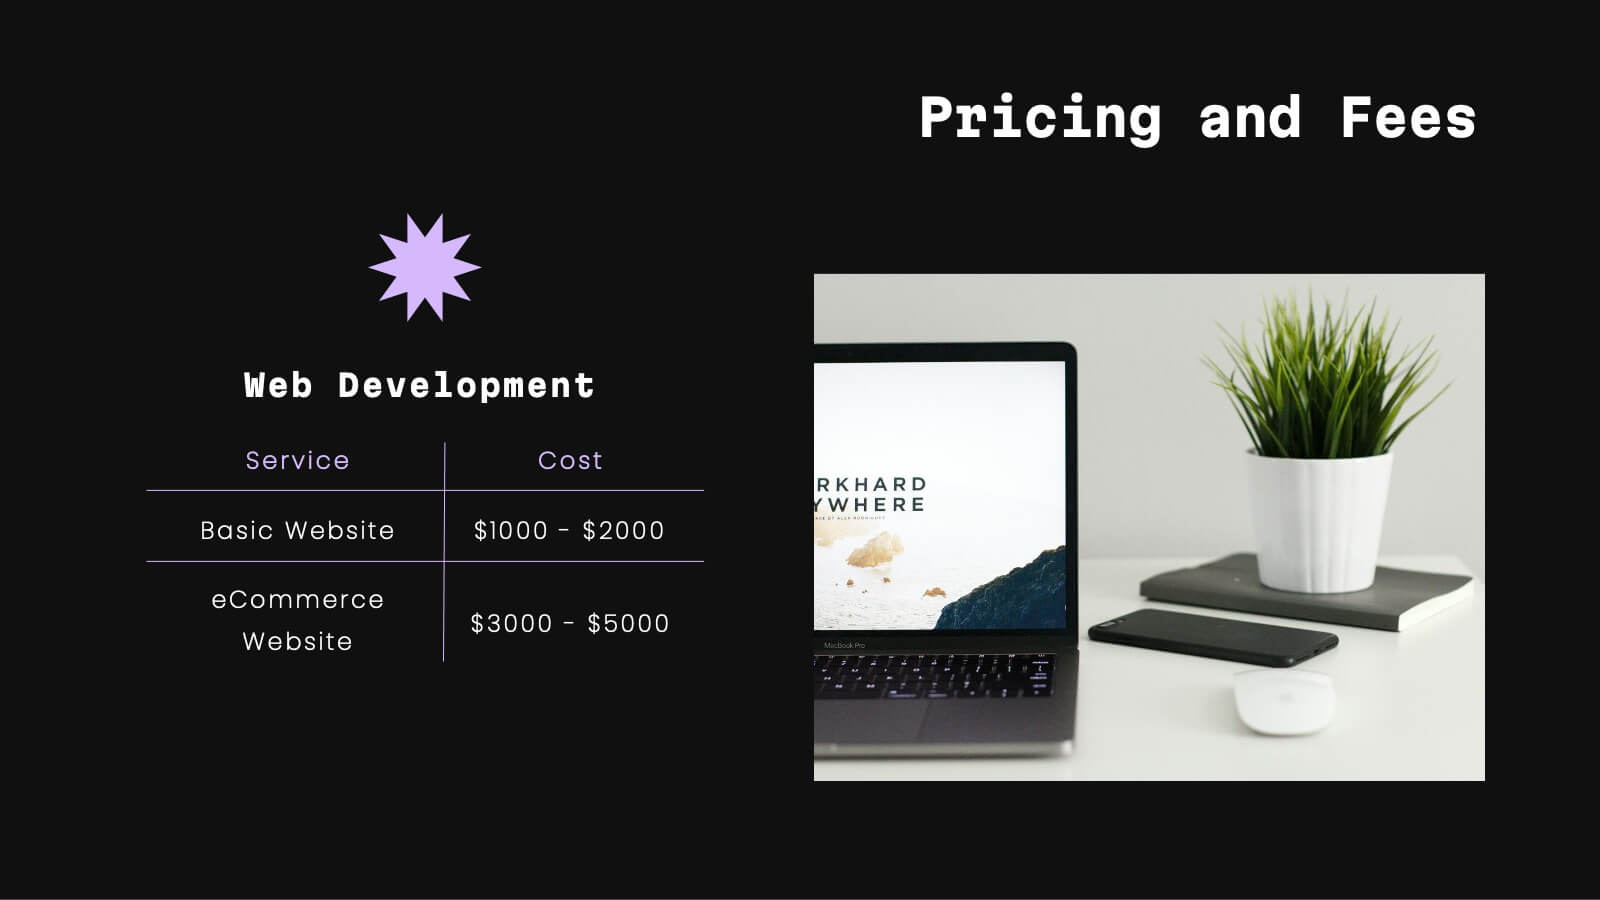
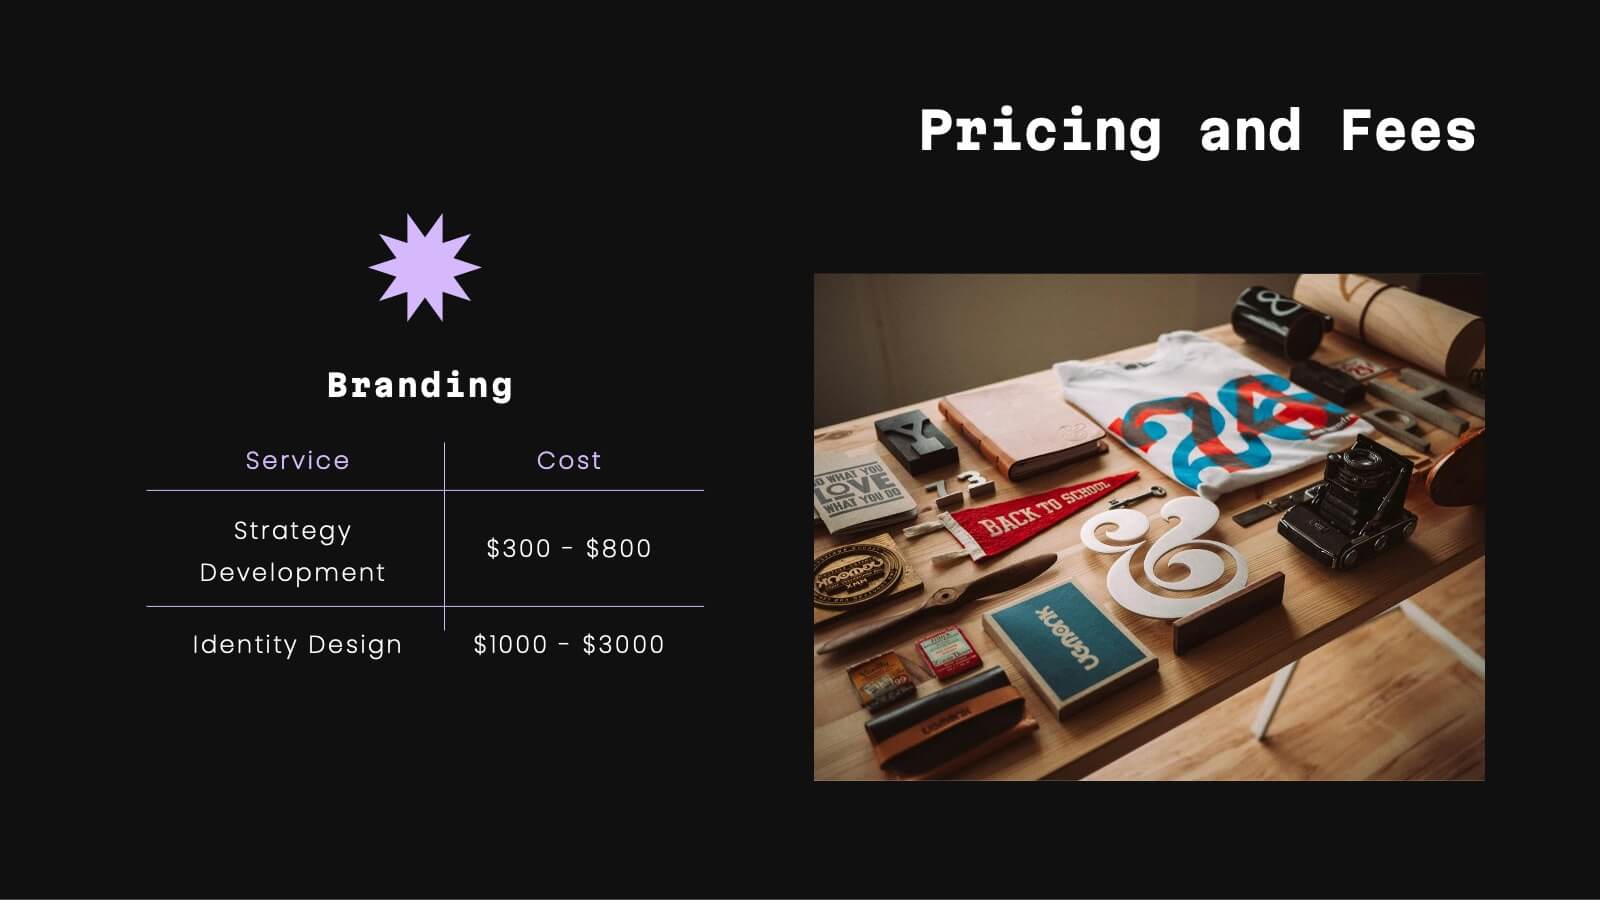
Lithium Advertising Agency Proposal Presentation
Elevate your advertising agency’s proposals with this sleek and modern template! It covers key areas like market analysis, case studies, client success stories, and campaign execution. Fully customizable, this template is perfect for presenting your agency’s services and strategies. Compatible with PowerPoint, Keynote, and Google Slides, it’s designed for impactful client presentations.


26 diapositivas
Poseidon Sales Pitch Deck Template Presentation
Unleash your persuasive power with the Poseidon Sales Pitch Deck template! This sleek and modern deck is designed to elevate your pitch, making your business the undeniable choice for potential clients or investors. With a compelling company overview and a clear problem statement, this template sets the stage for presenting your solution as the ultimate answer to your market’s challenges. The deck includes essential slides like competitive landscape analysis, revenue models, and marketing strategies to give your pitch a comprehensive edge. The visually appealing design combined with well-organized sections ensures your message is clear, concise, and impactful. Customize it to fit your brand identity and make your unique selling proposition stand out. Perfect for startups, established businesses, or anyone looking to make a powerful impression, this template is compatible with PowerPoint, Keynote, and Google Slides. Take your pitch to the next level and close those deals with confidence!


4 diapositivas
Interactive Data Dashboard Display Presentation
Present data with clarity using this Interactive Data Dashboard Display presentation. Designed to showcase multiple metrics at once, it includes pie charts, donut charts, bubble graphs, and bar comparisons. Ideal for business reports, marketing insights, or performance reviews. Fully editable in Canva, PowerPoint, and Google Slides for flexible customization.


4 diapositivas
Strategic SWOT Analysis Chart Presentation
Kick off your strategy session with a clean, modern layout that makes analyzing key strengths, weaknesses, opportunities, and threats feel effortless. This presentation helps teams visualize insights, connect patterns, and plan smarter using a clear, connected flow. Perfect for strategic planning and business reviews. Fully compatible with PowerPoint, Keynote, and Google Slides.


4 diapositivas
E-Learning Module Structure Presentation
Turn your lesson flow into a visual journey your audience can actually follow. This presentation template maps out the structure of an e-learning module with step-by-step clarity—ideal for course creators, instructional designers, or trainers. Easily customize each stage. Fully editable in PowerPoint, Keynote, and Google Slides for flexible use.


7 diapositivas
Strategy Wheel Options Infographic Presentation
A Strategy Wheel Infographic is a visual tool that helps organizations develop and communicate their strategic plans. This template uses a circular diagram that breaks down the elements of a strategy into categories or segments, with each segment representing a different aspect of the plan. This infographic includes a central circle that represents the organization's overall goal, surrounded by smaller circles or segments that represent specific strategies or tactics. Each segment may include additional information such as goals, objectives, key performance indicators, and action items.


5 diapositivas
Sustainable Fashion Infographics
Sustainable fashion, also known as eco-fashion or ethical fashion, is an approach to clothing and accessories that aims to minimize the negative environmental and social impacts of the fashion industry. These vertical templates are designed to raise awareness about sustainable practices in the fashion industry. They aim to educate viewers about the environmental and social impacts of fast fashion and highlight the importance of adopting sustainable fashion choices. The template incorporates relevant statistics and facts about the fashion industry's impact on the environment and society. Compatible with Powerpoint, Keynote, and Google Slides.


4 diapositivas
User Base by Demographic Factors
Understand your audience at a glance with the User Base by Demographic Factors Presentation. This visual template displays gender-based or group-based demographic insights alongside bar chart statistics and percentages, making it ideal for marketing reports, pitch decks, or user research presentations. Fully customizable in PowerPoint, Keynote, and Google Slides.


6 diapositivas
Creative Thinking and Innovation Presentation
Unleash Creative Thinking and Innovation with this engaging infographic. Featuring a visually dynamic brain puzzle design, this template is perfect for presenting problem-solving strategies, brainstorming techniques, and creative business solutions. Fully editable and compatible with PowerPoint, Keynote, and Google Slides.


7 diapositivas
Product Life Cycle Model Infographic
Navigate the evolution of any product with our vibrant product life cycle model infographic. Utilizing a vivid color palette of purple, blue, green, and pink, this design masterfully illustrates each phase of a product's journey, from inception to decline. Ideal for marketers, product managers, and business educators, this infographic serves as a visual guide to understand and optimize a product's life span. With its sleek design, it can effortlessly engage audiences in presentations and discussions. And with seamless compatibility across PowerPoint, Keynote, and Google Slides, presenting this dynamic process is both effortless and impactful.


5 diapositivas
Capital Allocation Strategy Overview
Break down your financial strategy visually with the Capital Allocation Strategy Overview Presentation. This semi-circle diagram helps you present four key spending or investment categories clearly and professionally. Ideal for budget planning, operational expenses, or strategic financial decisions. Fully editable in PowerPoint, Keynote, and Google Slides.


22 diapositivas
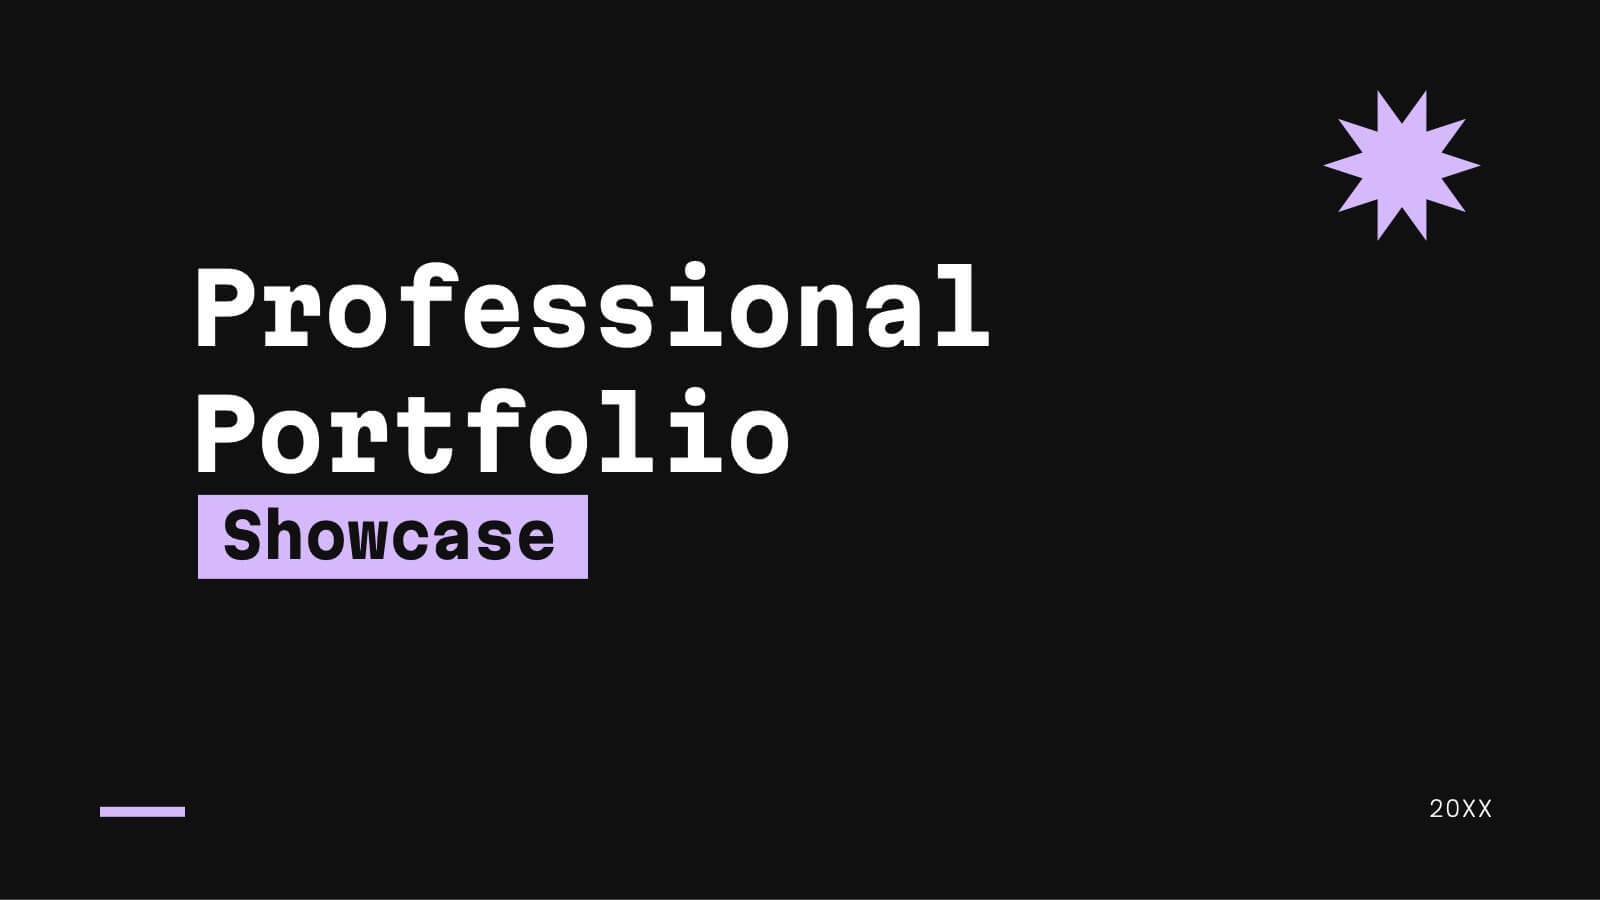
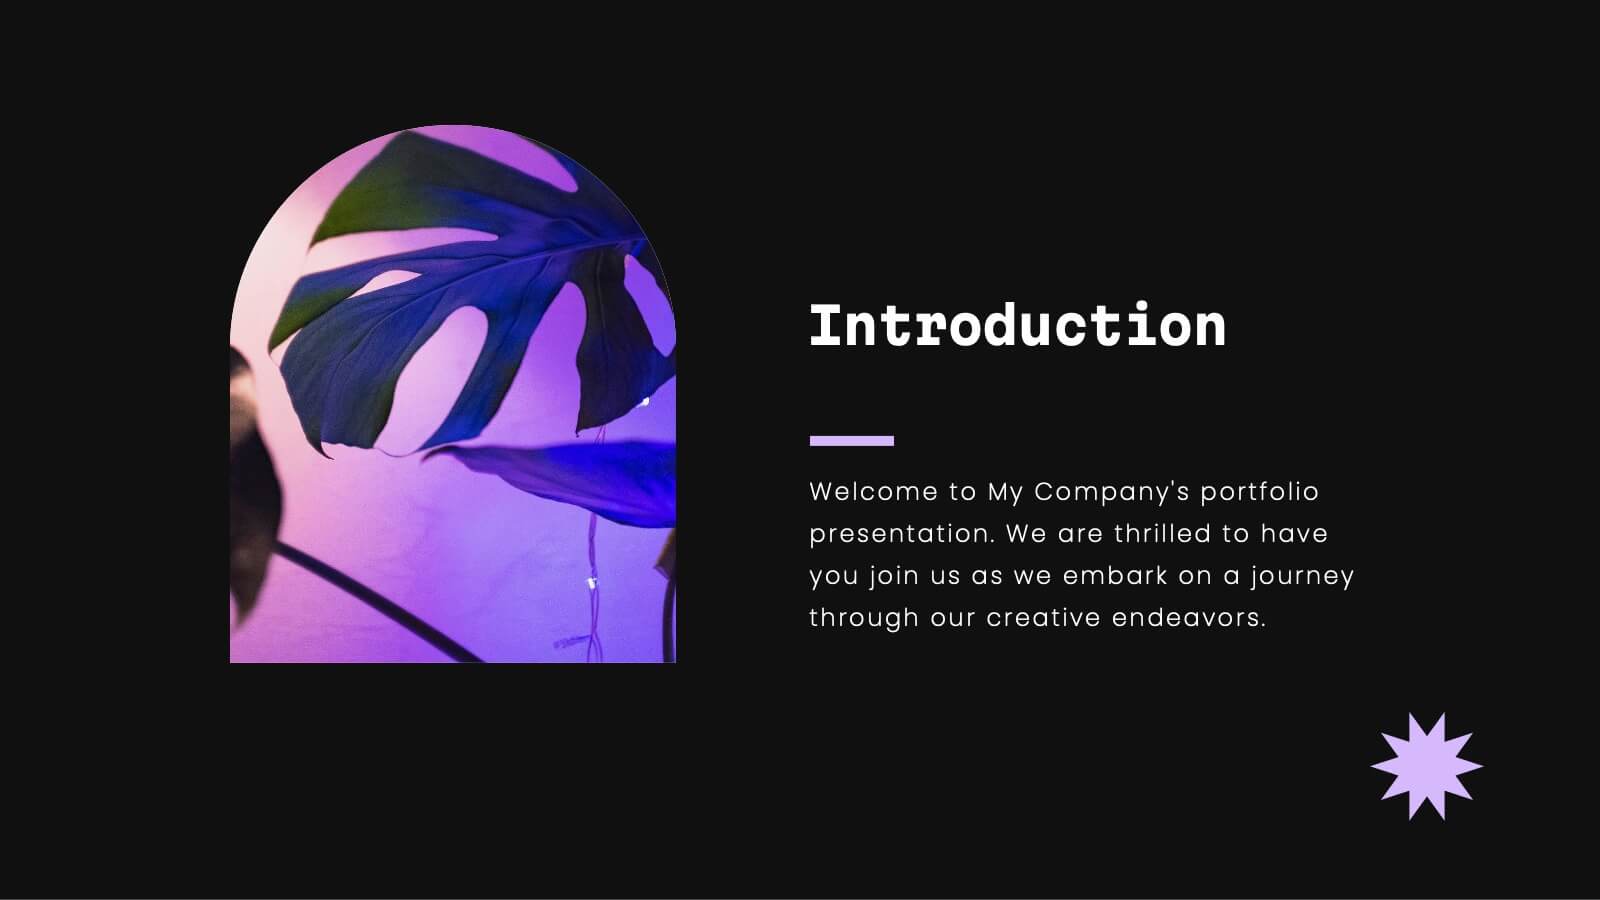
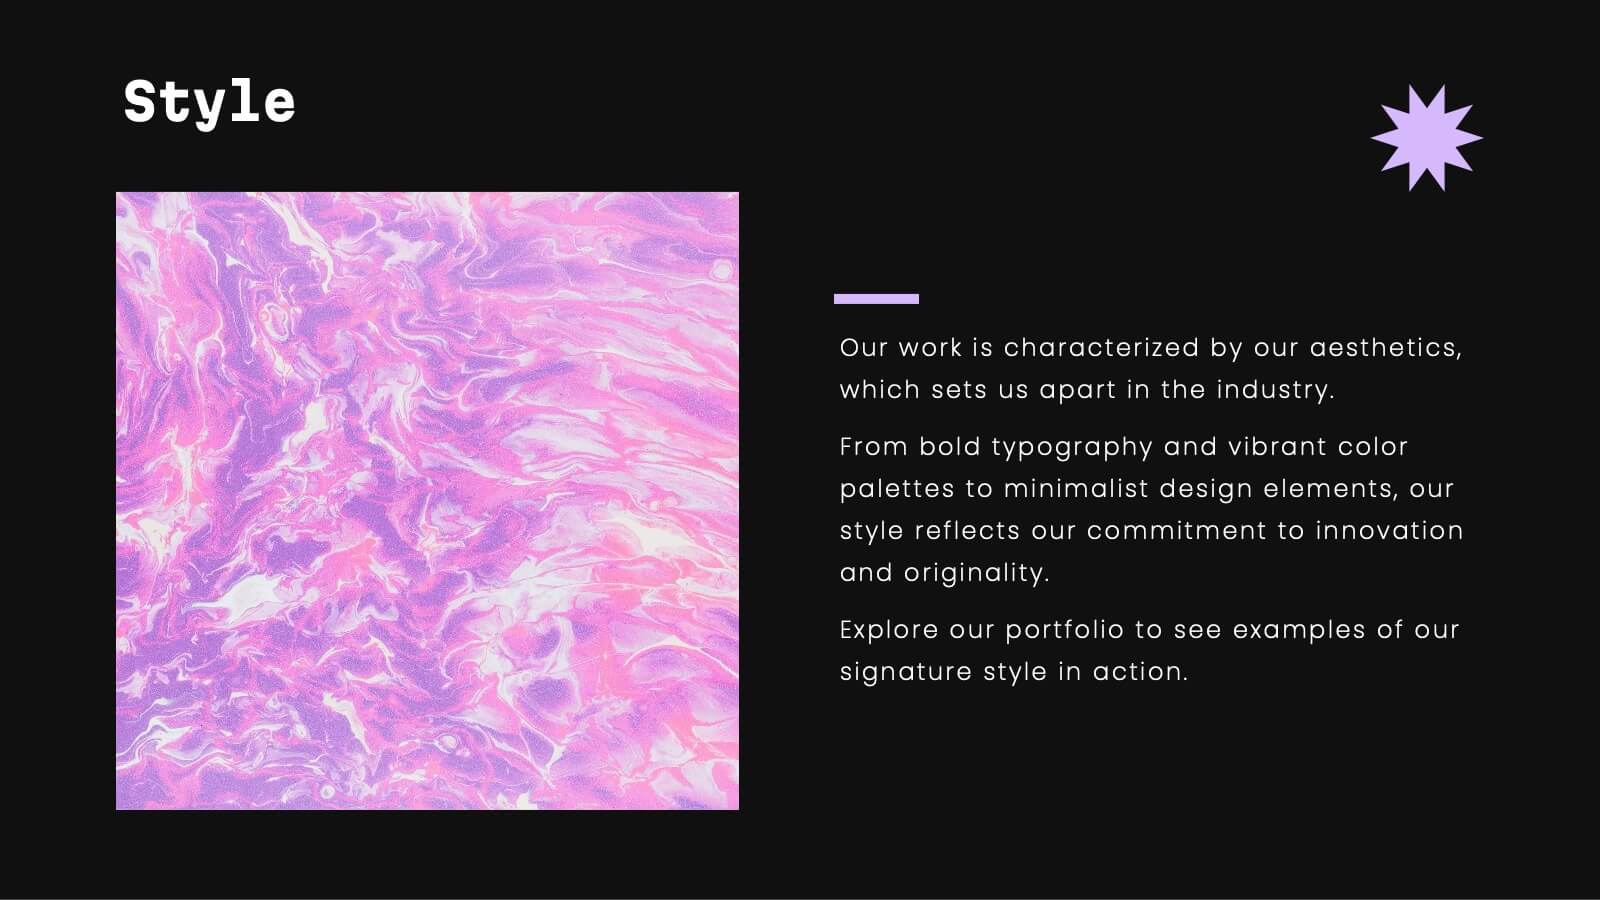
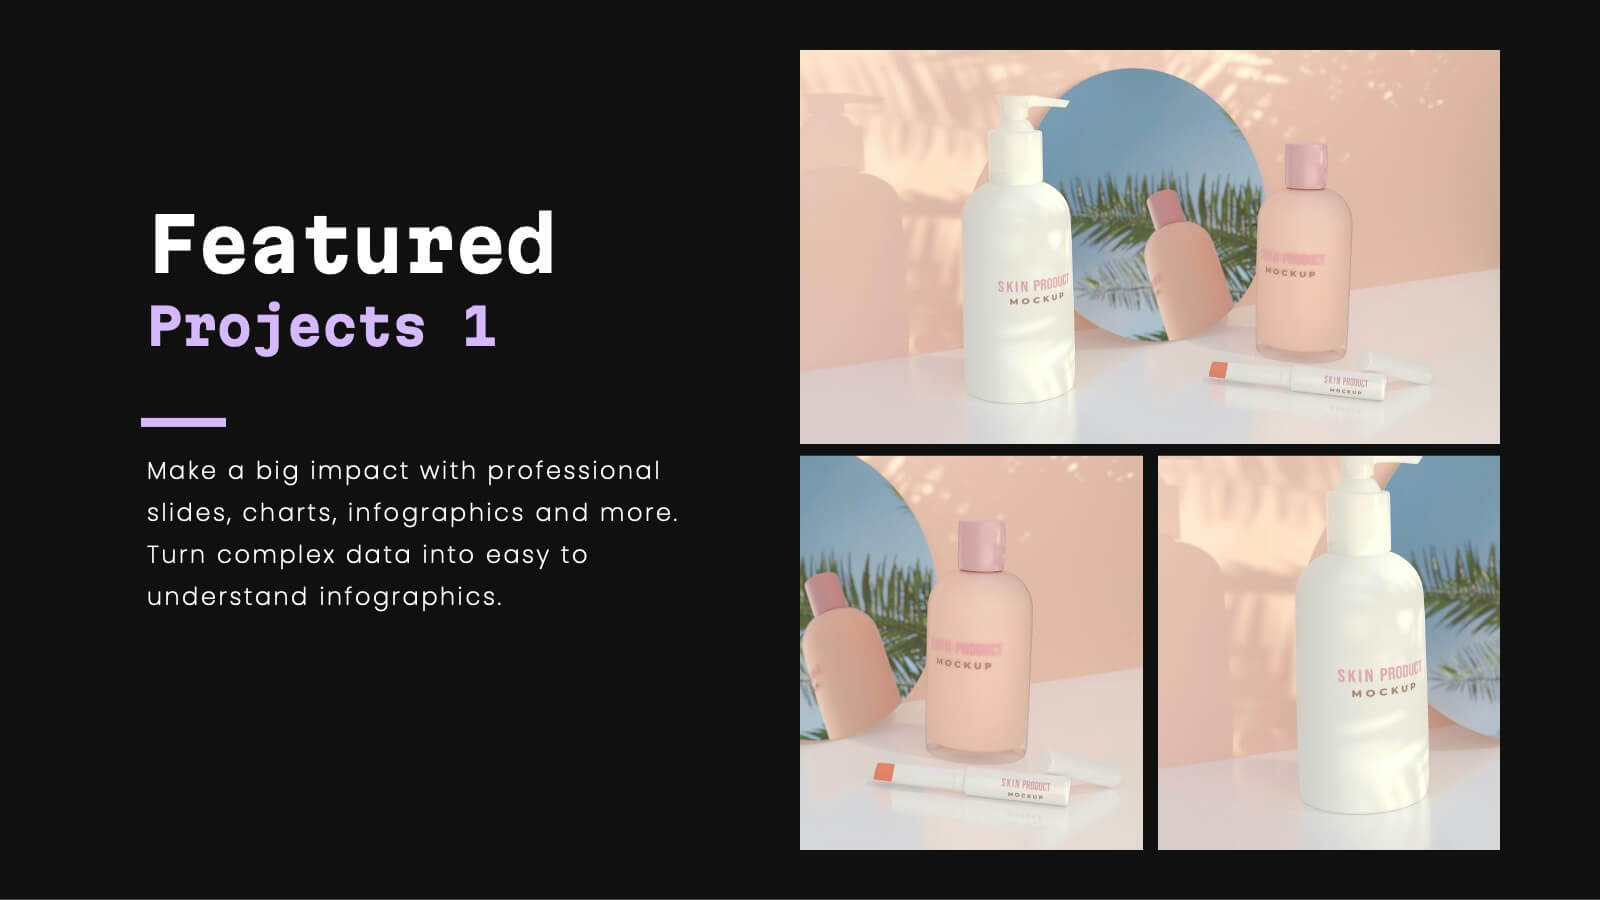
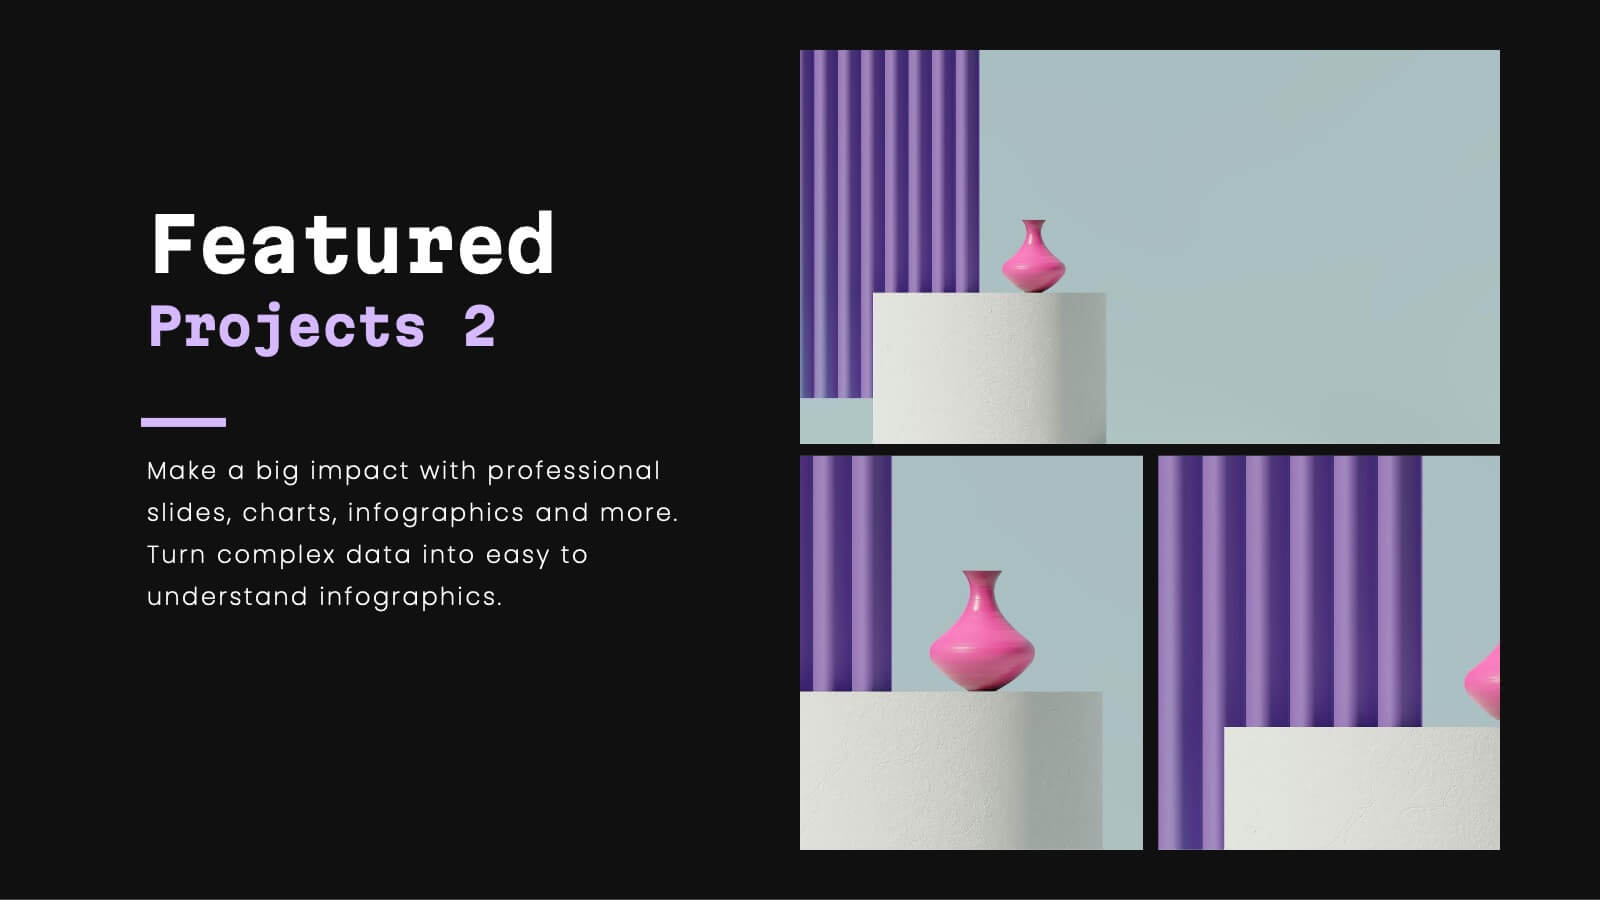
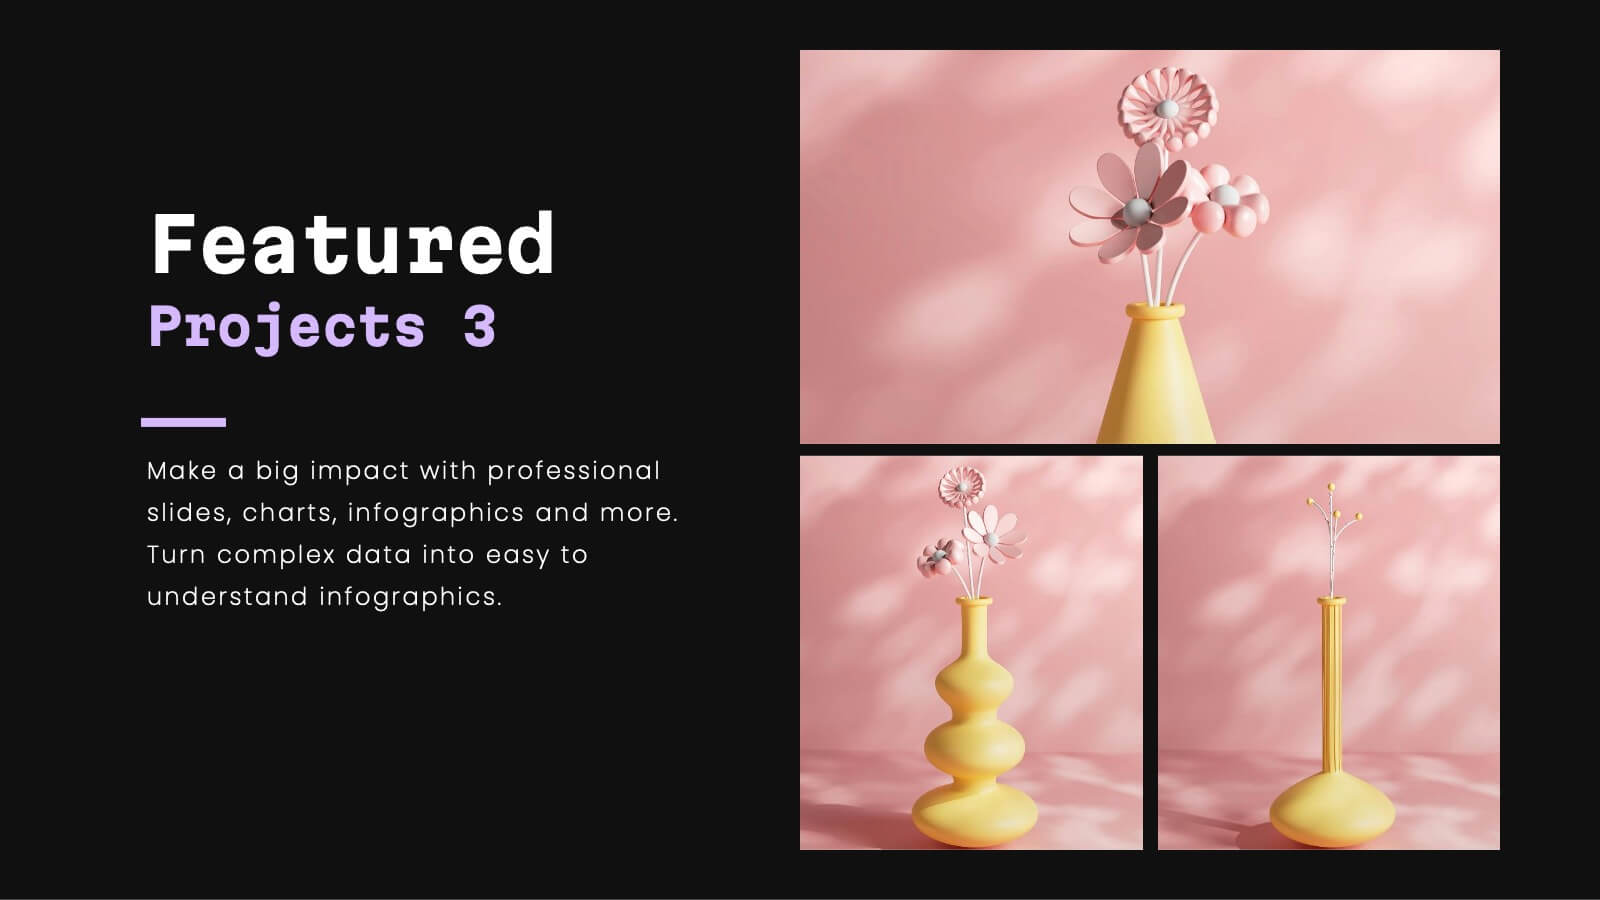
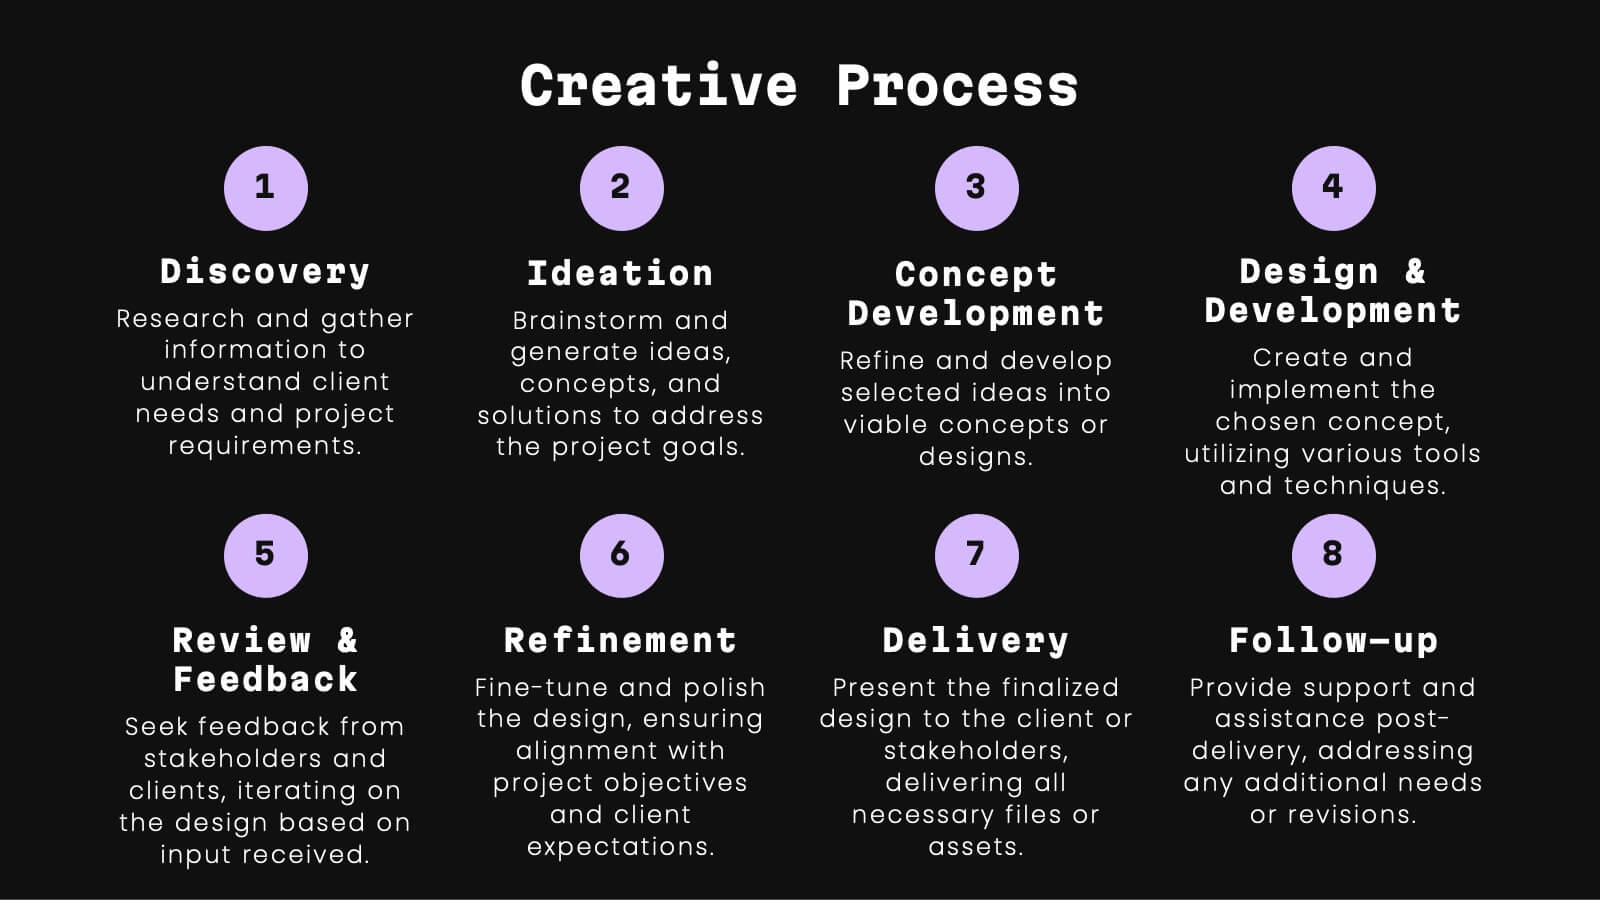
Celeste Professional Portfolio Showcase Presentation
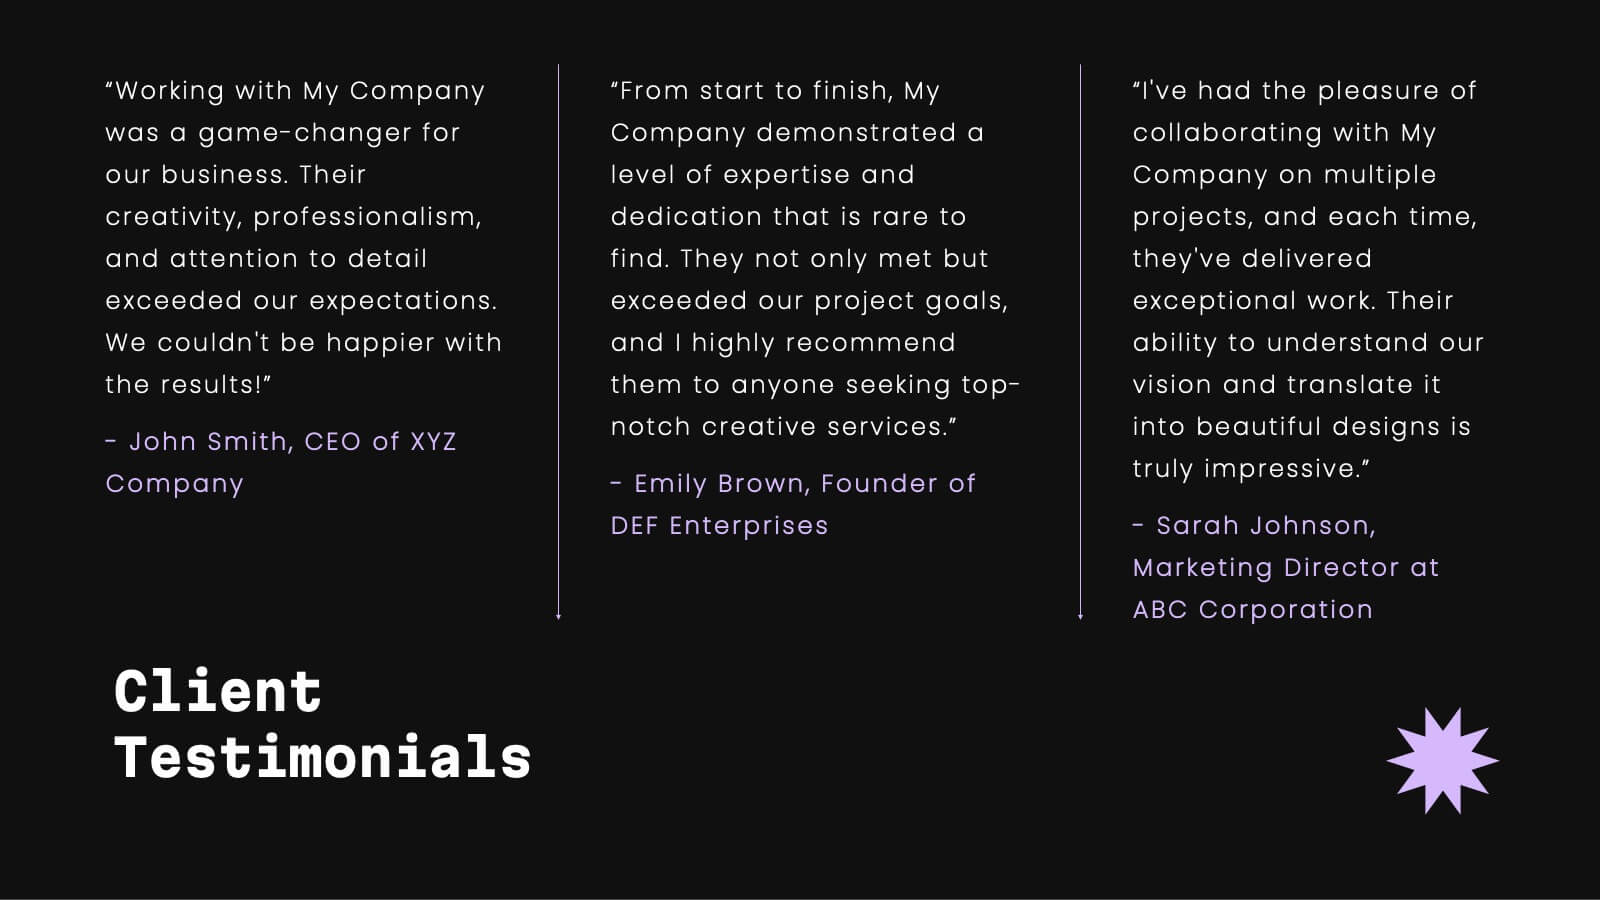
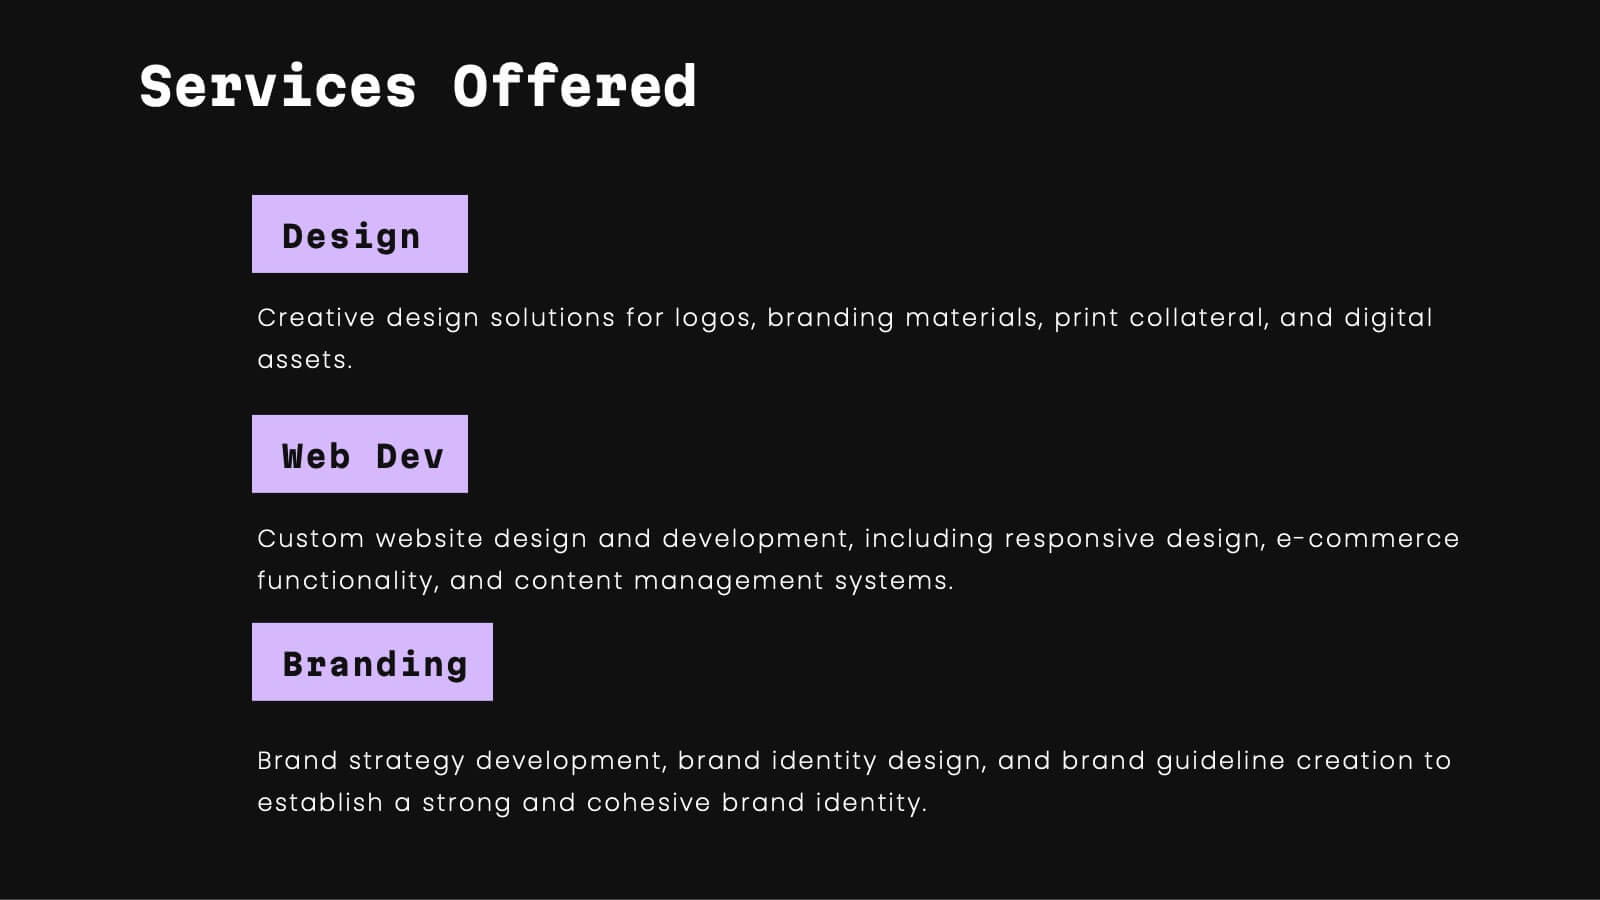
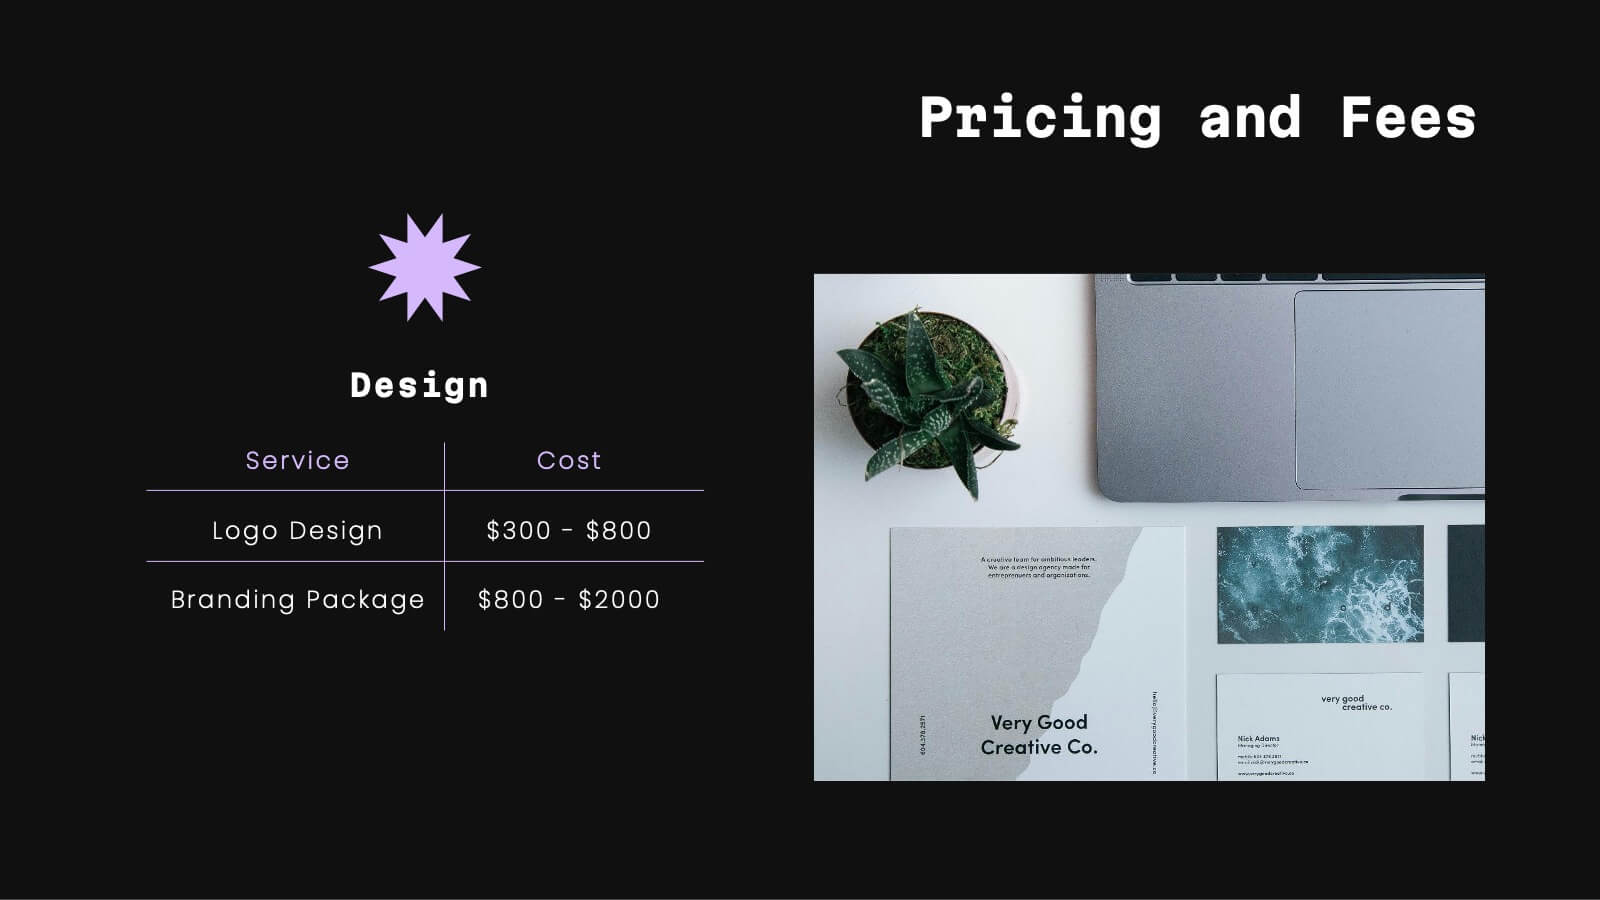
Impress with style using this sophisticated portfolio presentation template. Perfect for showcasing featured projects, creative processes, and client testimonials, this template enhances the visual appeal of your work. Its modern, dark-themed design ensures your content stands out, making a lasting impression. Compatible with PowerPoint, Keynote, and Google Slides, it's versatile for any platform.


3 diapositivas
Logistics and Inventory Flow Strategy Presentation
Visualize your operational flow with the Logistics and Inventory Flow Strategy Presentation. Designed with 3D-style isometric elements, this slide helps illustrate key stages of shipping, warehousing, and delivery. Easily customize icons, colors, and titles to reflect your supply chain or inventory management strategy. Compatible with PowerPoint, Keynote, and Google Slides.


8 diapositivas
Customer Targeting and Persona Creation Presentation
Hook your audience with a clean, modern layout that zooms in on what really matters—your ideal customer. This customer persona template helps visualize traits, behaviors, and key targets for effective marketing. Perfect for campaign planning, branding, or audience research. Fully compatible with PowerPoint, Keynote, and Google Slides.


7 diapositivas
Bowtie Chart for Threat Mitigation Presentation
Visualize and mitigate threats with precision using the Bowtie Chart for Threat Mitigation Presentation. This structured layout highlights risks, controls, and consequences in a mirrored bowtie format—perfect for safety planning, compliance, and risk assessment. Fully customizable in Canva, PowerPoint, Google Slides, and Keynote for seamless integration into your workflow.


7 diapositivas
Organizational Change with 7S Framework Presentation
Visualize organizational transformation with the Organizational Change with 7S Framework Presentation. This slide highlights each element of the McKinsey 7S model—Structure, Strategy, Systems, Shared Values, Skills, Style, and Staff—along an S-shaped flow. Ideal for consulting, internal alignment, and strategic planning discussions. Fully editable in Canva, PowerPoint, Keynote, and Google Slides.


6 diapositivas
Blue Ocean Trade Infographic
The Blue Ocean strategy is a concept that focuses on creating uncontested market spaces rather than competing in existing market segments. This captivating infographic template showcases the concept of blue ocean trade and its impact on business growth and innovation. It provides an engaging and informative overview of the blue ocean strategy, highlighting its key principles and benefits for businesses. This template provides a comprehensive overview of blue ocean trade and serves as an inspiring resource for those seeking innovative business strategies. Fully compatible with Powerpoint, keynote, and Google Slides.