


Características


¿Tienes alguna pregunta?
Recomendar


10 diapositivas
Lean Business Model Planning Presentation
Streamline your startup strategy with this Lean Canvas presentation template. Designed for entrepreneurs and agile teams, it breaks down your business plan into 9 essential blocks—from Problem and Solution to Revenue Streams and Cost Structure. Easy to edit in PowerPoint, Keynote, or Google Slides for fast, effective planning and pitch presentations.


4 diapositivas
Digital Marketing Strategy Presentation
Present your marketing insights with impact using this engaging digital marketing strategy slide. Featuring a modern bar chart with layered 3D blocks and icon-labeled highlights, this slide is perfect for showcasing strategy breakdowns, campaign priorities, or market performance data. Customize each section with concise titles and professional content. Ideal for marketers, agencies, and analysts. Fully editable in PowerPoint, Keynote, and Google Slides.


5 diapositivas
Business Decision-Making Questions
Streamline critical thinking with this interactive Business Decision-Making Questions template. Featuring a creative circular diagram and visual cues, it helps structure questions around options, evaluations, and outcomes. Ideal for brainstorming, strategic planning, and executive decision sessions. Fully editable in PowerPoint, Keynote, and Google Slides.


8 diapositivas
3D Infographic Design Presentation
Make your data pop—literally—with a stacked design that brings depth and clarity to your message. This 3D infographic template helps break down layered concepts, step-by-step processes, or hierarchical data in a visually striking way. It’s fully customizable and compatible with PowerPoint, Keynote, and Google Slides for easy presentation building.


7 diapositivas
Service Finance Infographic
Service finance refers to the management of financial resources, transactions, and strategies within the service industry. This infographic template ensures that the services provided are financially sustainable, meet customer needs, and contribute to the overall growth and success of the organization. Fully customizable and compatible with Powerpoint, Keynote, and Google Slides. Showcase the dynamics that drive the financial world, uncovering the core elements of the ecosystem. This infographic will encourage action and invite your audience to embrace a financial renaissance, soaring towards their prosperous future.


6 diapositivas
Top Benefits Breakdown Presentation
Showcase your strongest advantages with a clean, structured layout that highlights each benefit clearly and effectively. This modern design is perfect for presenting key selling points, service features, or strategic highlights in a professional way. Fully customizable and compatible with PowerPoint, Keynote, and Google Slides for seamless editing and presentation.


7 diapositivas
Executive Summary Plan Infographic Presentation
An Executive Summary Infographic is a visual representation of the key points and highlights of a longer report or document. Use this creative template as a way to present complex information in a simplified and visually appealing way, allowing busy executives and decision-makers to quickly understand the main findings and recommendations. This template includes a mix of charts, graphs, and other visual elements, along with text. This template's purpose is to help busy executives and decision-makers understand the main points of a report, without having to read through the entire document.


5 diapositivas
Healthcare Industry Report
Deliver key medical insights with this modern, stethoscope-themed slide. Ideal for showcasing health metrics, clinical data, or medical updates, the layout includes four sections with health icons and clear callouts for easy readability. Fully customizable in PowerPoint, Keynote, and Google Slides.


2 diapositivas
Professional Closing Thank You
End your presentation with clarity and professionalism using this bold yet minimalist "Thank You" slide. Designed with modern aesthetics and contact detail placeholders, it’s ideal for business reports, marketing decks, and corporate pitches. Fully customizable in PowerPoint, Keynote, and Google Slides.


4 diapositivas
Workforce Skills Gap Plan Presentation
Ignite smarter workforce planning with a clear, engaging visual that highlights current capabilities, needed competencies, and actionable steps to close performance gaps. This presentation helps leaders map priorities, streamline development efforts, and strengthen team readiness for future demands. Fully compatible with PowerPoint, Keynote, and Google Slides.


5 diapositivas
Dealing With Cyberbullying Infgraphics
Cyberbullying refers to the act of using digital communication platforms such as social media, instant messaging, online forums, or email to harass, intimidate, or harm others. This infographic template is designed to raise awareness about cyberbullying and provide guidance on how to effectively deal with it. This template aims to educate individuals, parents, educators, and organizations about the impact of cyberbullying and empower them to prevent and address this issue. This template can be used by schools, community organizations, or online safety advocates to raise awareness about cyberbullying, and foster a safer online environment.


21 diapositivas
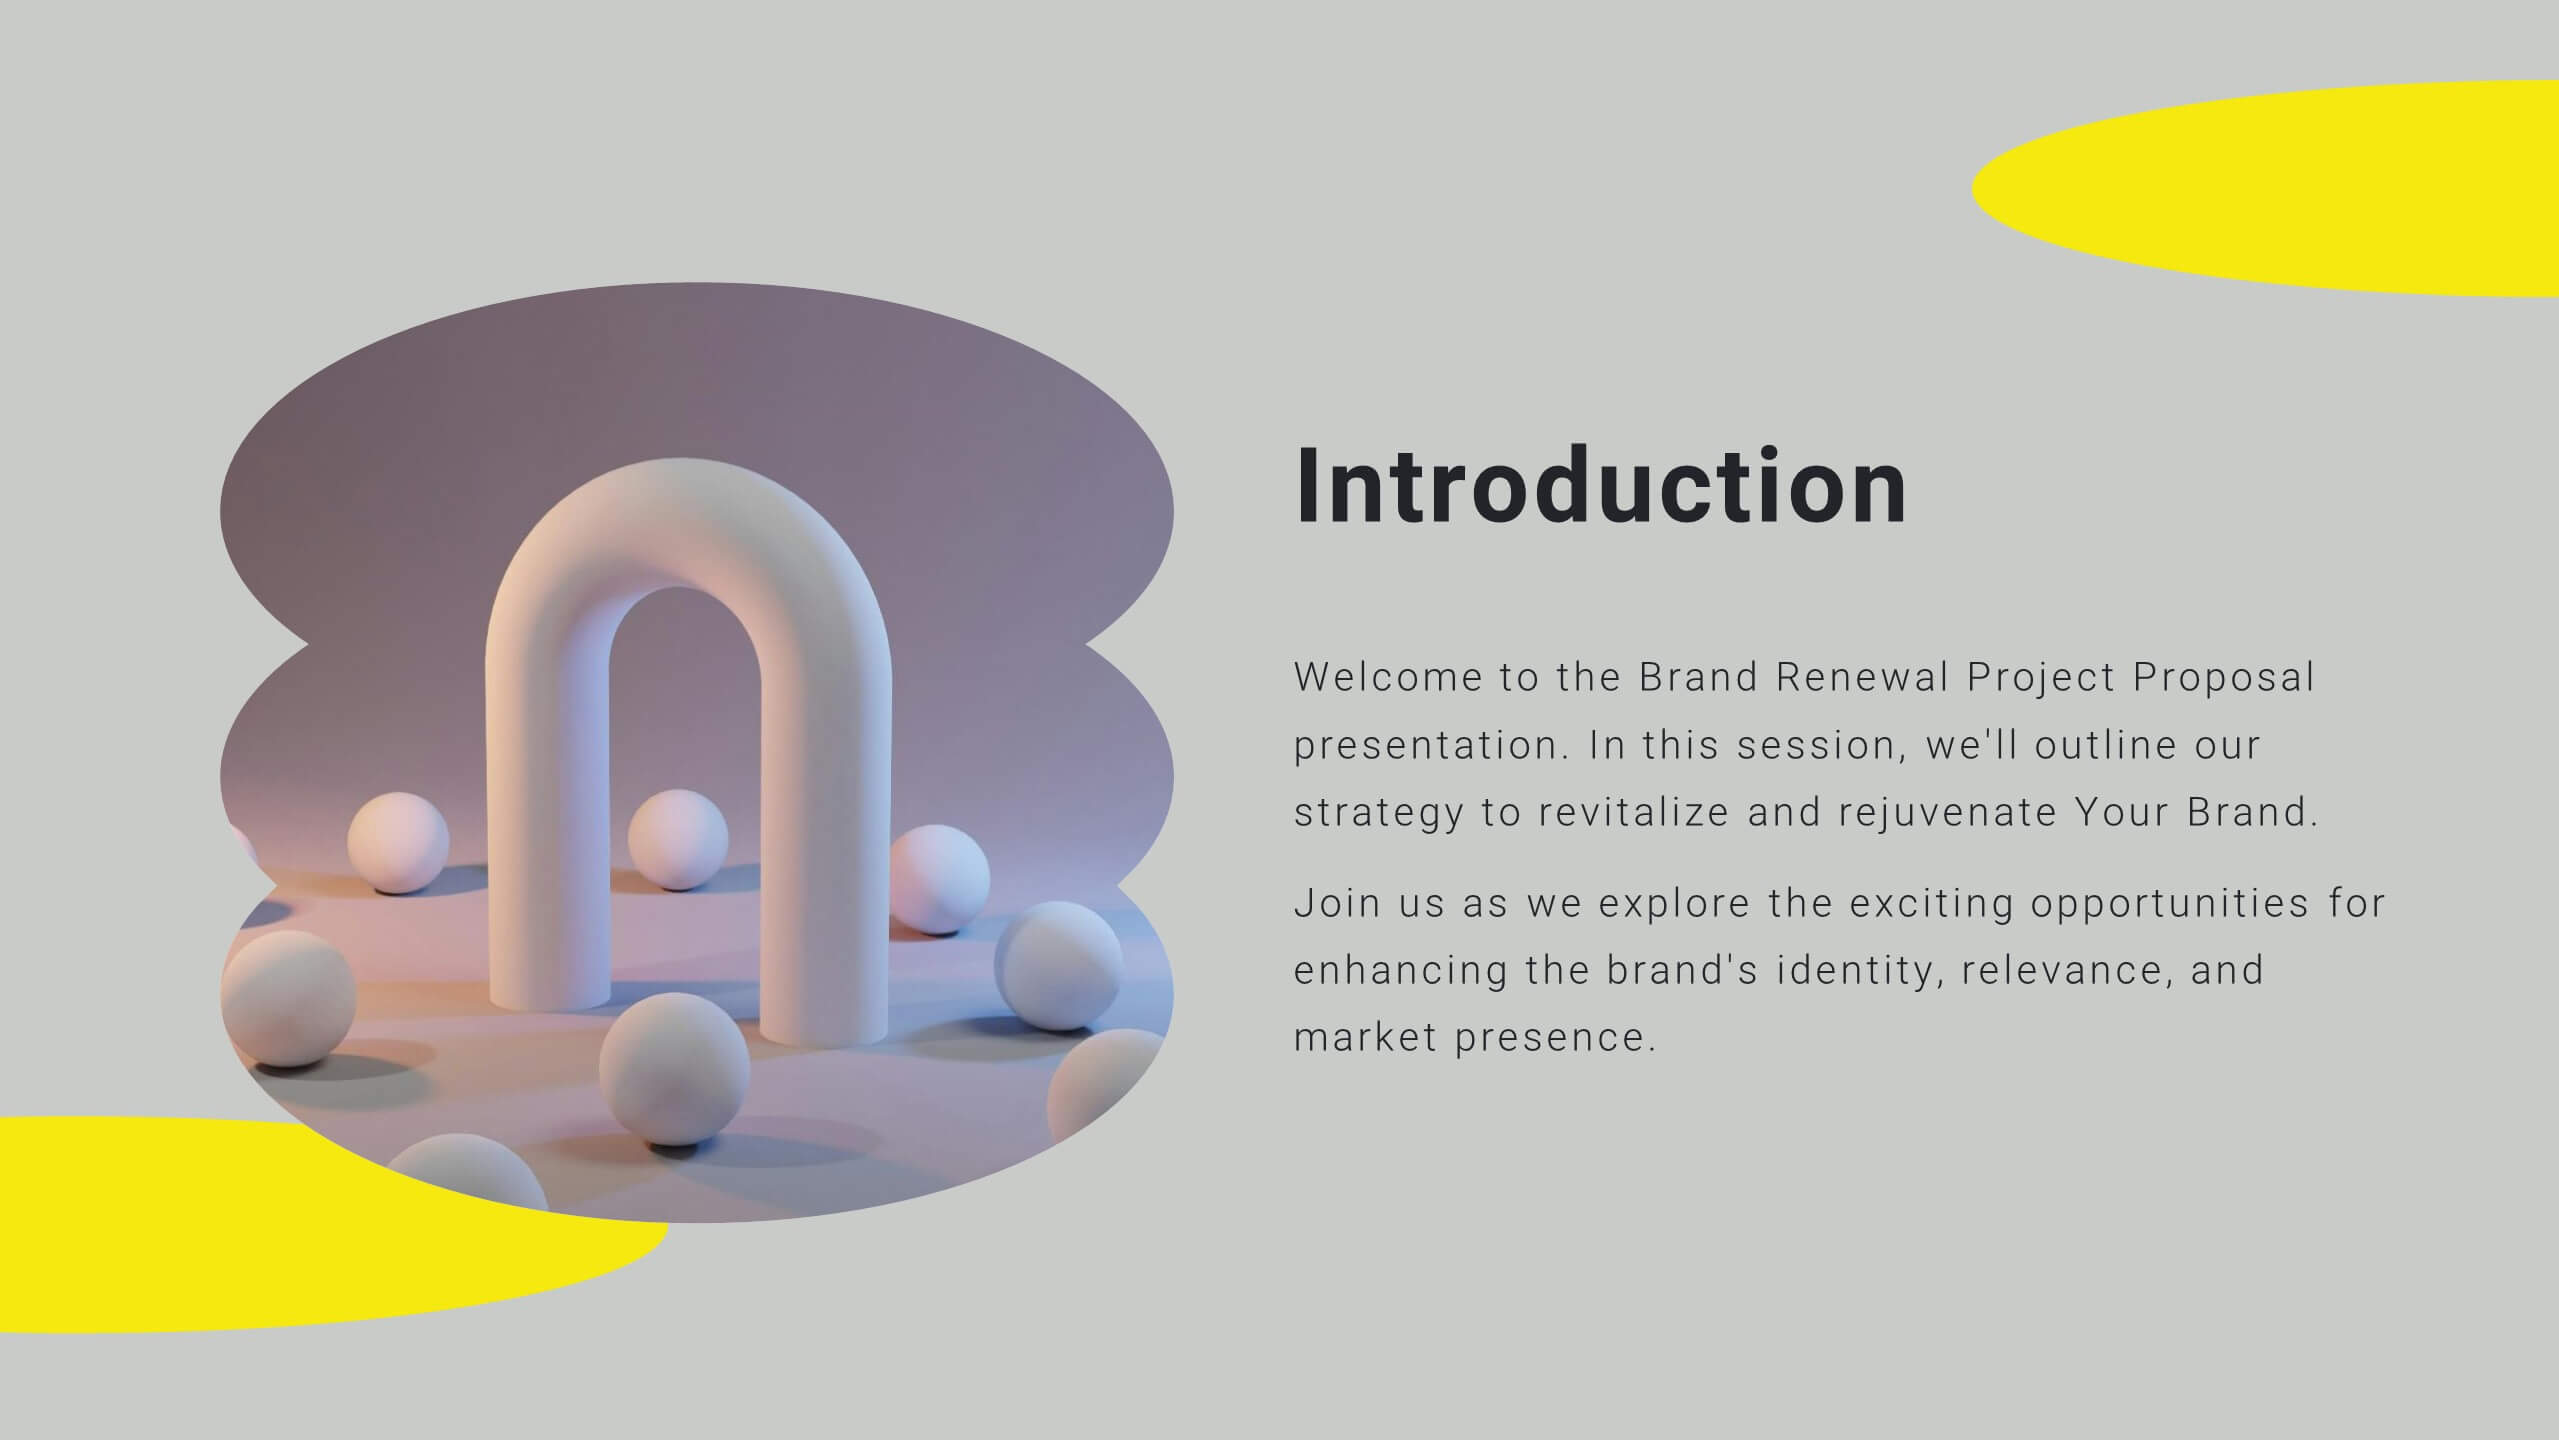
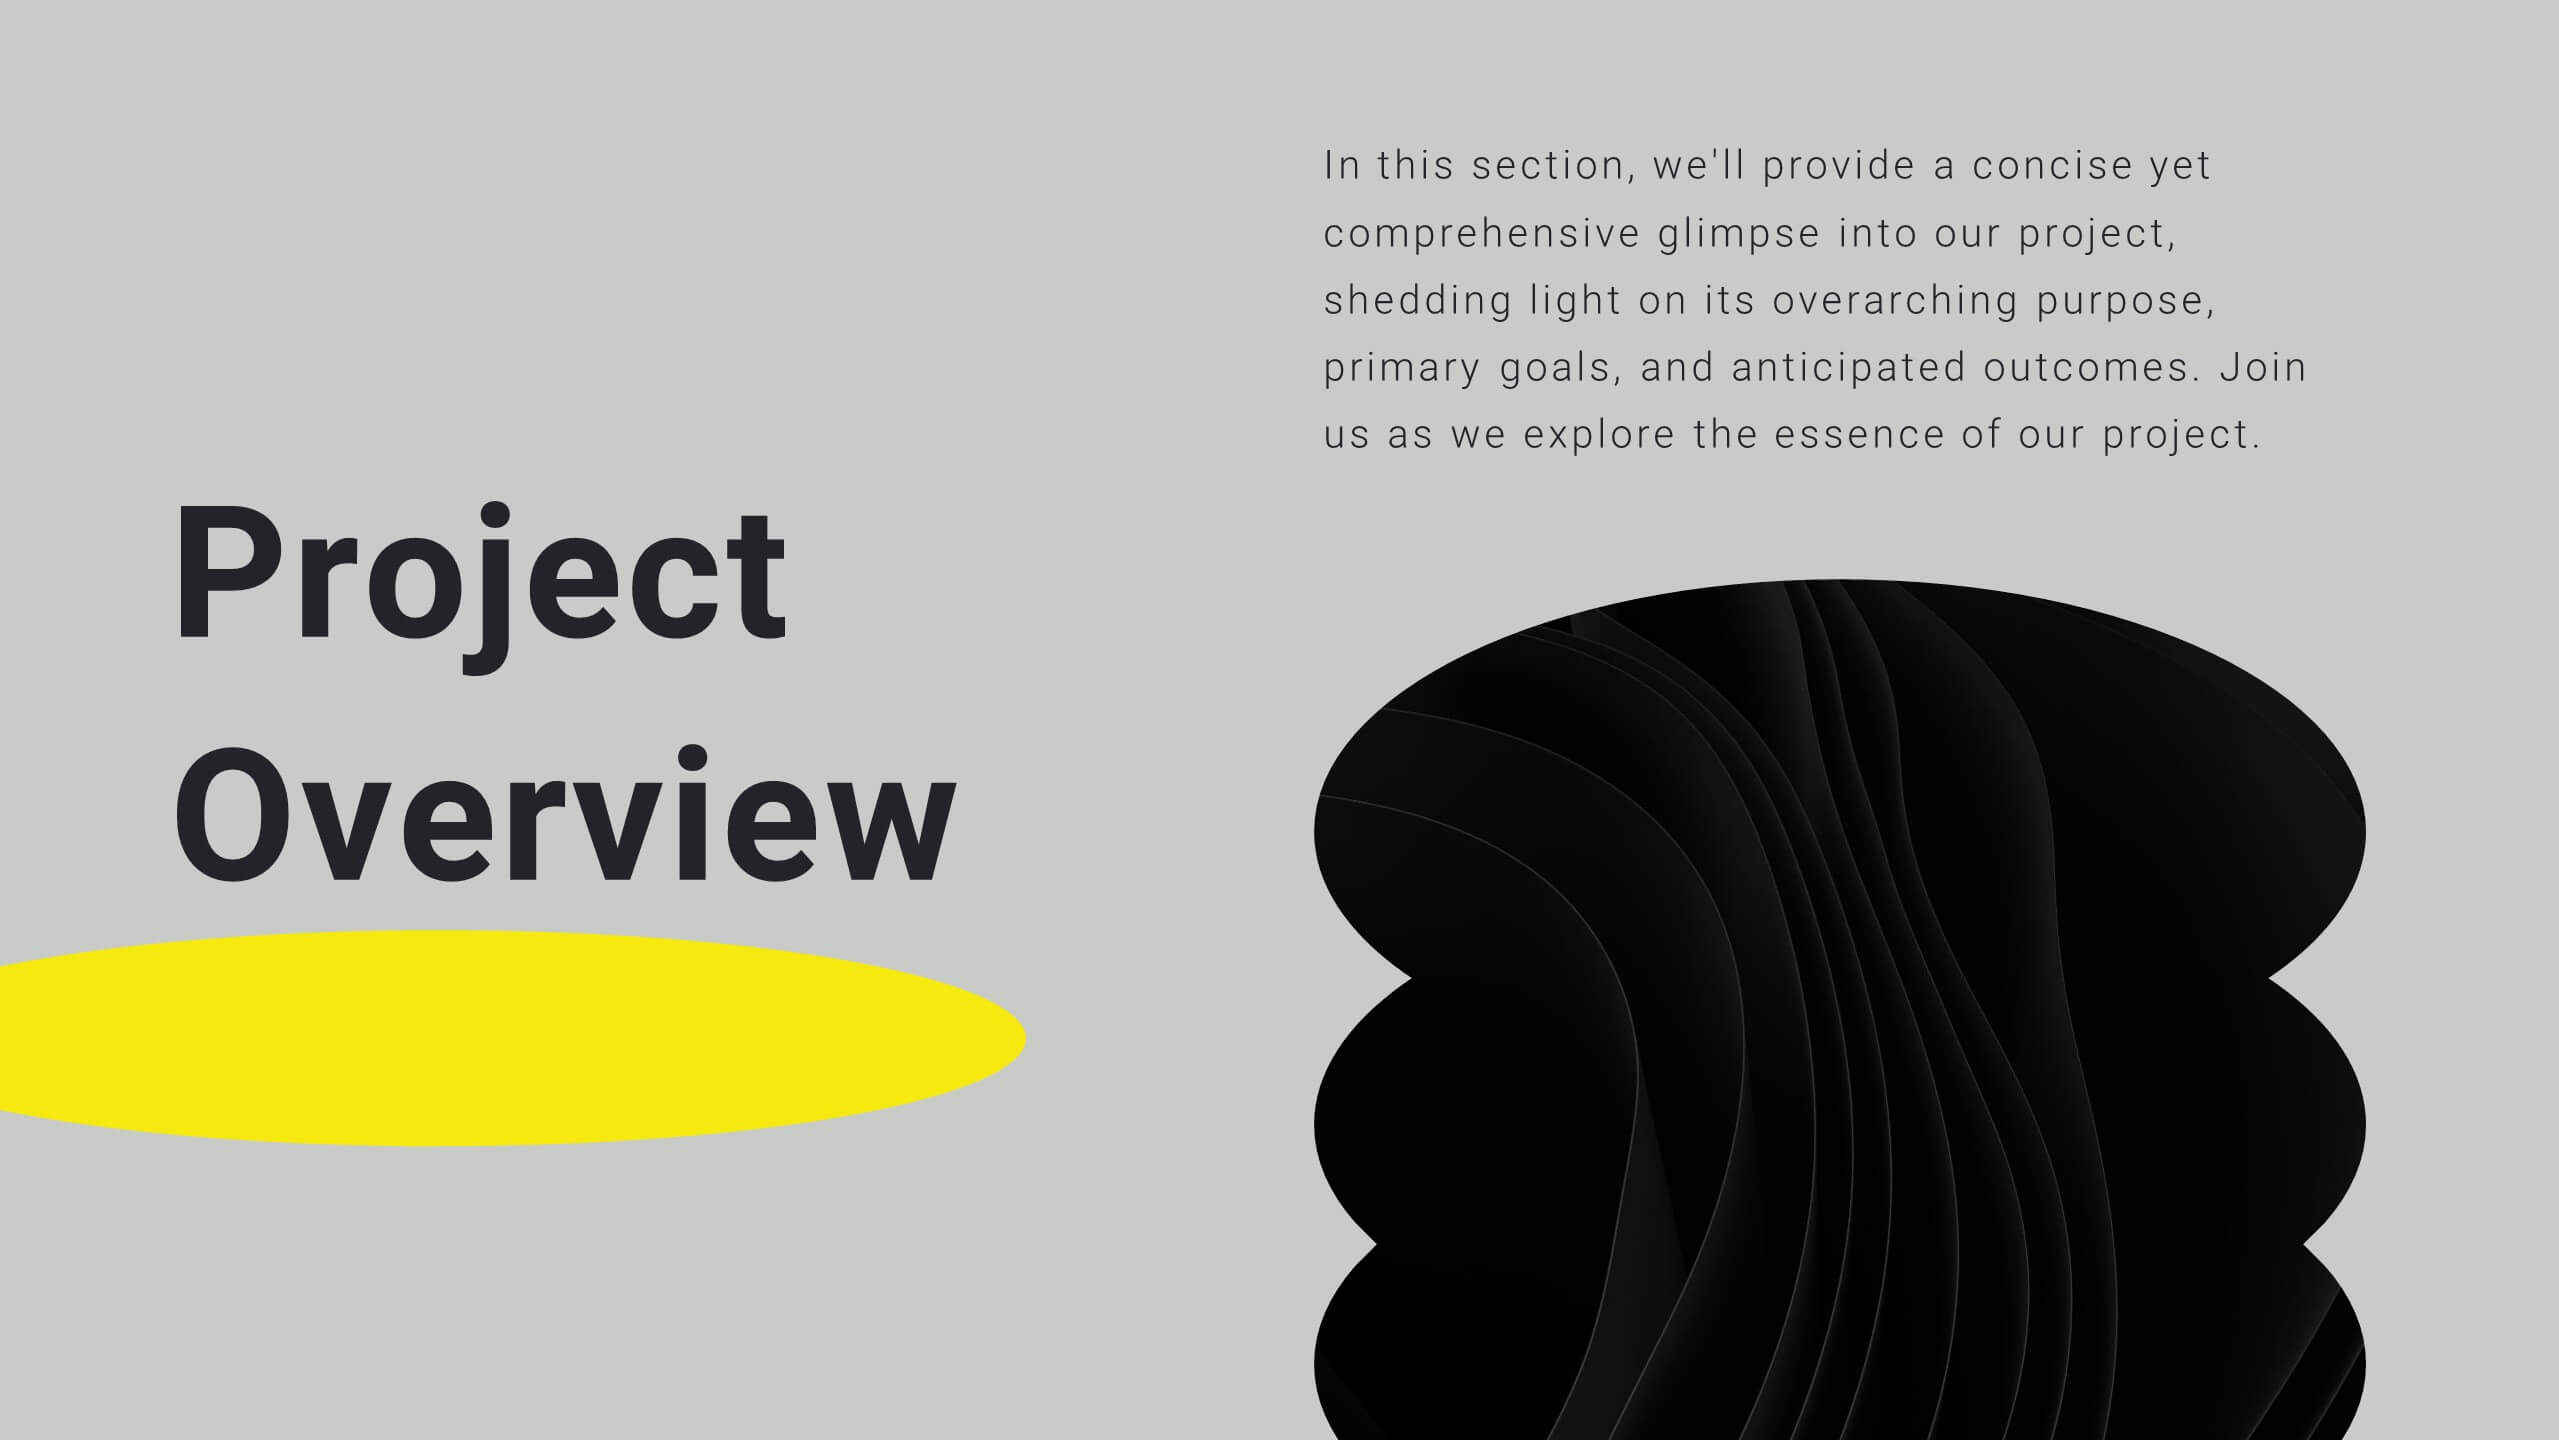
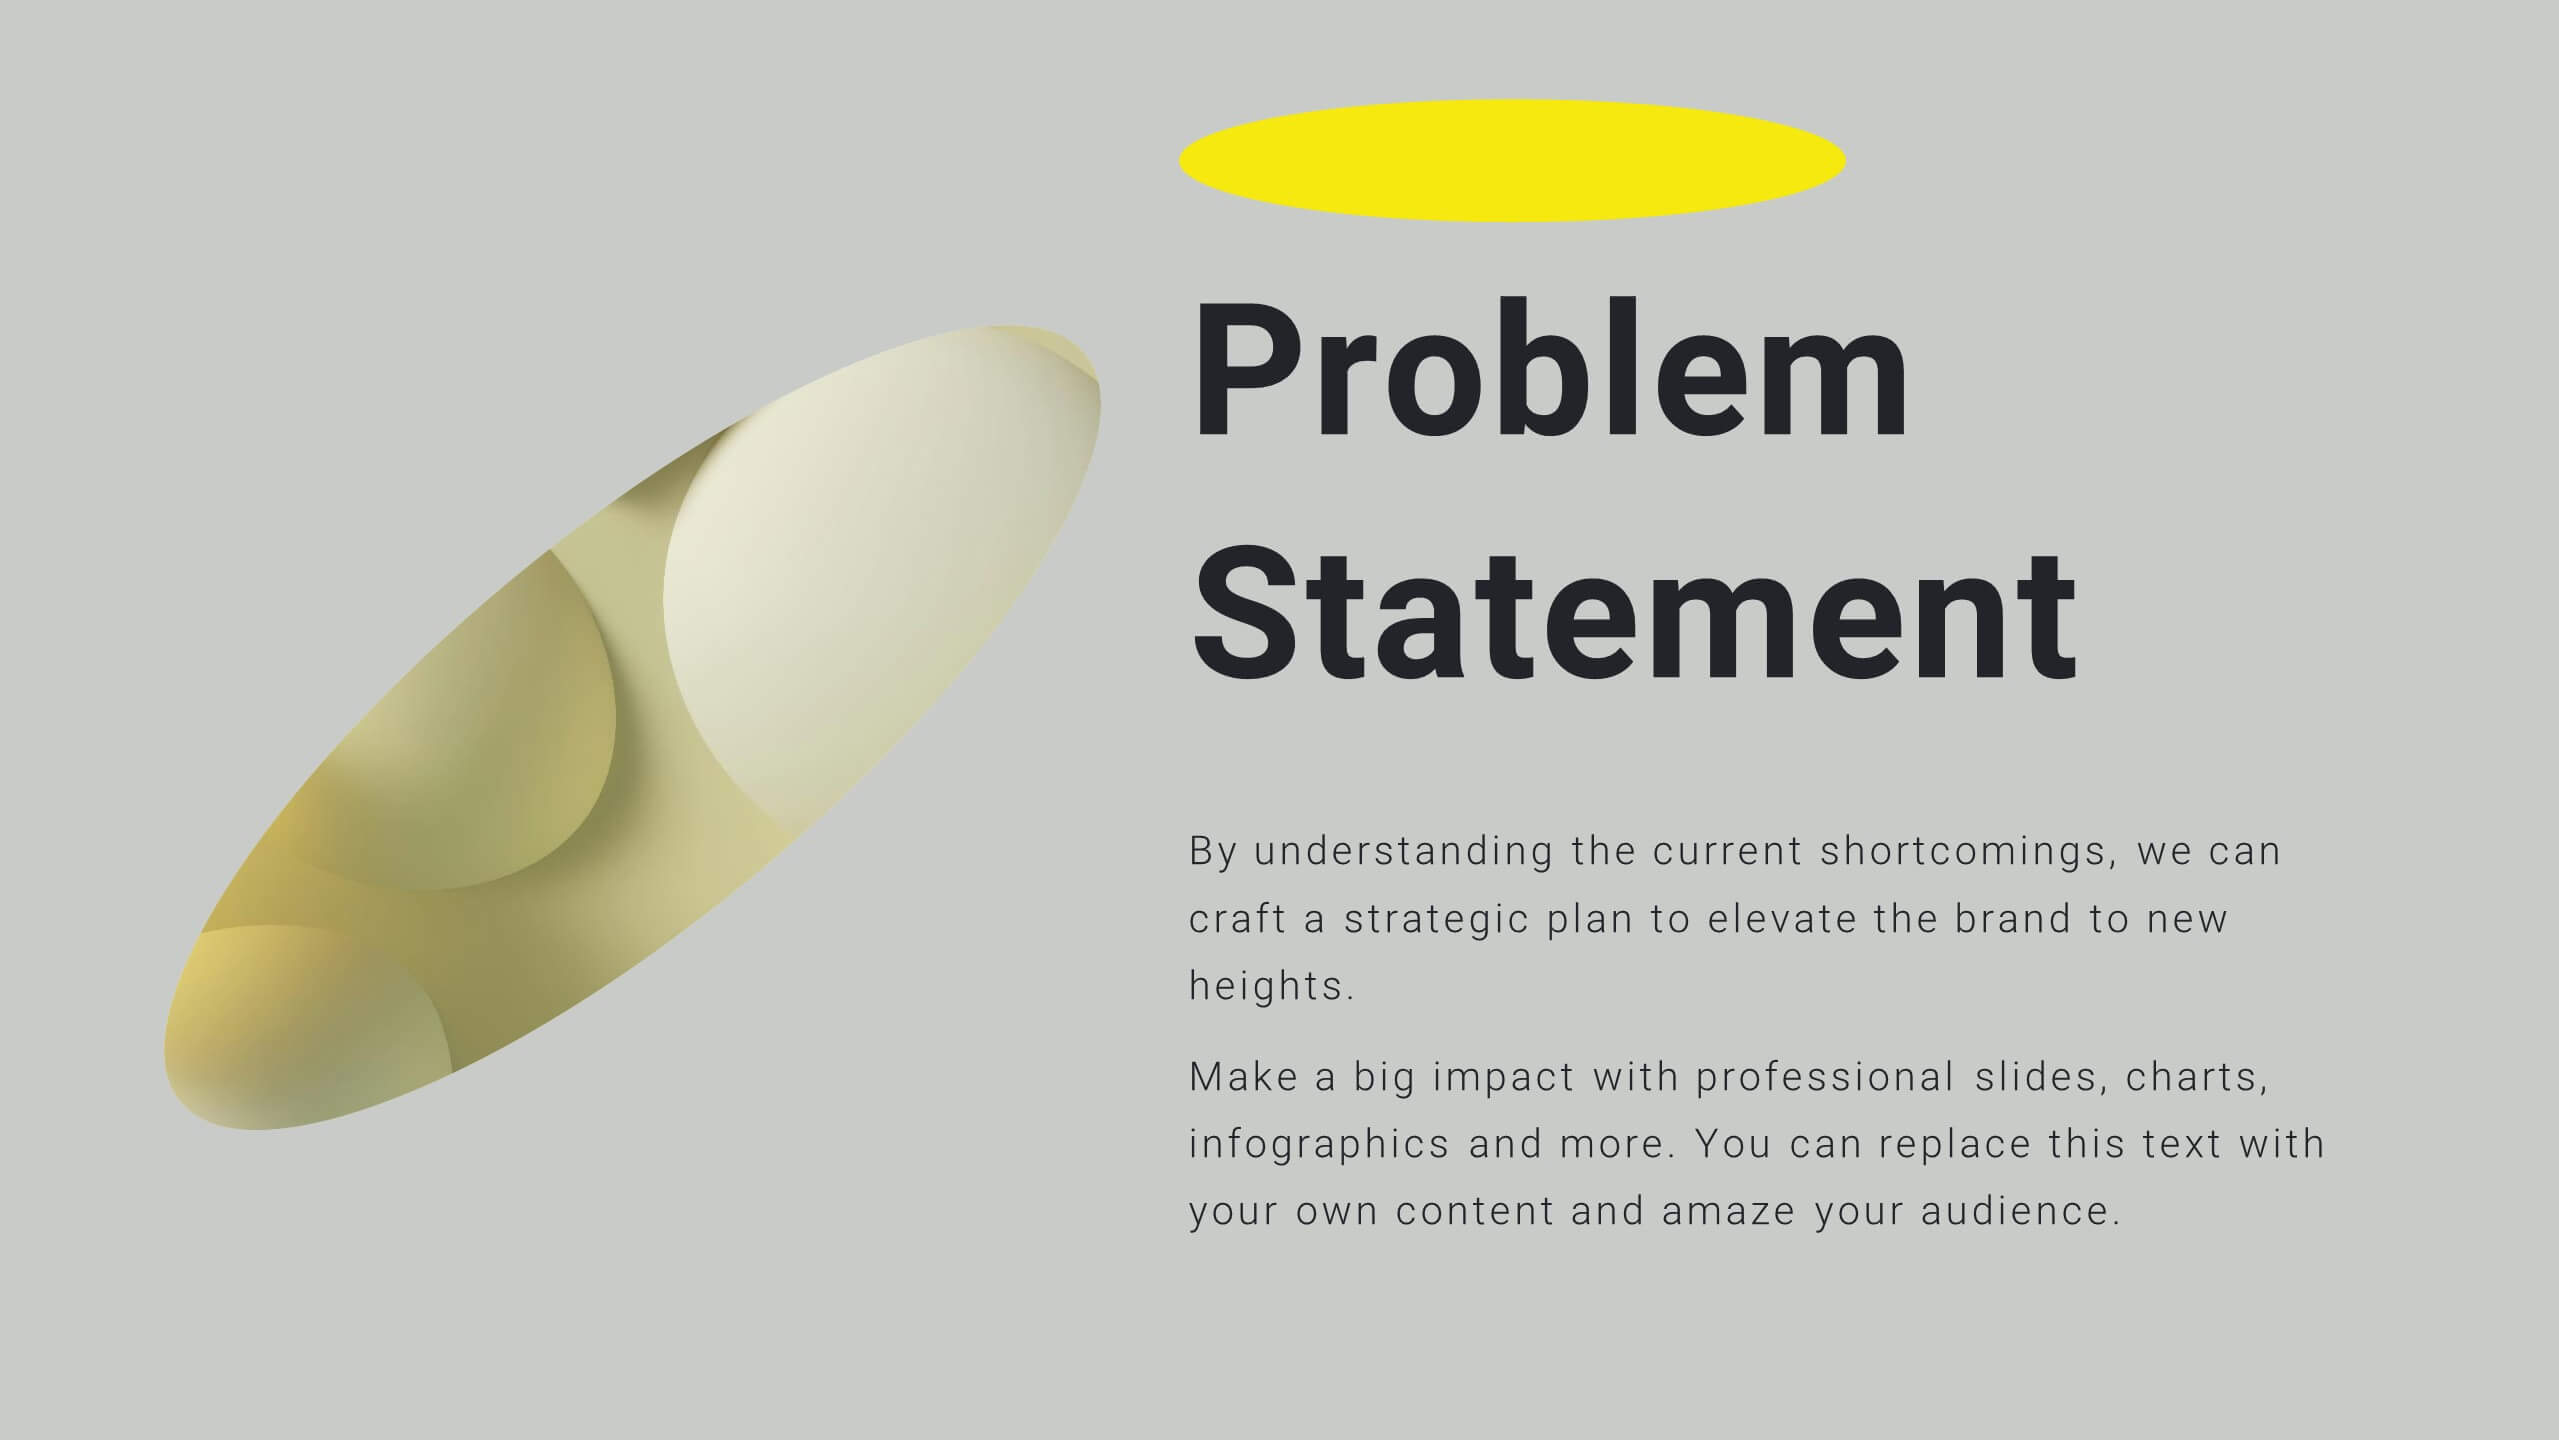
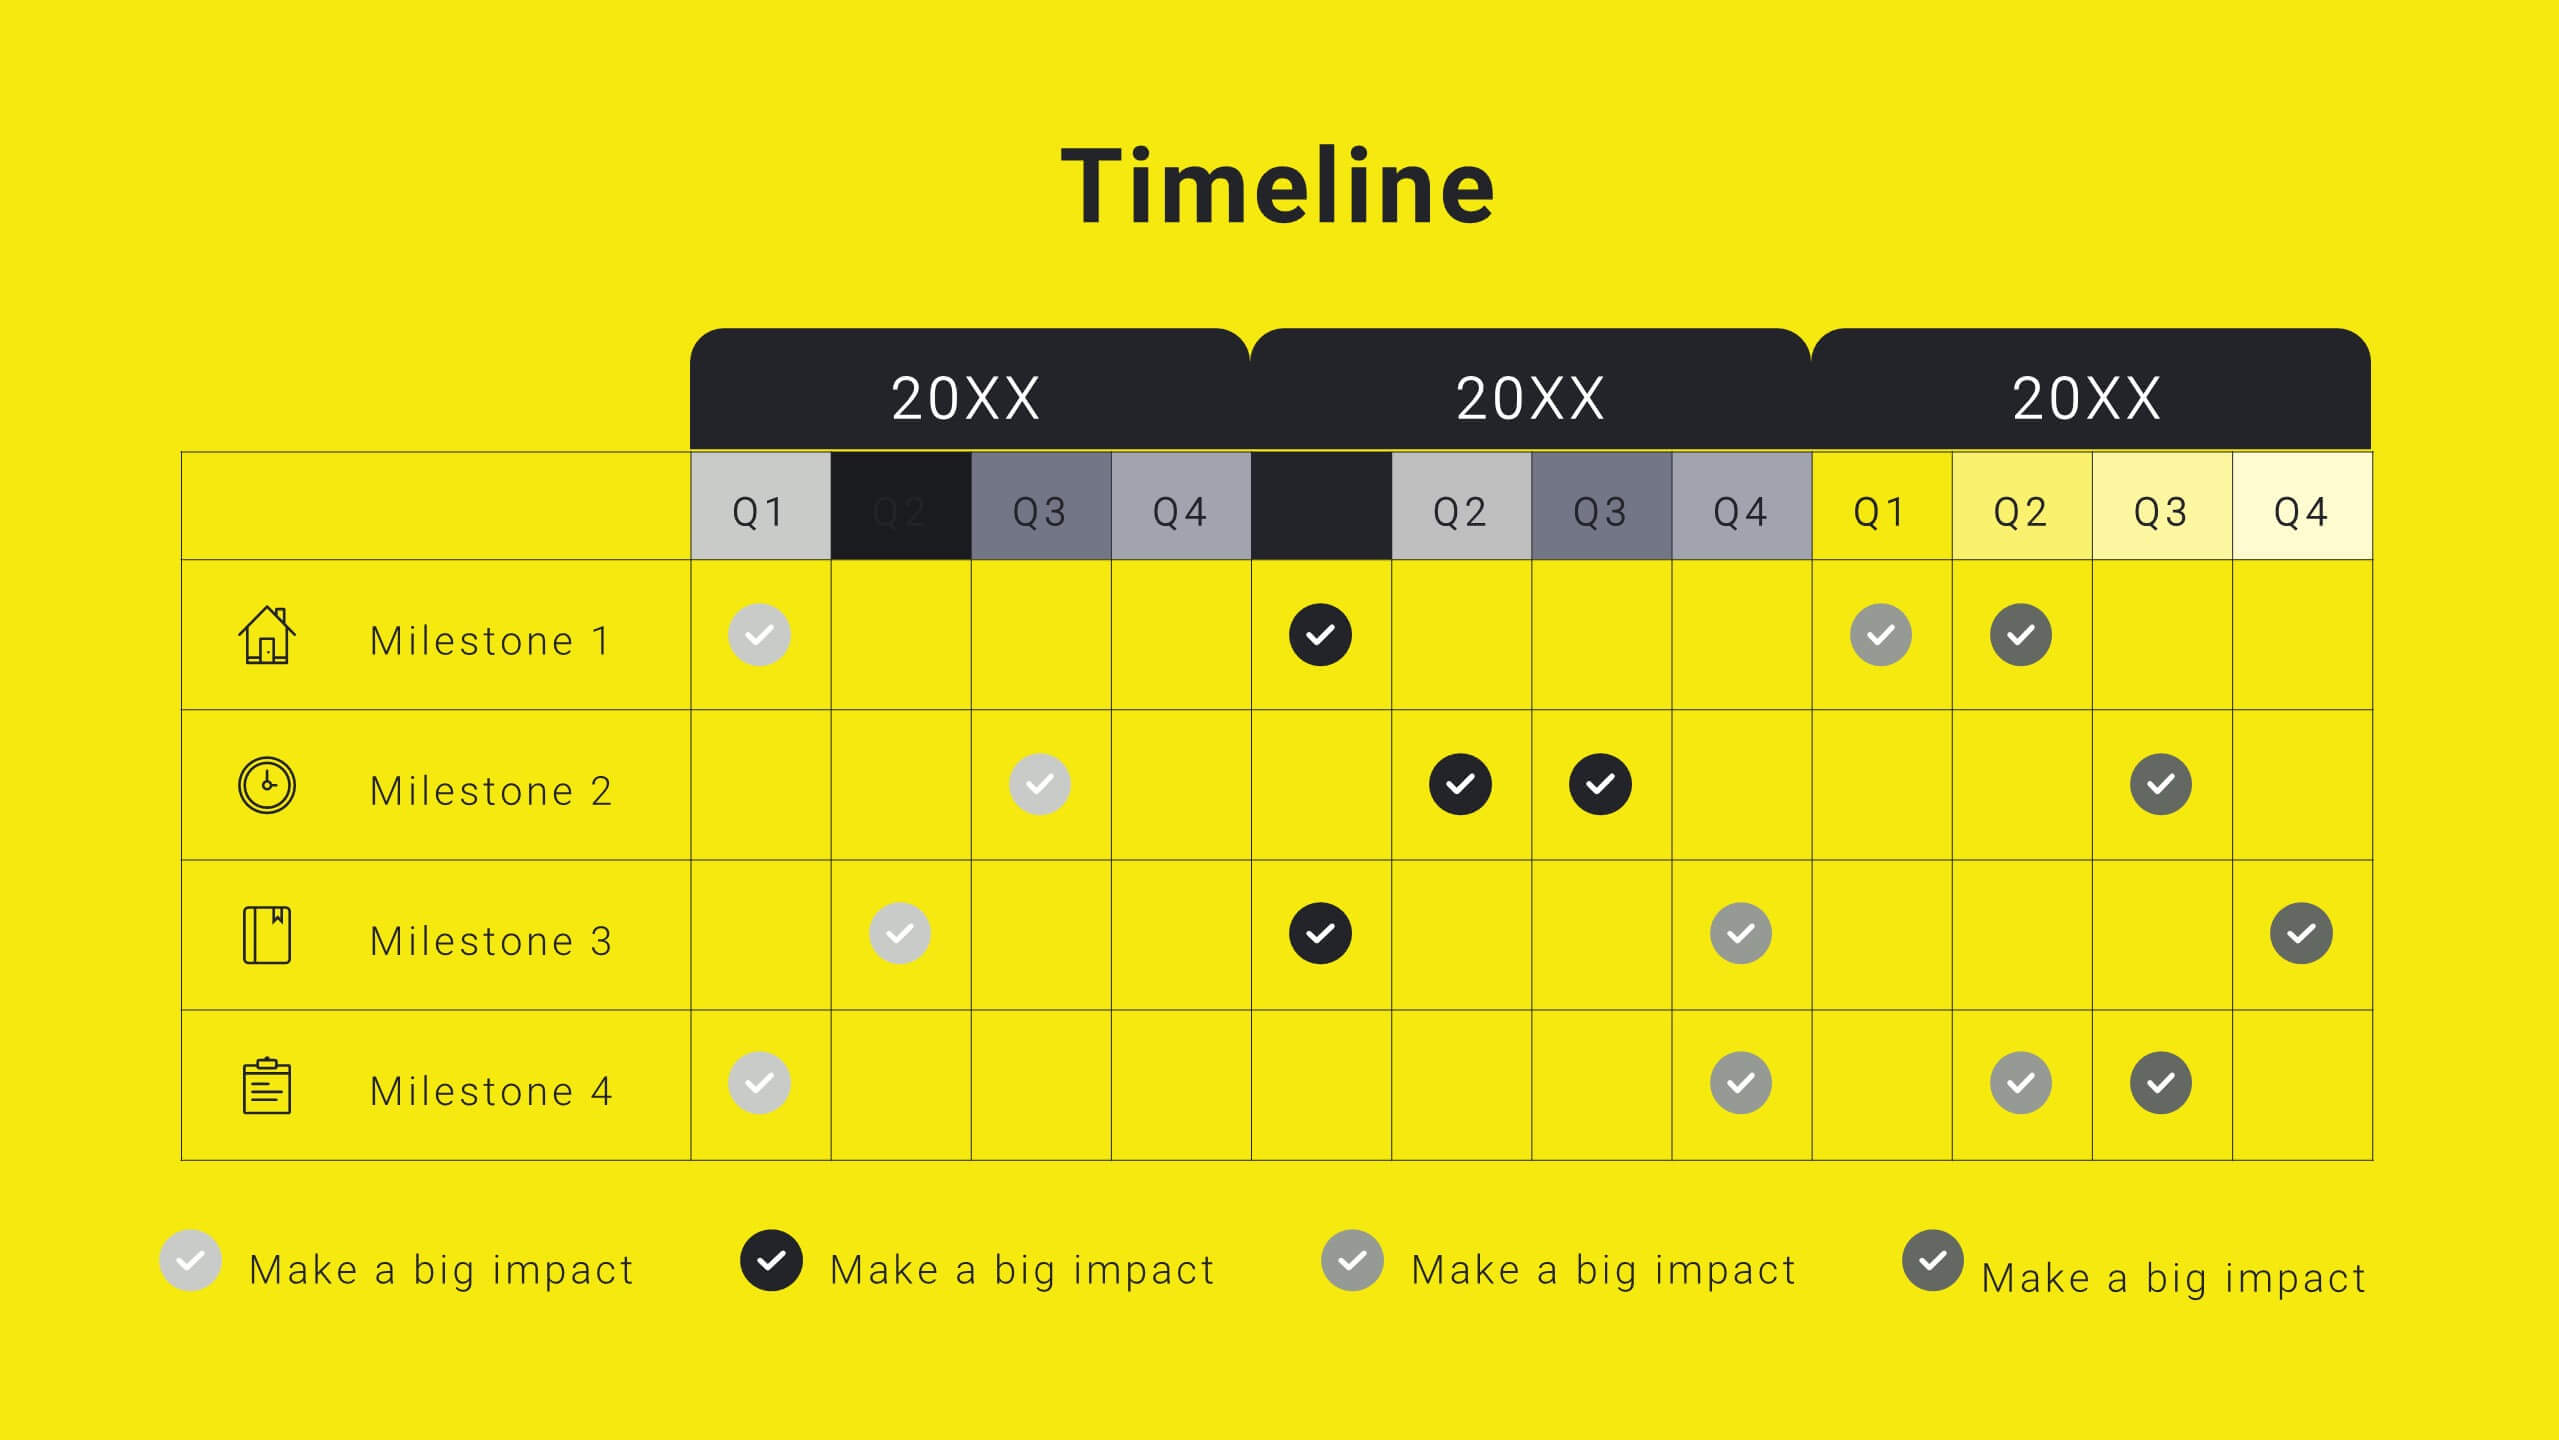
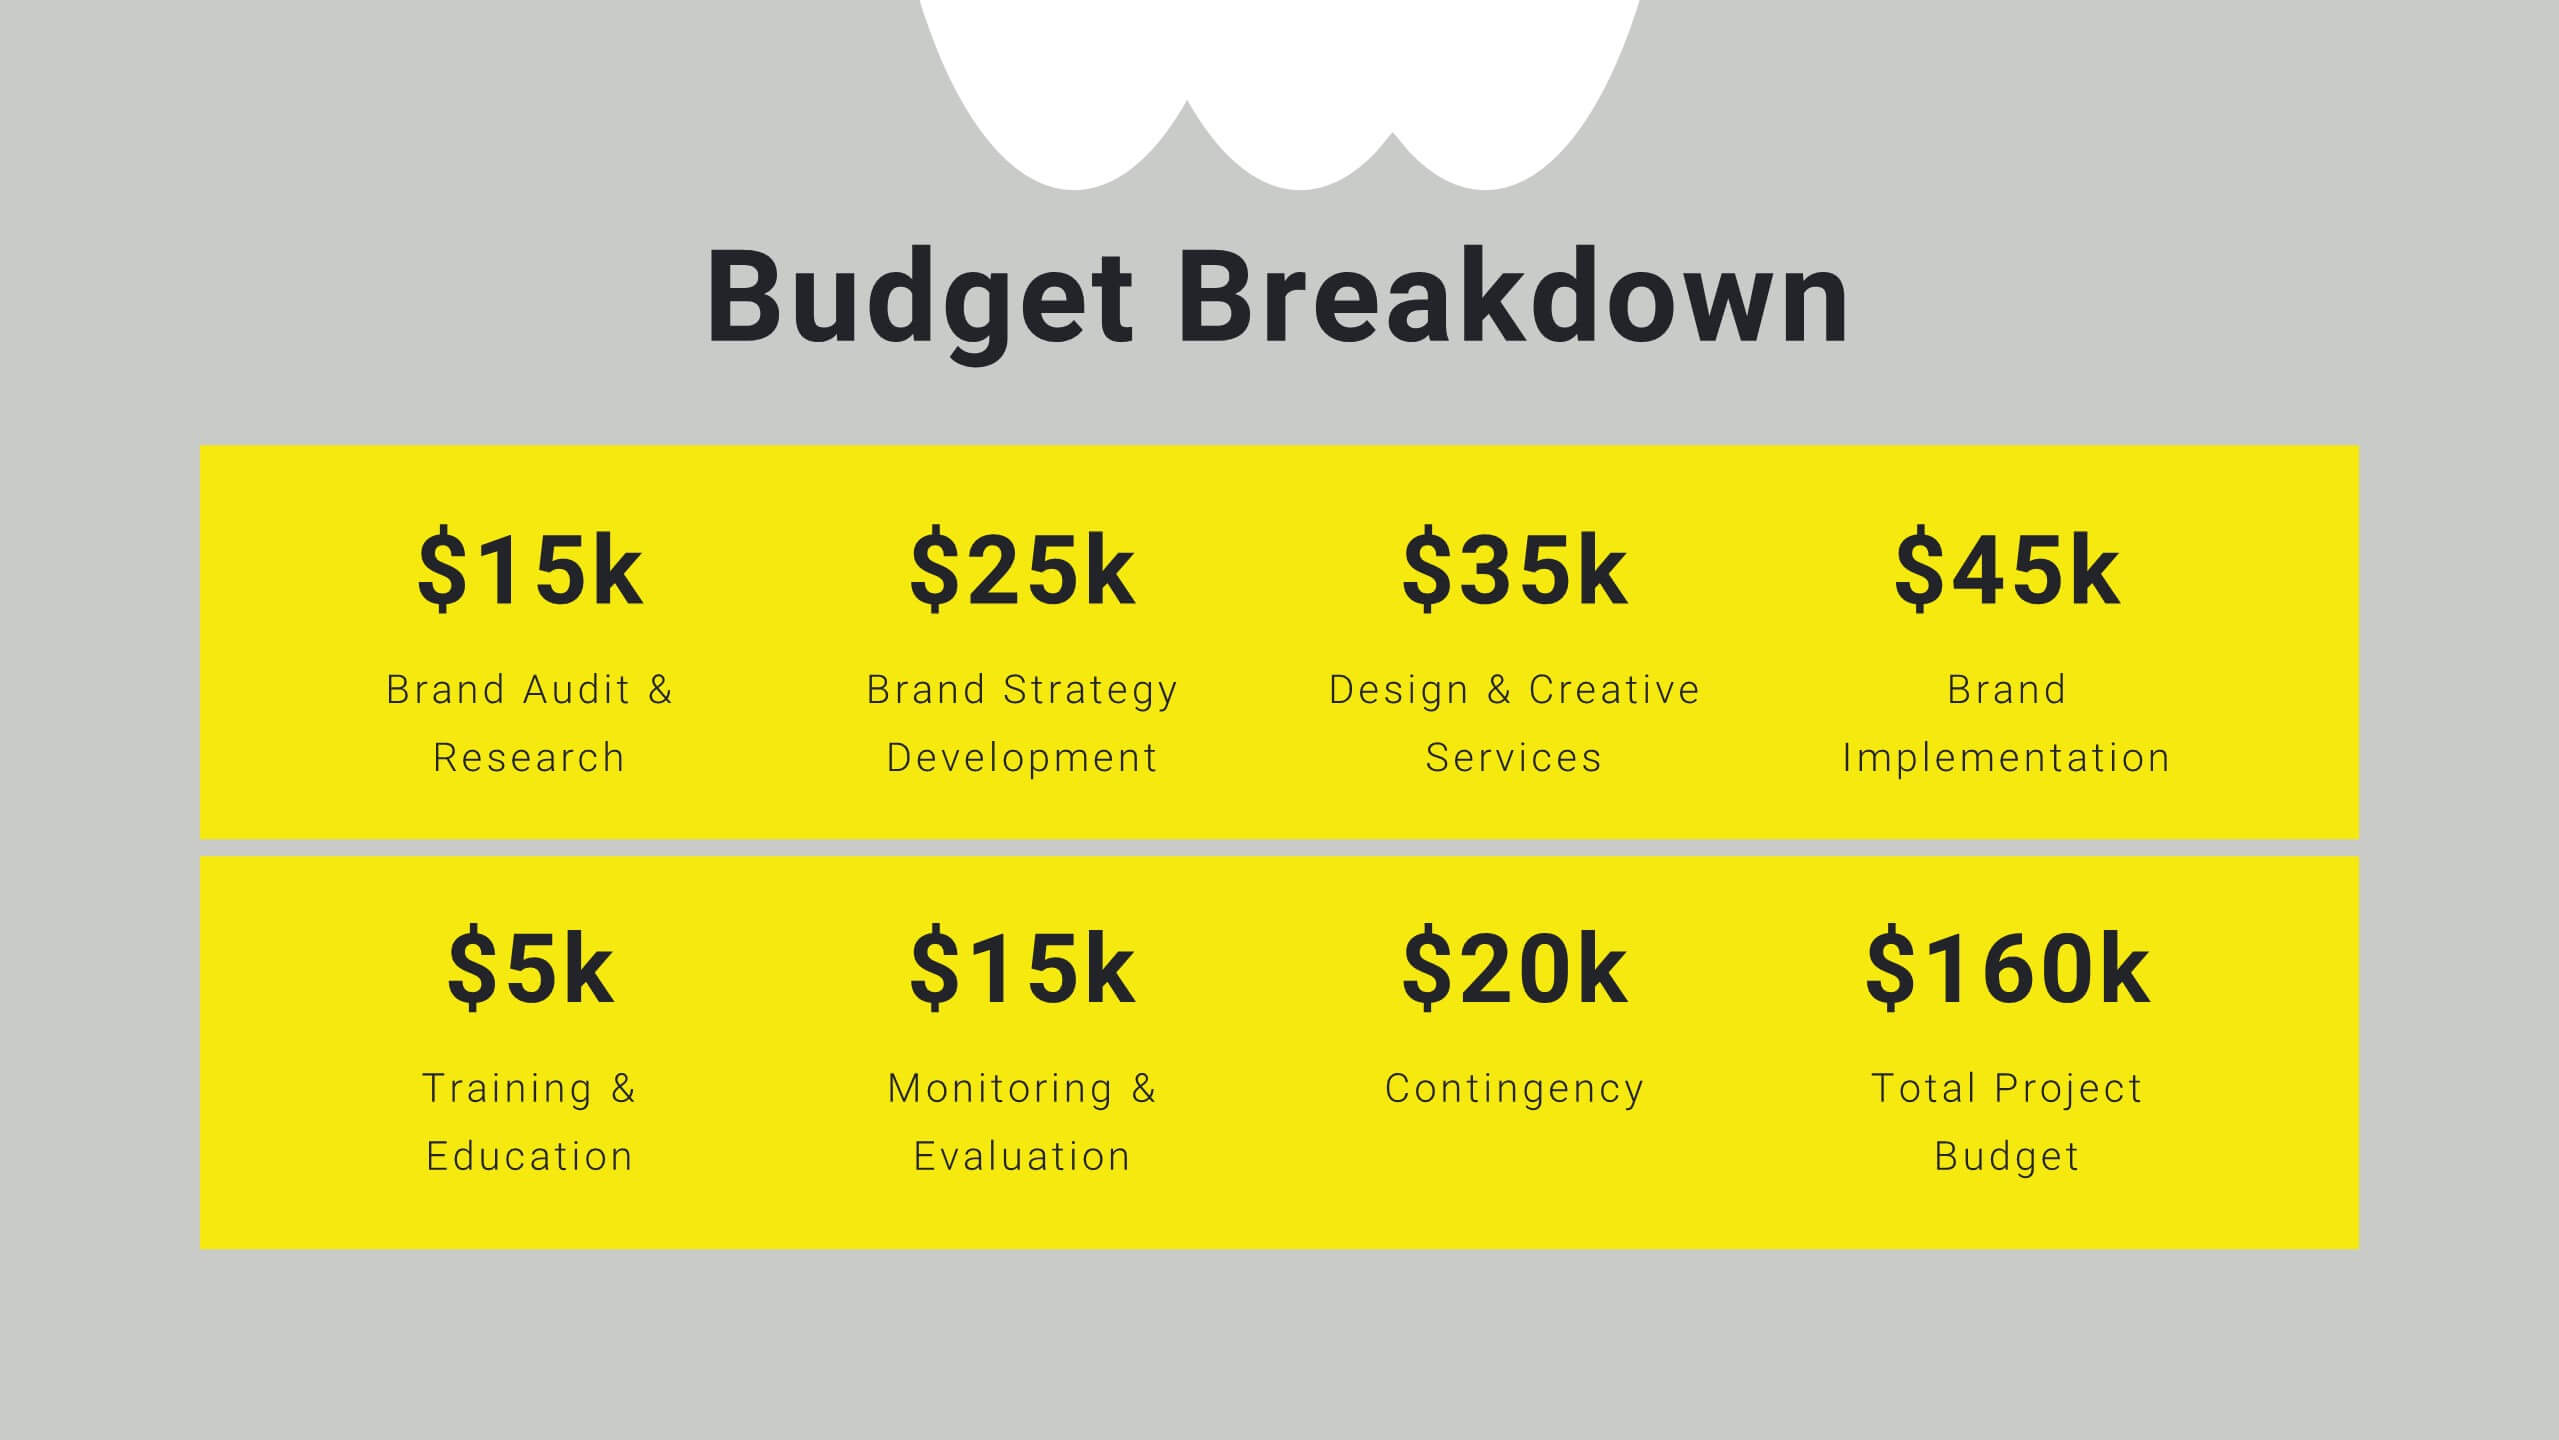
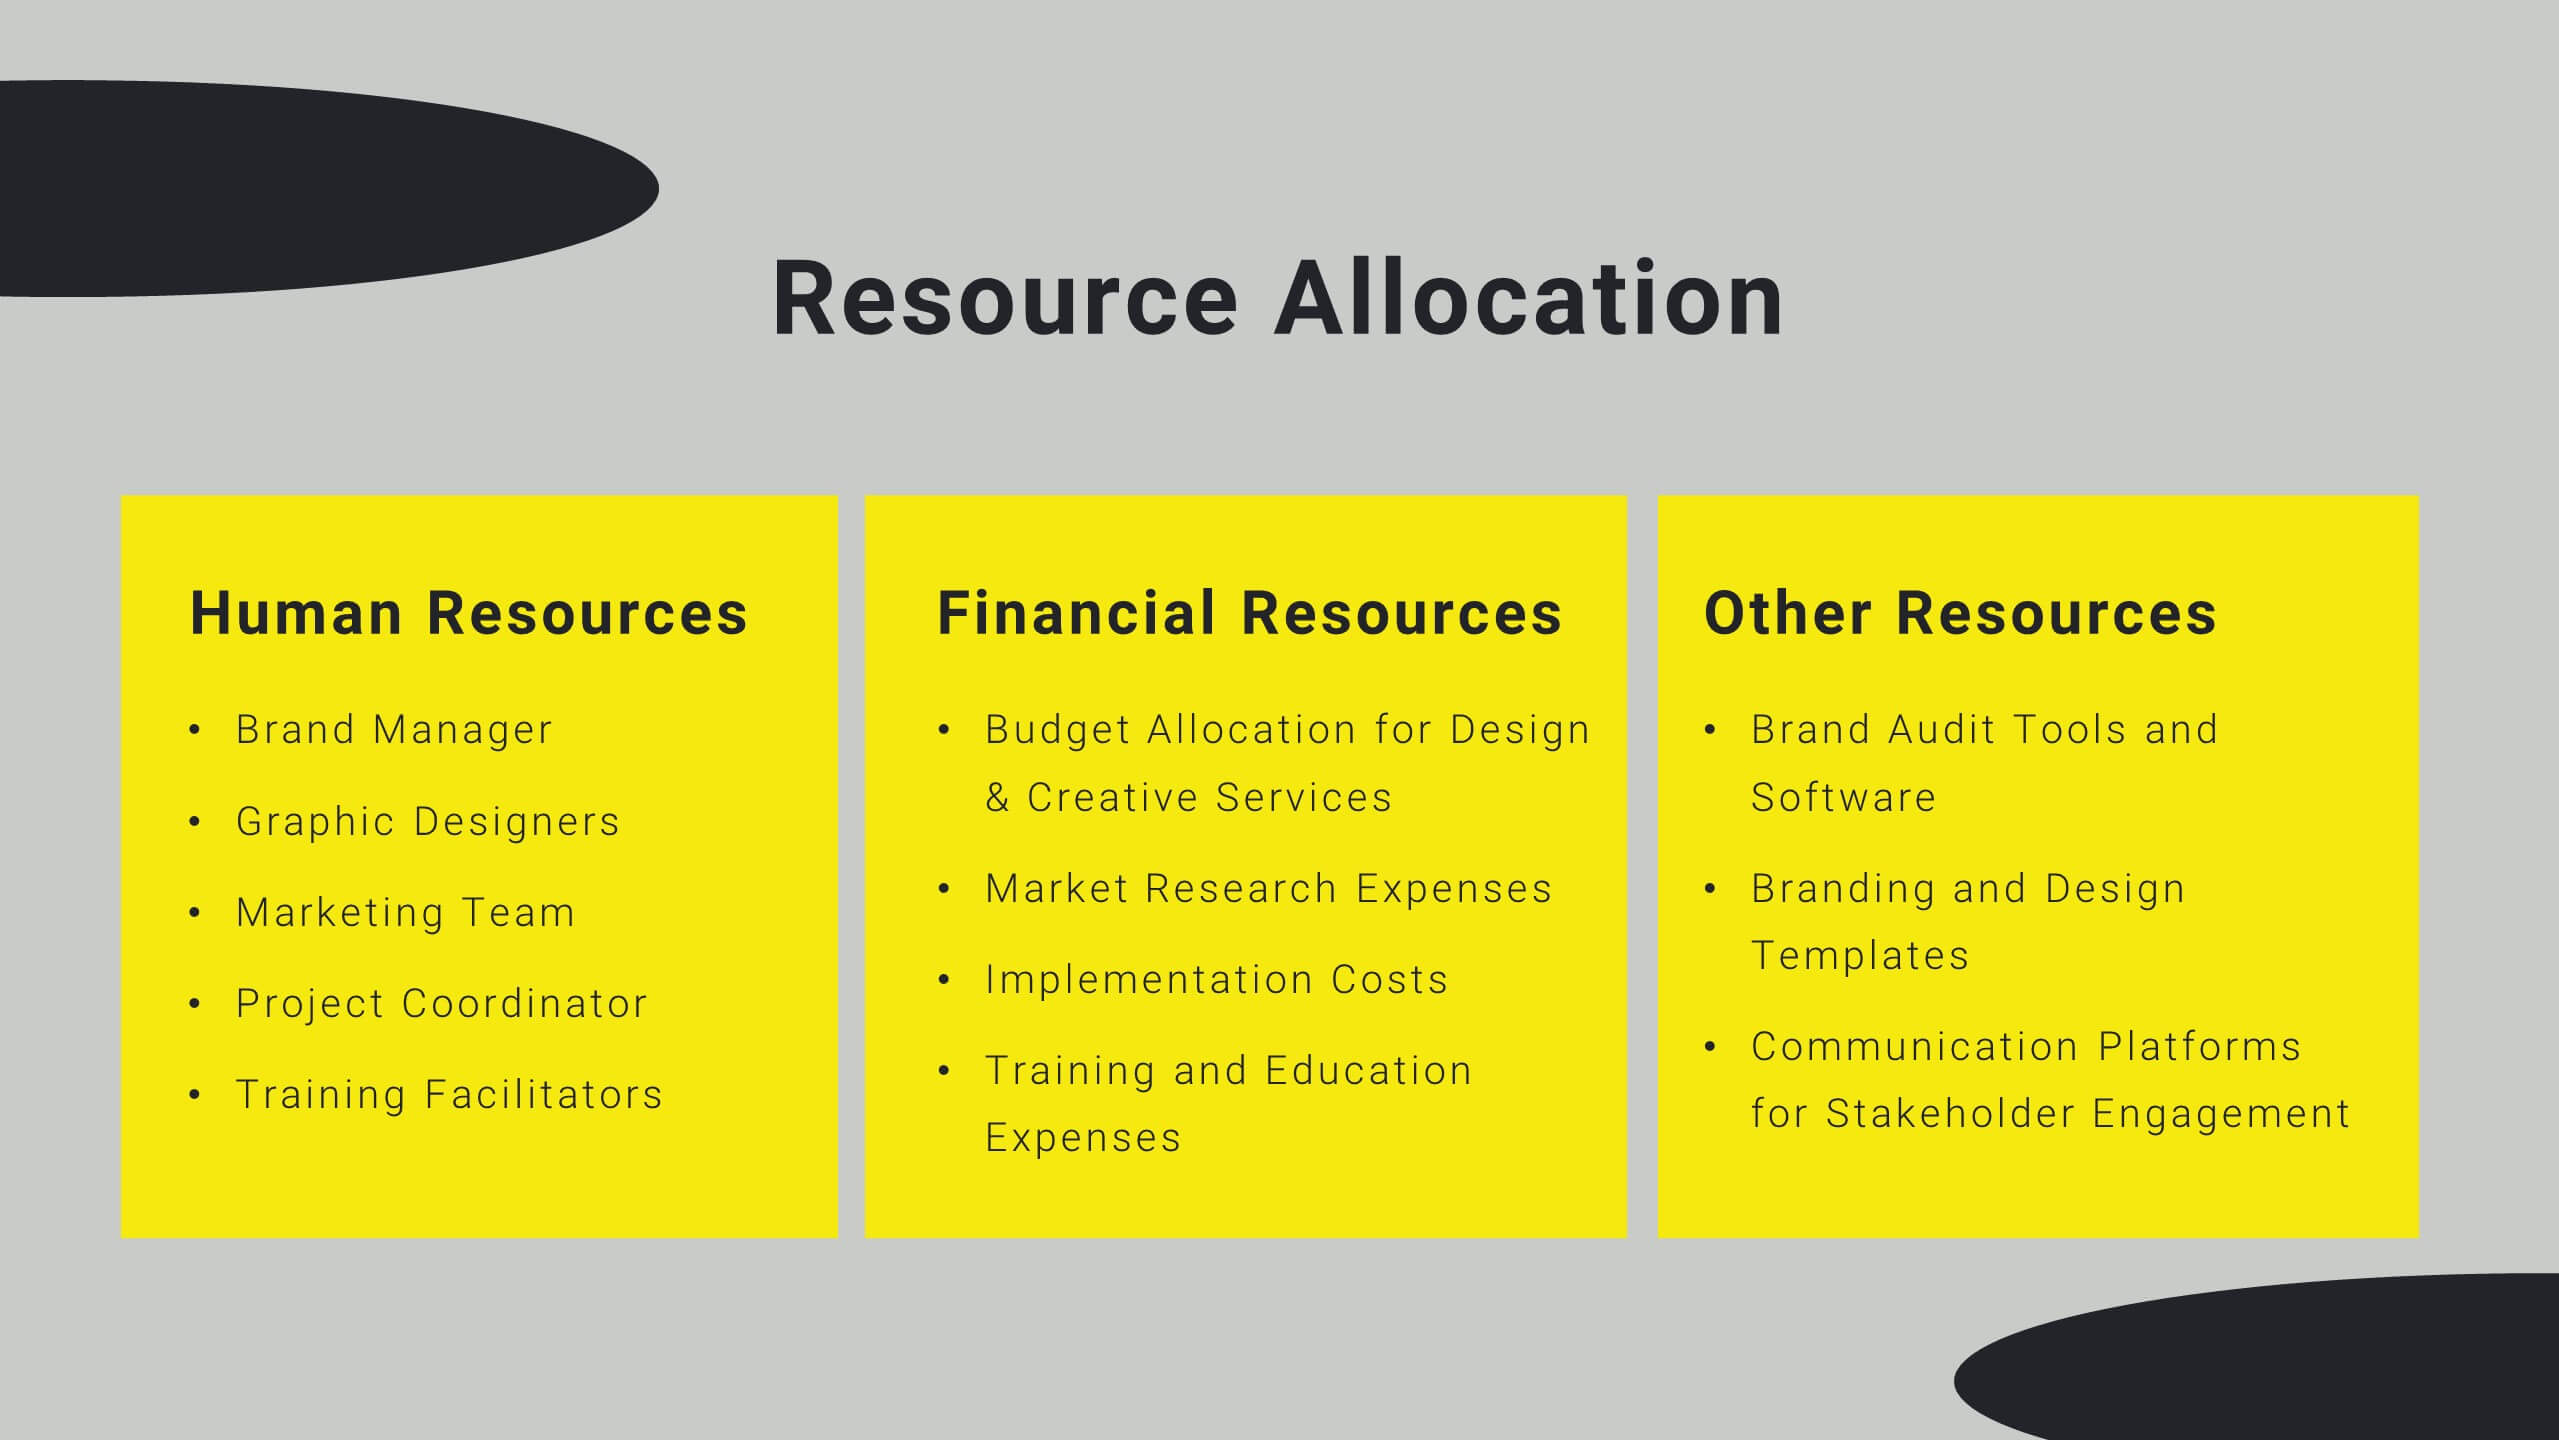
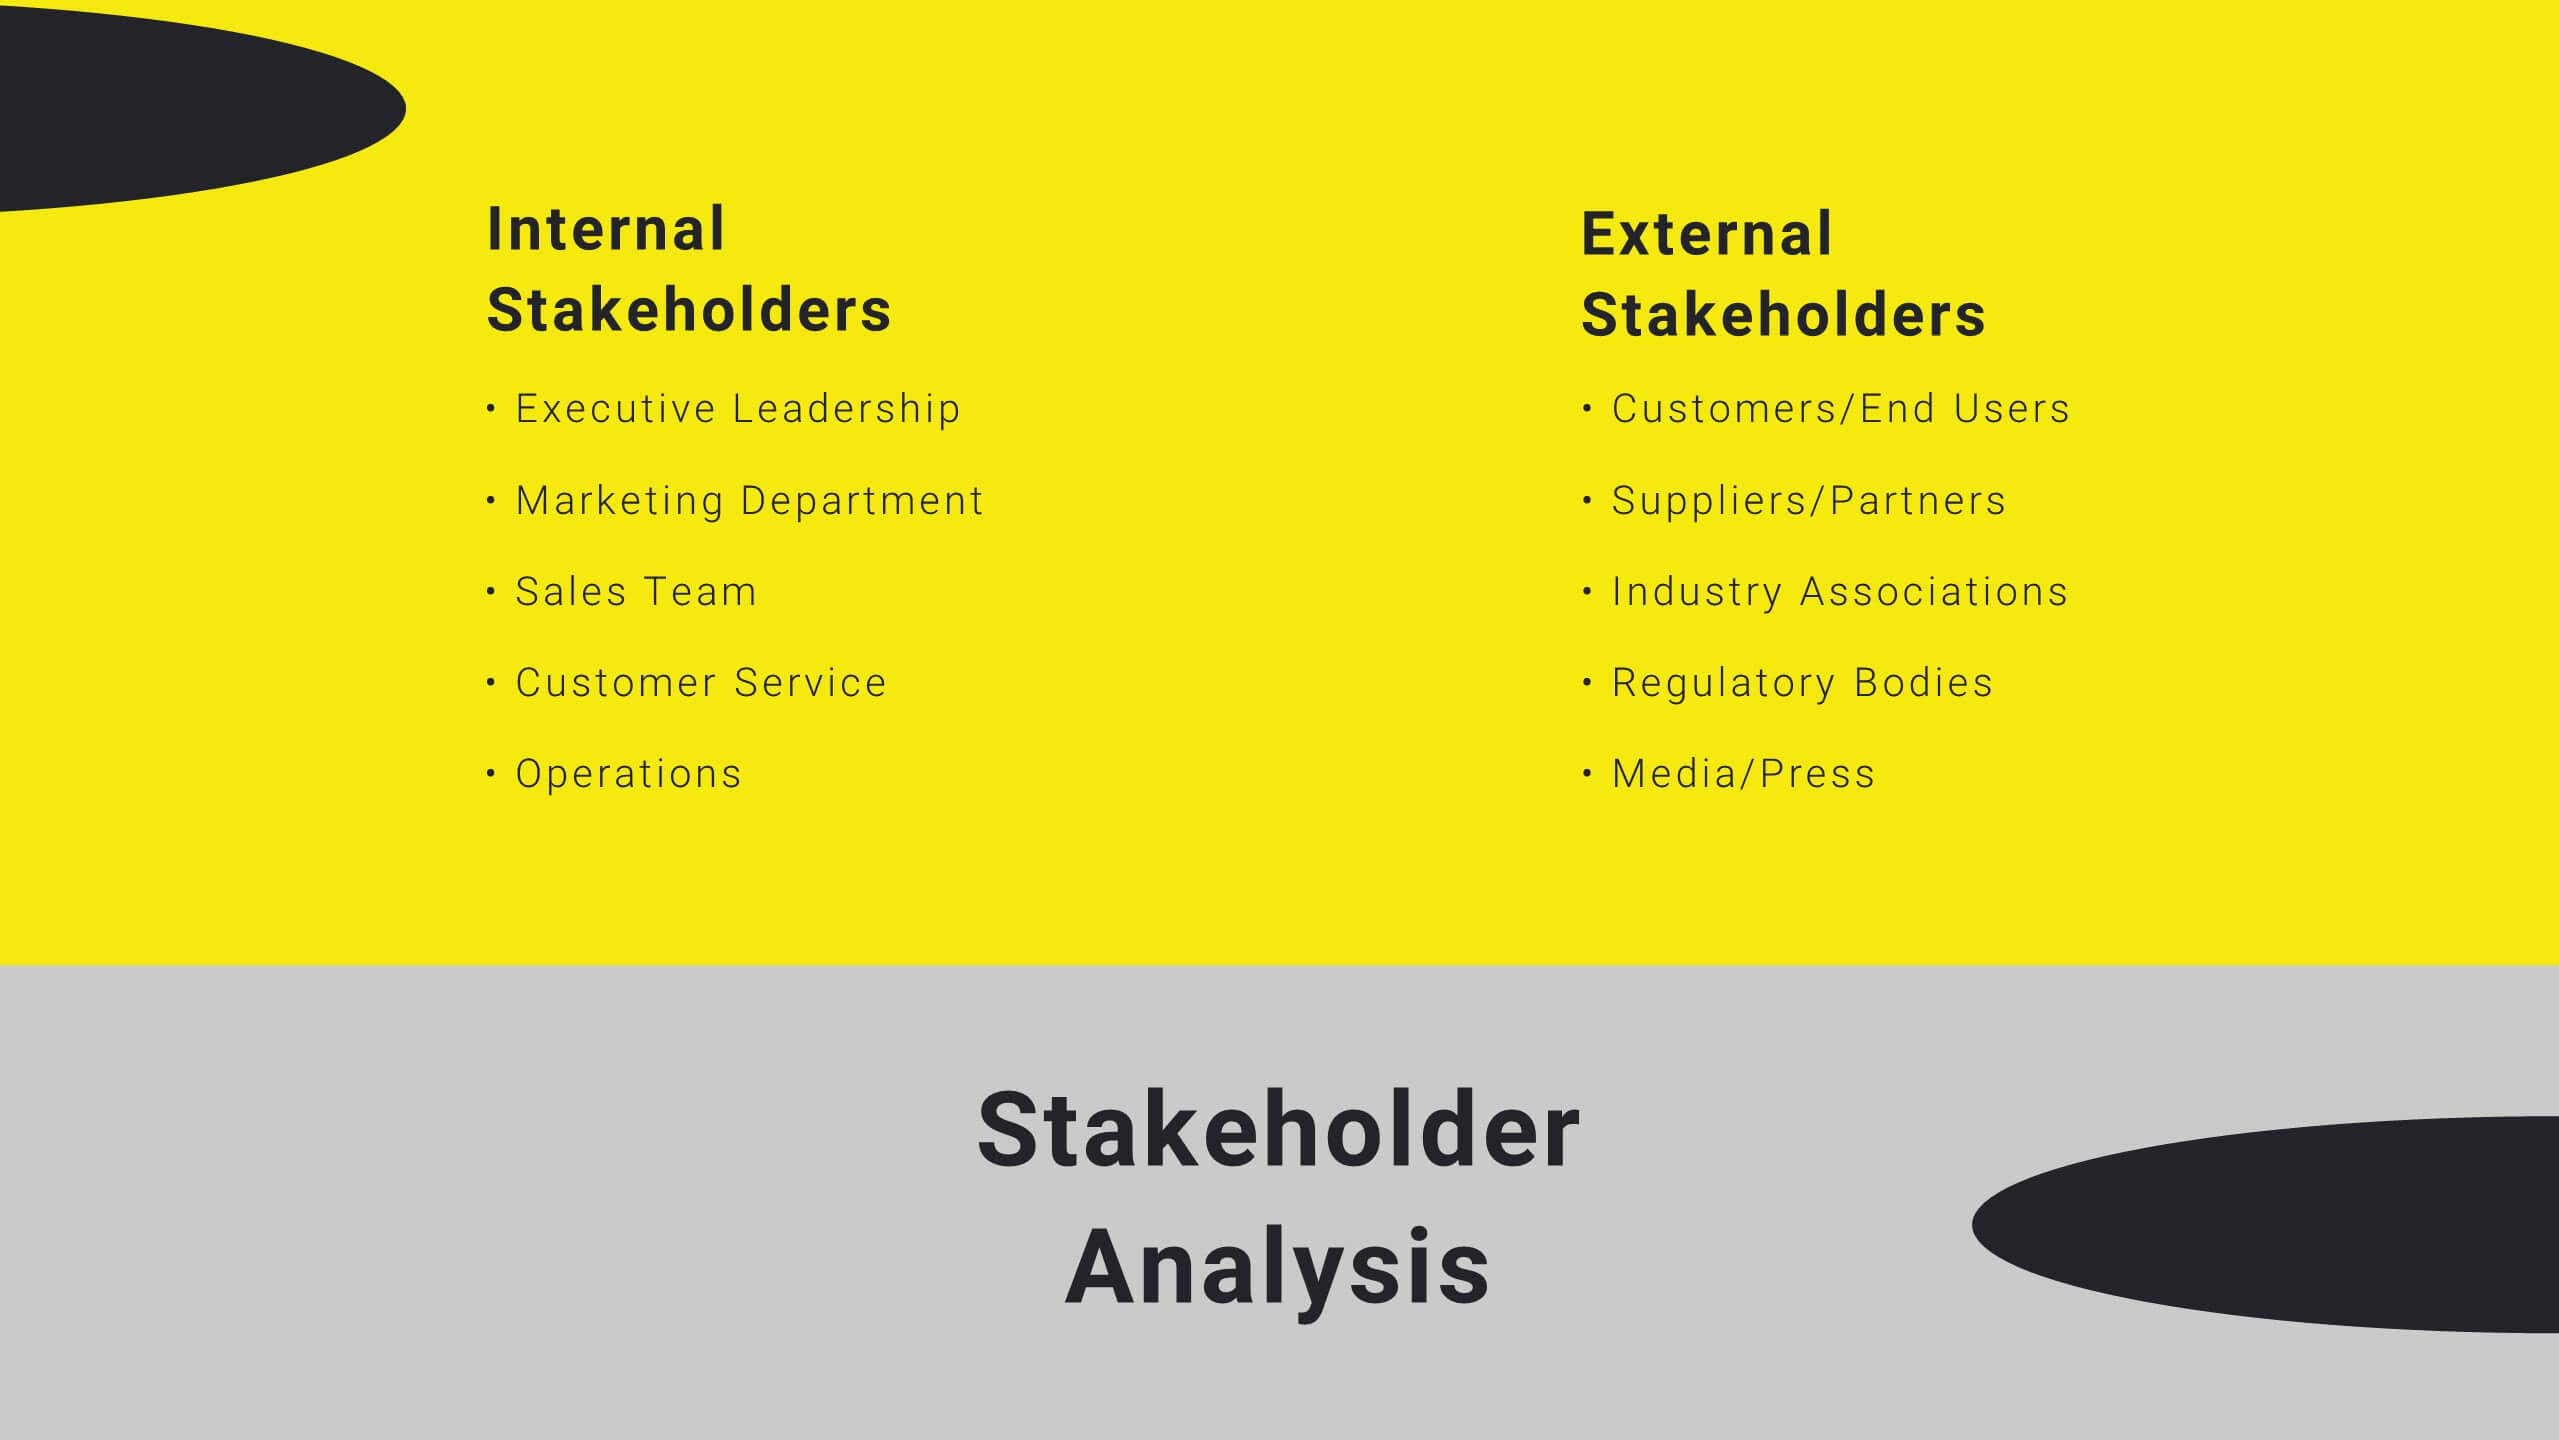
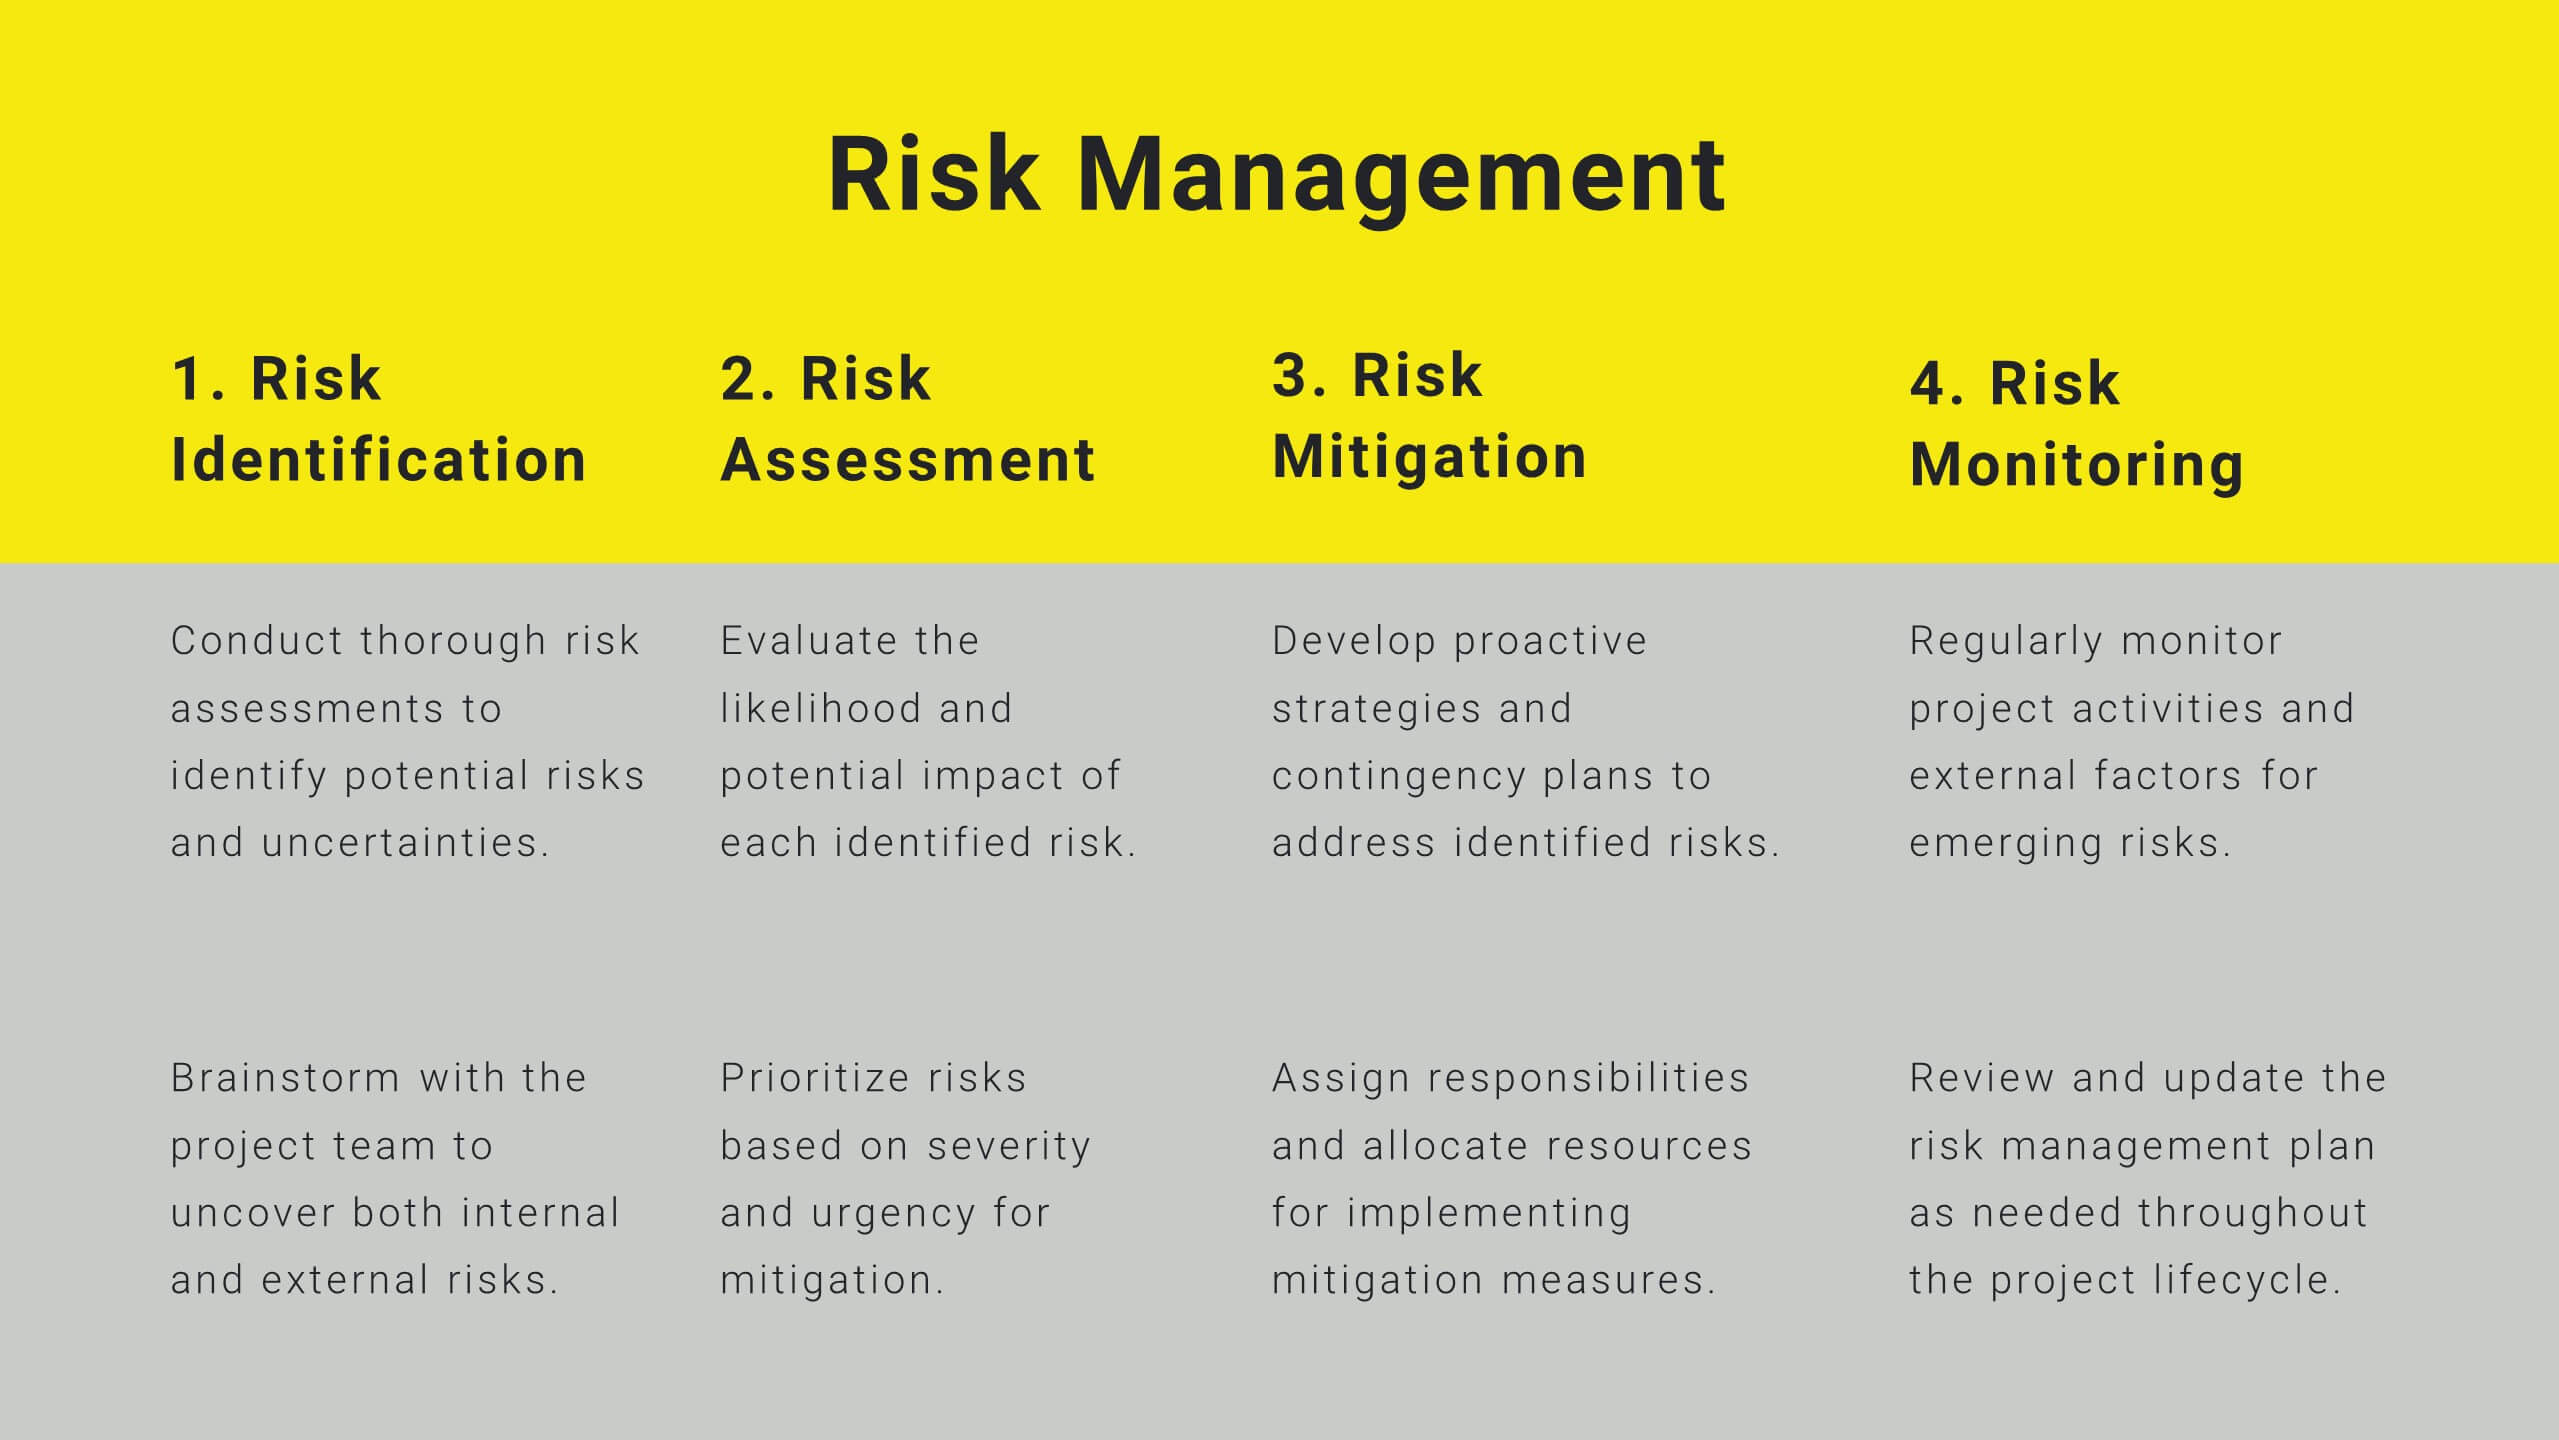
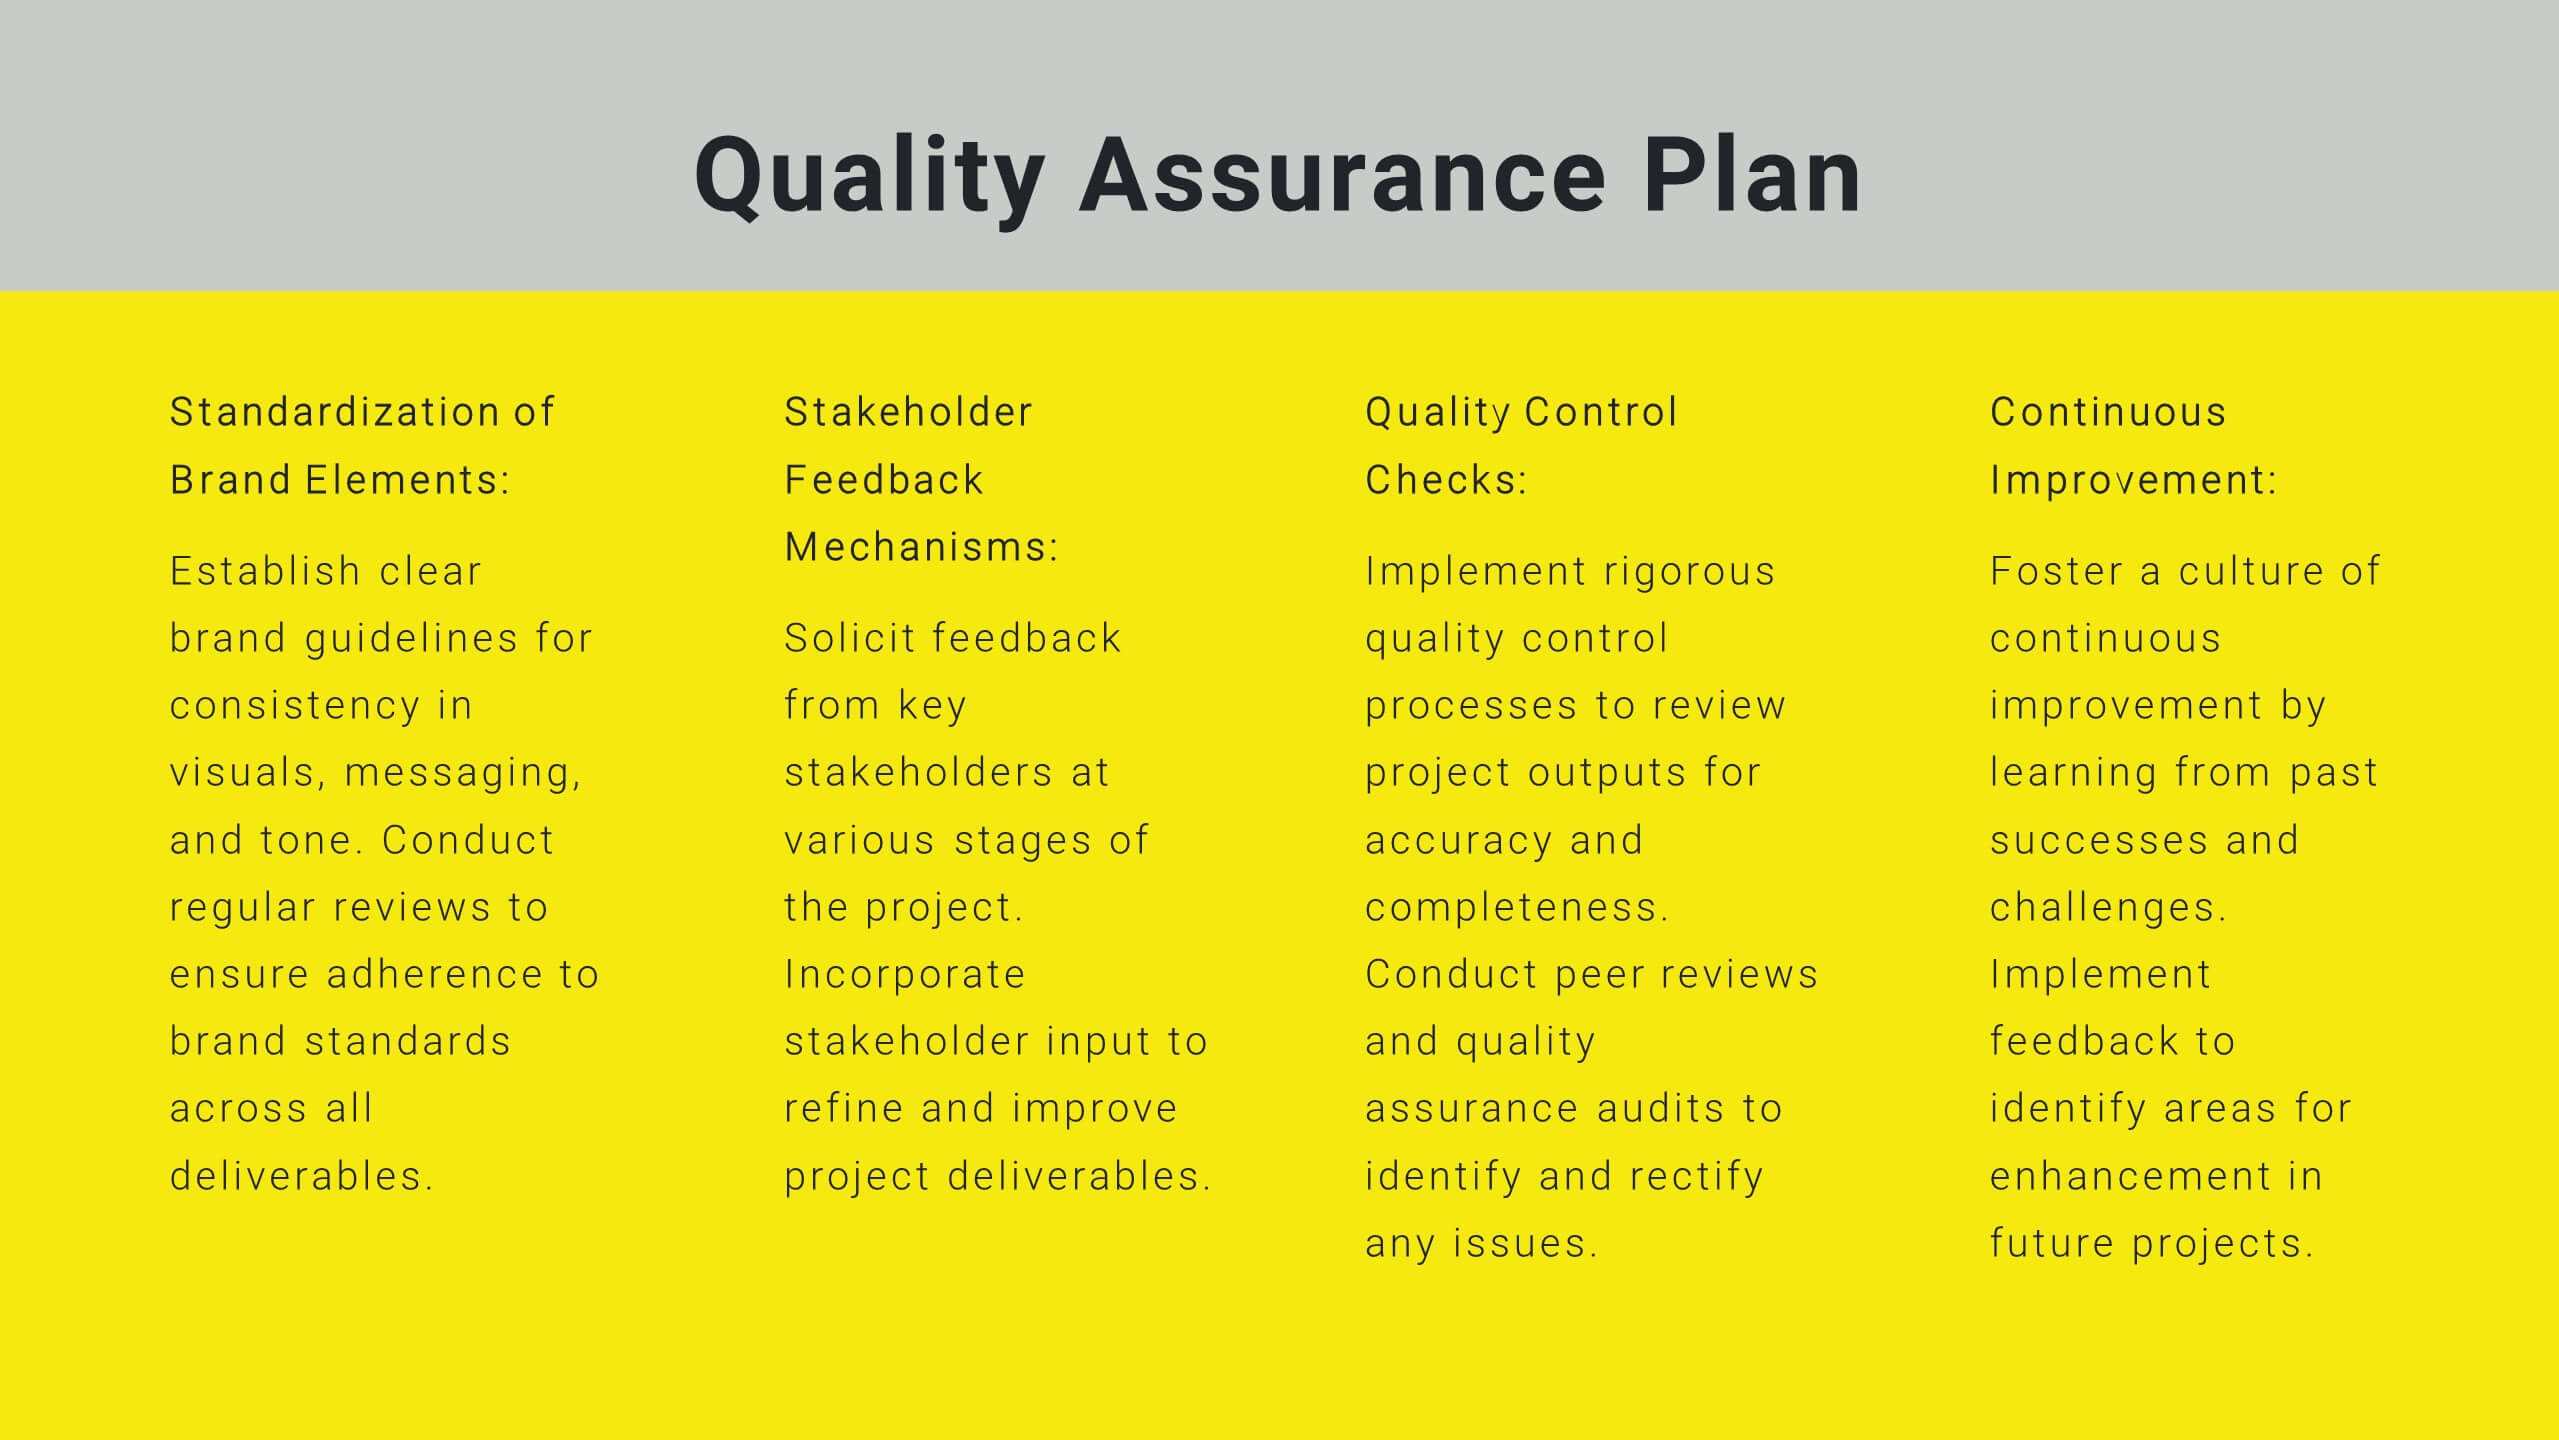
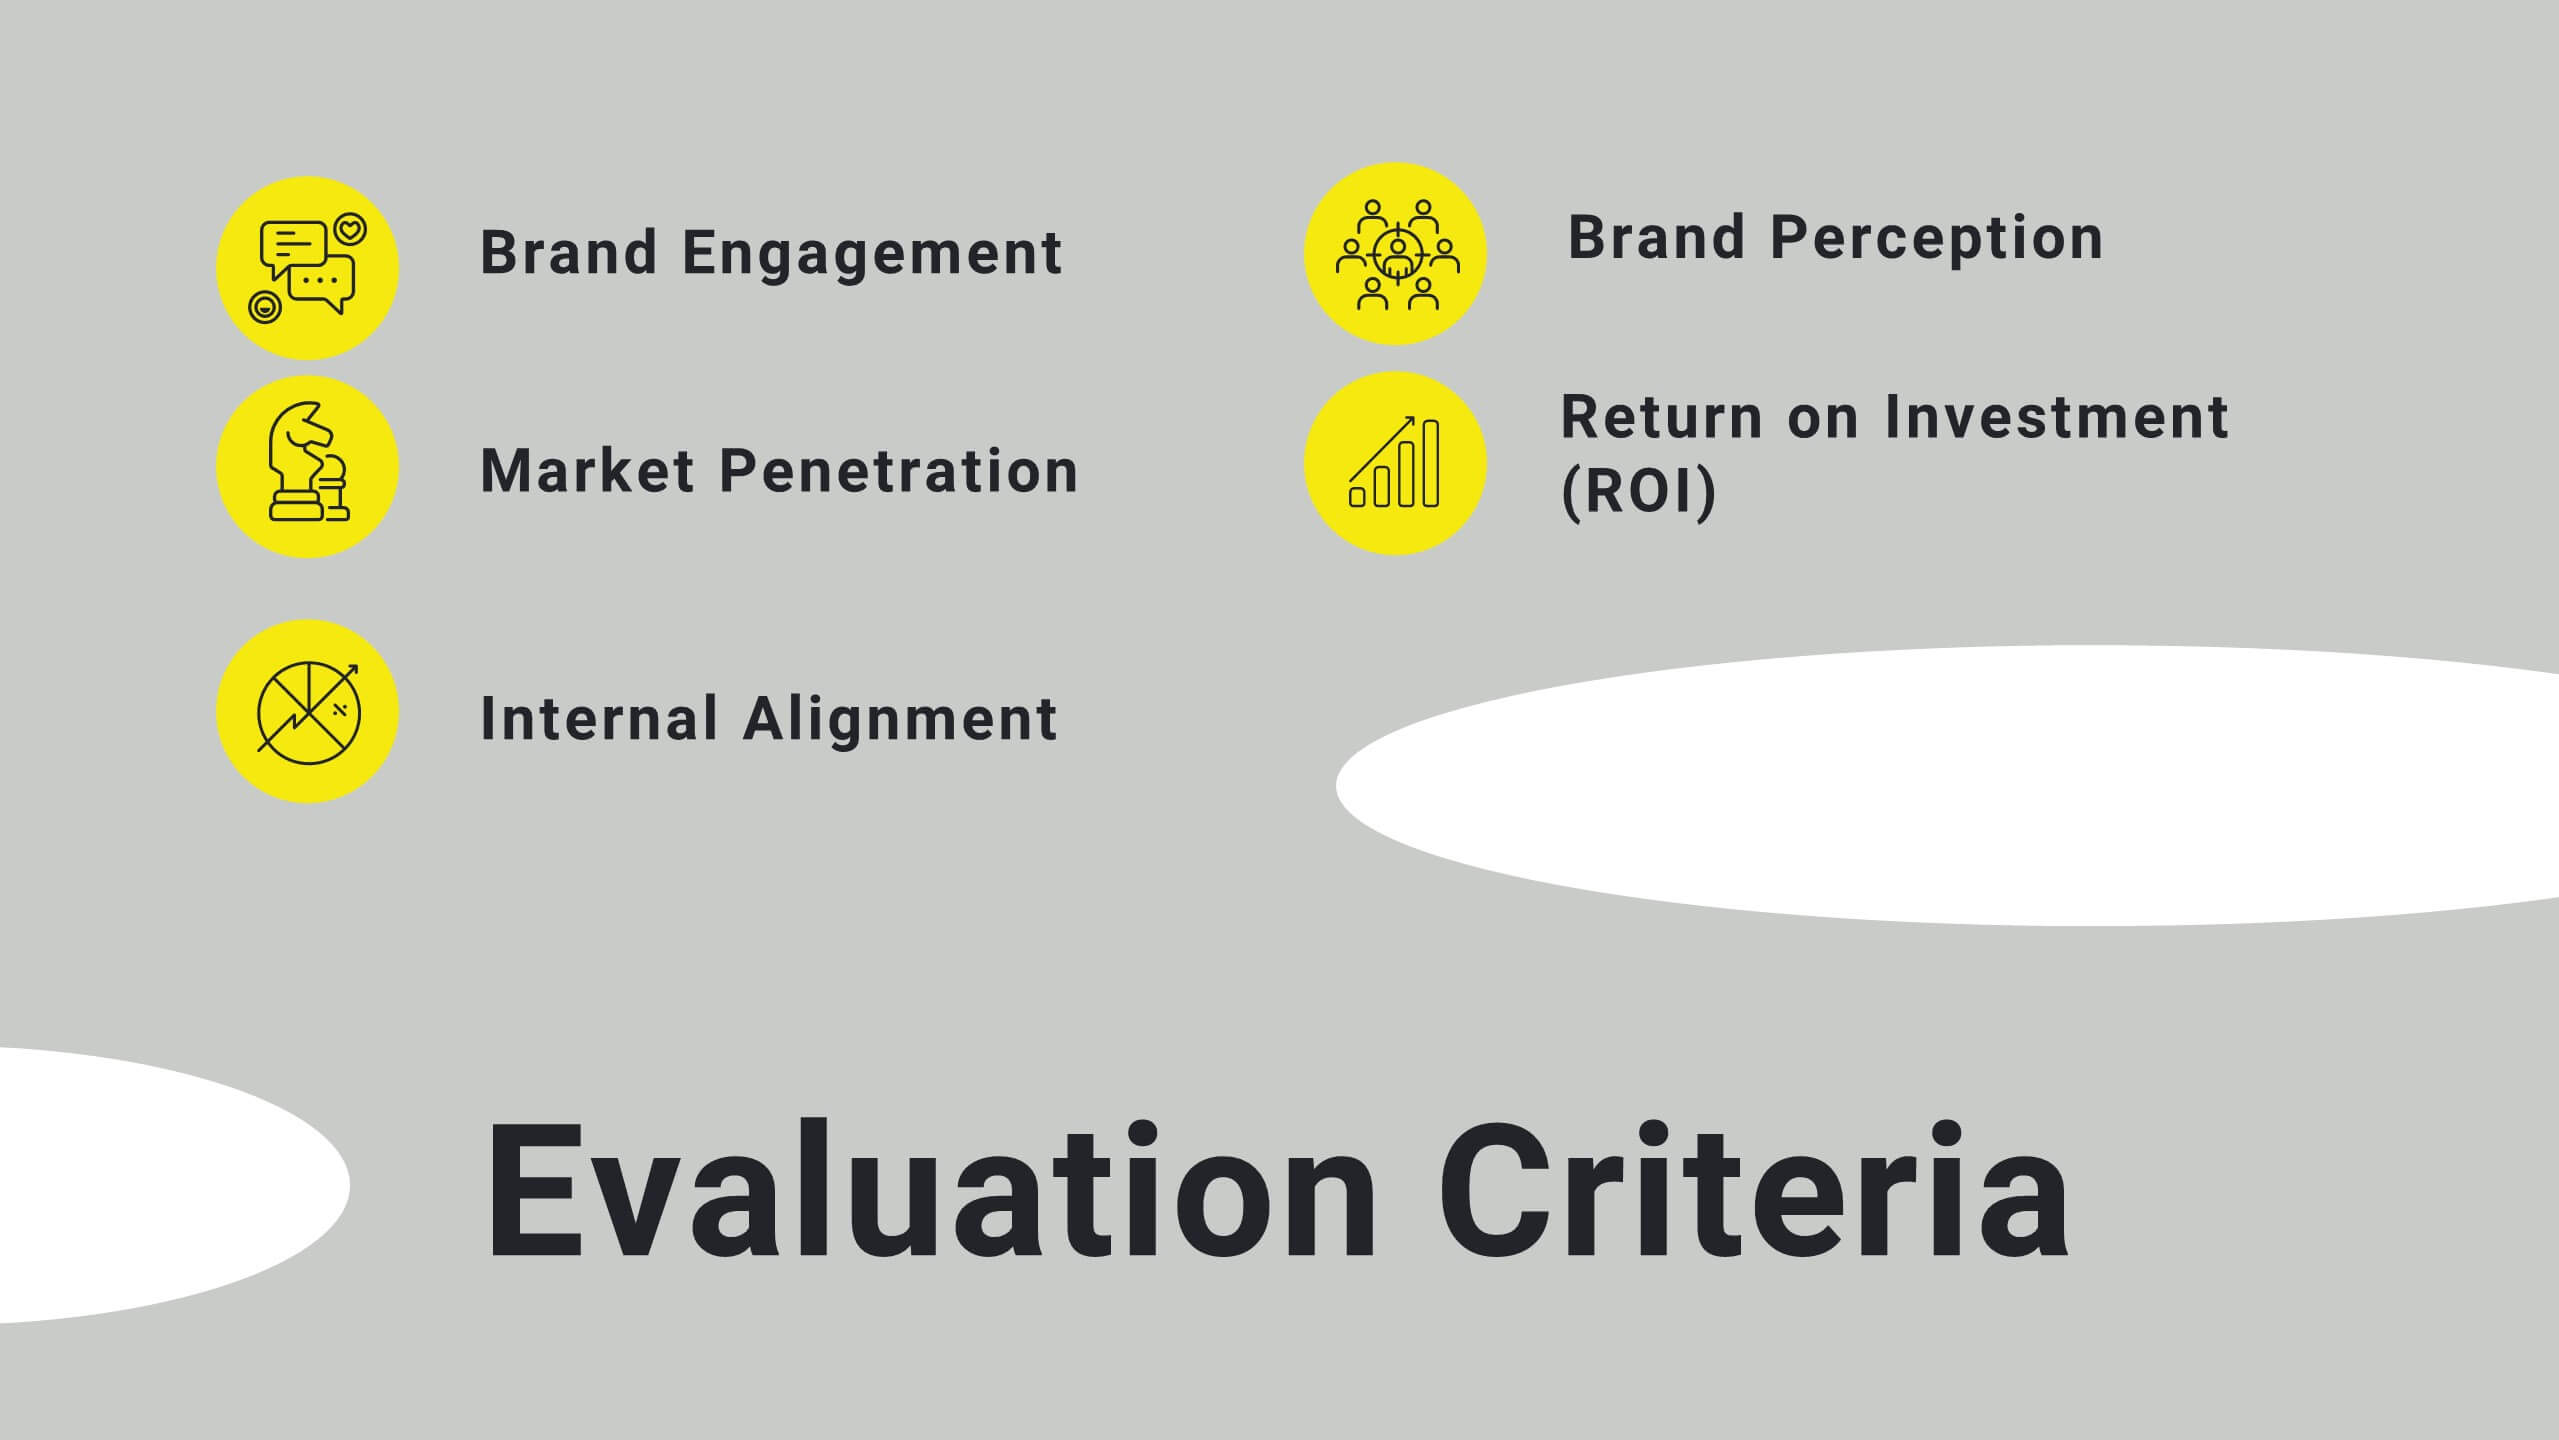
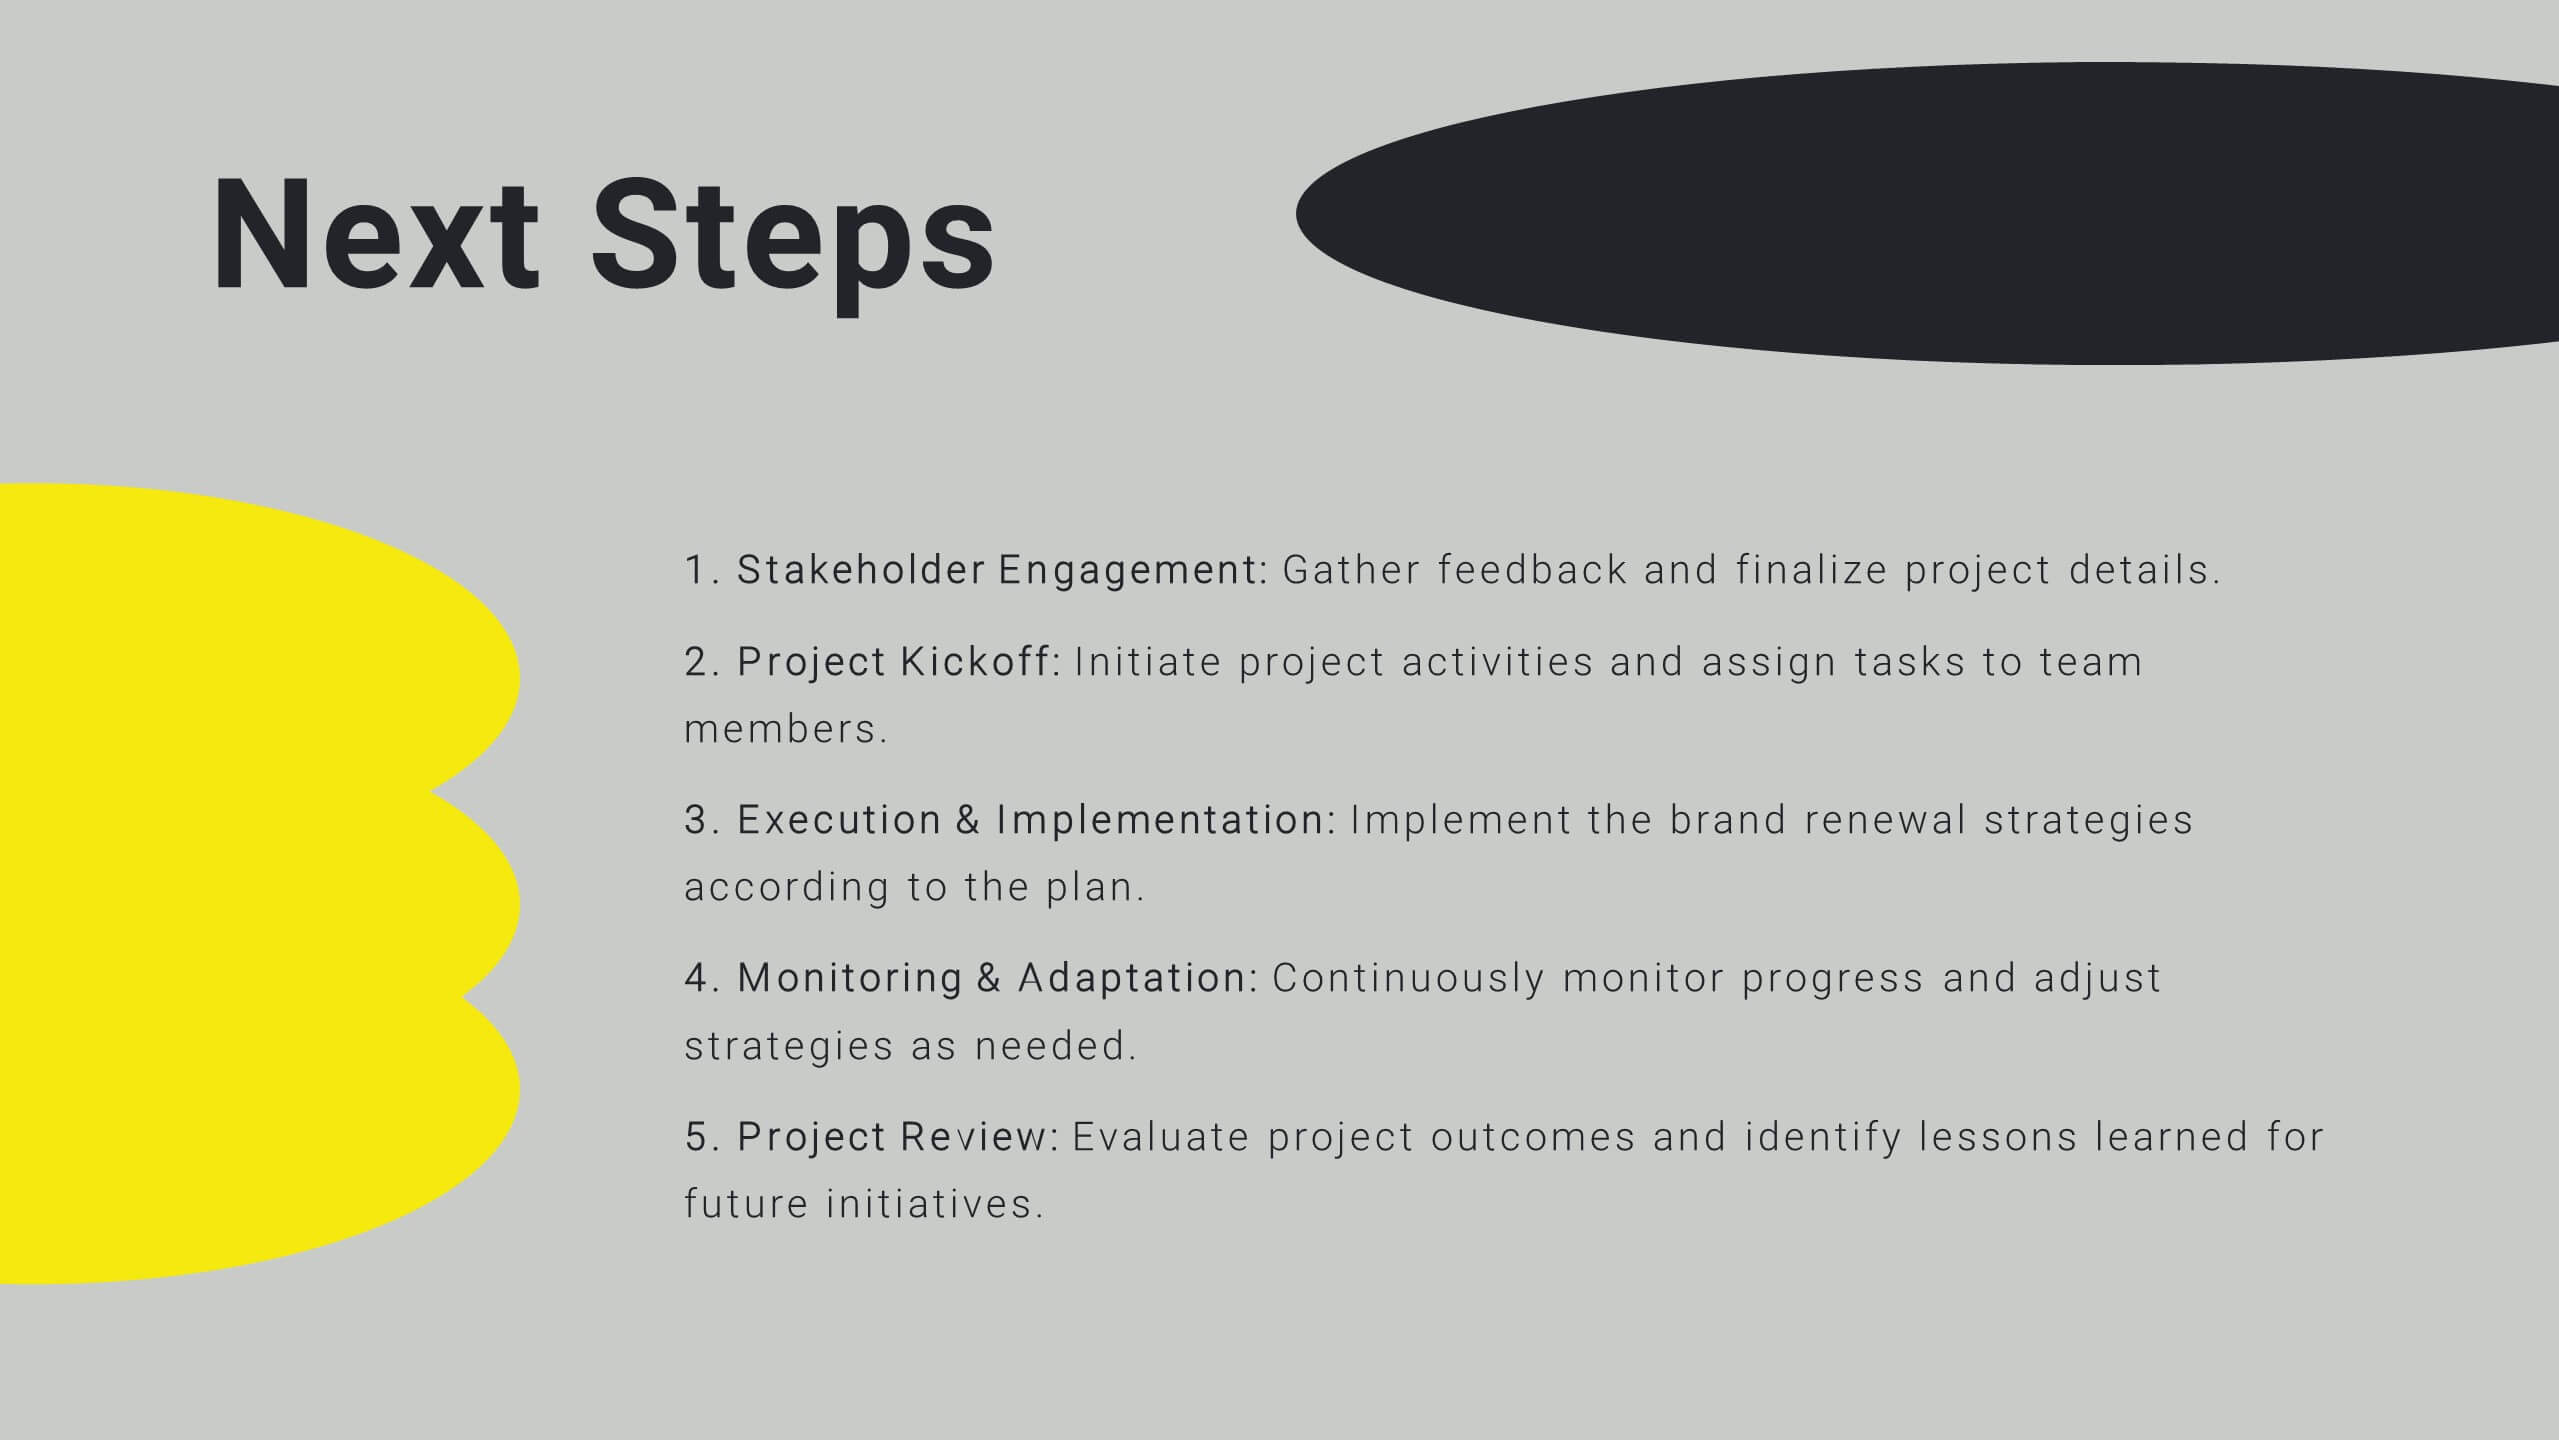
Sable Detailed Project Execution Plan Presentation
Master your project planning with this comprehensive execution plan template! Perfect for detailing project overviews, objectives, and timelines, it includes slides for budget breakdowns, resource allocation, and risk management. Ensure every detail is covered with structured content and clear visuals. Compatible with PowerPoint, Keynote, and Google Slides for seamless presentations on any platform.


6 diapositivas
Demographic Transition Infographics
Embark on a journey through the fascinating concept of demographic transition! This infographic opens the door to understanding how societies evolve over time in terms of population growth and age structure. From the early stages of high birth and death rates to the advanced stages of low birth and death rates, we unveil the intricate phases of demographic transition that shape our world. Discover the profound impacts of demographic transition on societies and economies. Learn how changes in population structure affect labor markets, healthcare systems, and social welfare. Understand the opportunities for economic growth and development that can arise from a favorable demographic transition. With this engaging infographic, compatible with PowerPoint, Keynote, and Google Slides, sharing your understanding of demographic transition has never been more accessible. Empower yourself with the knowledge to comprehend and discuss this vital aspect of our world's development. Dive into the complexities of demographic transition and embark on a journey of exploration and enlightenment.


5 diapositivas
Workflow Management Diagram Presentation
Simplify your process visuals with a clean, modern layout designed to clarify every step. This presentation helps you map workflows, define responsibilities, and streamline communication across teams. Perfect for project planning and operations, it’s fully compatible with PowerPoint, Keynote, and Google Slides for effortless customization and professional presentation delivery.


7 diapositivas
United States Market Map Infographic
Navigate the vastness of the United States with our meticulously designed map infographic. Rendered in a pristine white background, this template is adorned with the patriotic fervor of red, the tranquility of blue, and the charm of purple. Whether it's for market segmentation, regional data visualization, or a travel itinerary, the infographic seamlessly blends informative value with visual appeal. This US map, compatible with Powerpoint, Keynote, and Google Slides, offers custom-made icons and flexible image placeholders to suit varied purposes. Unfold stories from coast to coast, showcasing the diverse tapestry that is the United States.


6 diapositivas
Enterprise Loyalty Program Infographic
A loyalty program is a structured marketing strategy designed to encourage customers to continue doing business with a company or brand by offering various incentives, rewards, and benefits for their ongoing loyalty and repeat purchases. This infographic template is a visual representation of the key components, benefits, and features of a loyalty program designed for a large-scale business or enterprise. This template visually conveys the value of the program, encourages participation, and showcases the benefits that customers can enjoy by becoming loyal members. This is compatible with Powerpoint, Keynote, and Google Slides.


5 diapositivas
Geographic Oceania Overview Presentation
Visualize your regional data with a sleek, easy-to-read map highlighting key areas across Oceania. Perfect for presenting geographic insights, business distribution, or market trends, this clean layout ensures every detail stands out clearly. Fully compatible with PowerPoint, Keynote, and Google Slides for simple editing and professional presentations.