


Características


¿Tienes alguna pregunta?
Recomendar


5 diapositivas
Types of Vaccine Infographics
Vaccines are biological substances that stimulate the body's immune system to develop immunity against specific diseases. These vertical infographics provide essential information about different types of vaccines. This infographic serves as a valuable educational resource to raise awareness about vaccines and their role in preventing infectious diseases. The infographic is organized into clear sections, each representing a category of vaccines. Each vaccine category is accompanied by illustrations or icons that represent the type of vaccine being discussed. Compatible with Powerpoint, Keynote, and Google Slides.


7 diapositivas
Hierarchy Needs Infographic
The Hierarchy of Needs, is a framework that categorizes human needs into five levels, often depicted as a pyramid. This visually engaging infographic template lays out the psychological journey each individual undertakes, climbing the pyramid of needs towards a successful life. Compatible with Powerpoint, Keynote, and Google Slides. Utilize visual elements to guide your audience in understanding their unique journey through the hierarchy, highlighting the importance of each stage. This template will guide you through the layers of hierarchy within organizations, providing an understanding of leadership and organizational structure.


6 diapositivas
Sales Funnel Performance Presentation
Visualize your customer journey with this Sales Funnel Performance Presentation. The clean funnel diagram allows you to clearly represent each stage—awareness, interest, decision, and action—using vibrant, stacked layers. Customize the six labeled steps and supporting icons to fit your brand strategy. Perfect for showcasing conversion metrics or campaign insights in PowerPoint, Keynote, or Google Slides.


22 diapositivas
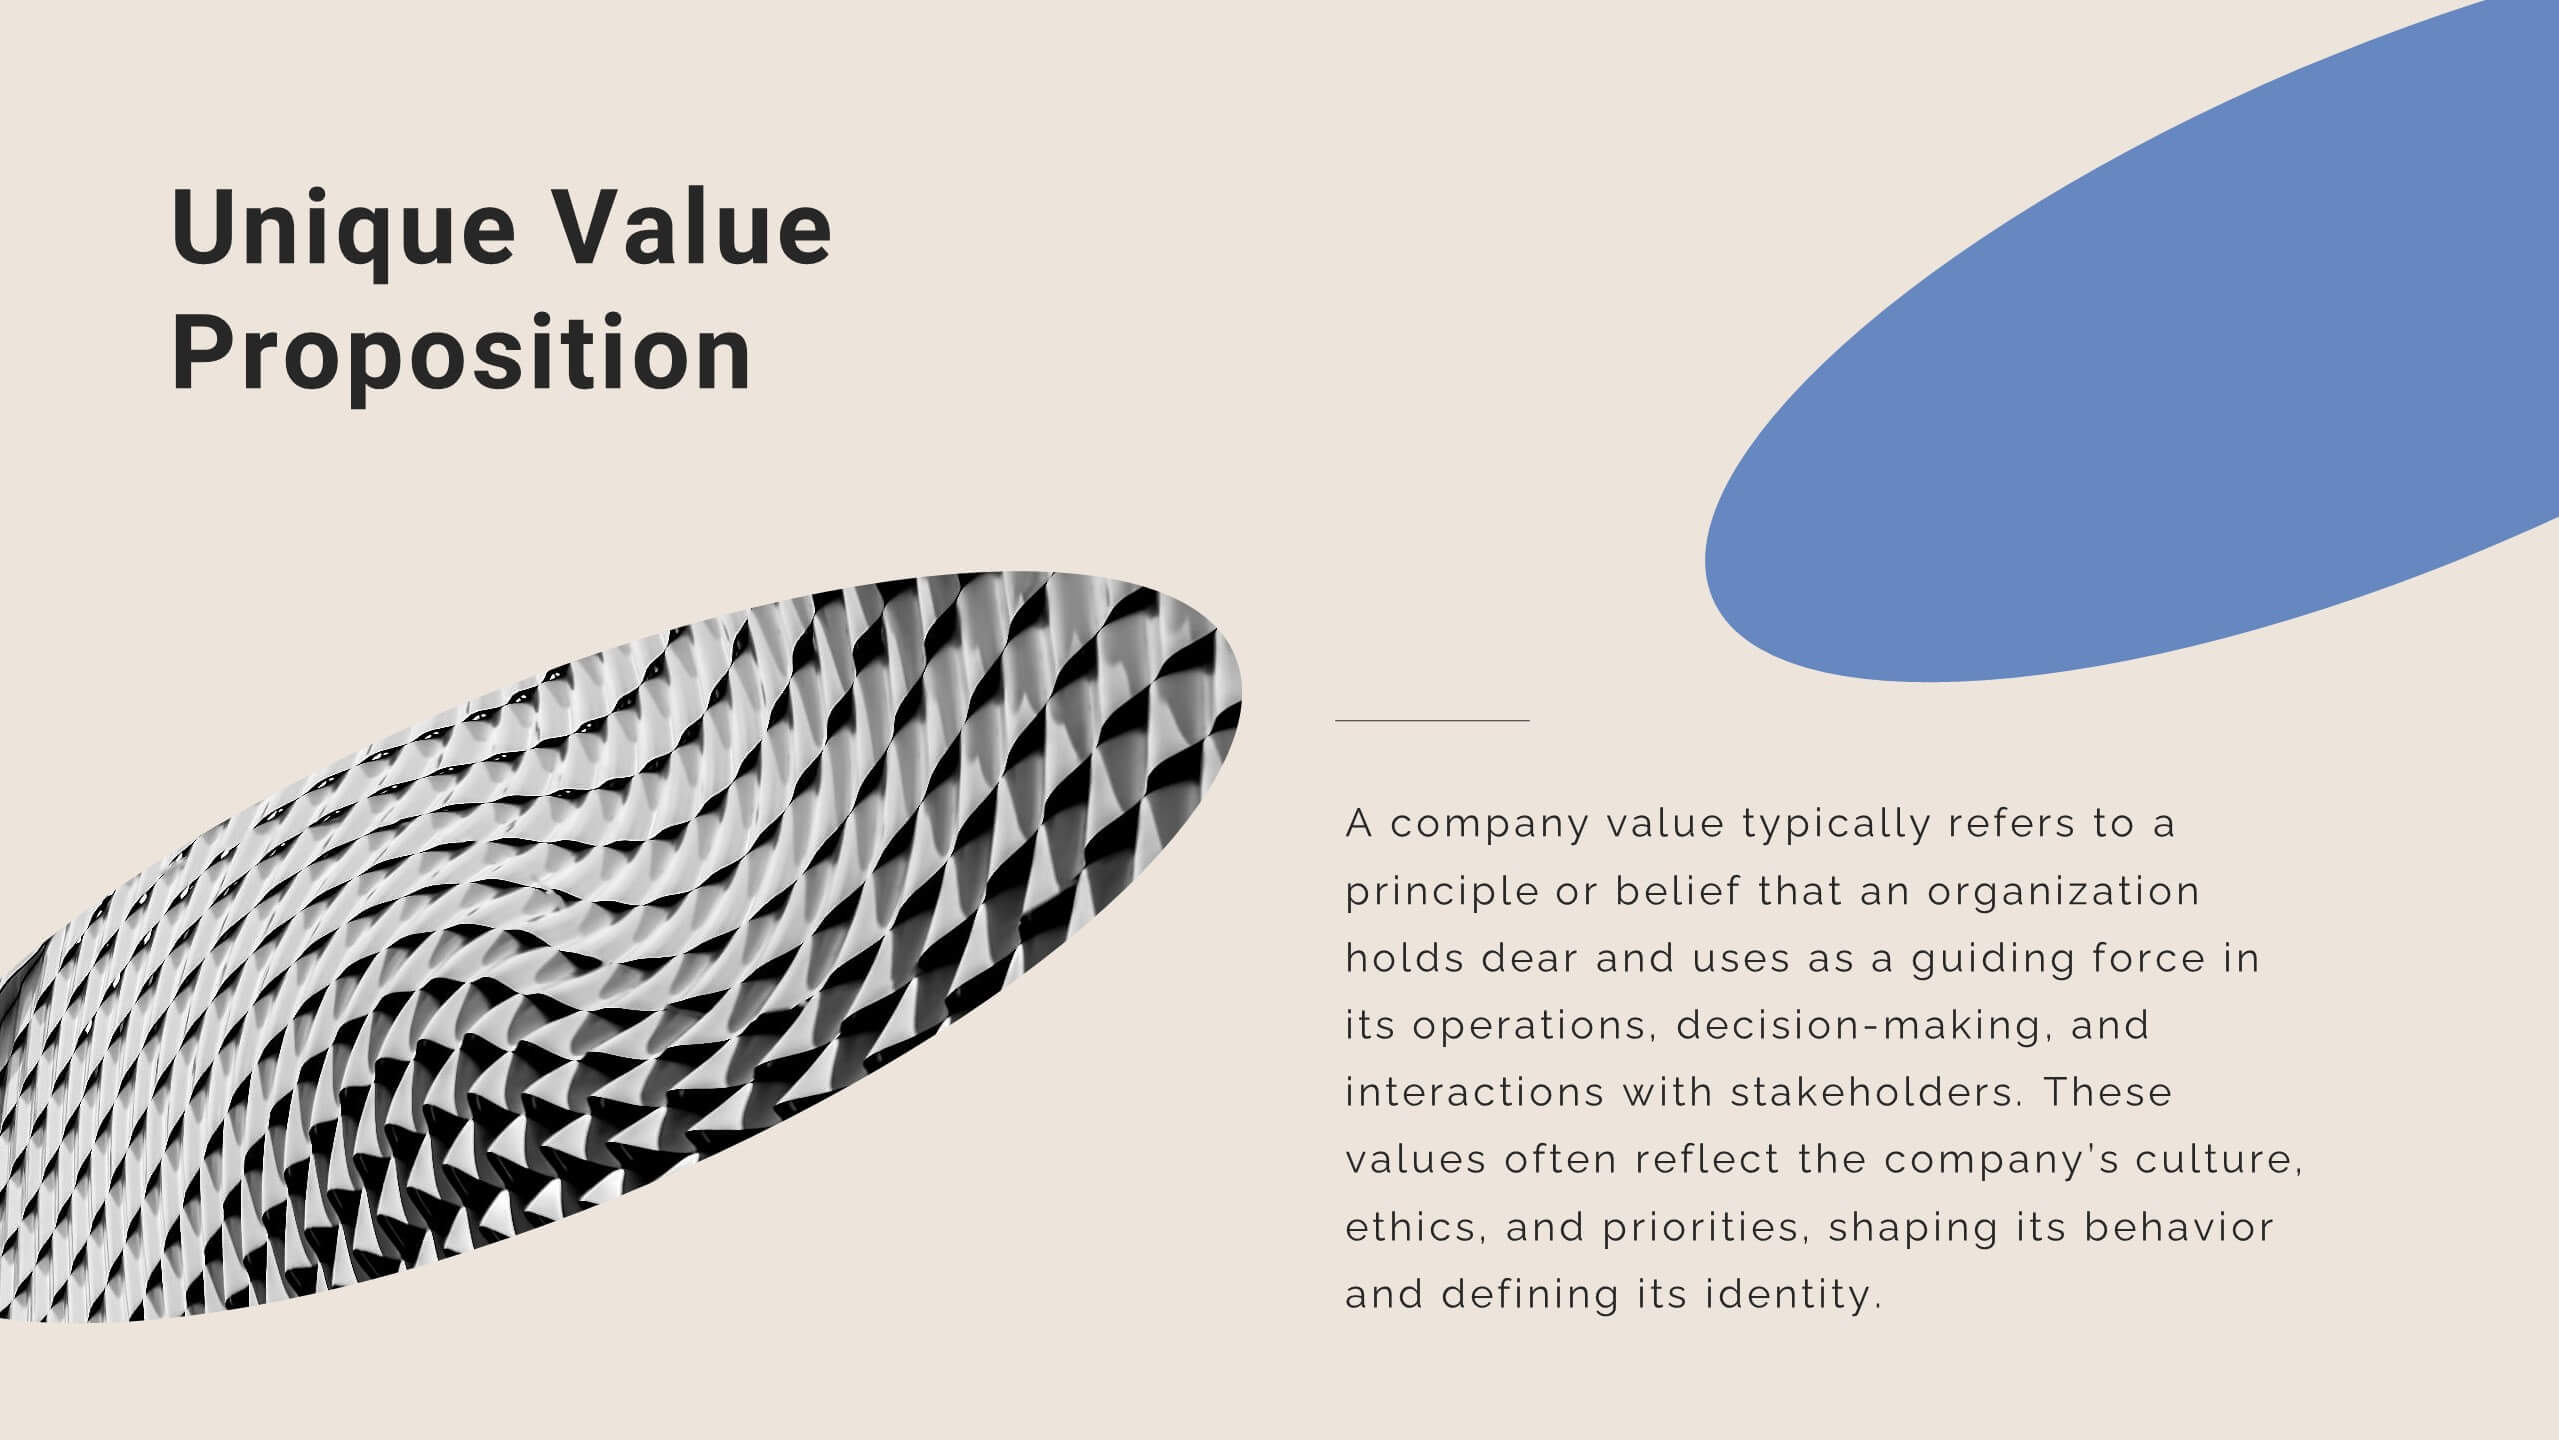
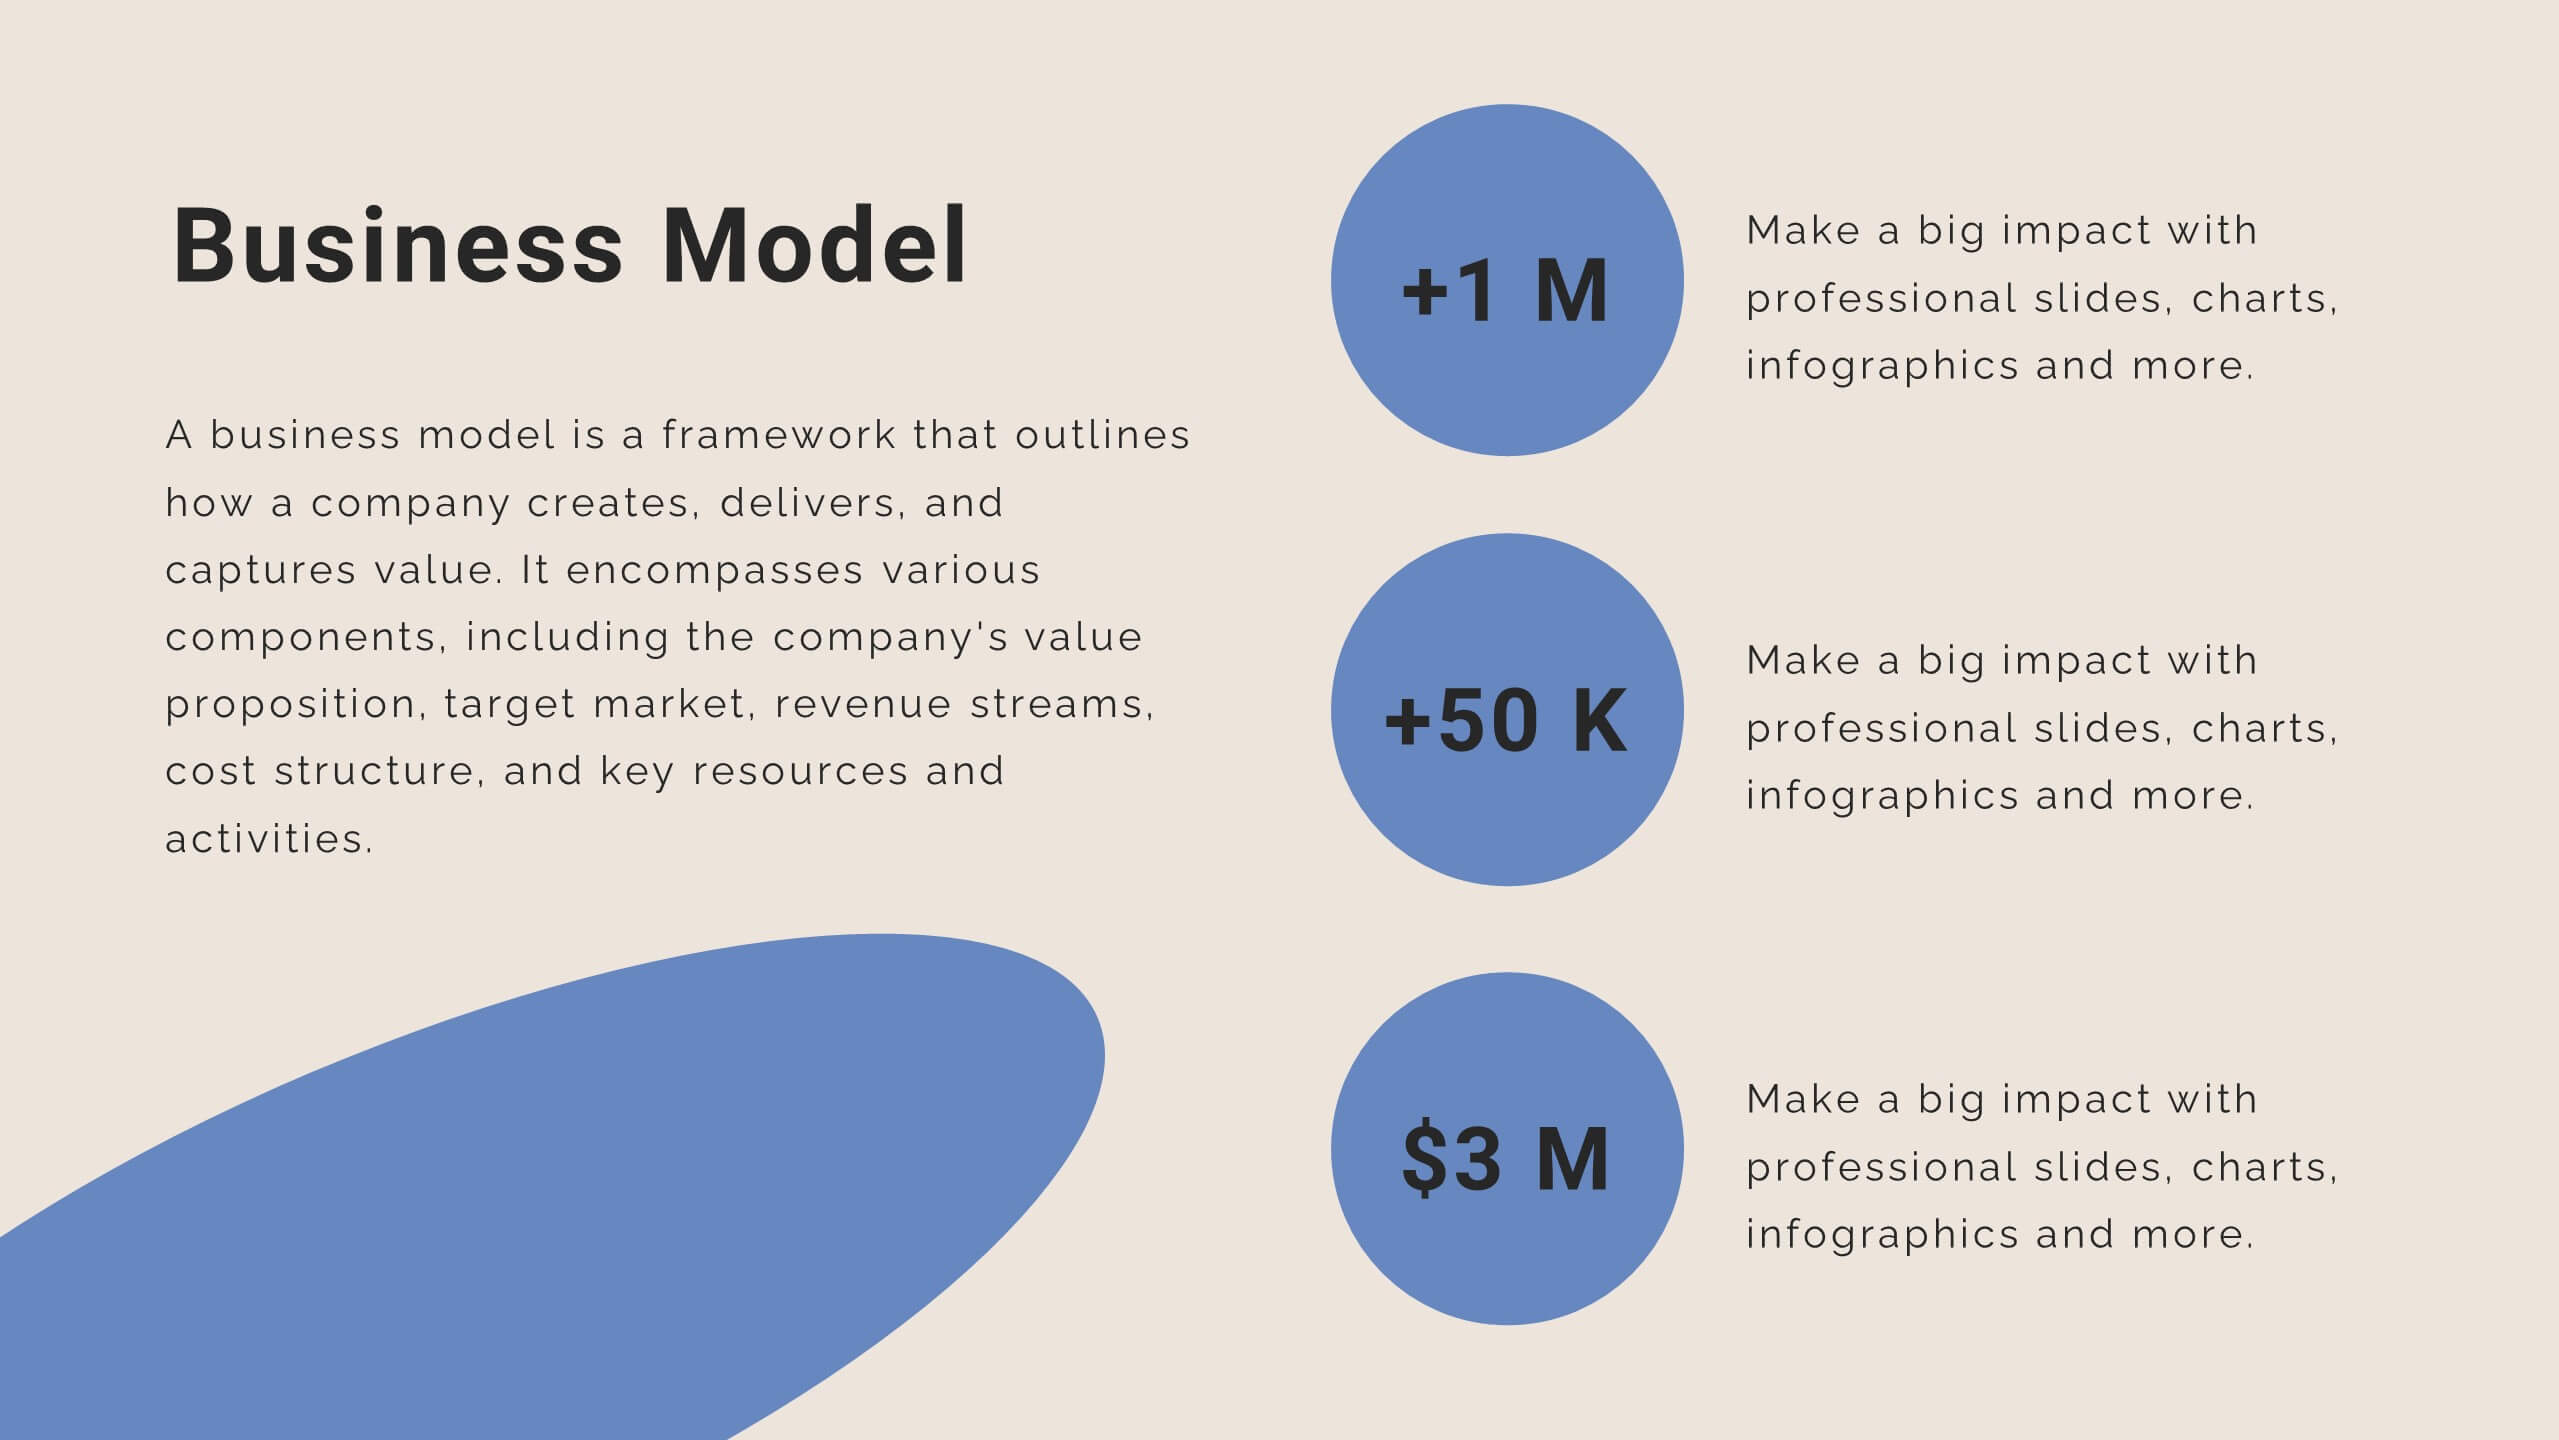
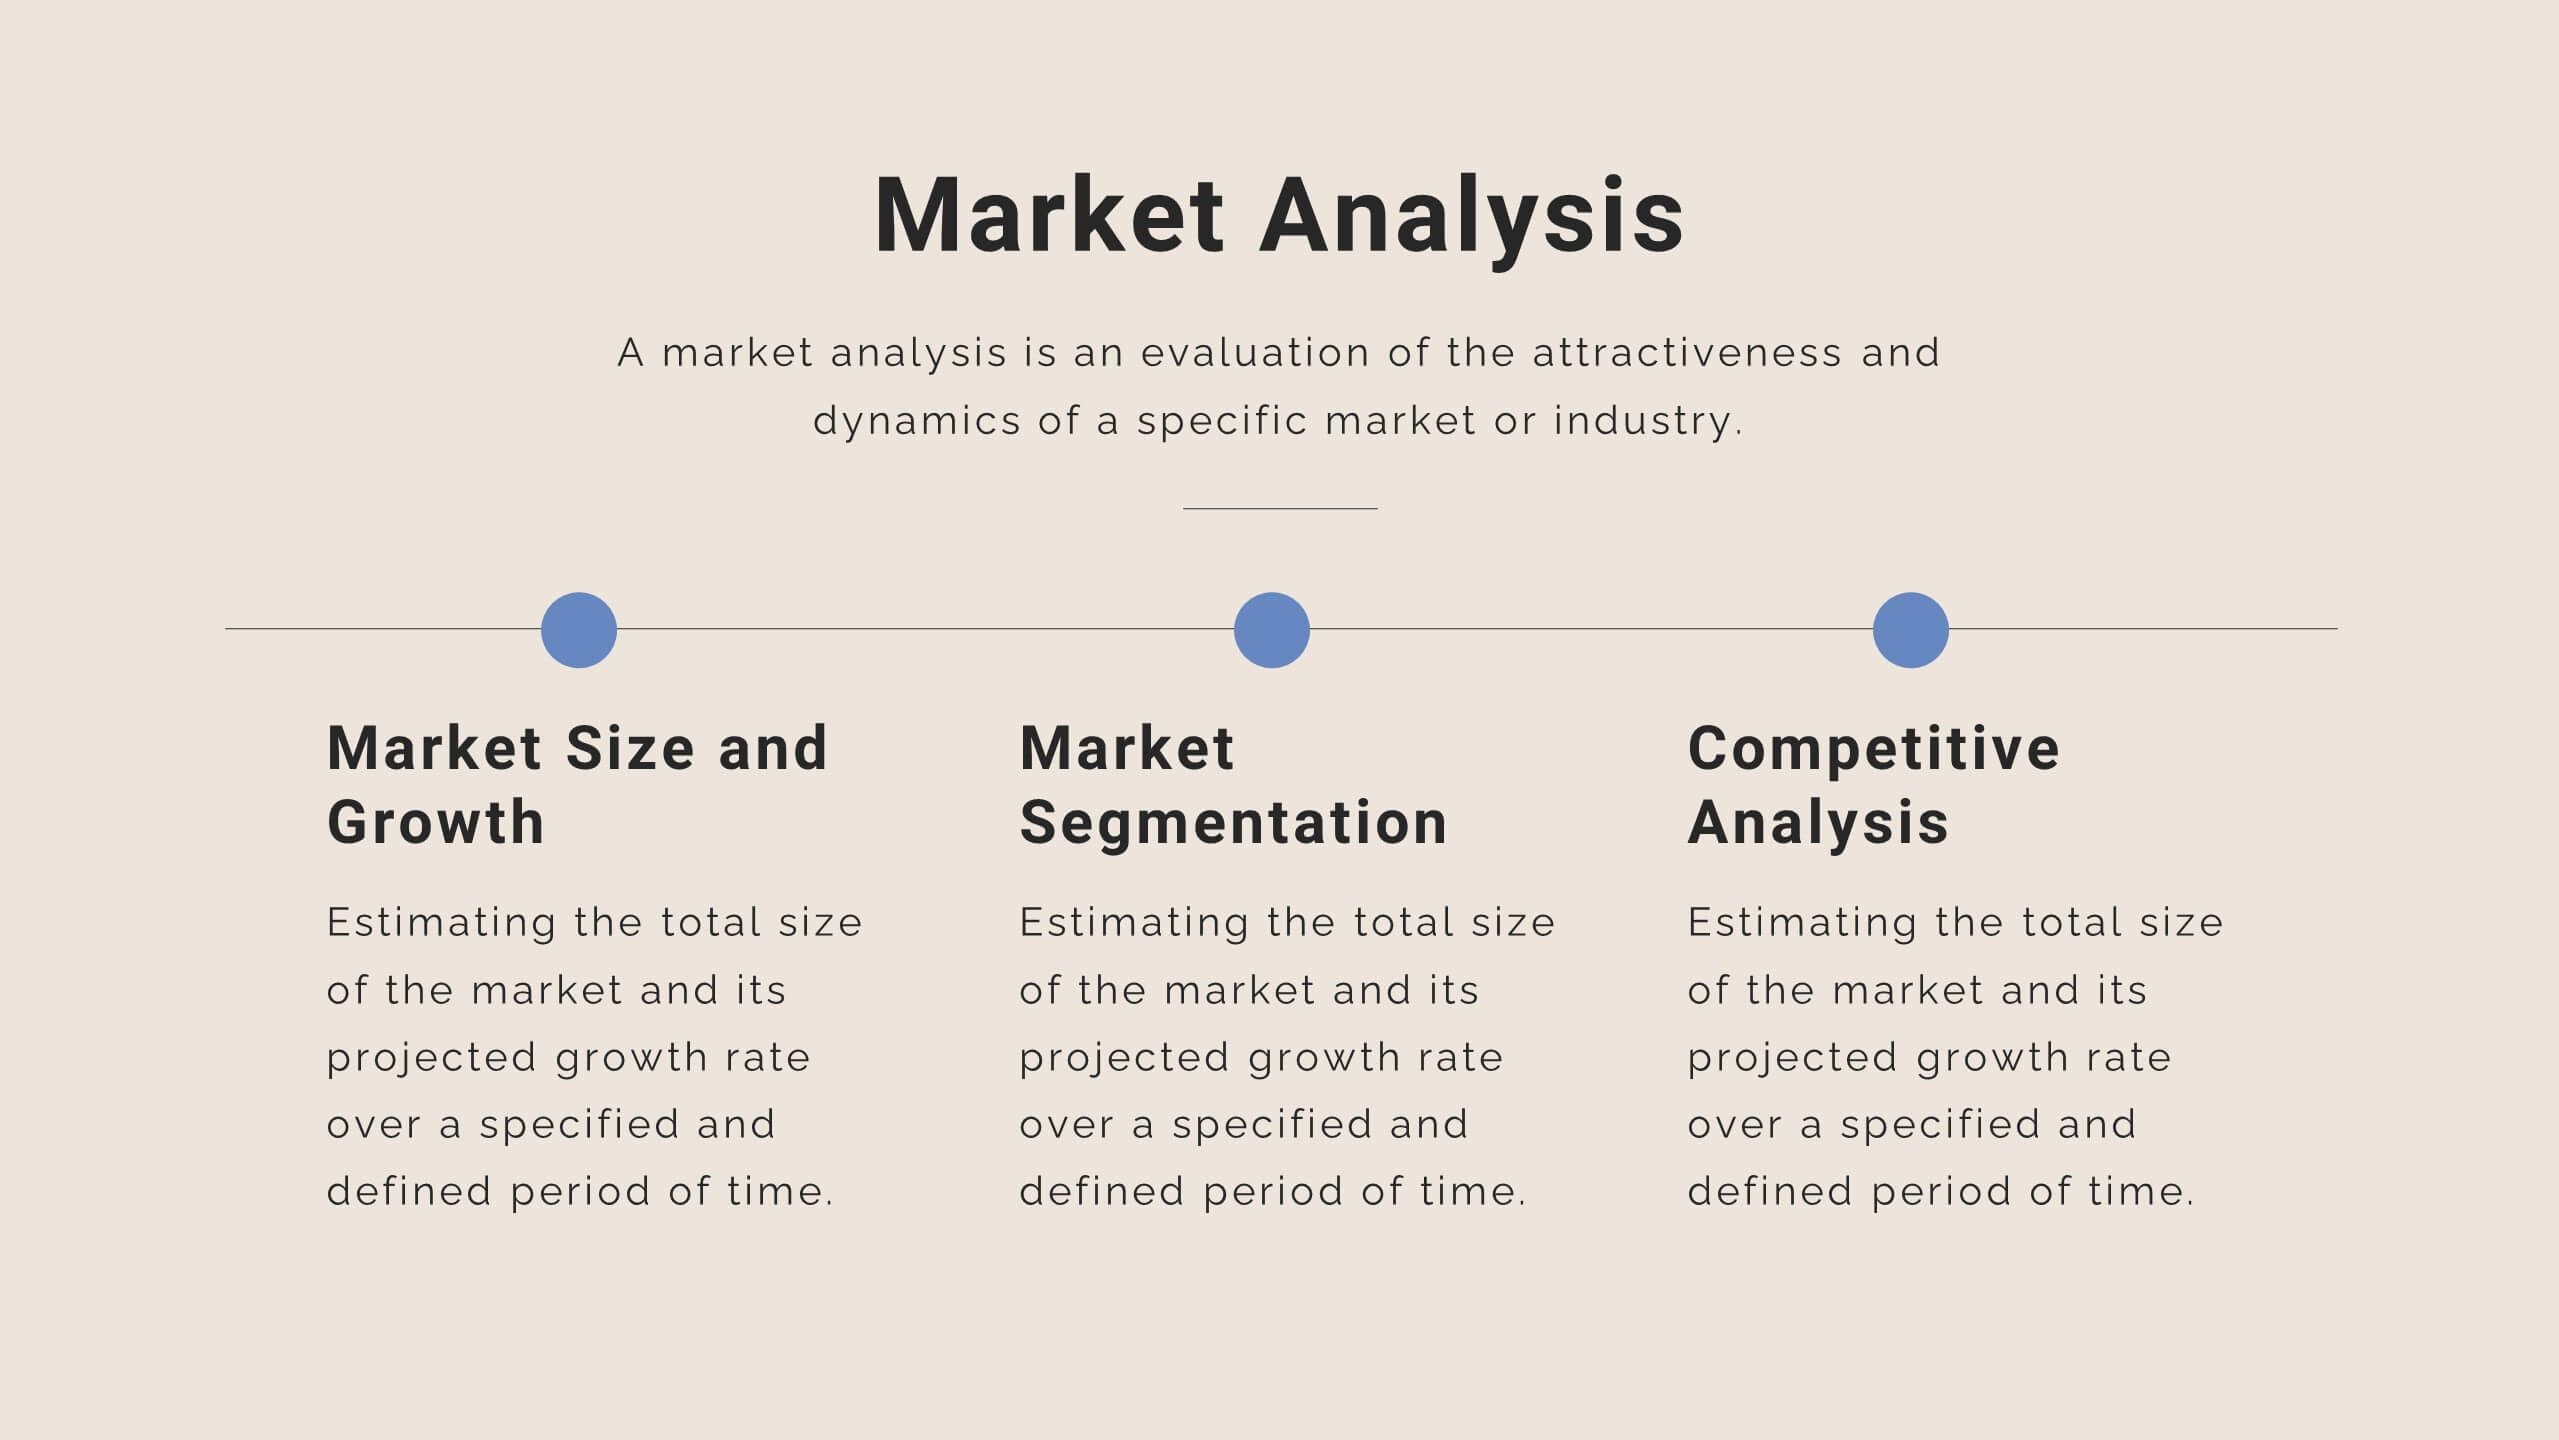
Mystic Startup Strategy Presentation
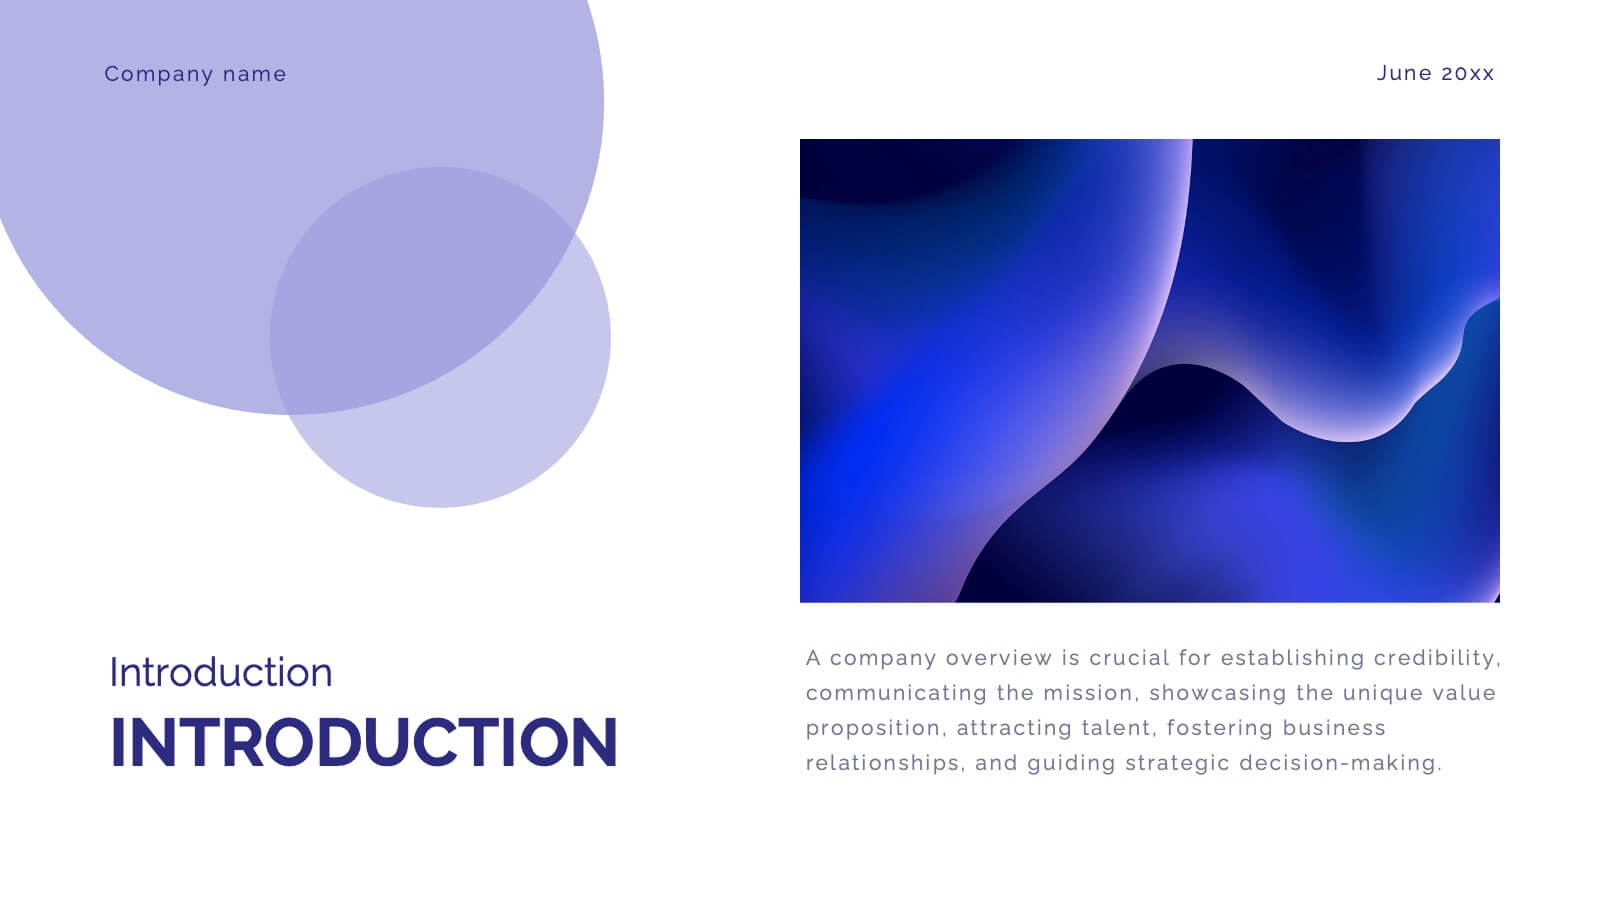
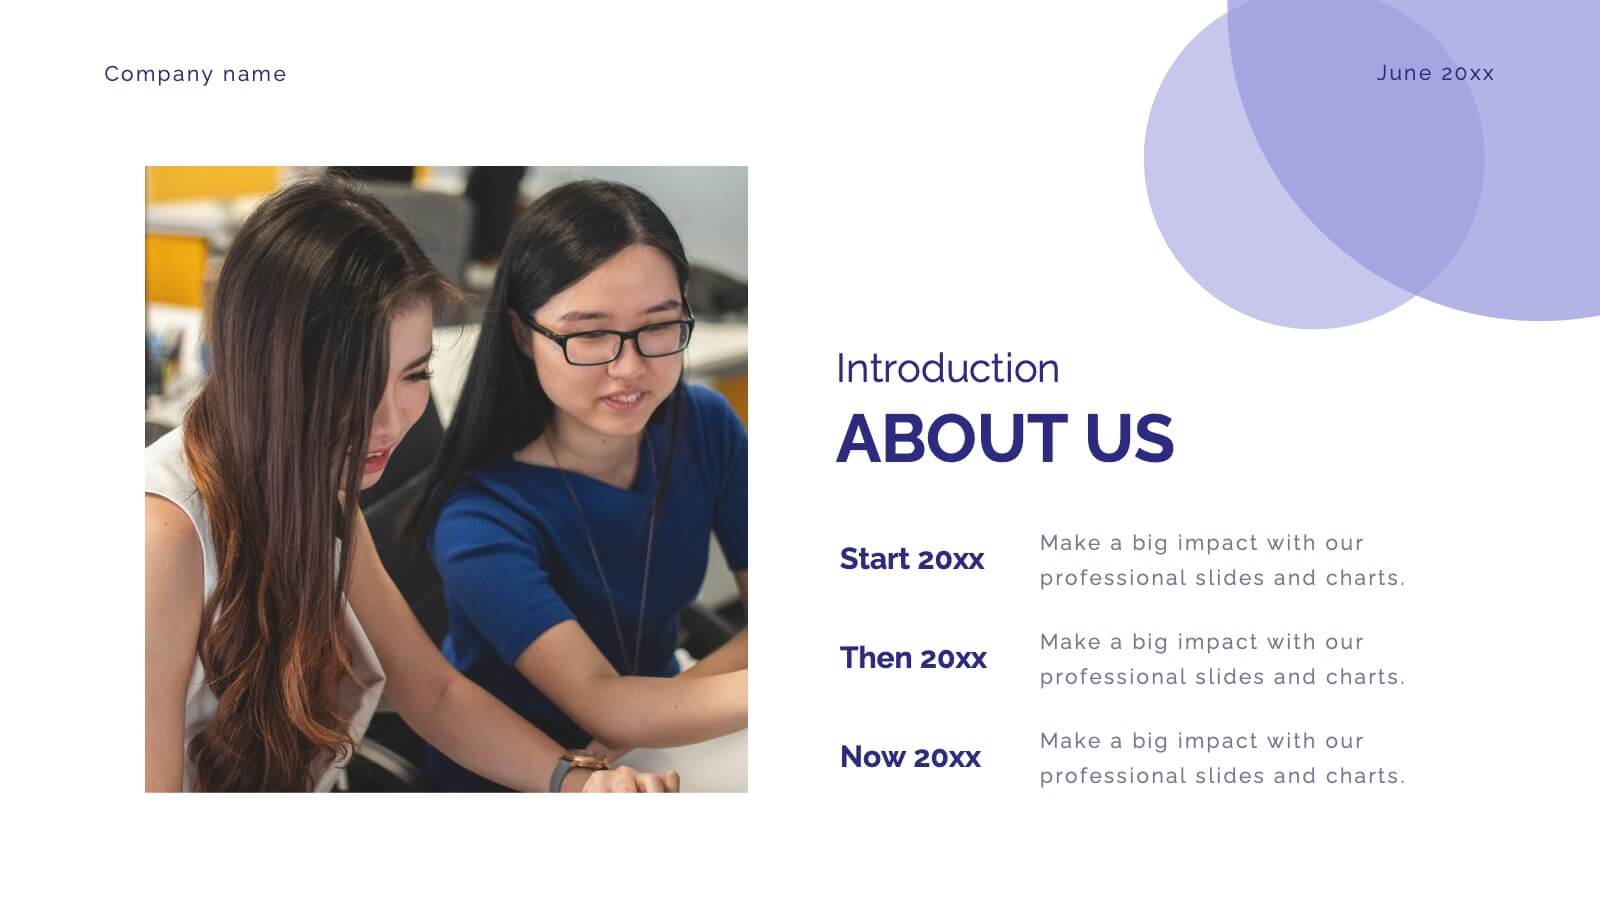
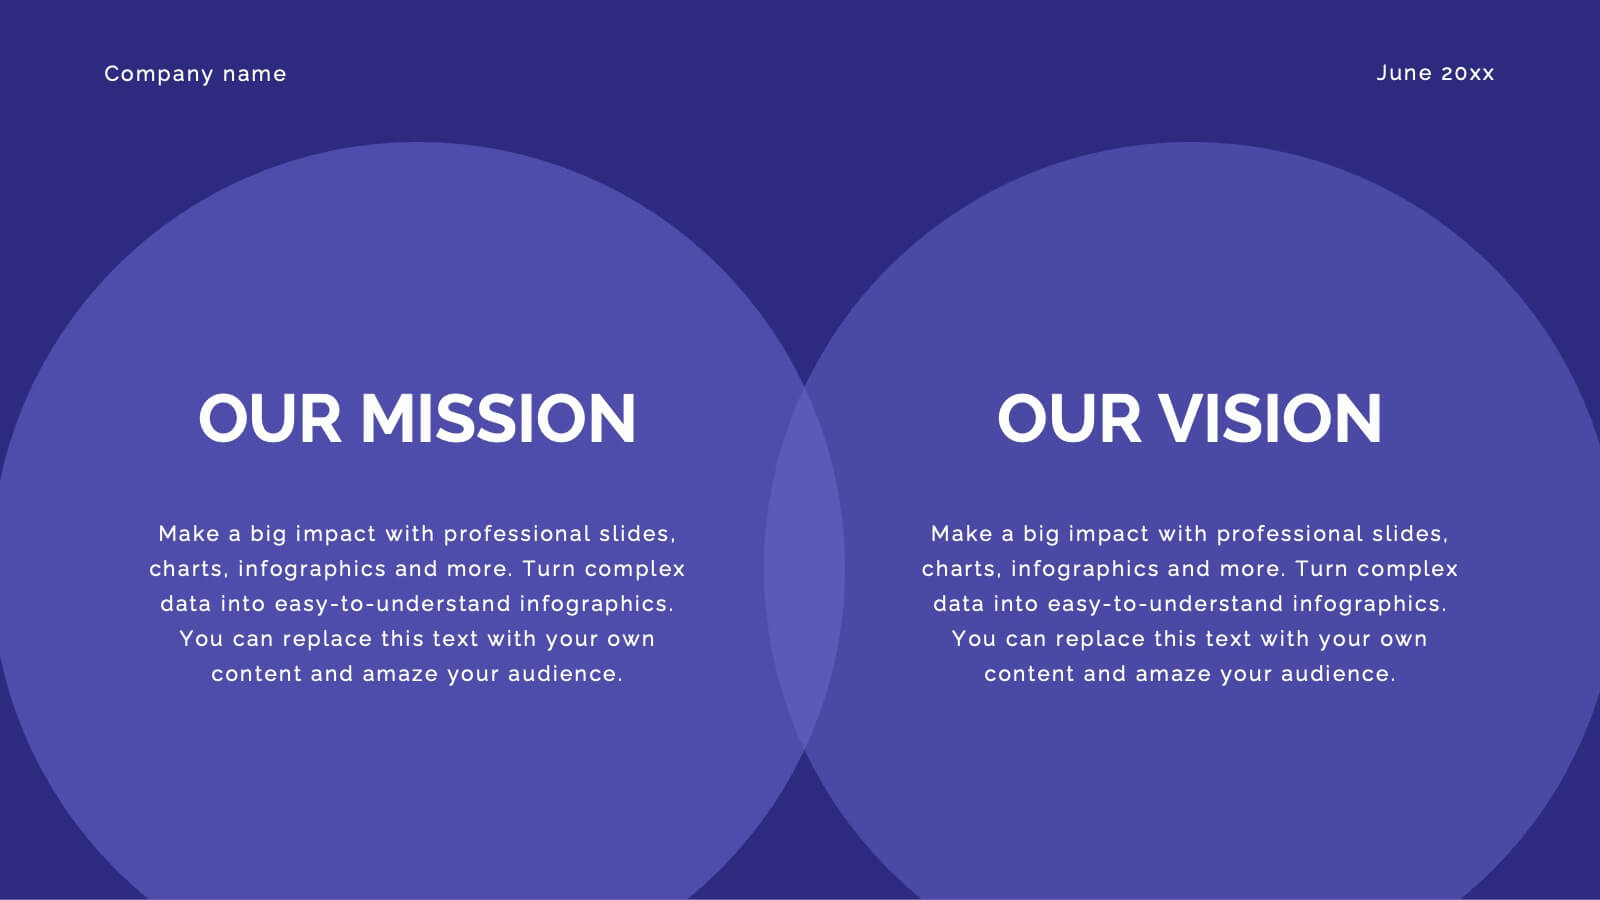
Launch your startup with confidence using this comprehensive funding proposal template! Perfect for showcasing your mission, vision, and business model to potential investors. Highlight your unique value proposition and growth plan with style. Compatible with PowerPoint, Keynote, and Google Slides, this template ensures your pitch stands out and secures the funding you need.


23 diapositivas
Night Slash UX Strategy Plan Presentation
Elevate your UX/UI design presentations with the Night Slate UX Strategy Plan template! This dynamic and visually striking design is perfect for conveying your strategic ideas with impact. The bold use of contrasting black and orange creates a modern and energetic vibe, making your content stand out. Each slide is thoughtfully designed to cover every aspect of your UX/UI strategy, from user research and personas to prototyping and user testing. The template includes sections on design principles, wireframes, and responsive design, ensuring that your audience gains a comprehensive understanding of your approach. Whether you're presenting to stakeholders or guiding a design team, this template is designed to keep your audience engaged and informed. Fully compatible with PowerPoint, Keynote, and Google Slides, the Night Slate template is your go-to tool for delivering compelling UX/UI strategy presentations that leave a lasting impression.


26 diapositivas
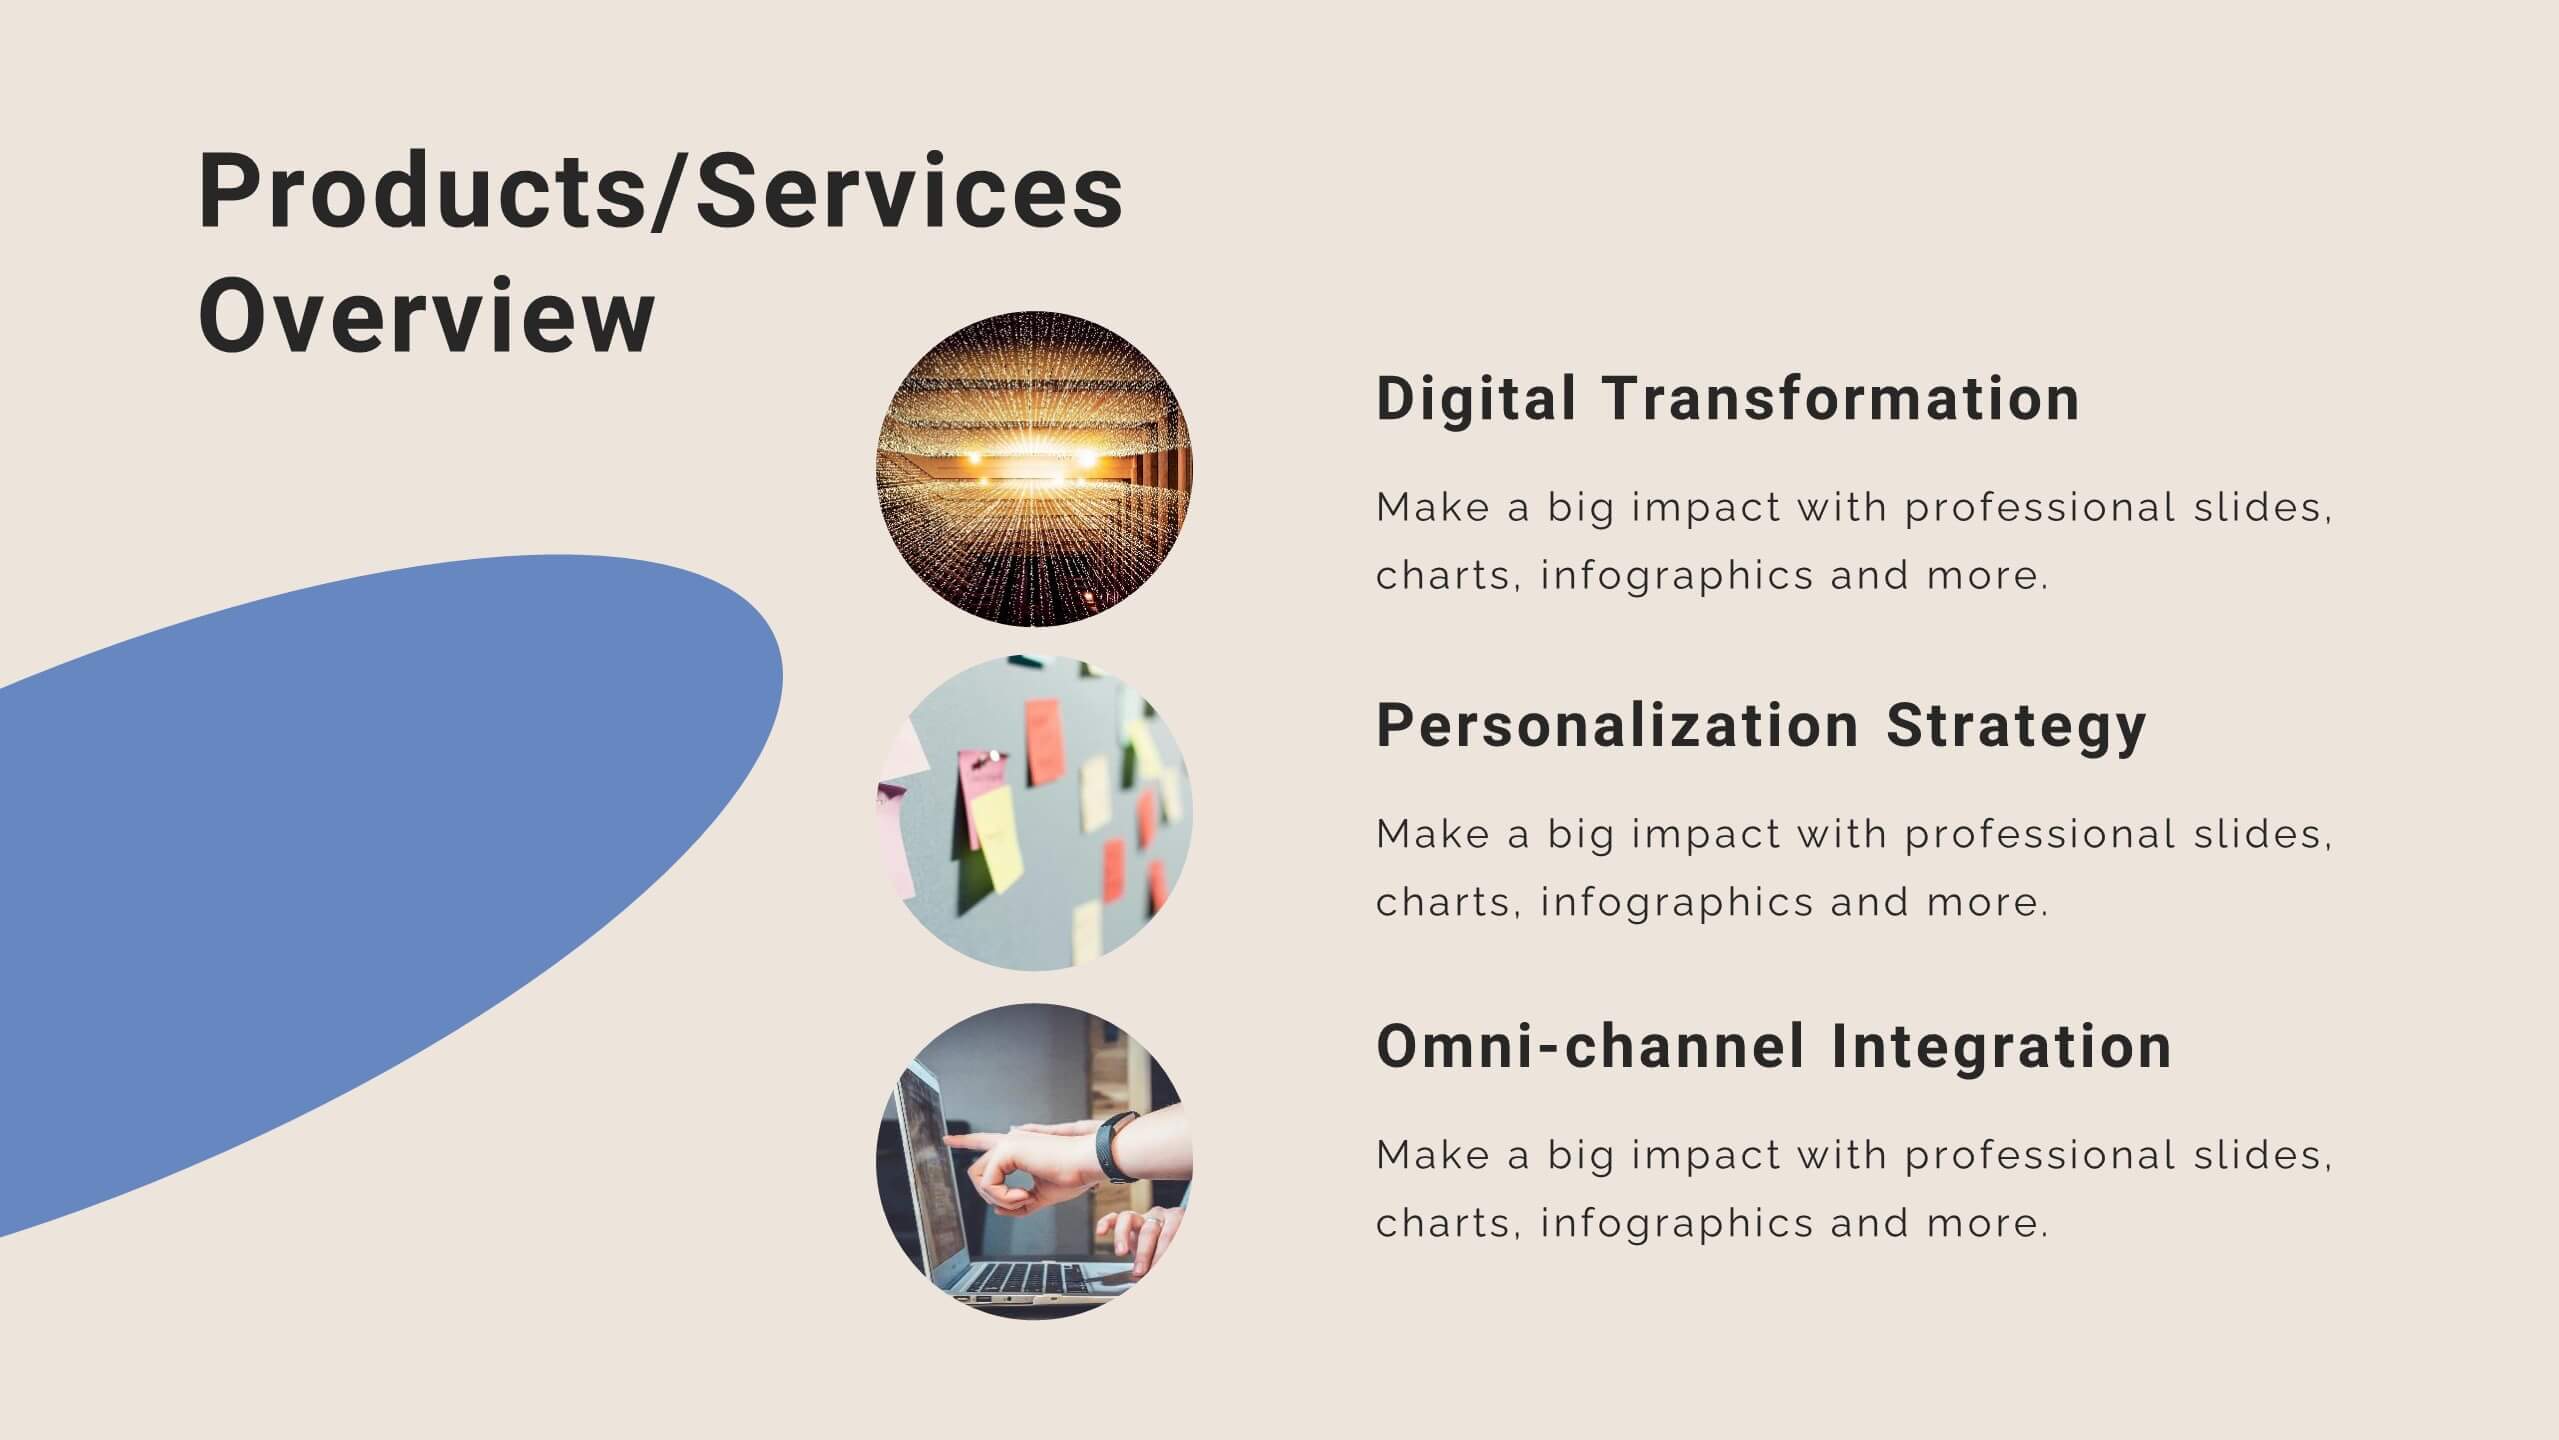
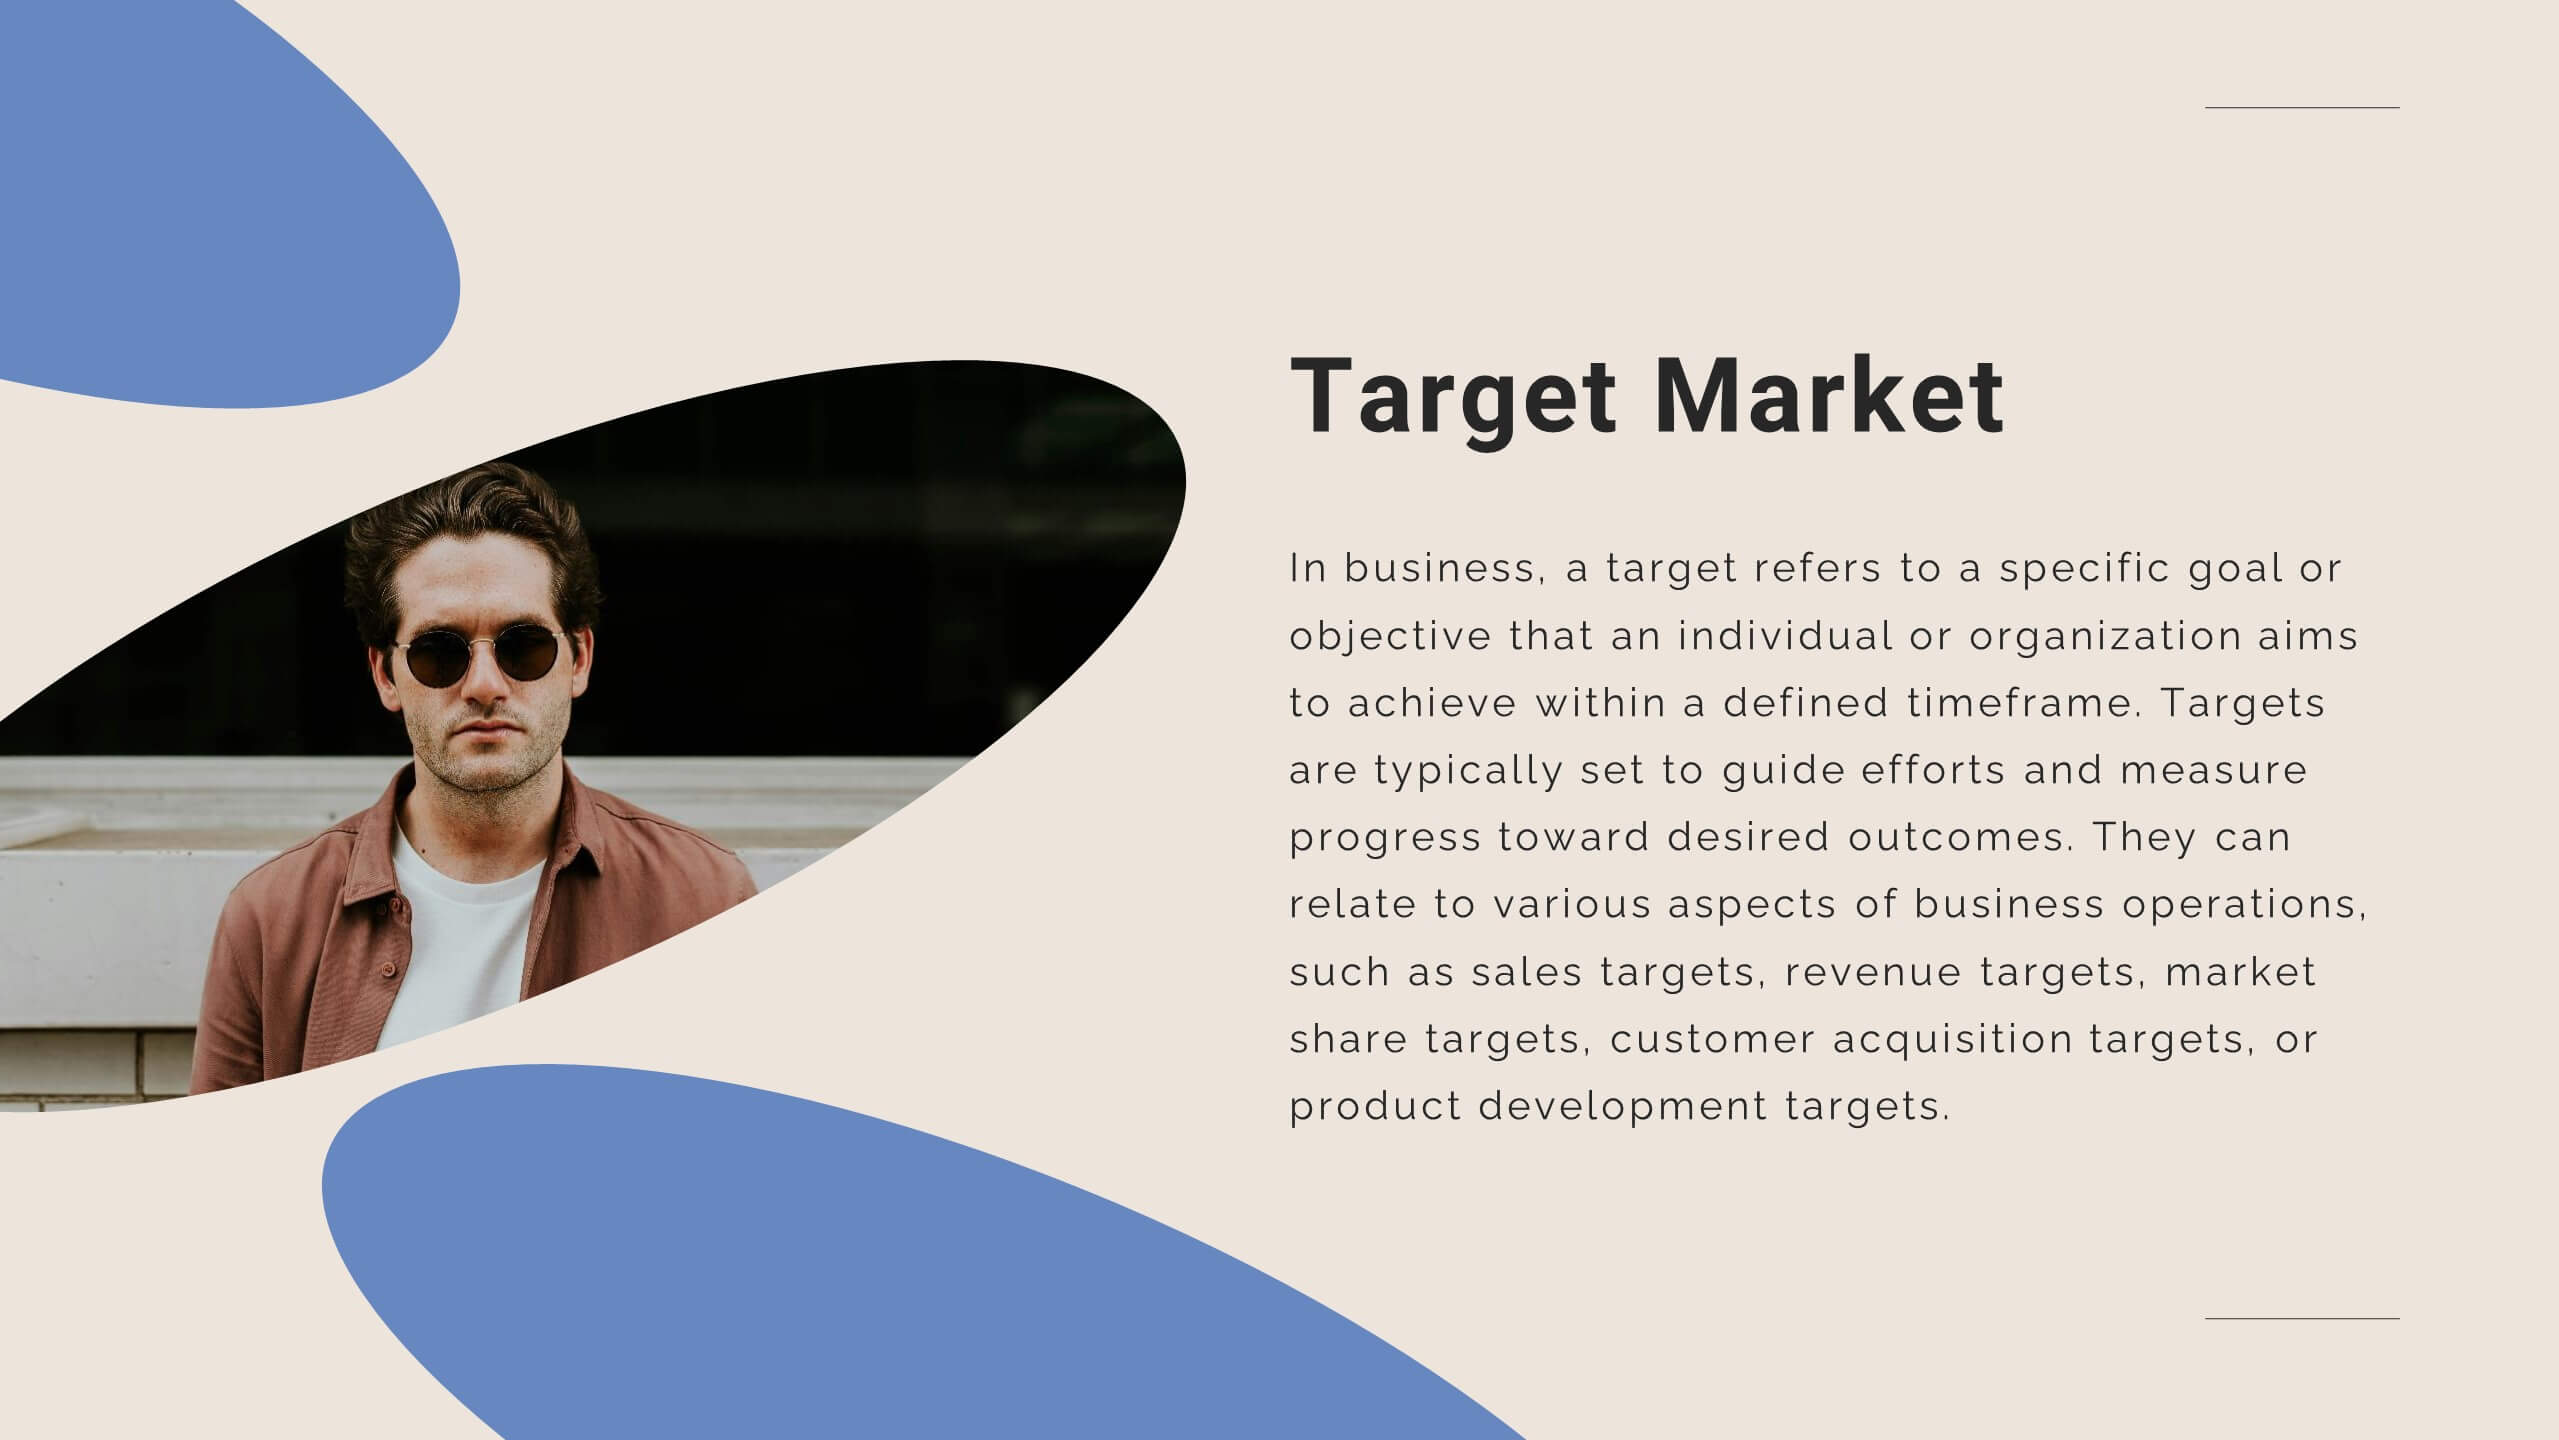
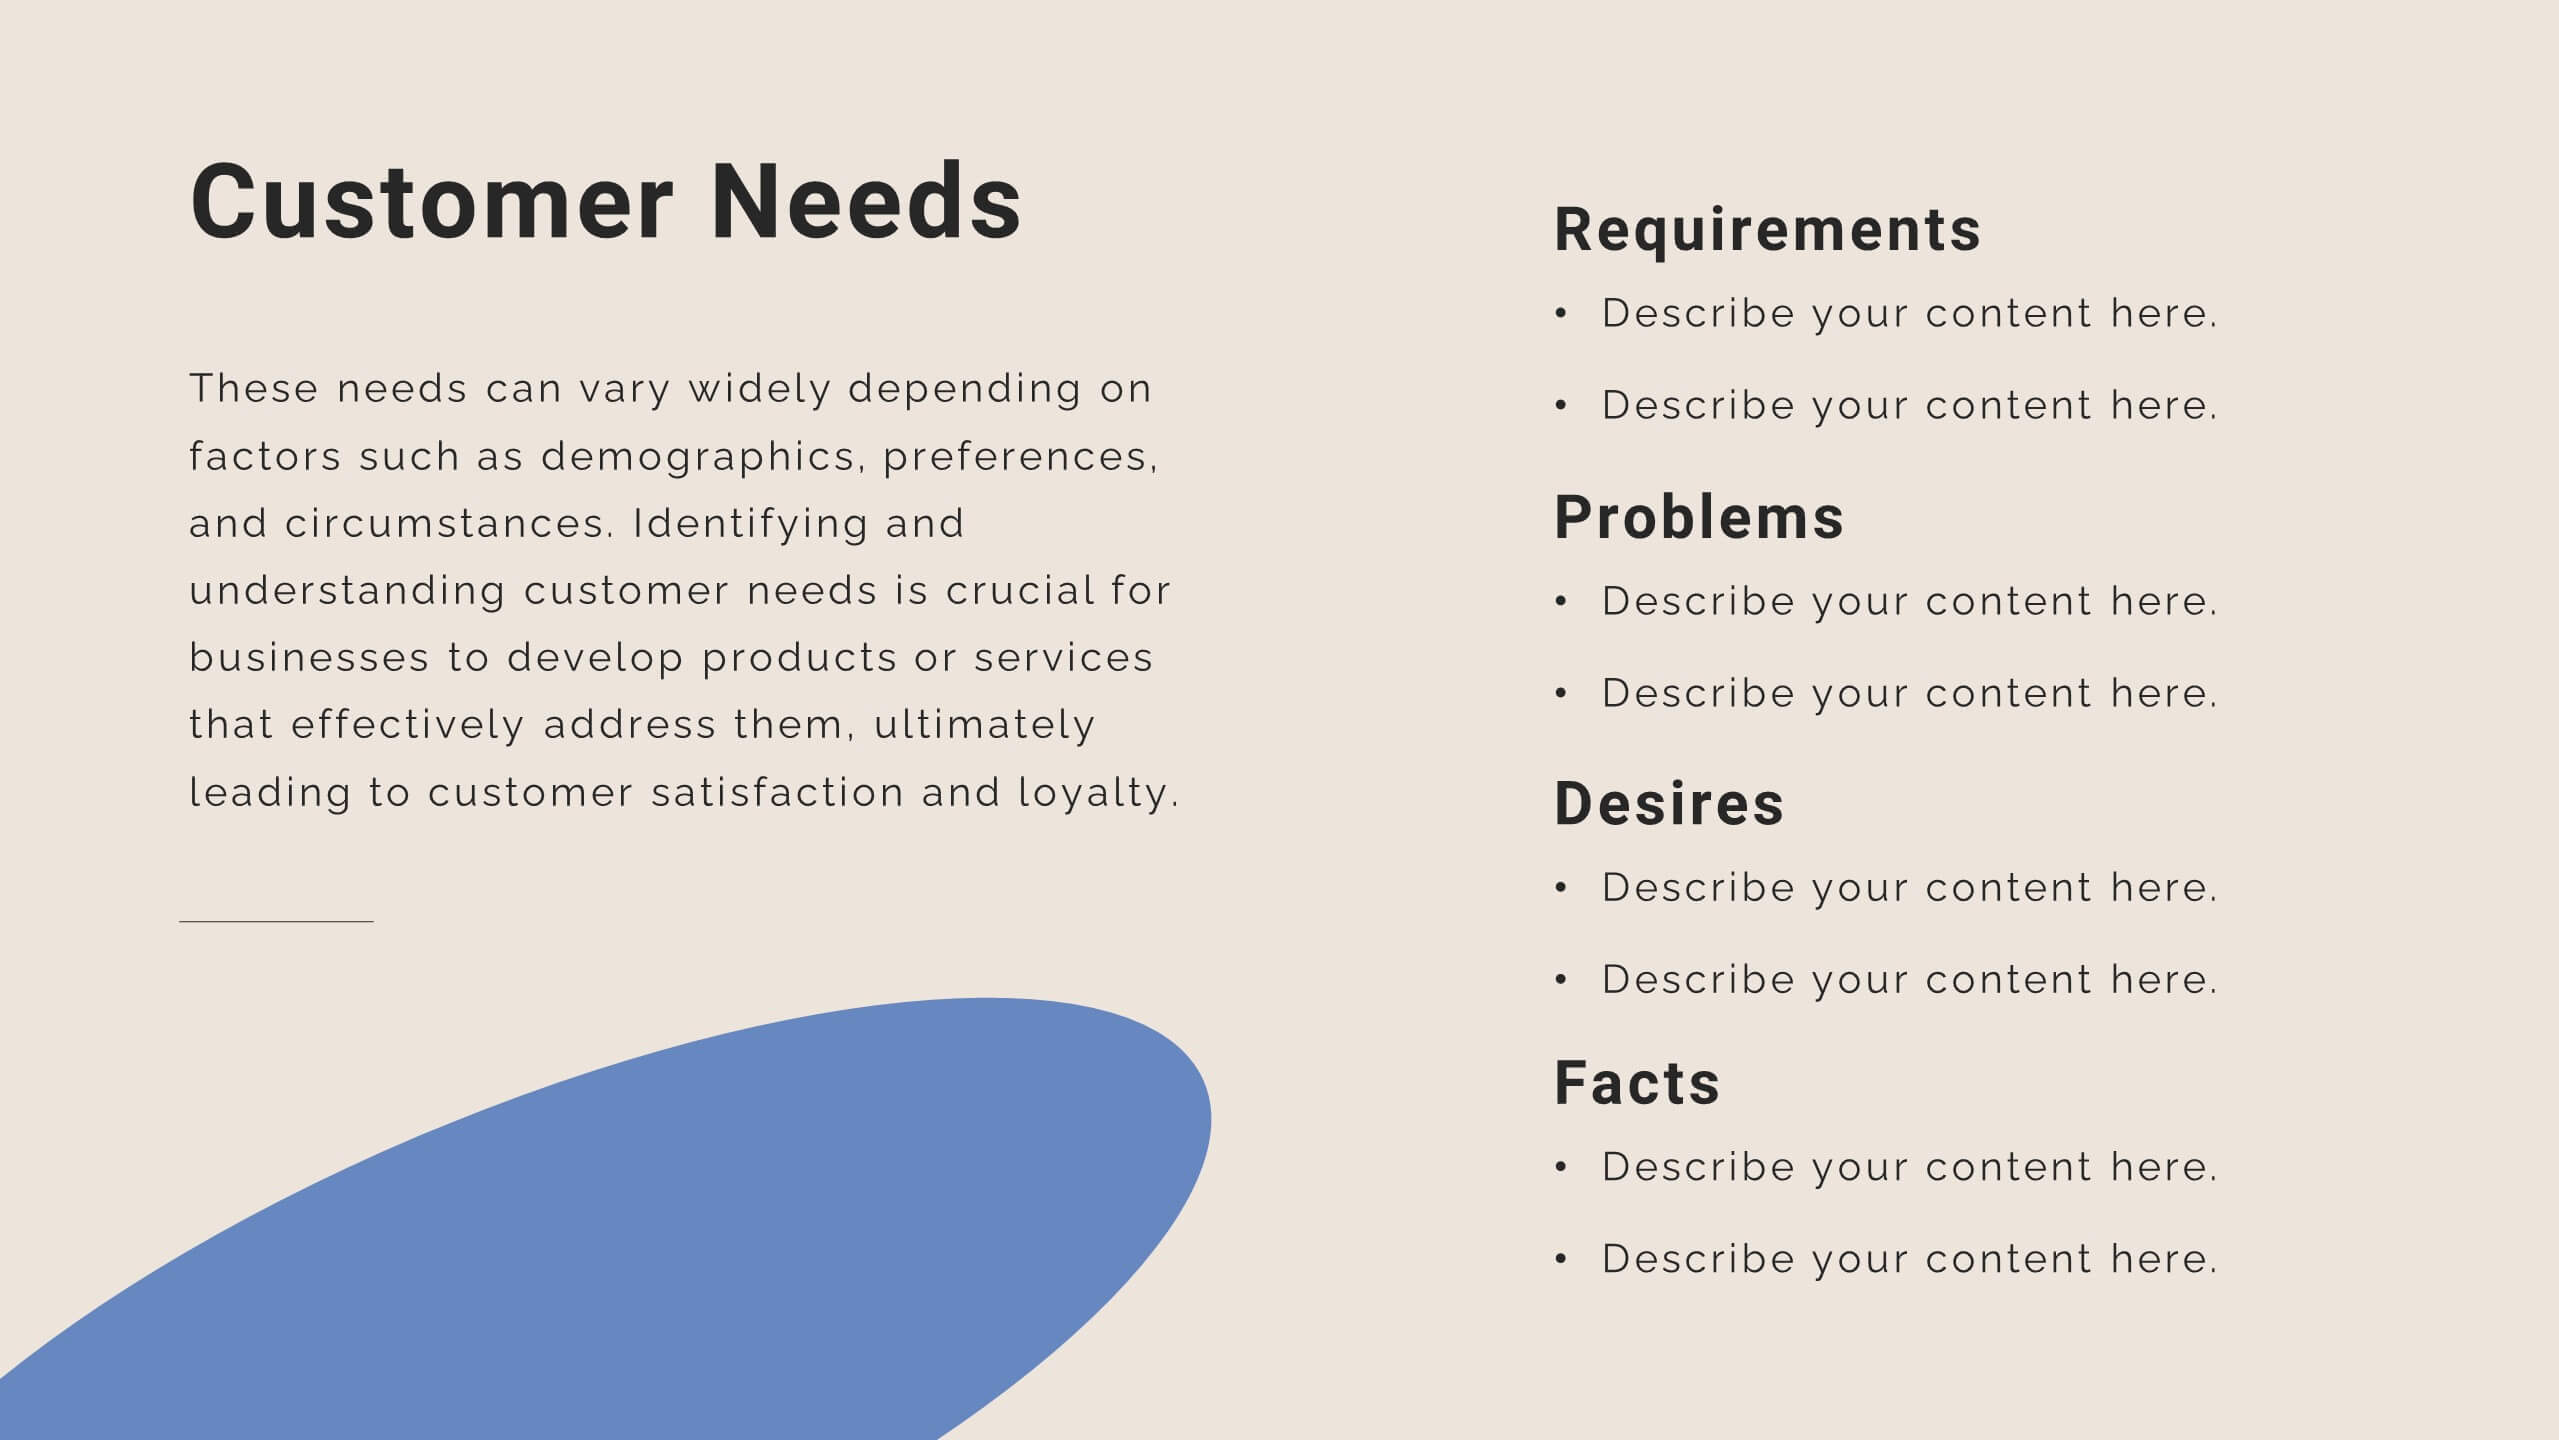
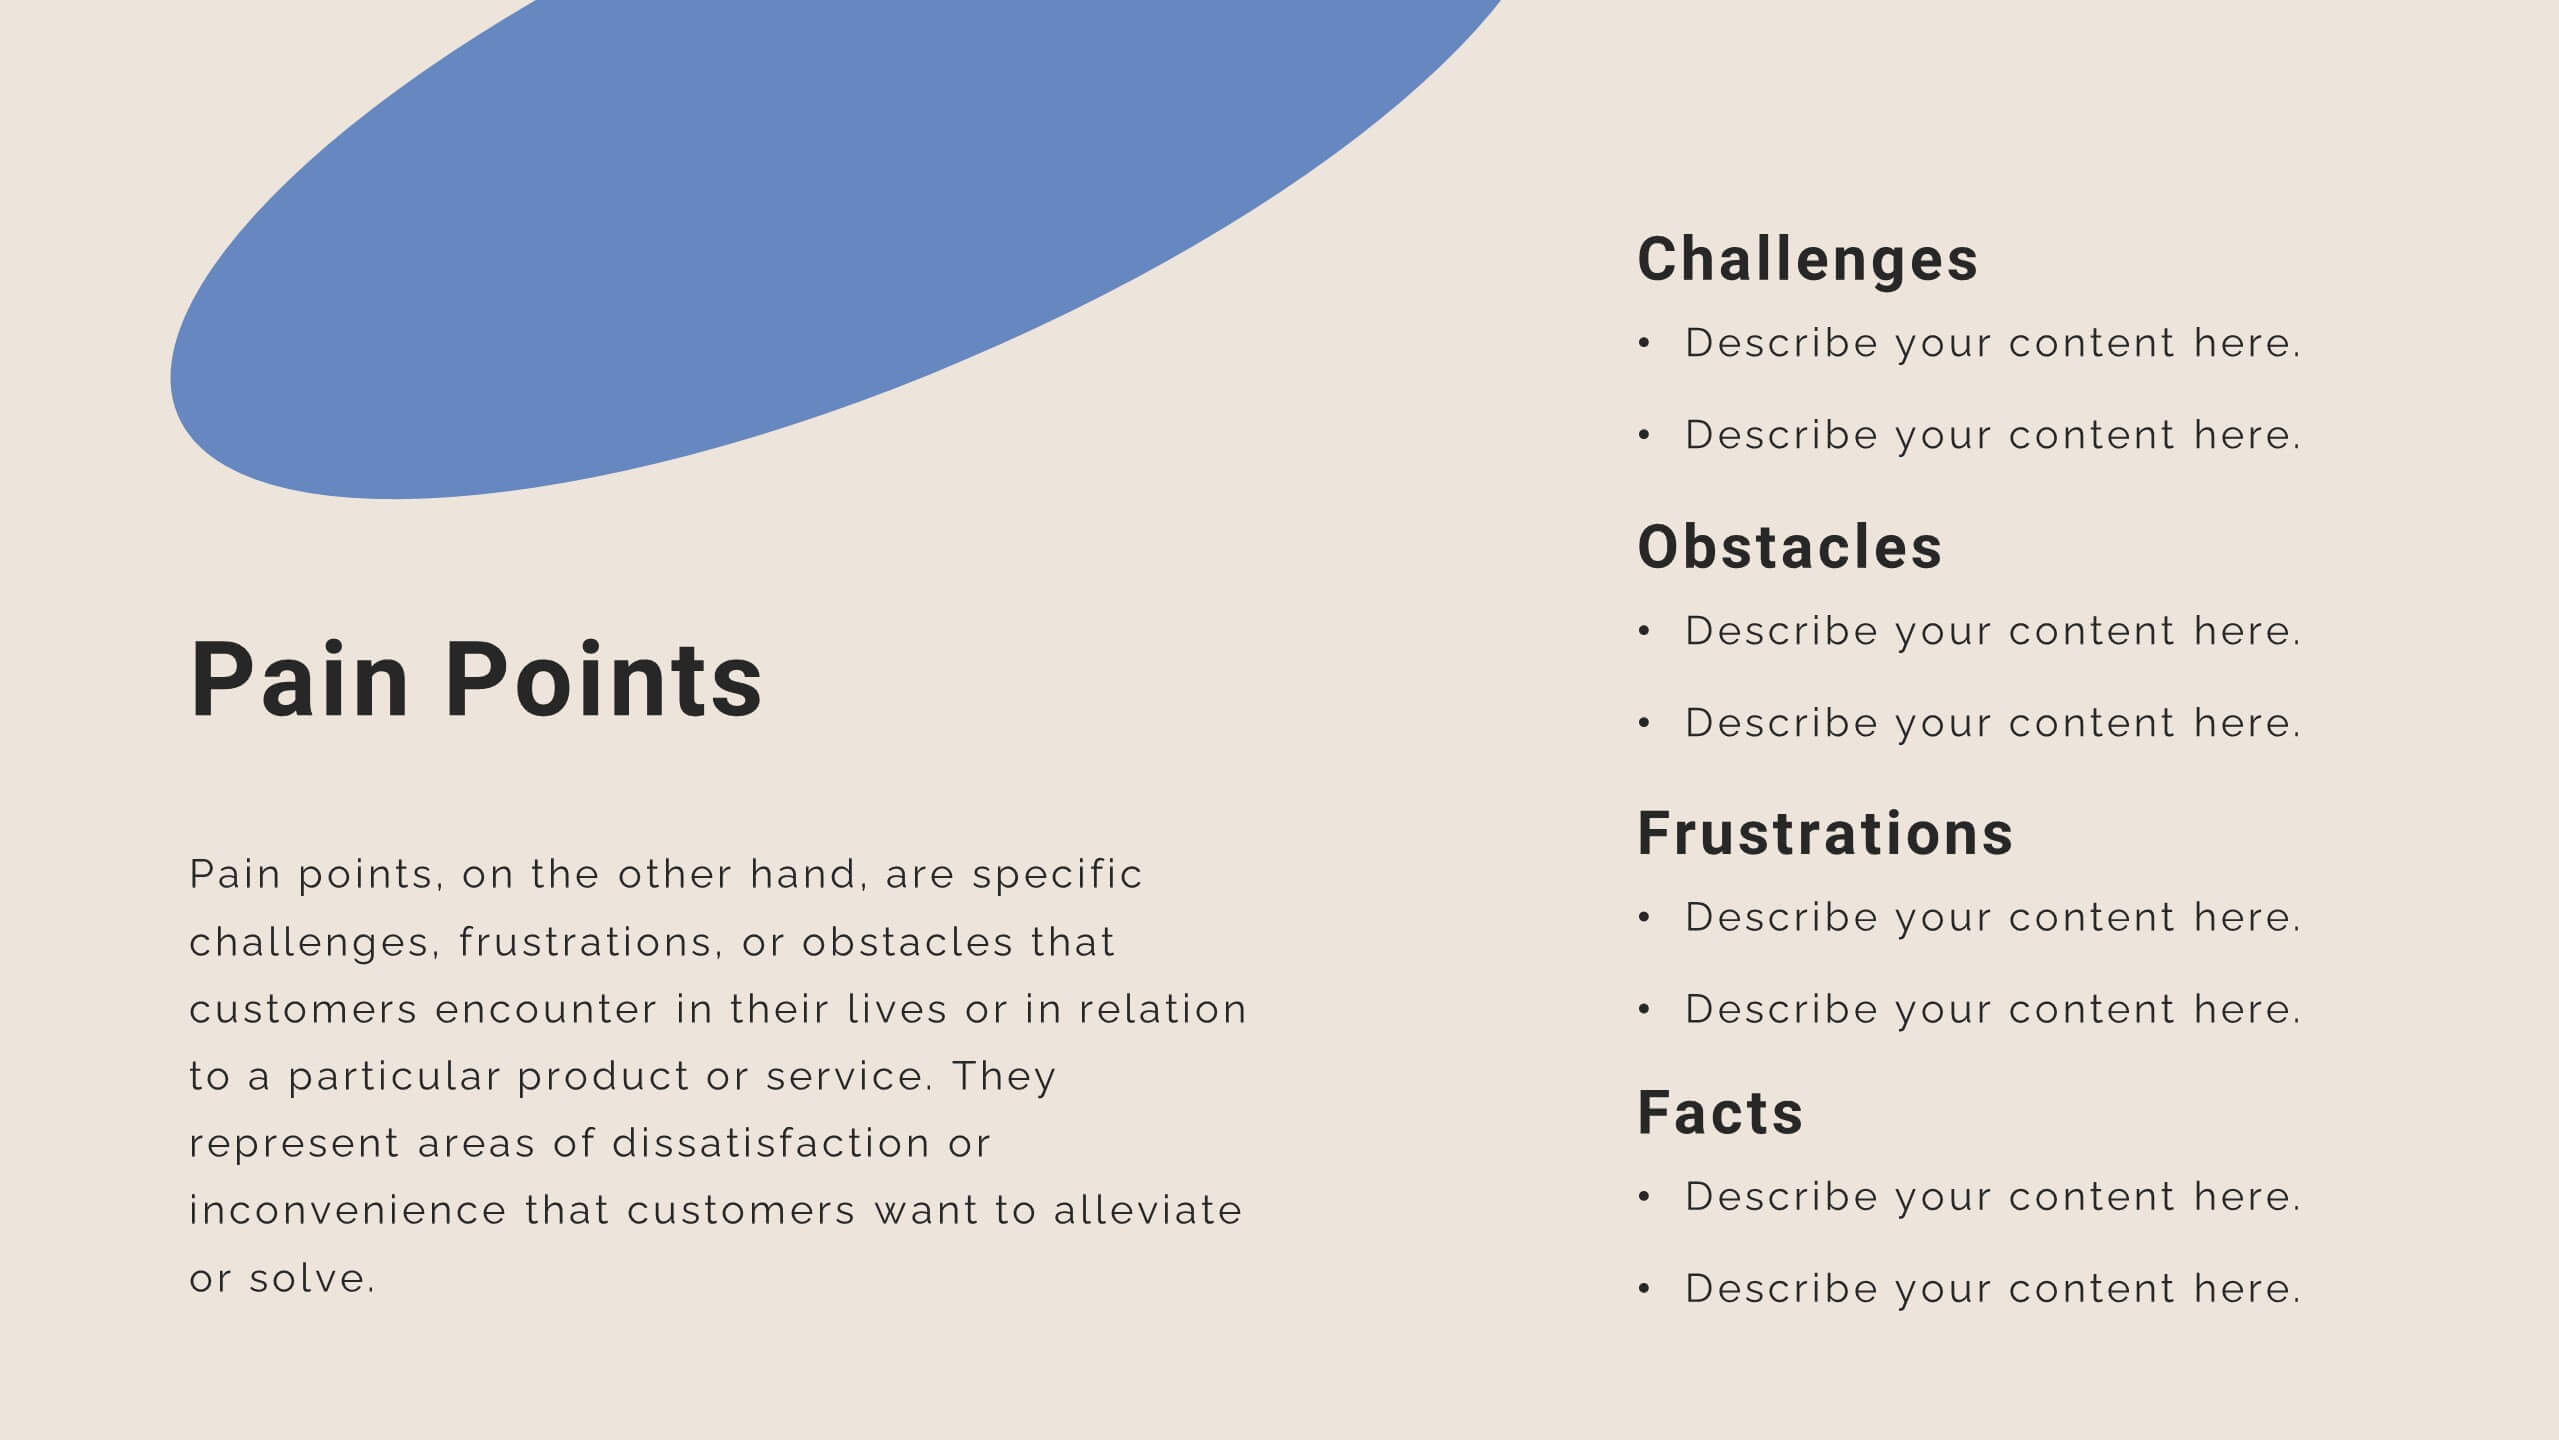
Austin Presentation Template
Sports photography captures the essence of sports and its participants by conveying a strong image. The photographer needs to carefully plan the timing of taking these photos. The Austin Template is perfect for displaying information about your products and services. Vivid and bold colors draw your audience's attention, while the creative sections provide all the relevant details. With an appealing layout and stylish design, you can present yourself in the best light possible. This template will give your site the professional look it deserves, and be sure to stand out to your clients.


5 diapositivas
Risk Detection Techniques Presentation
Spot potential risks before they escalate with this step-by-step risk detection visual. Featuring ascending block elements and a dynamic layout, this template is ideal for illustrating detection stages or evaluation metrics. Fully editable in PowerPoint, Keynote, and Google Slides—perfect for risk management, audit reports, or compliance presentations.


5 diapositivas
Behavioral Psychology Insights Presentation
Dive deep into the human mind with our 'Behavioral Psychology Insights' presentation template. Perfect for educators and professionals, this template offers a structured way to present complex psychological concepts visually. Ideal for delivering engaging presentations on human behavior, it is compatible with PowerPoint, Keynote, and Google Slides.


8 diapositivas
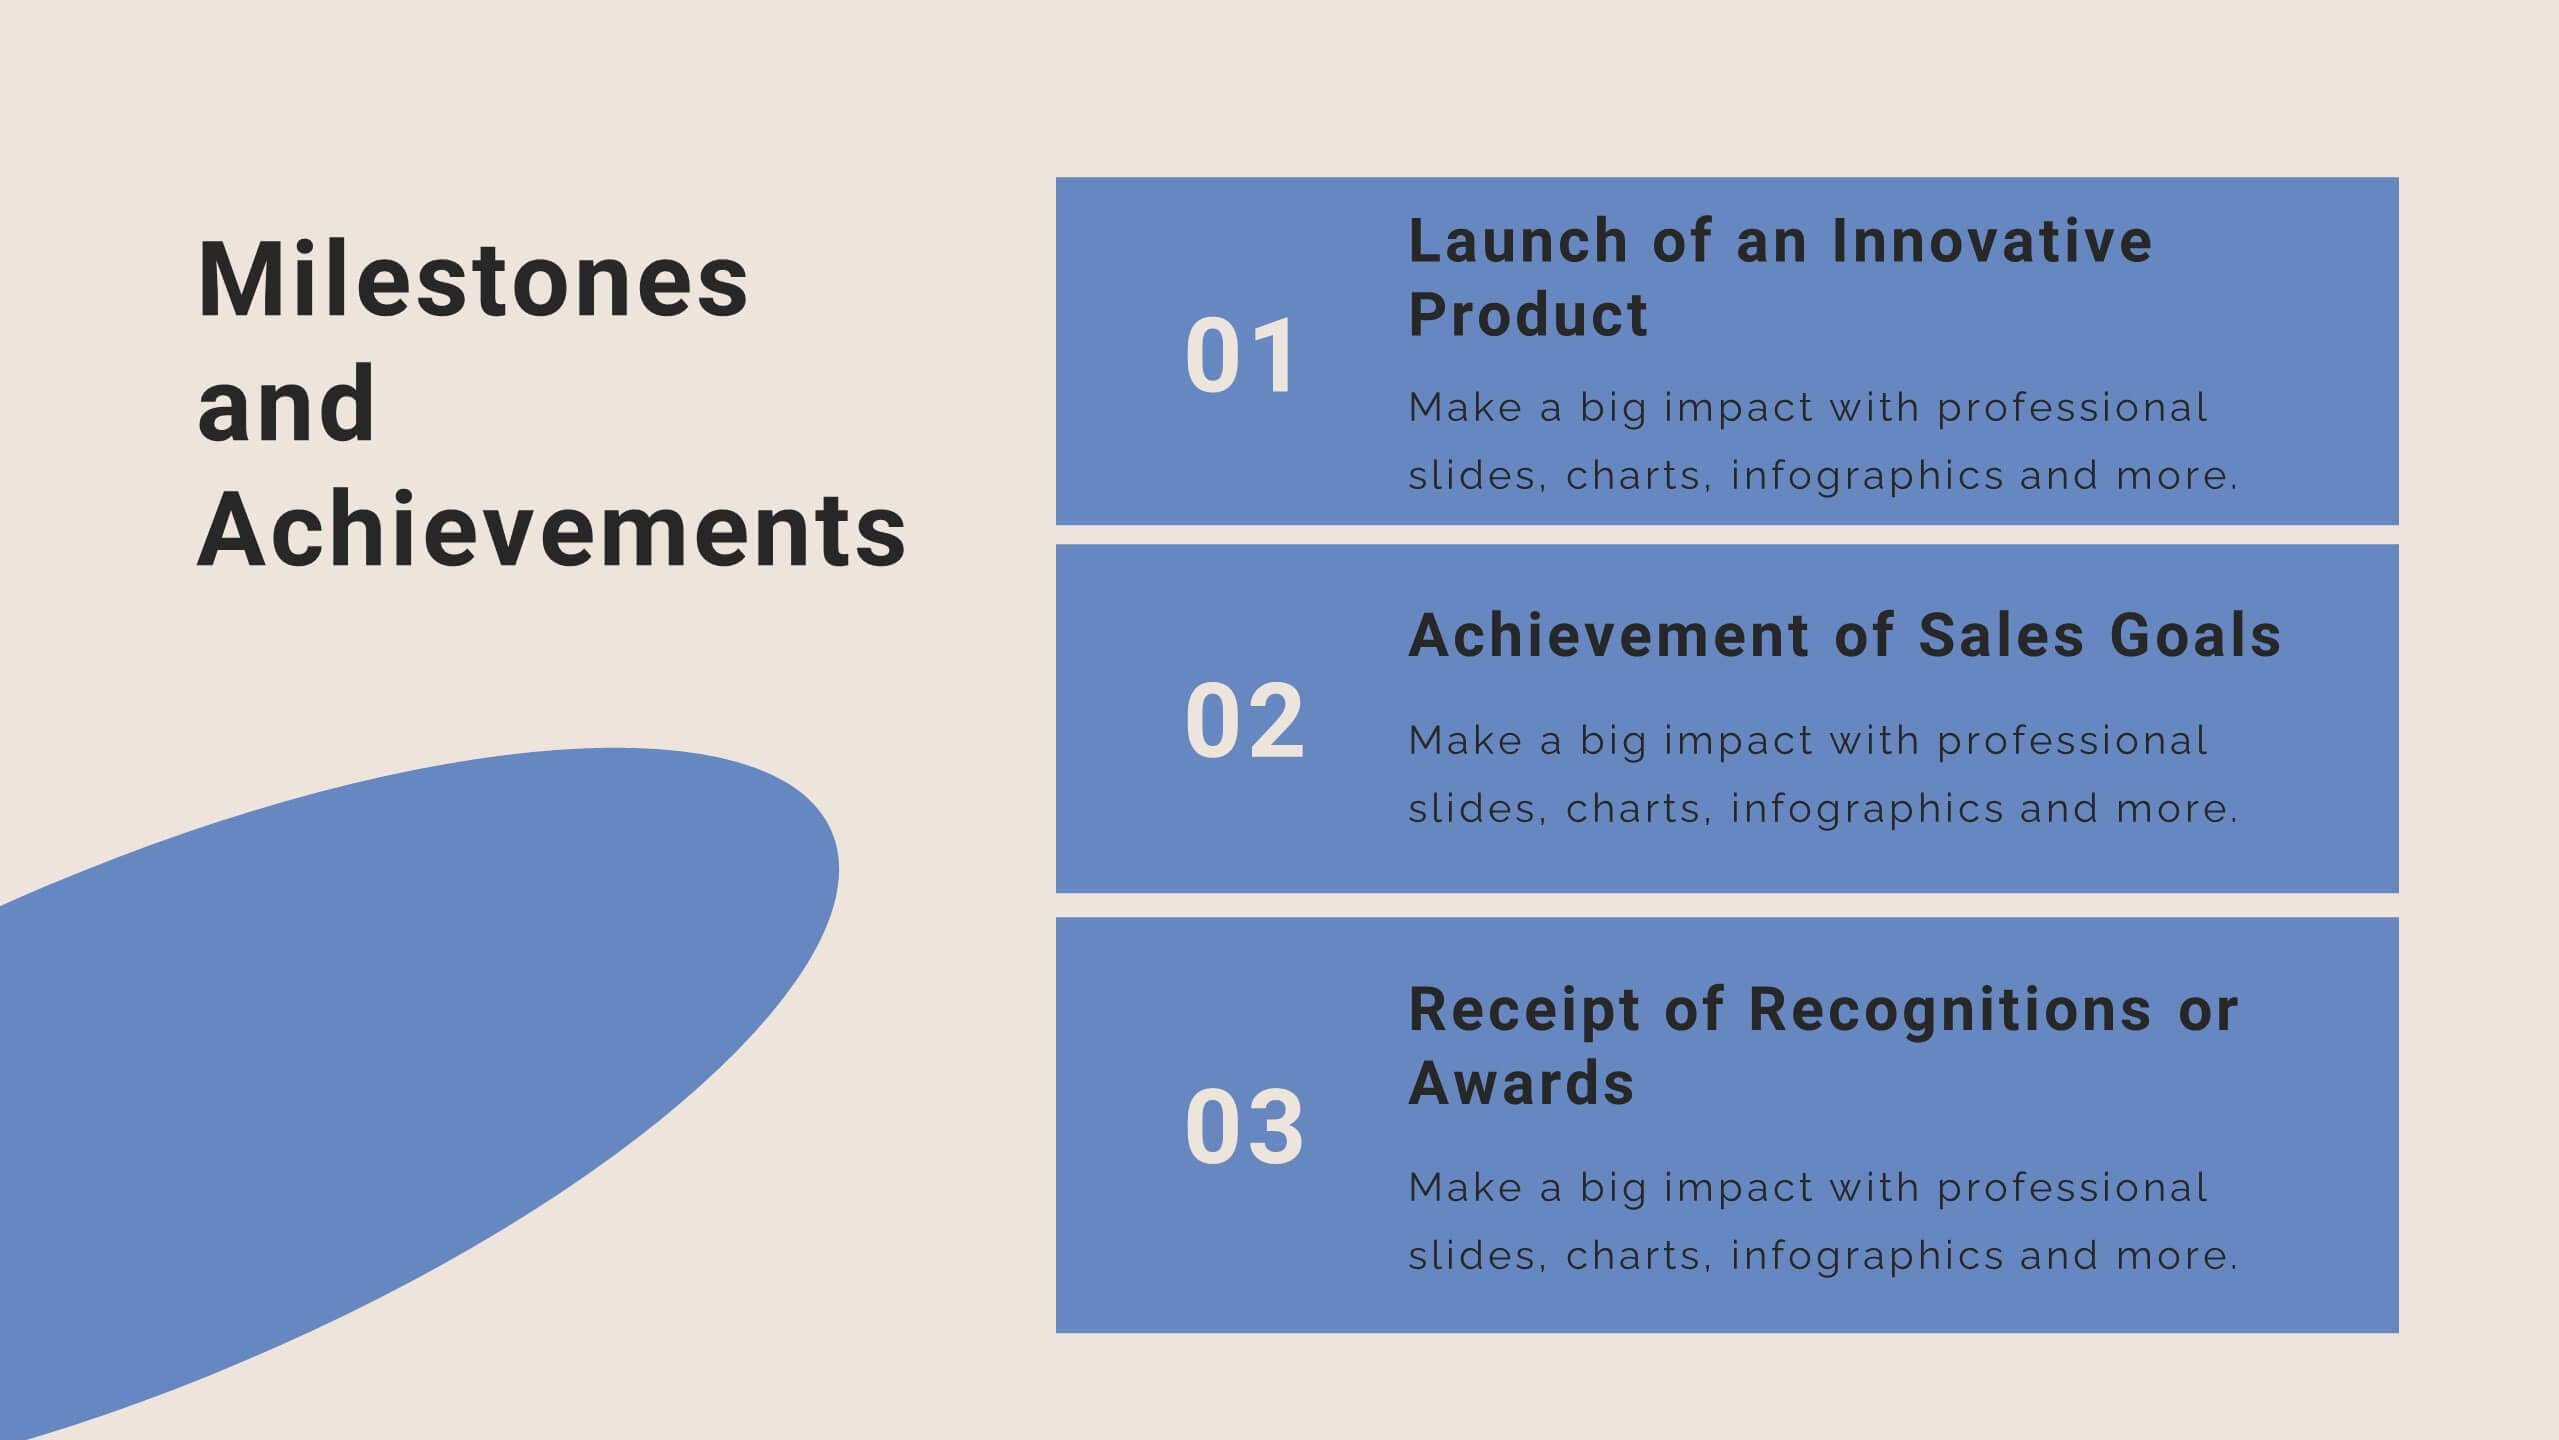
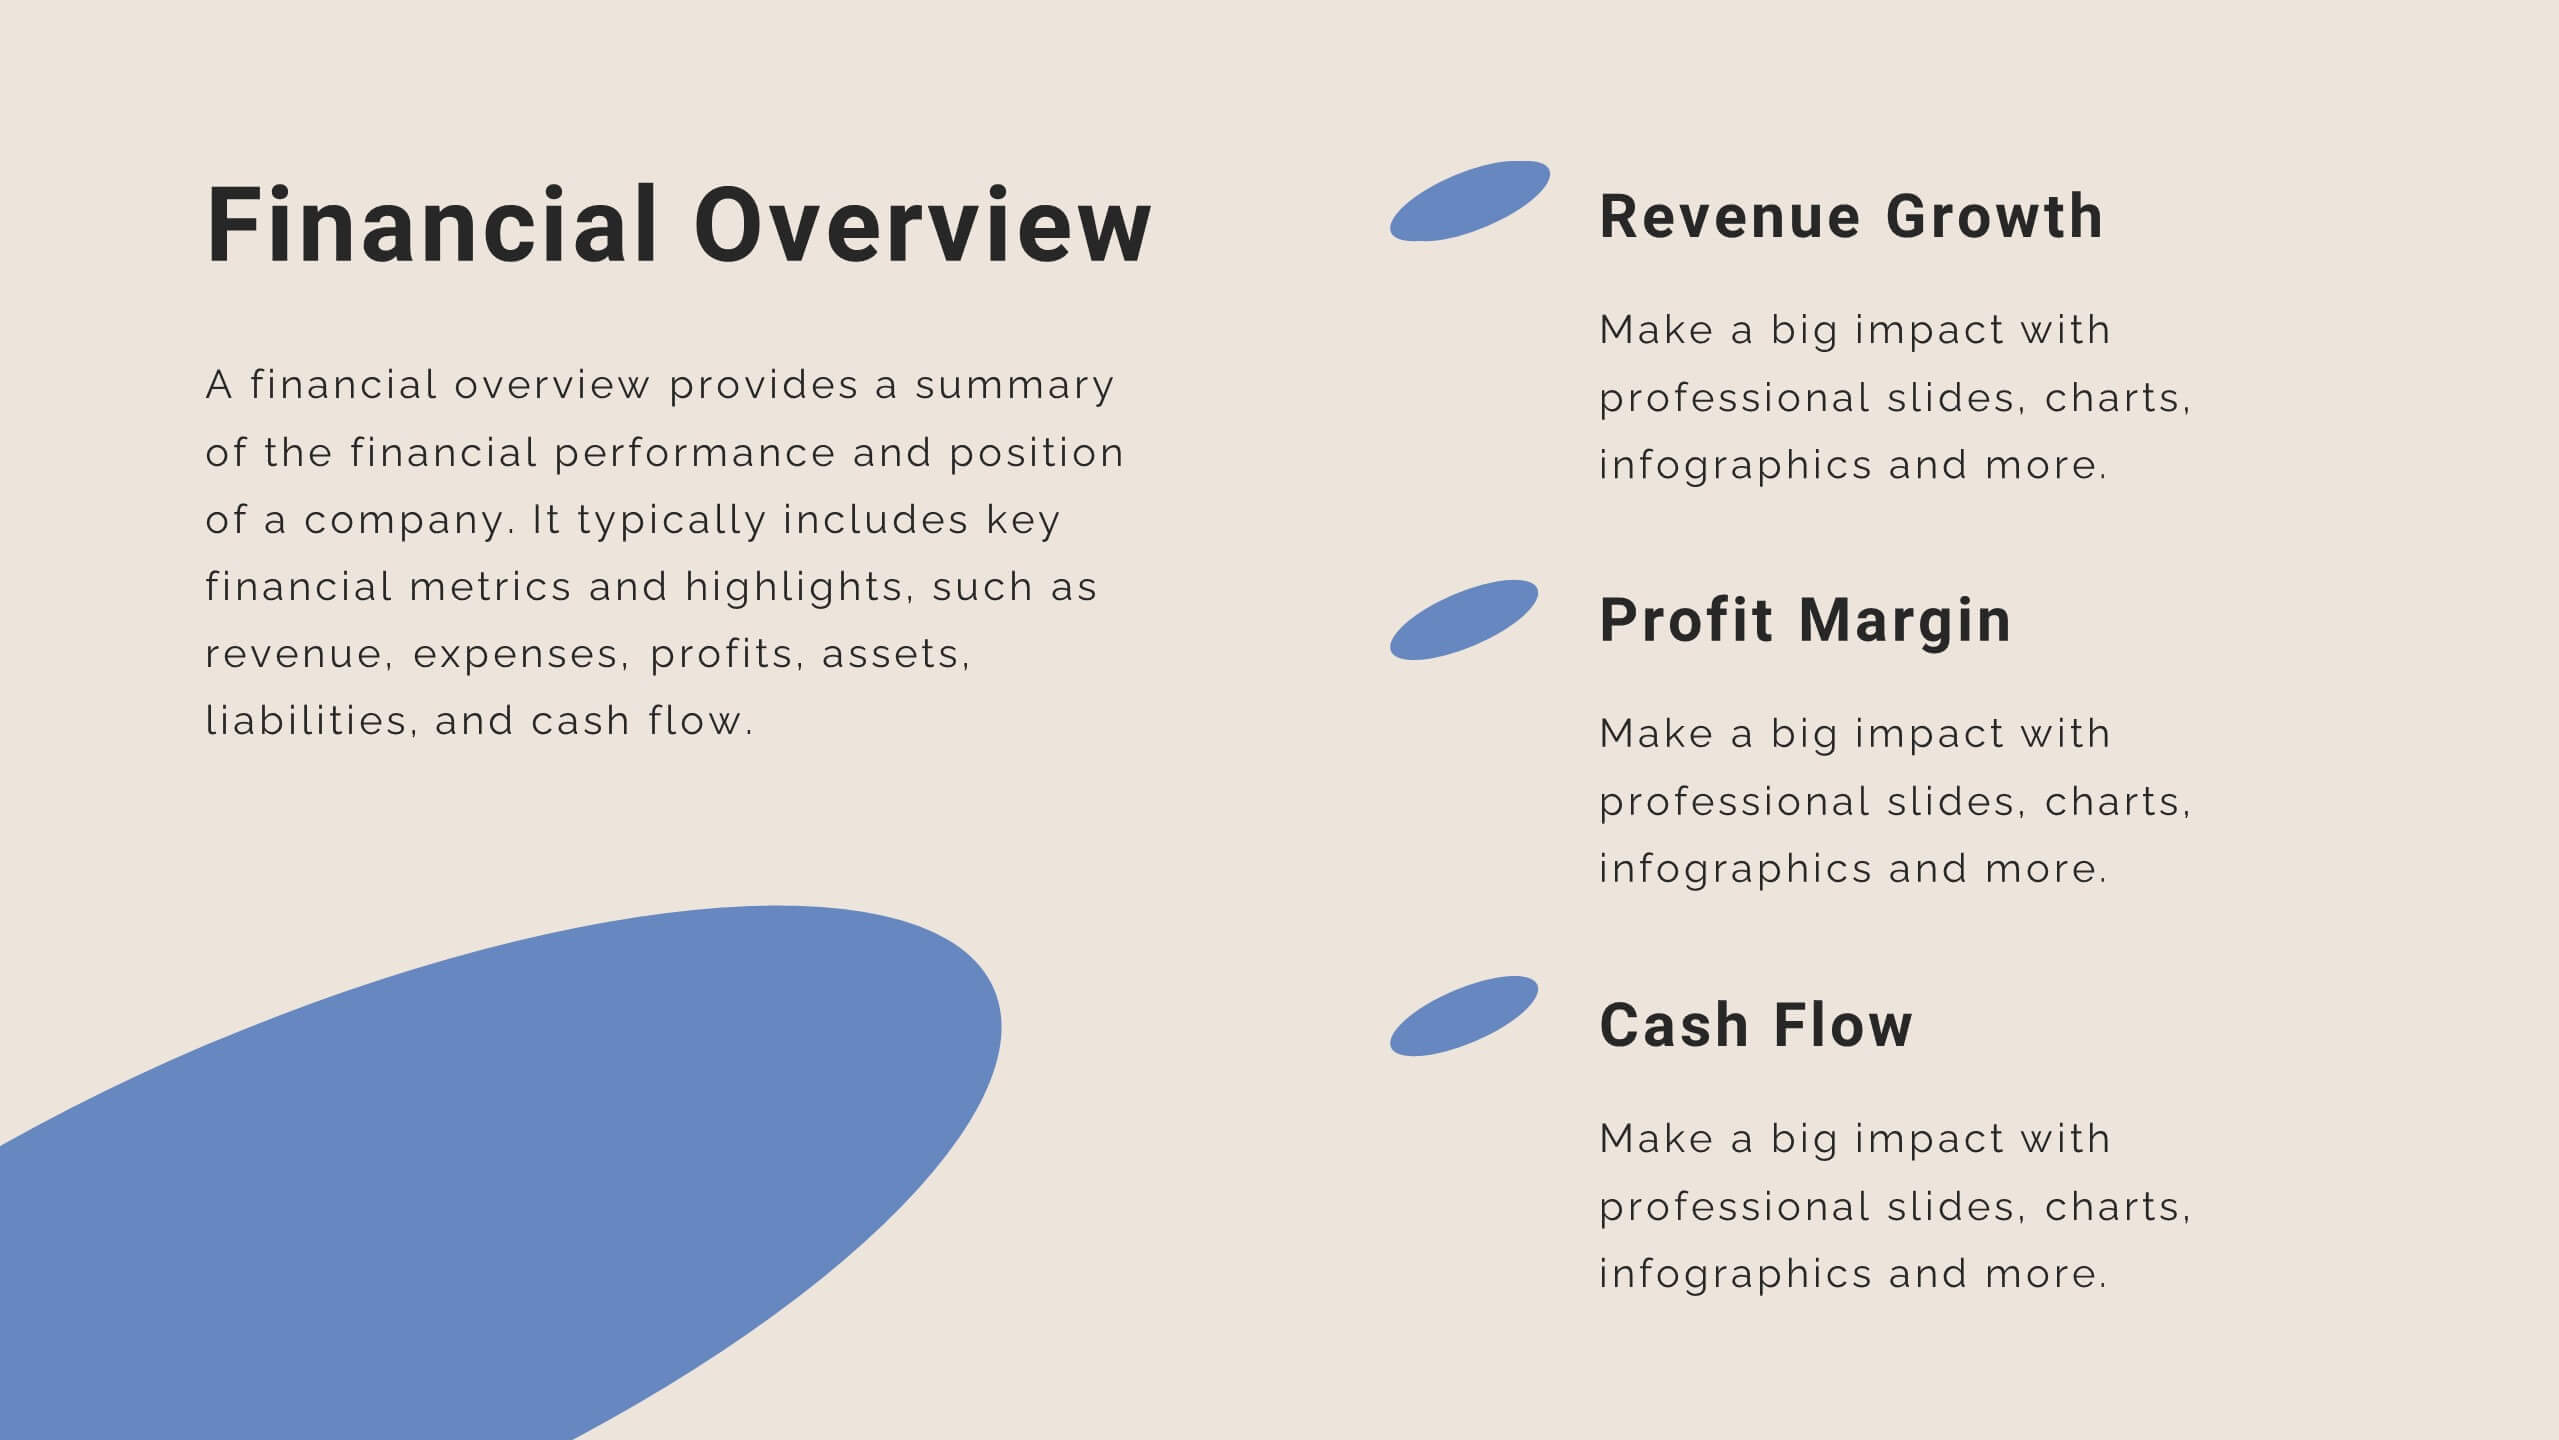
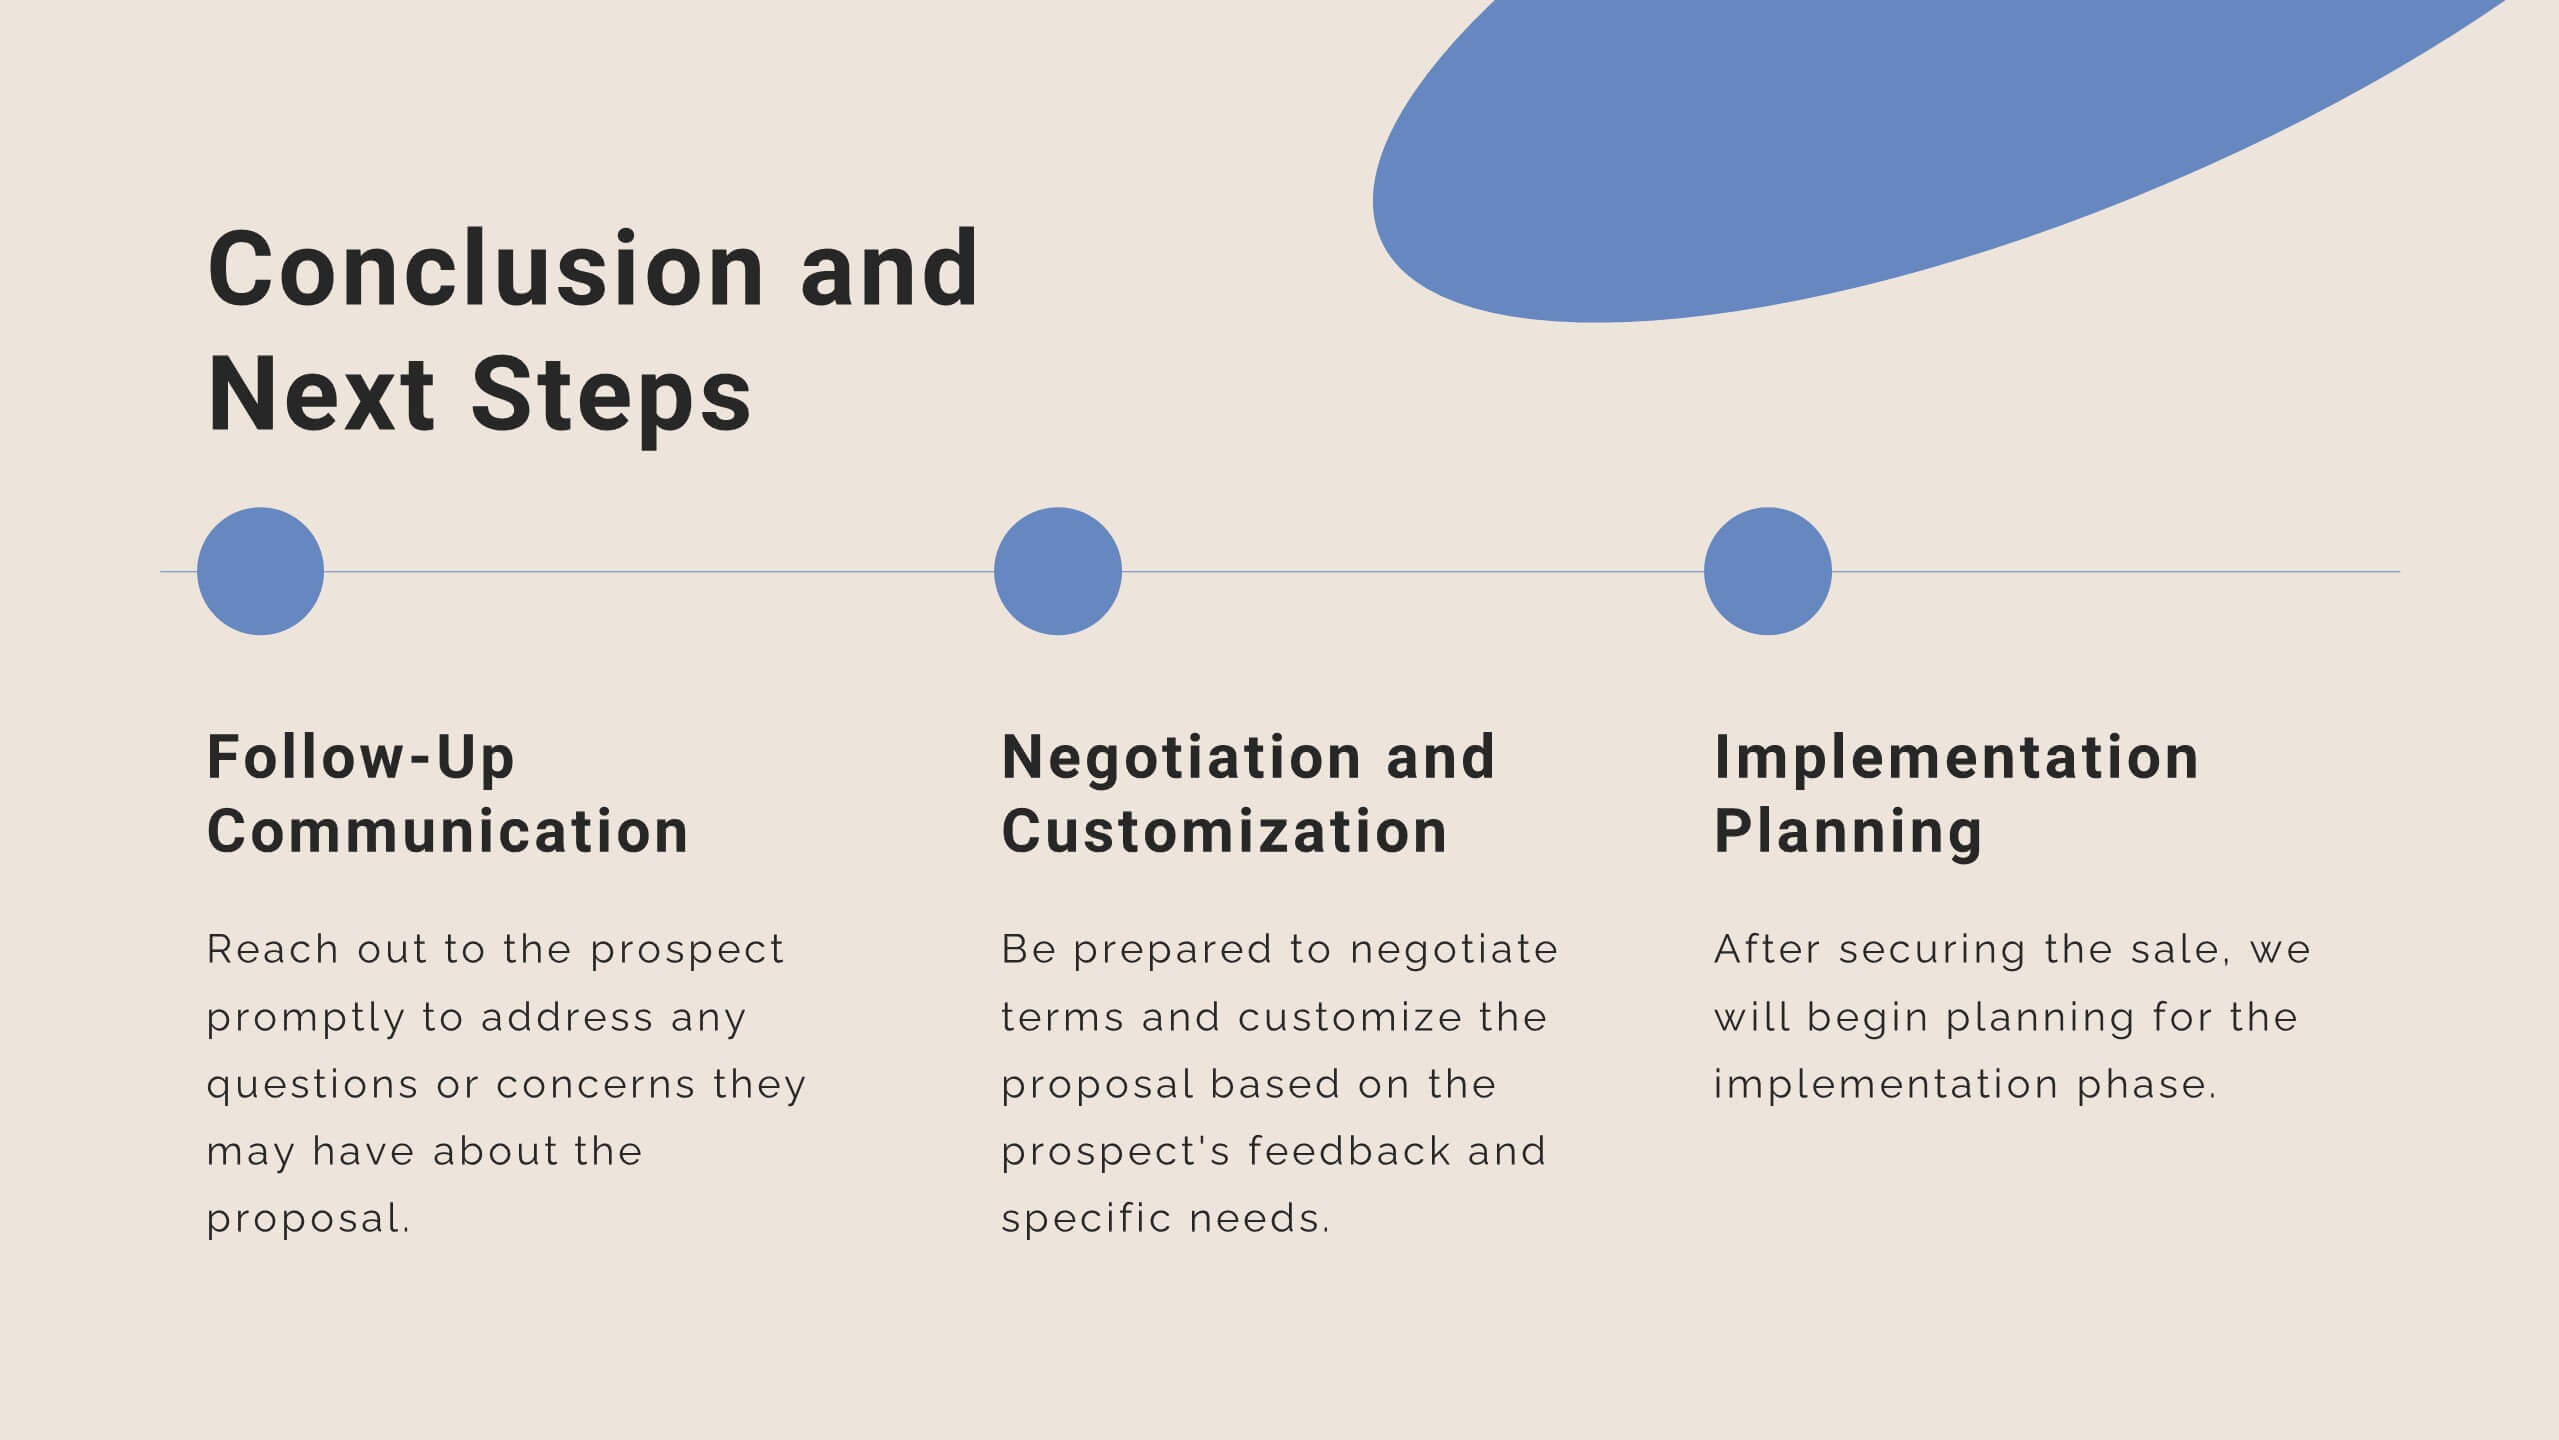
Project Milestones and Deliverables Presentation
Visualize your project’s journey with this step-by-step milestone timeline—ideal for tracking key phases, task ownership, or delivery checkpoints. The diagonal path connects colorful icons and editable text blocks, helping teams align on objectives and timelines. Compatible with PowerPoint, Keynote, and Google Slides.


7 diapositivas
Home Office Scenes Infographic
Dive into the intricacies of the home office environment with our office scenes infographic. Rendered in a sophisticated palette of white and dark blue, this infographic offers an insightful visual exploration of today's work-from-home culture. With detailed icons and illustrative graphics, the design brings to life various scenarios and components of a home office. The layout is geared towards offering practical insights to its viewers. This template is perfect for remote work advocates, and any company transitioning to a hybrid work model. Compatible with PowerPoint, Keynote, and Google Slides this ensures seamless integration into your presentations.


26 diapositivas
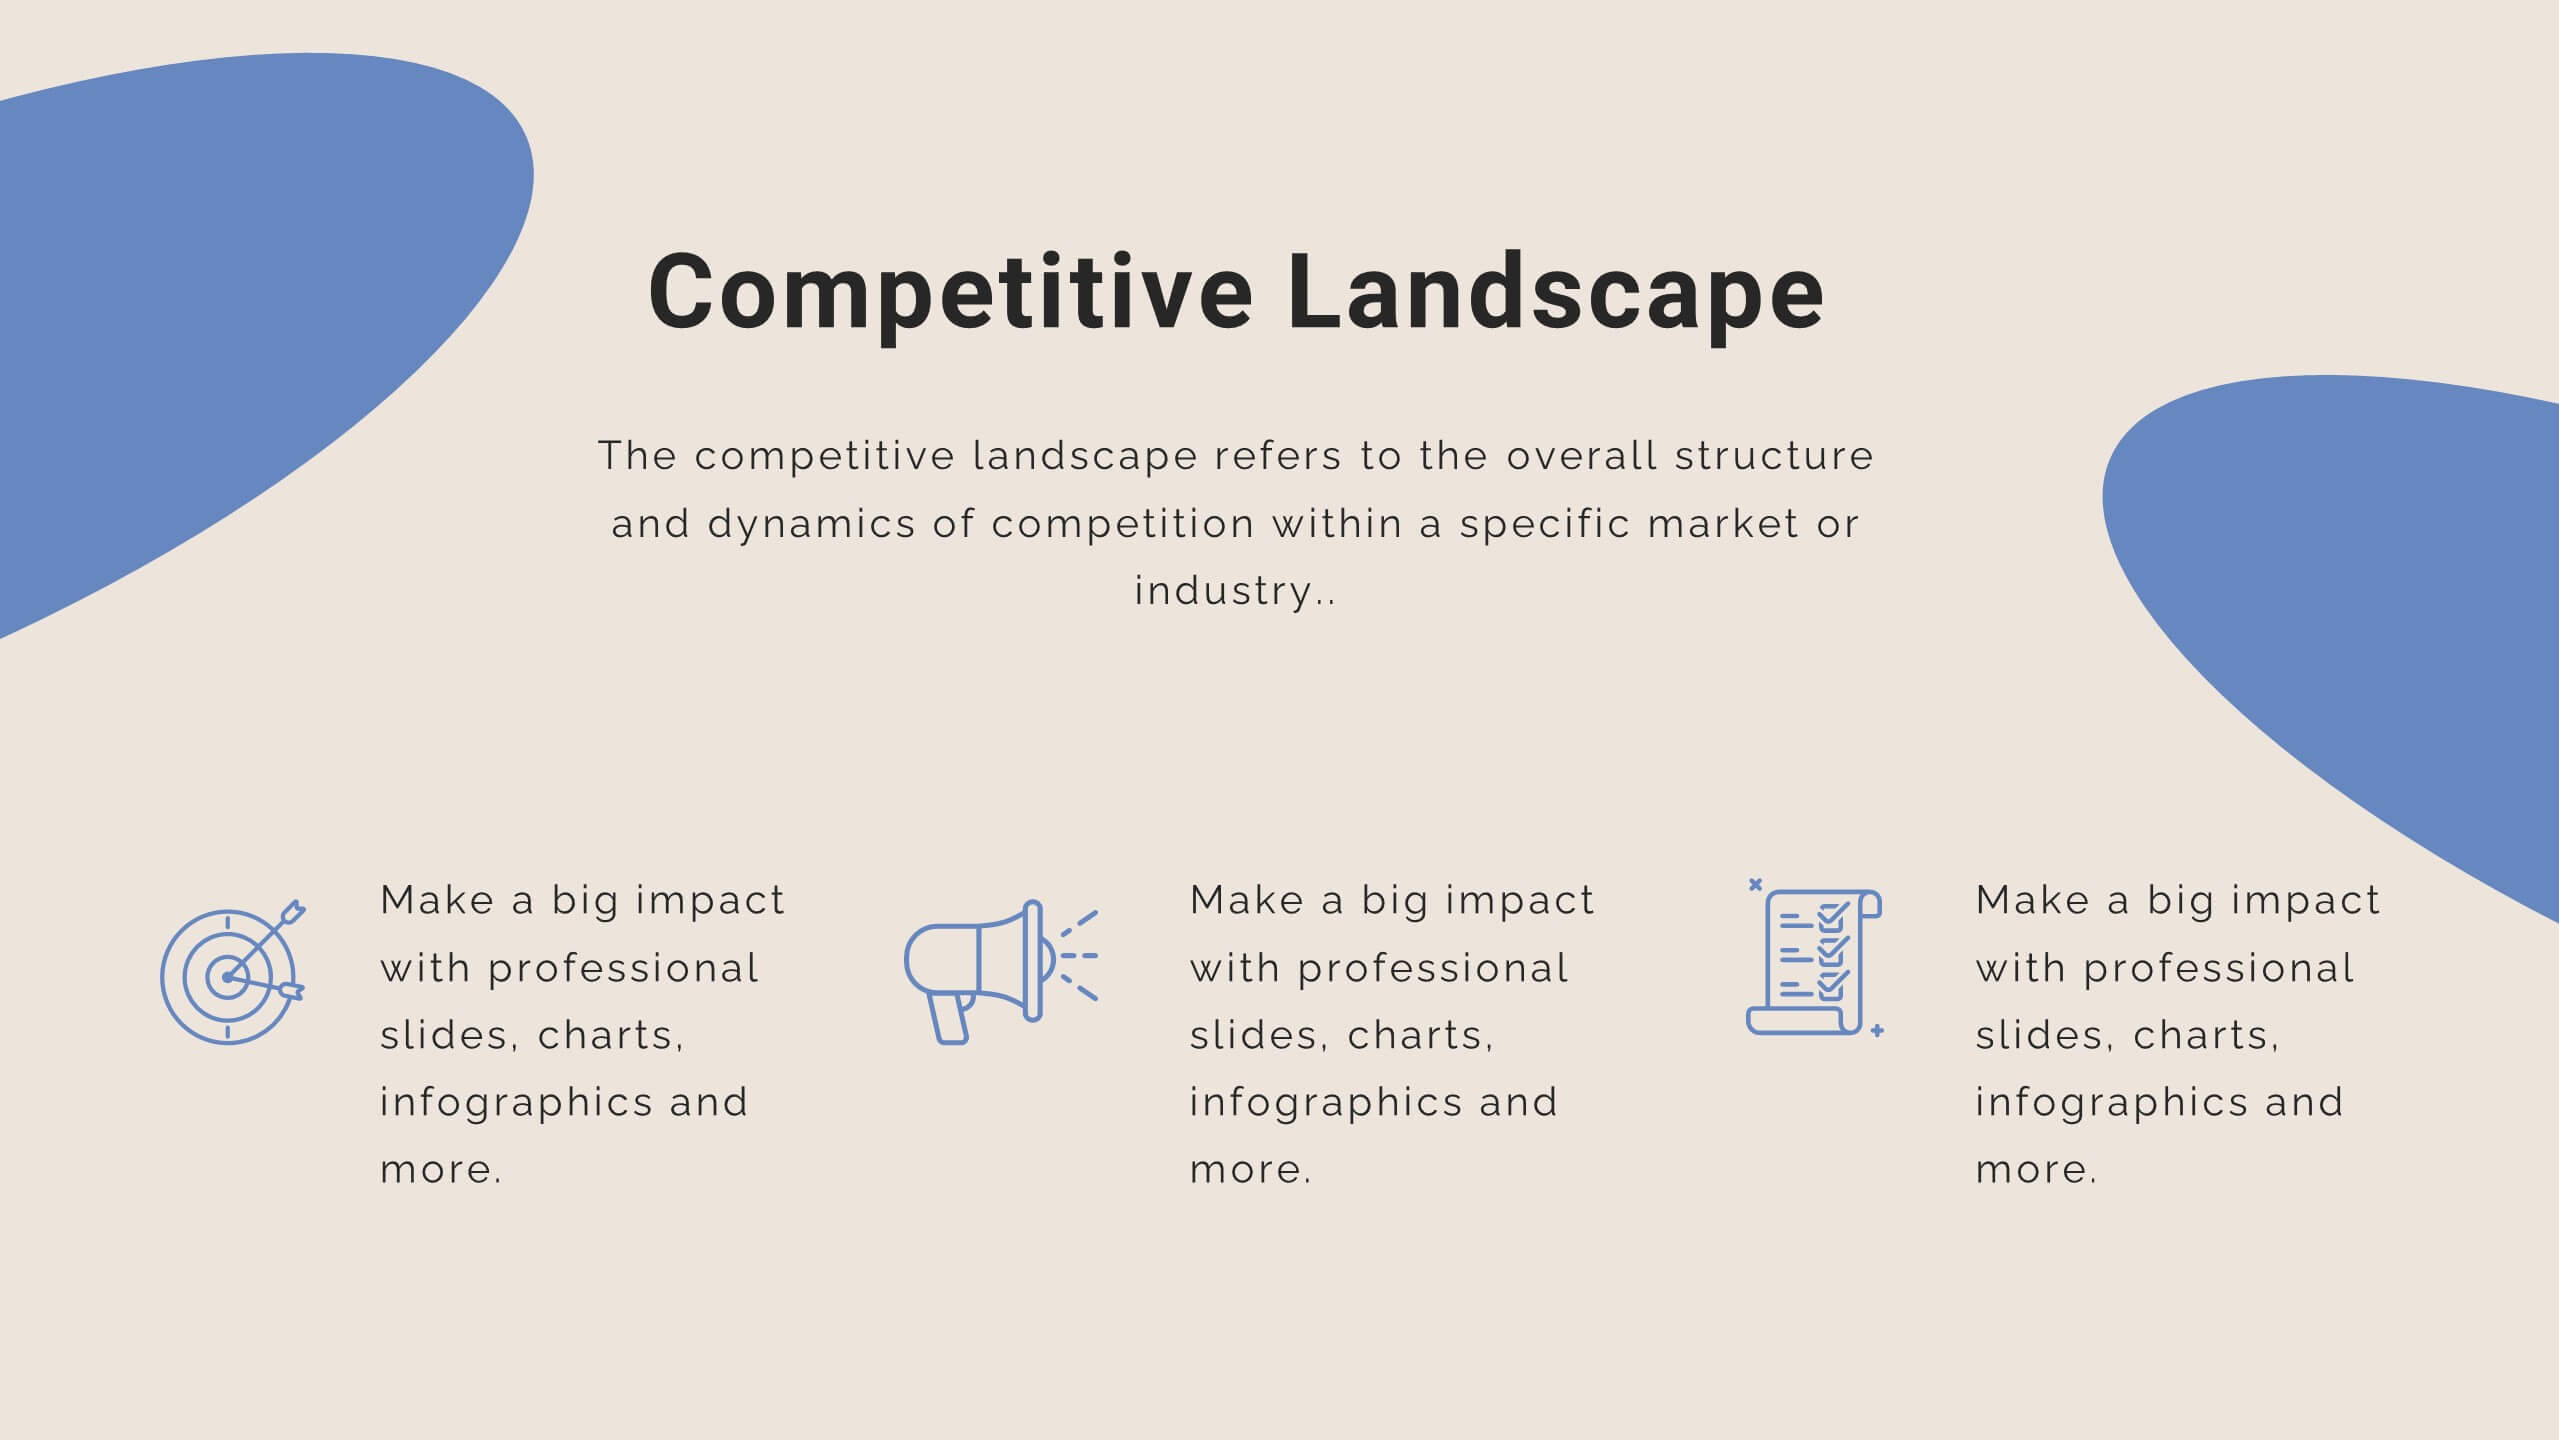
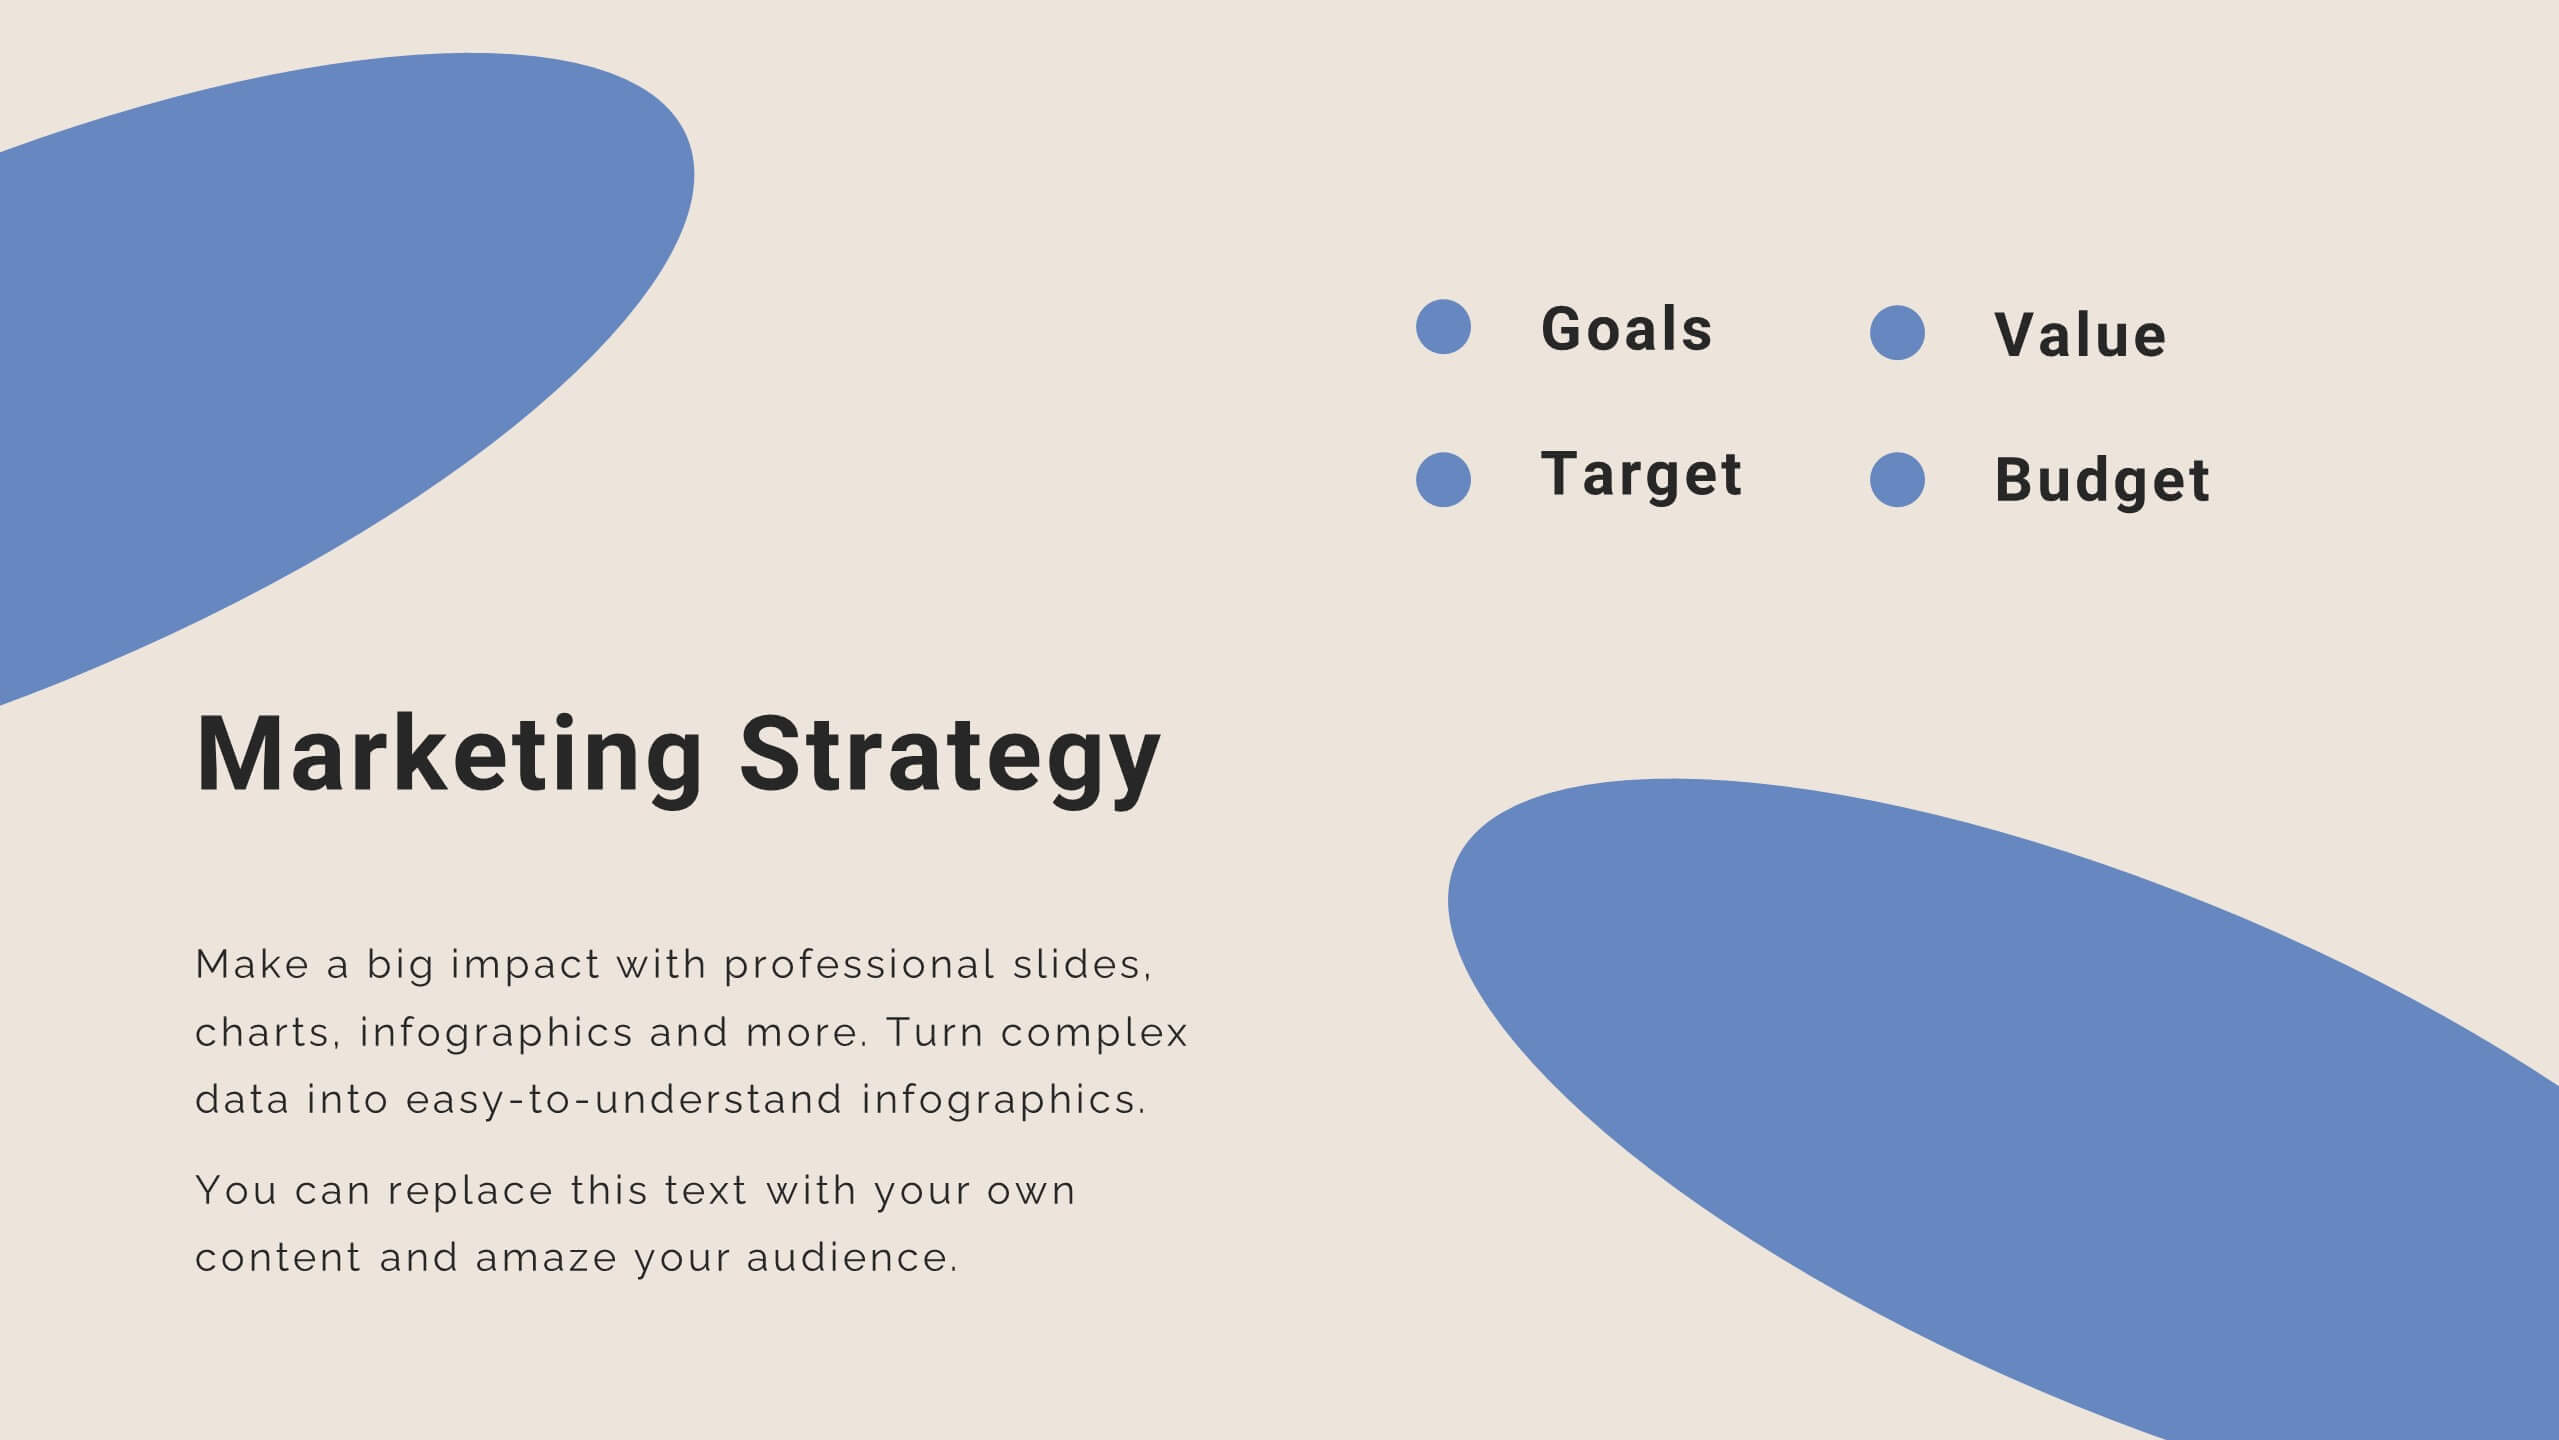
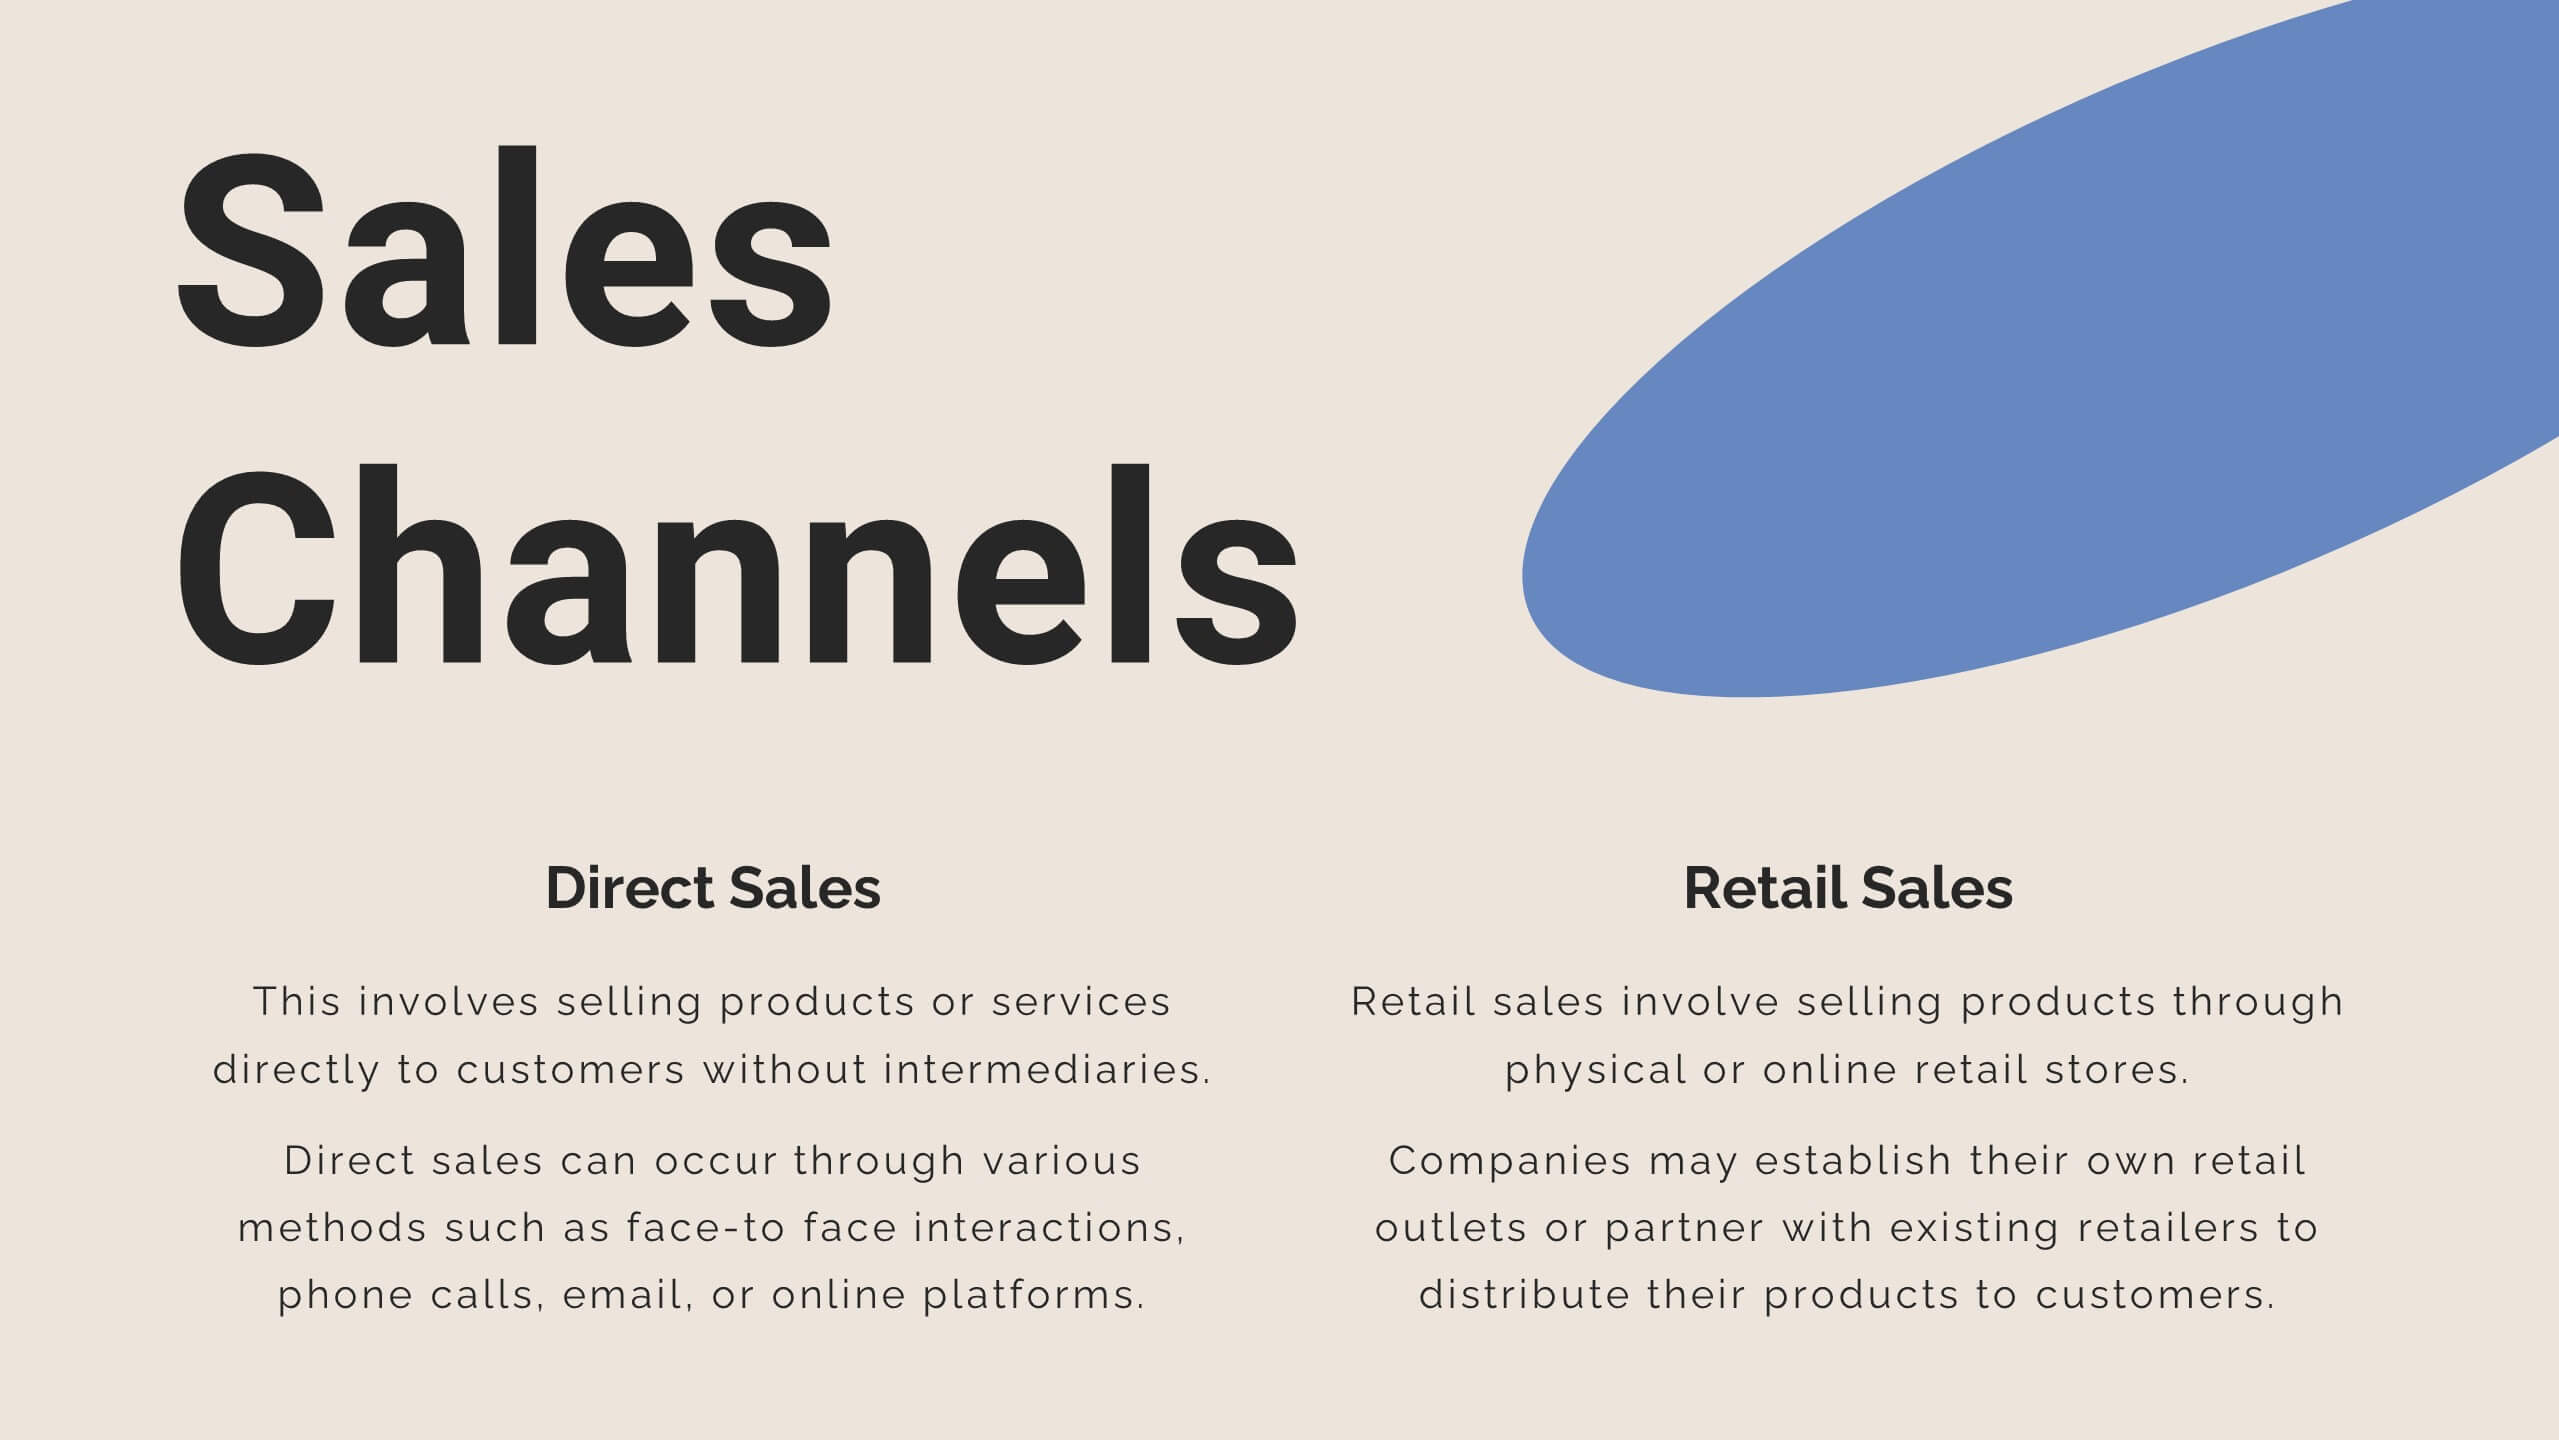
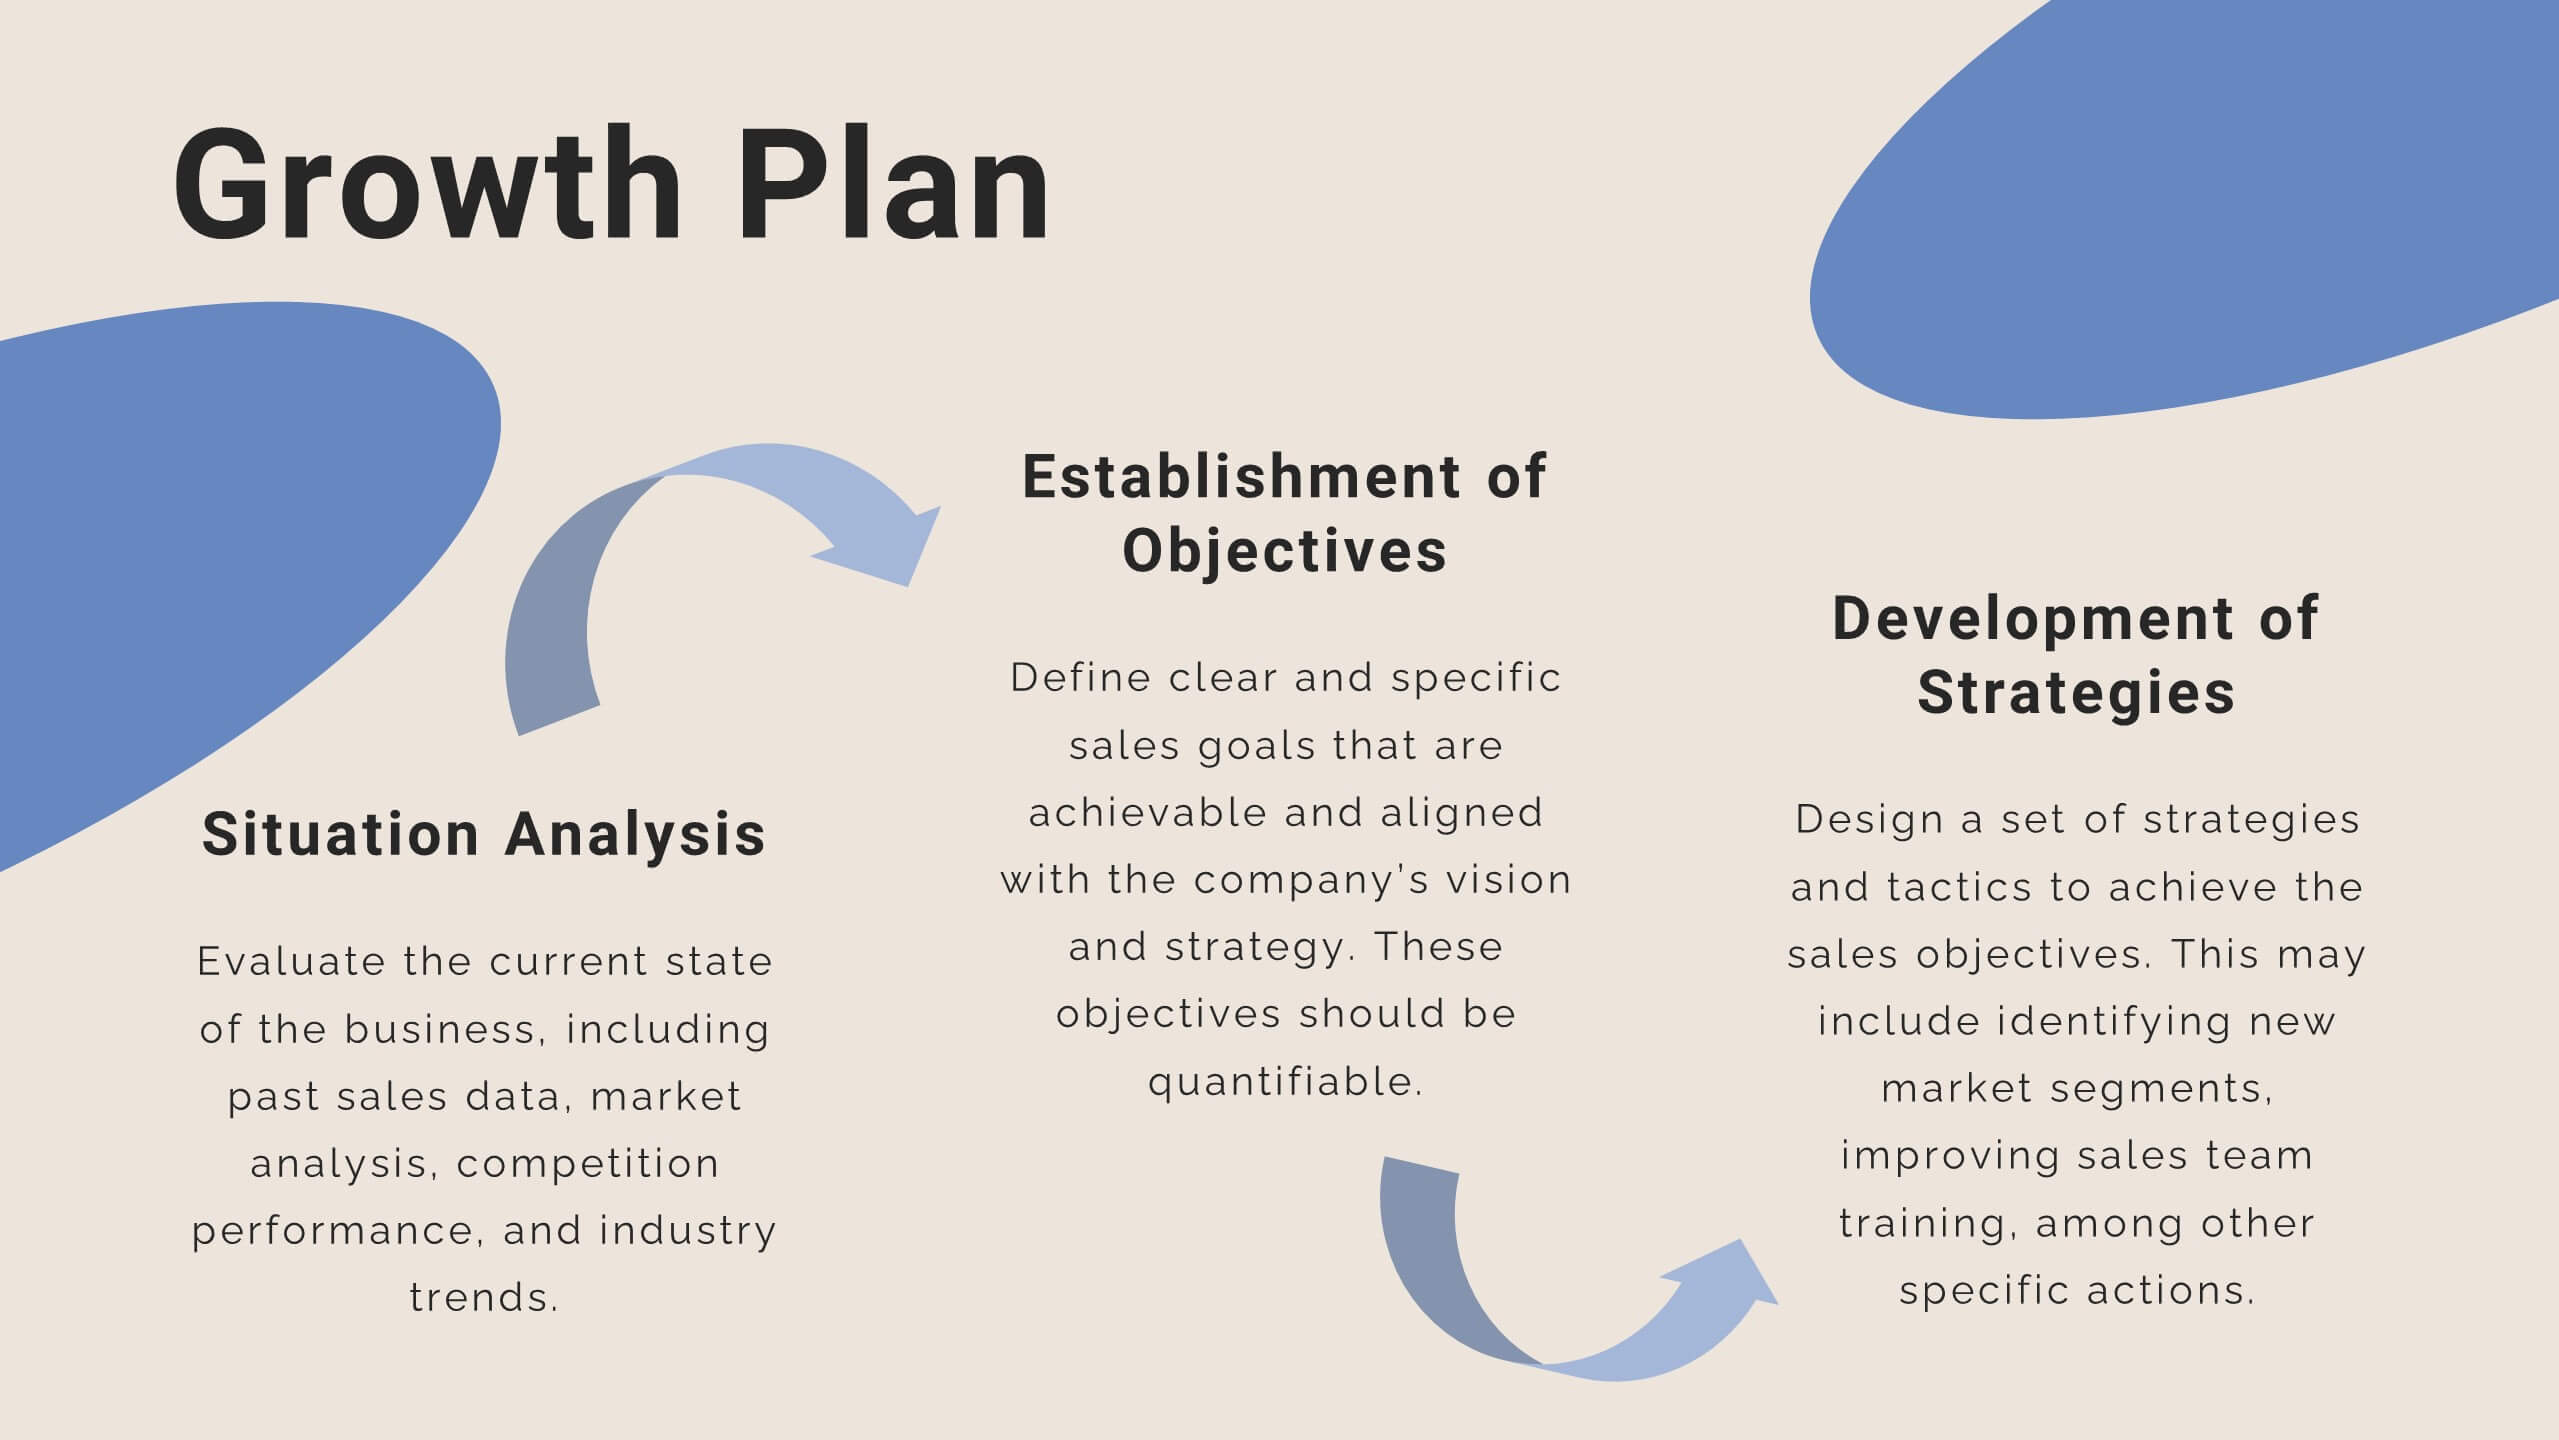
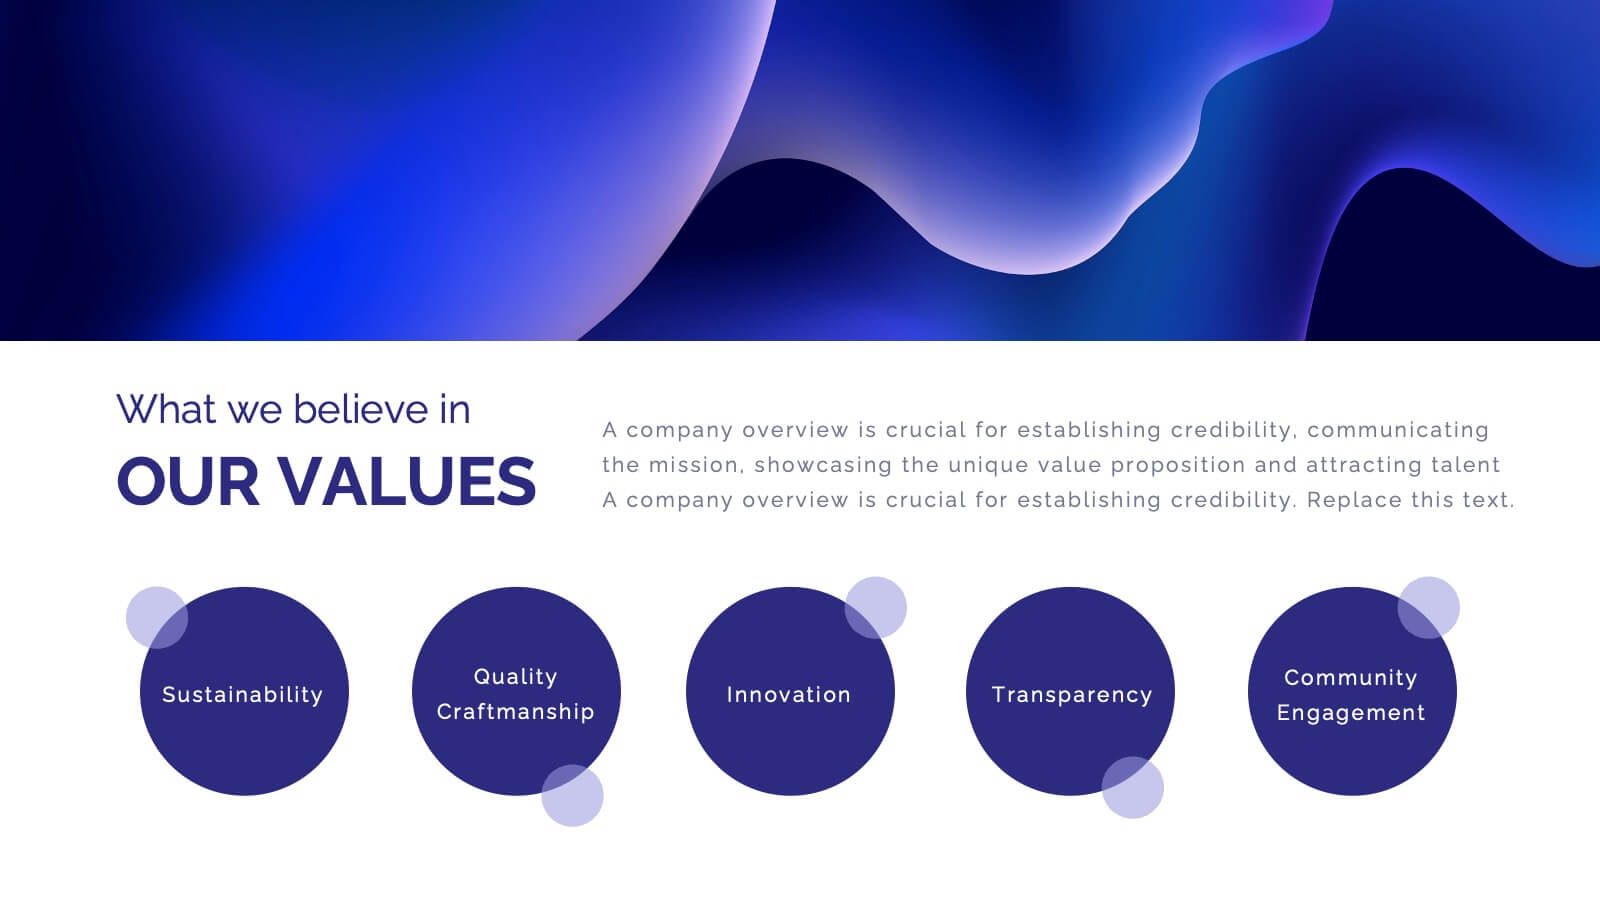
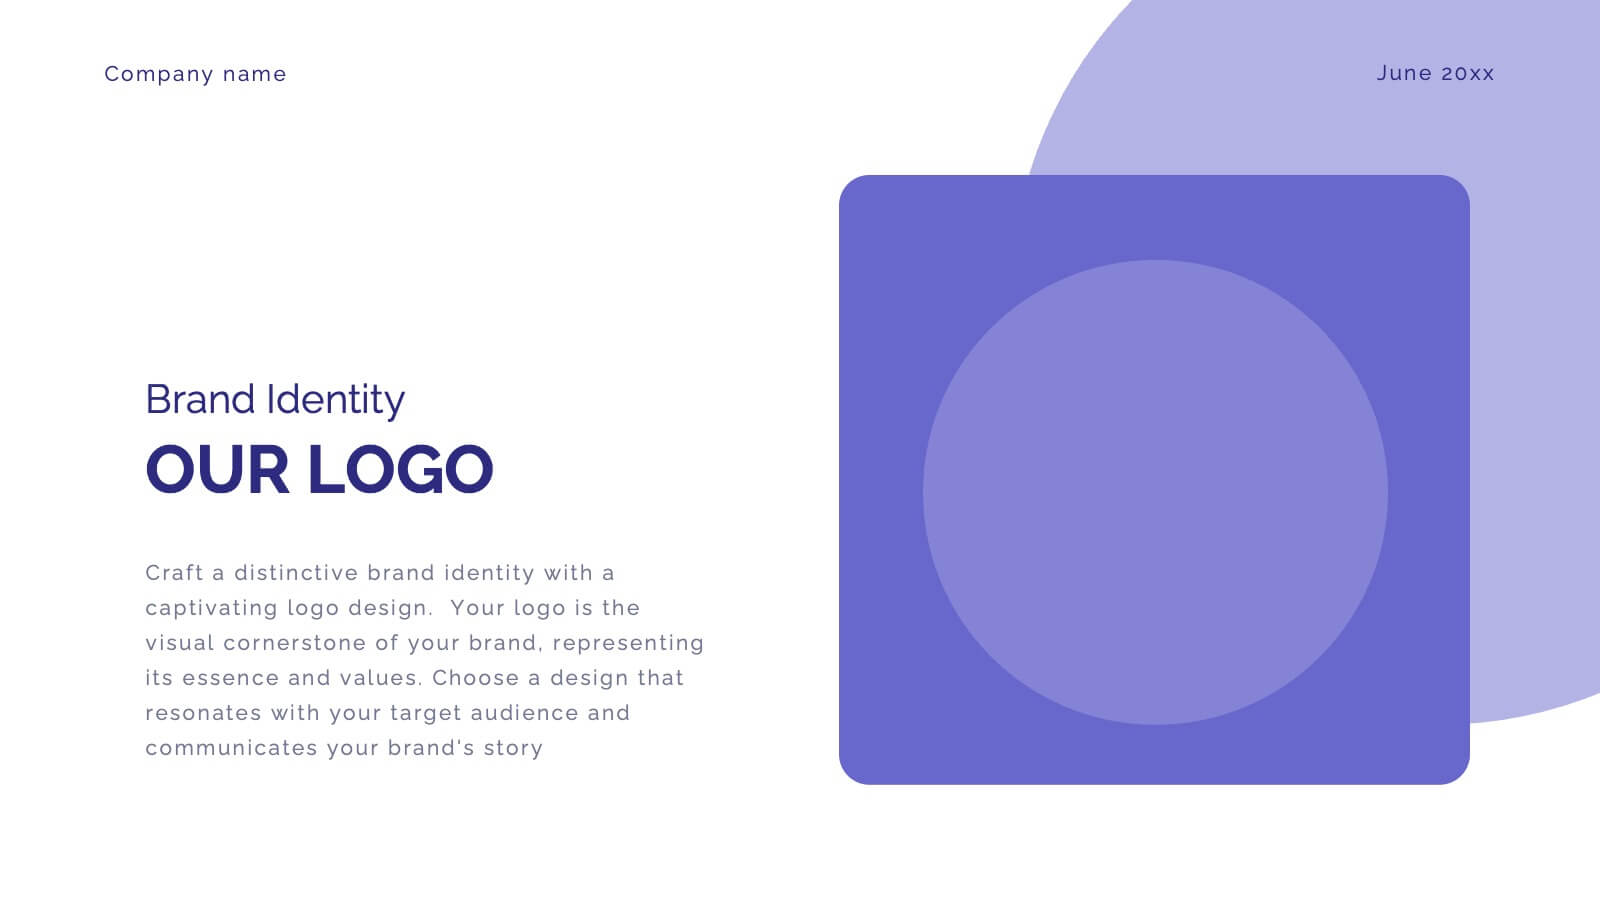
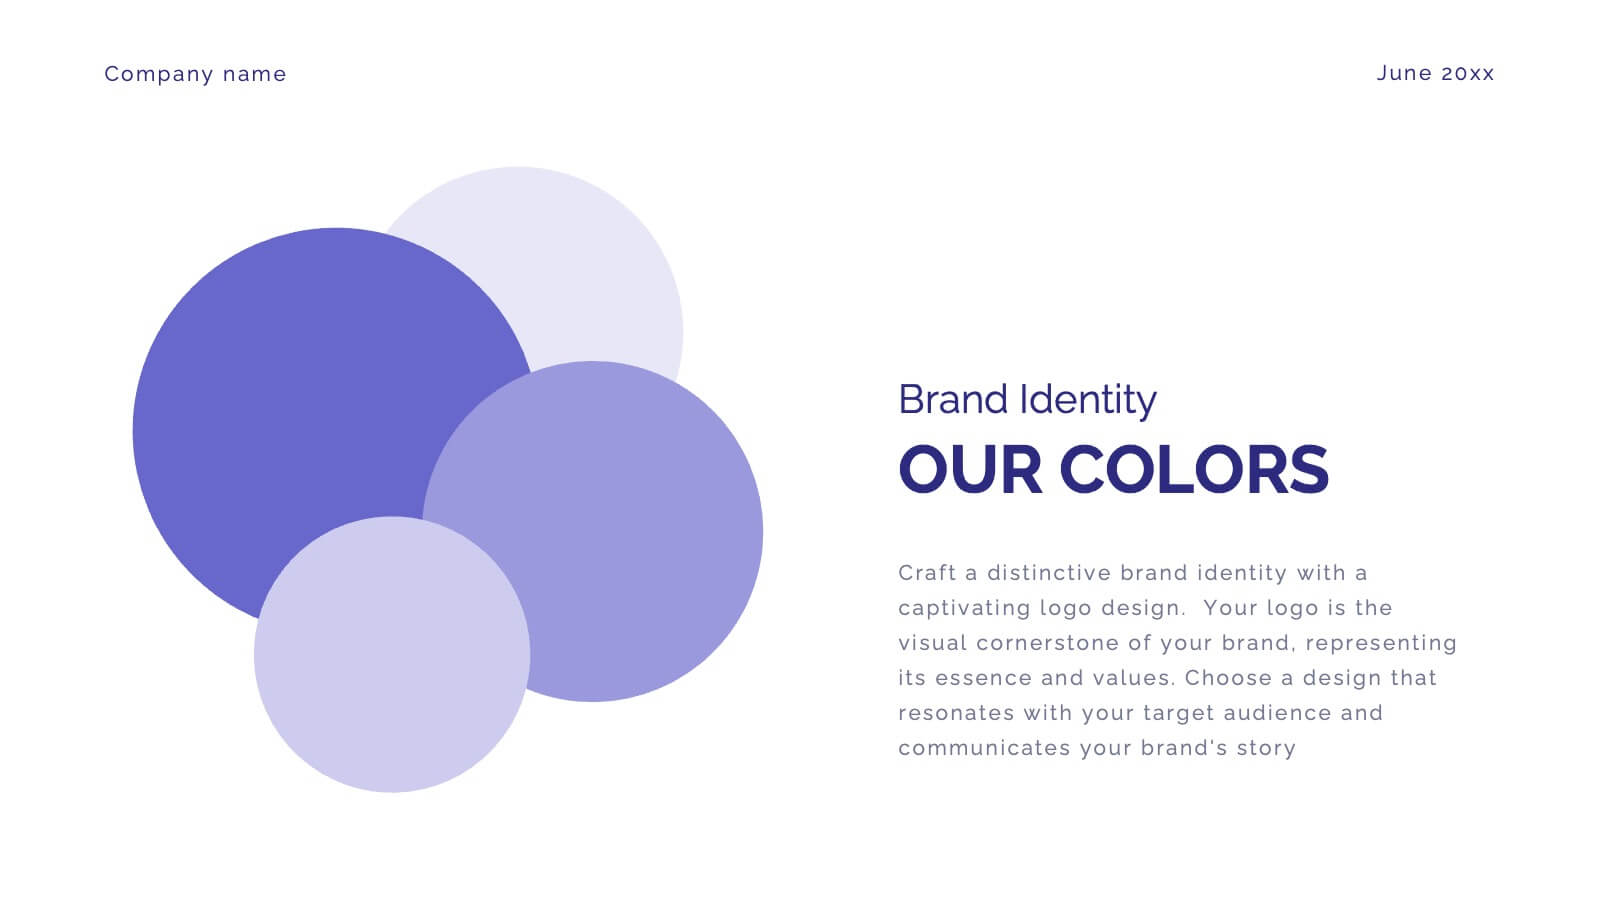
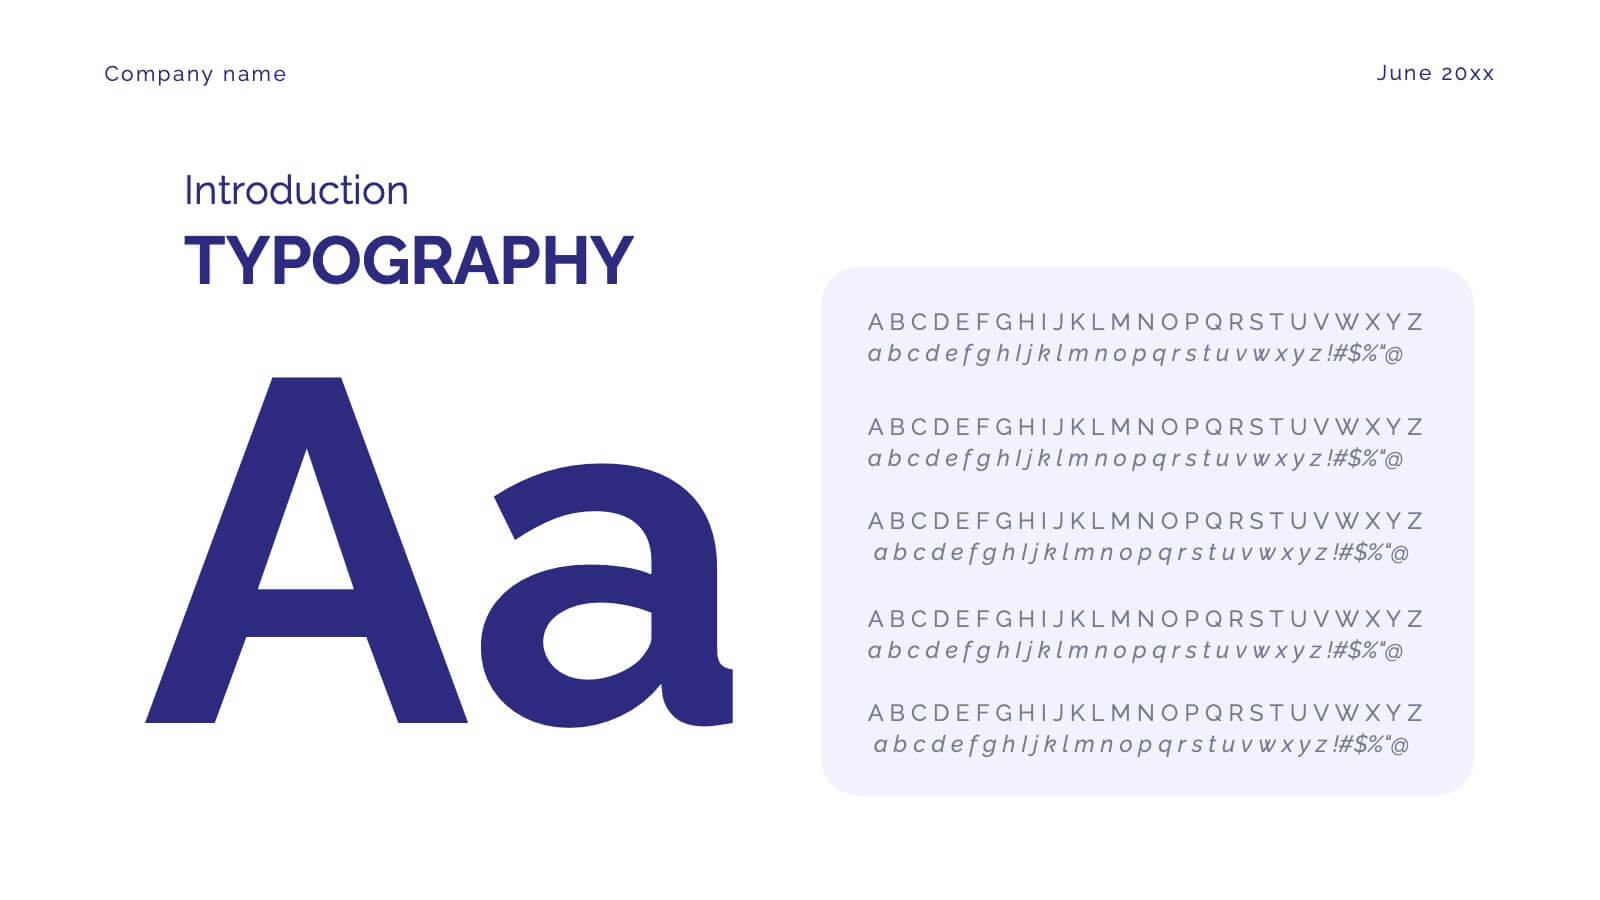
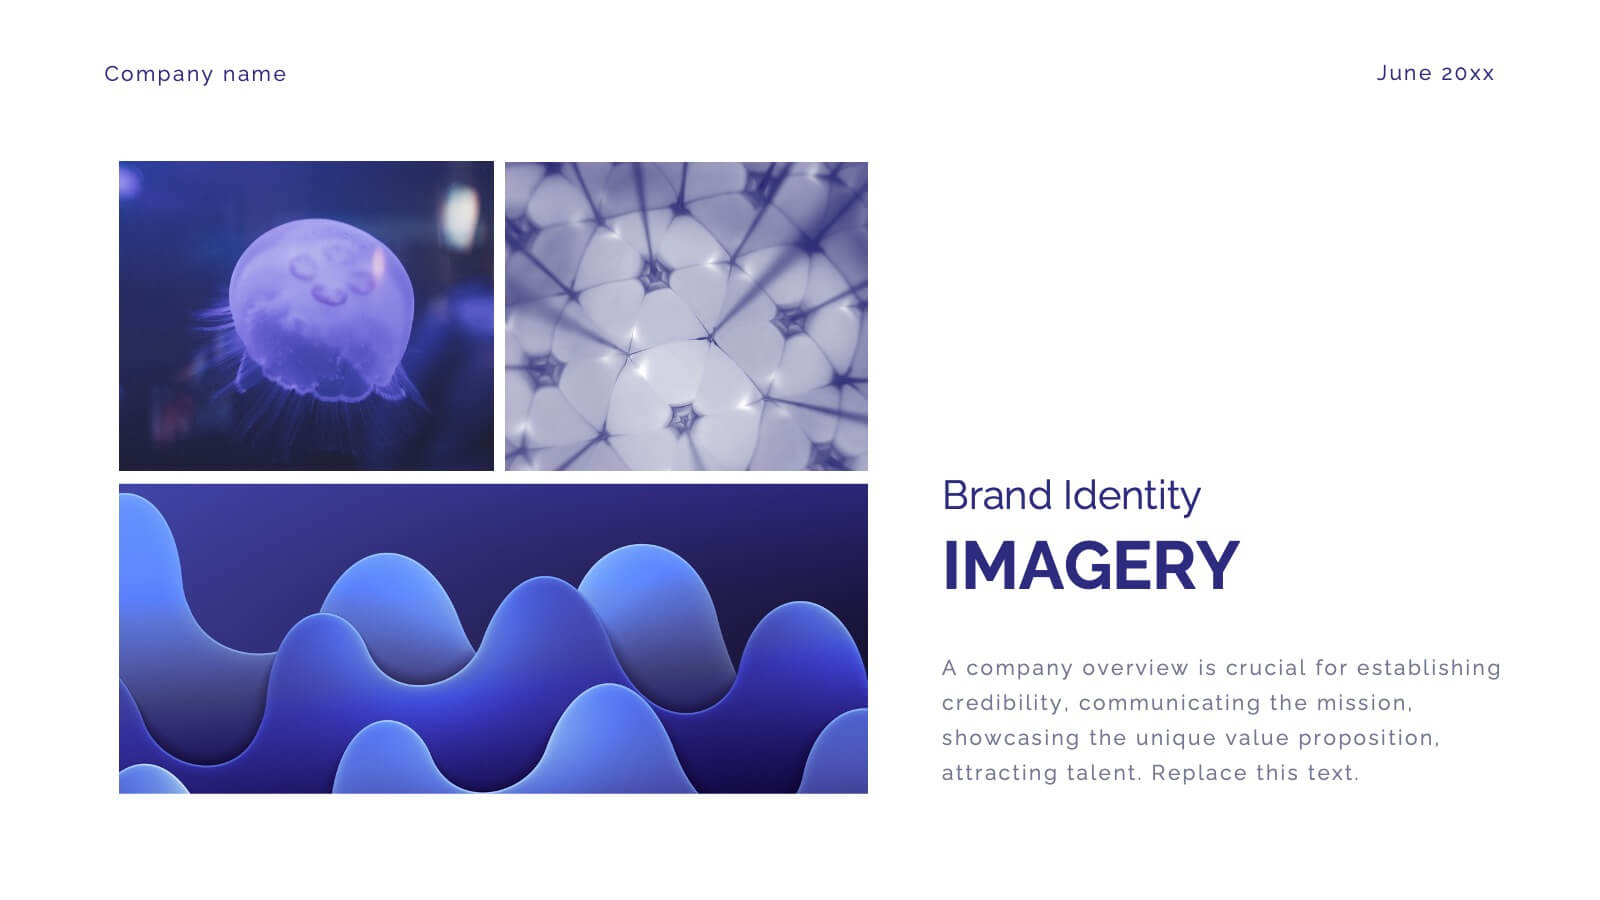
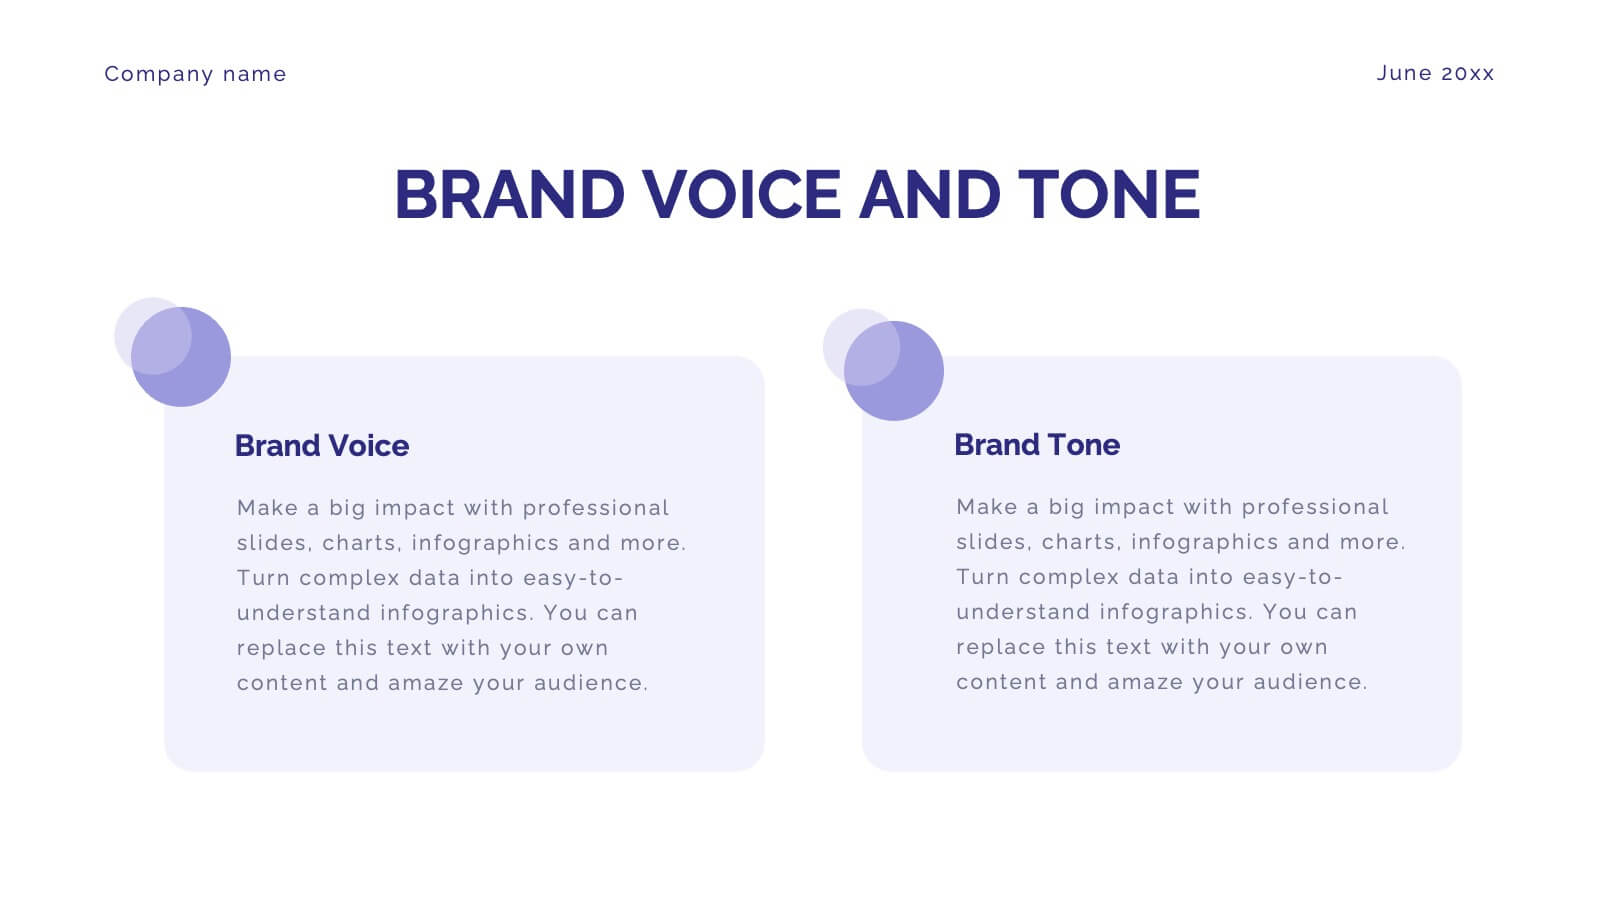
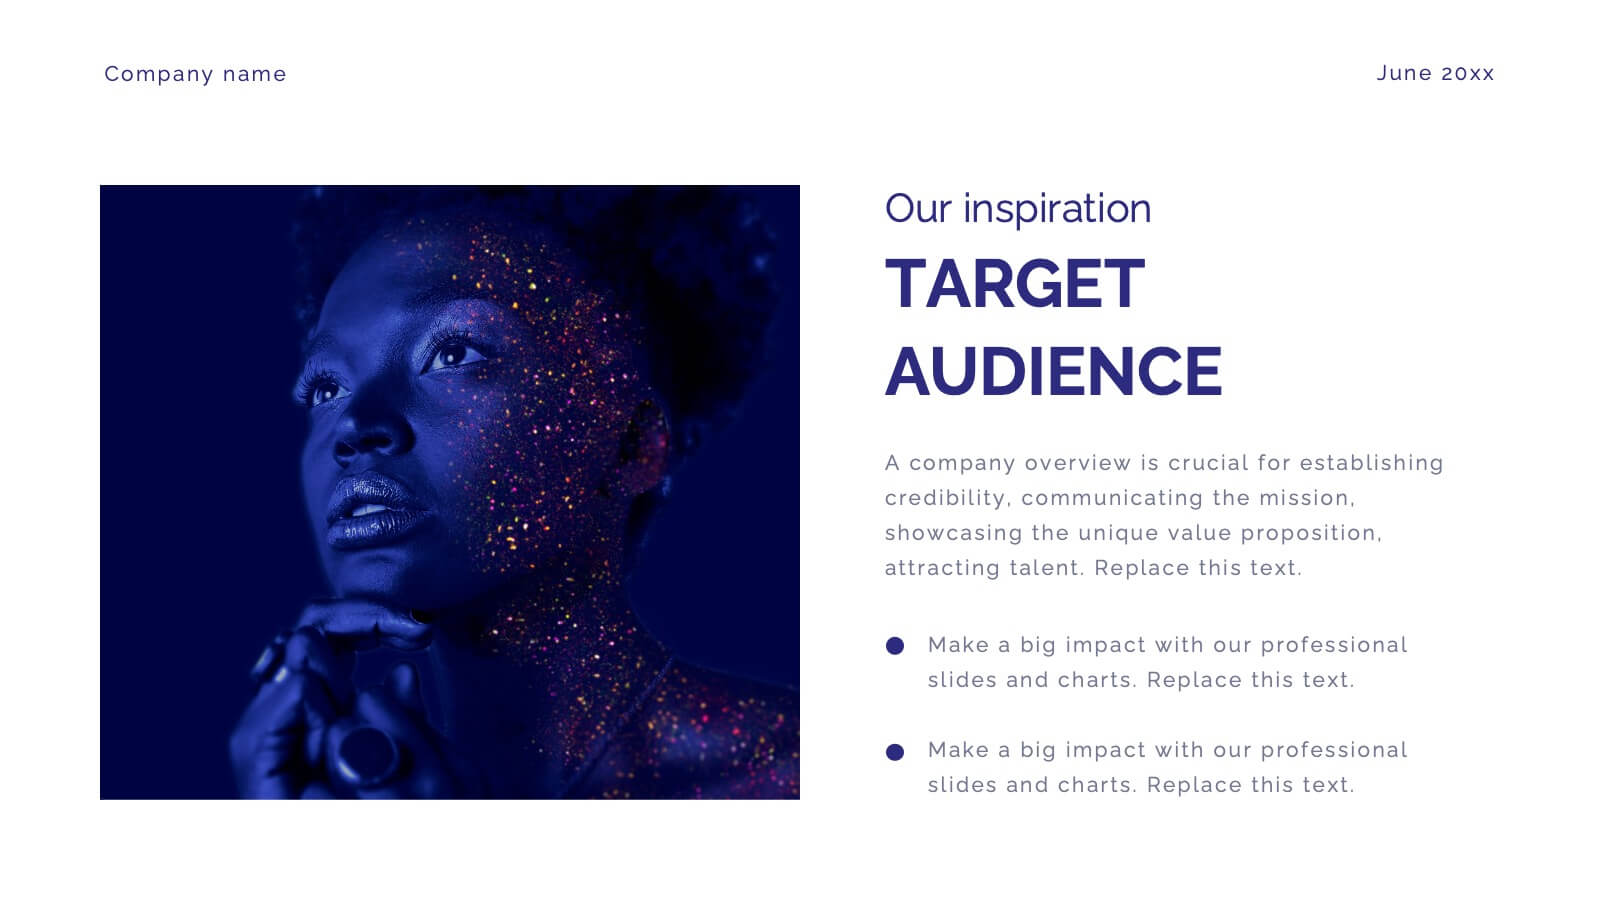
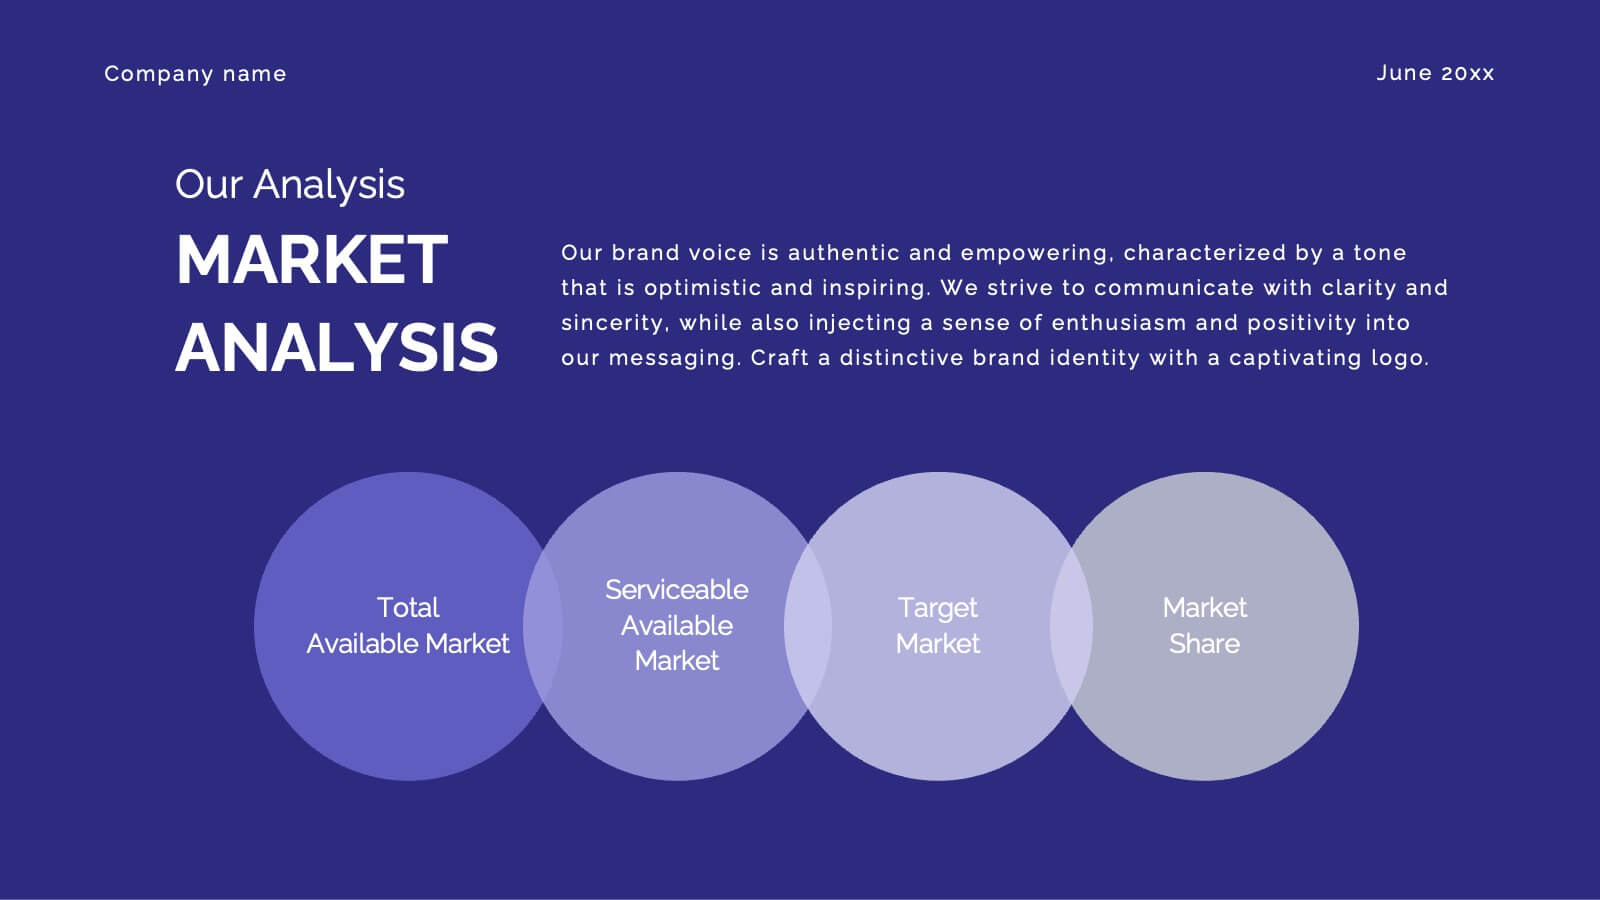
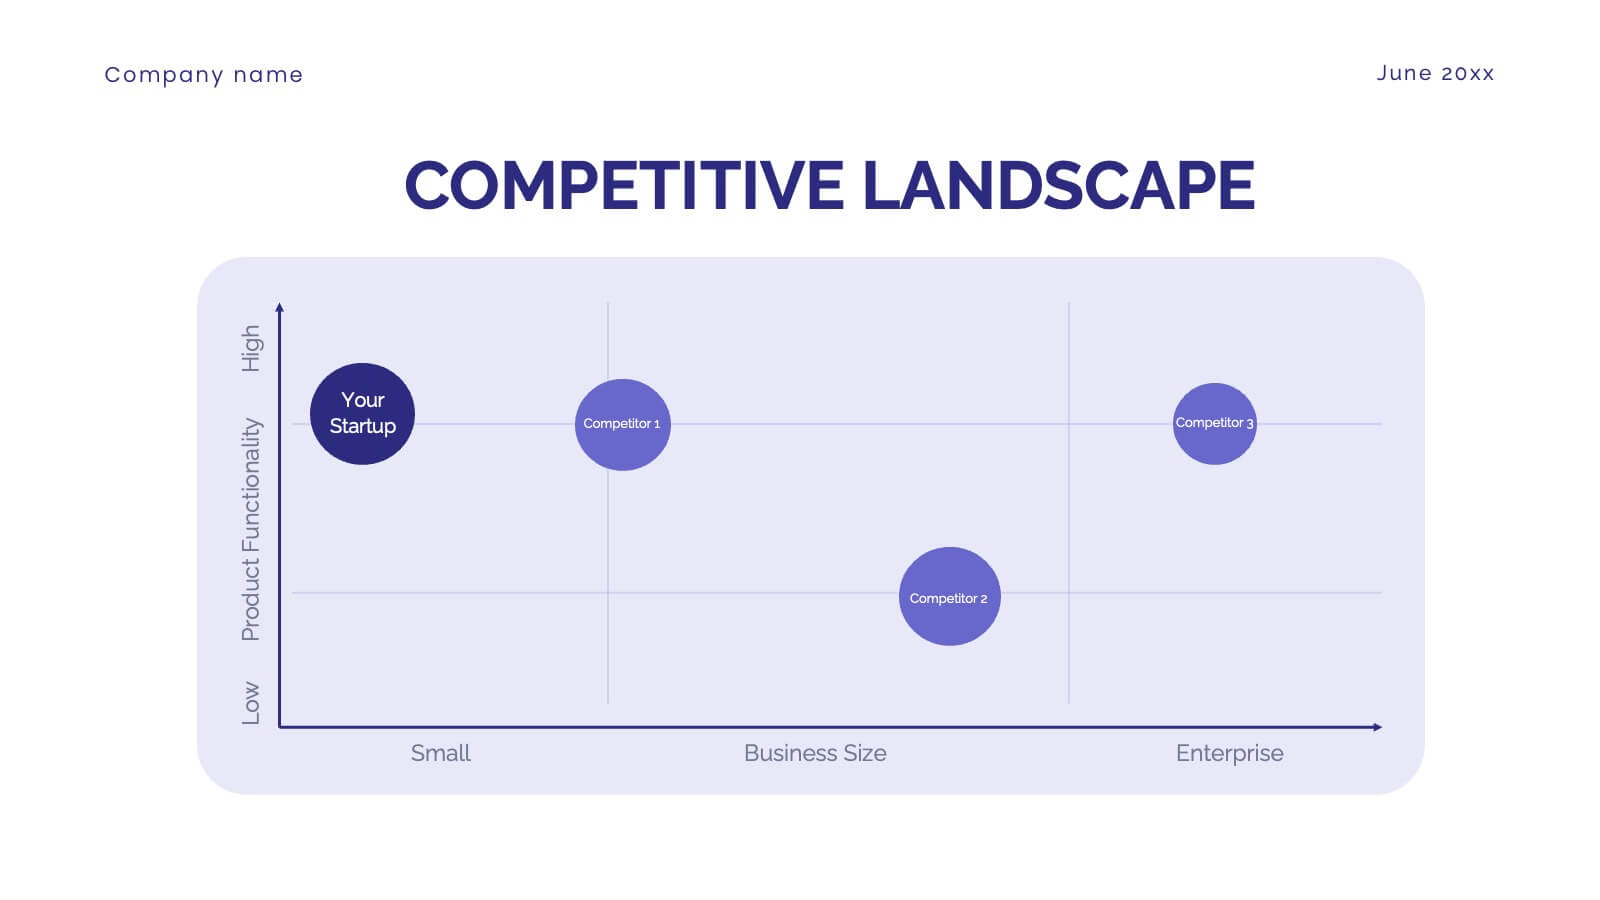
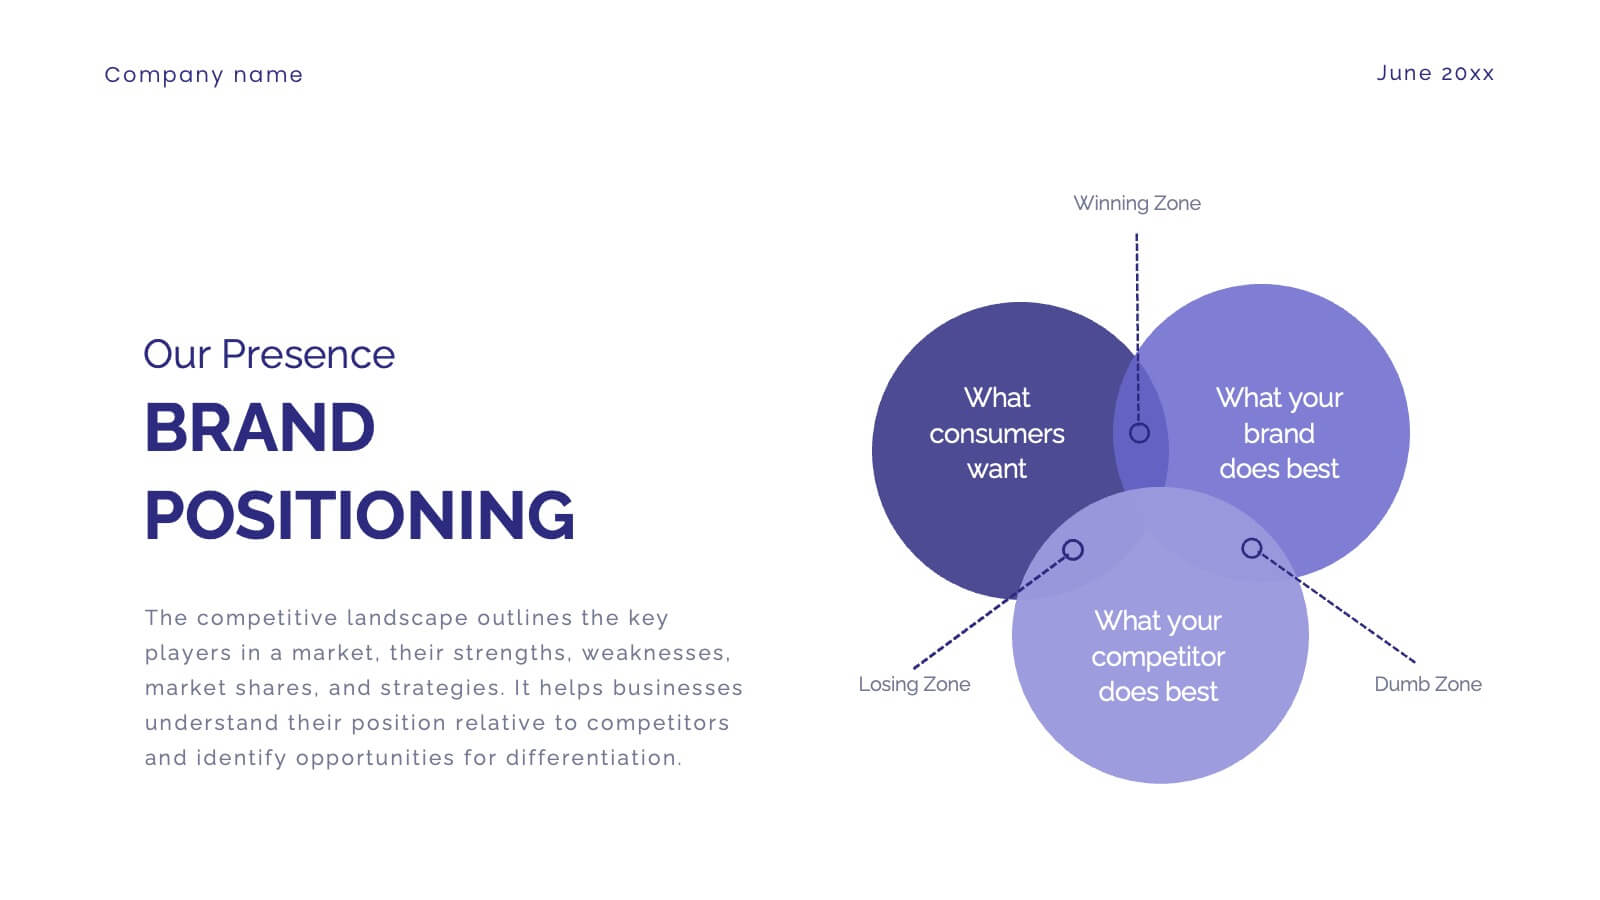
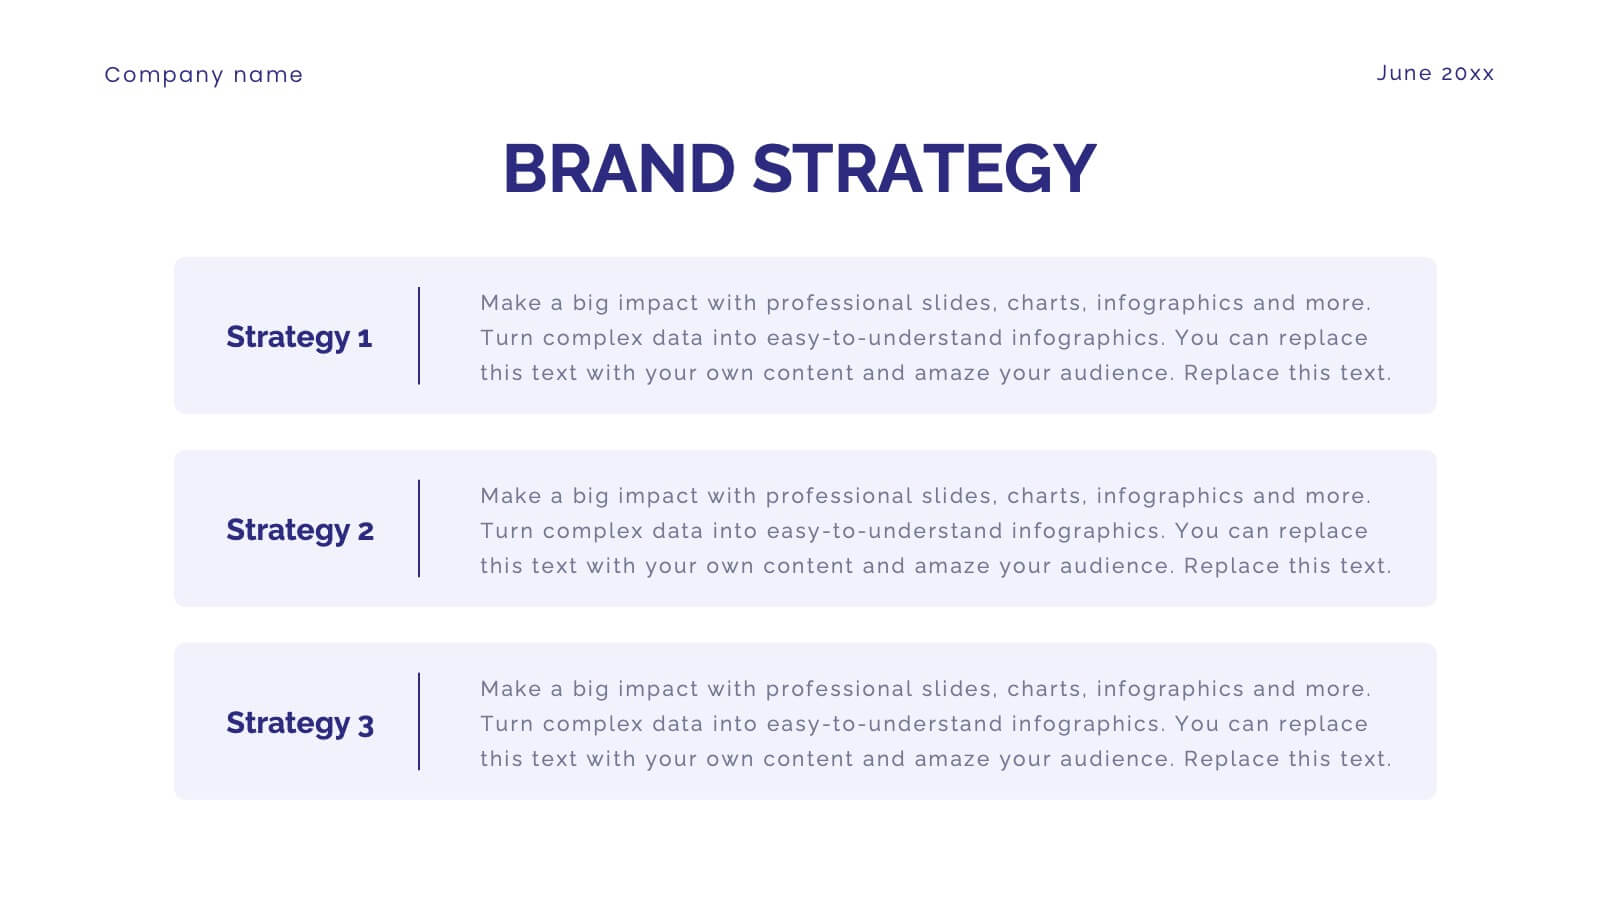
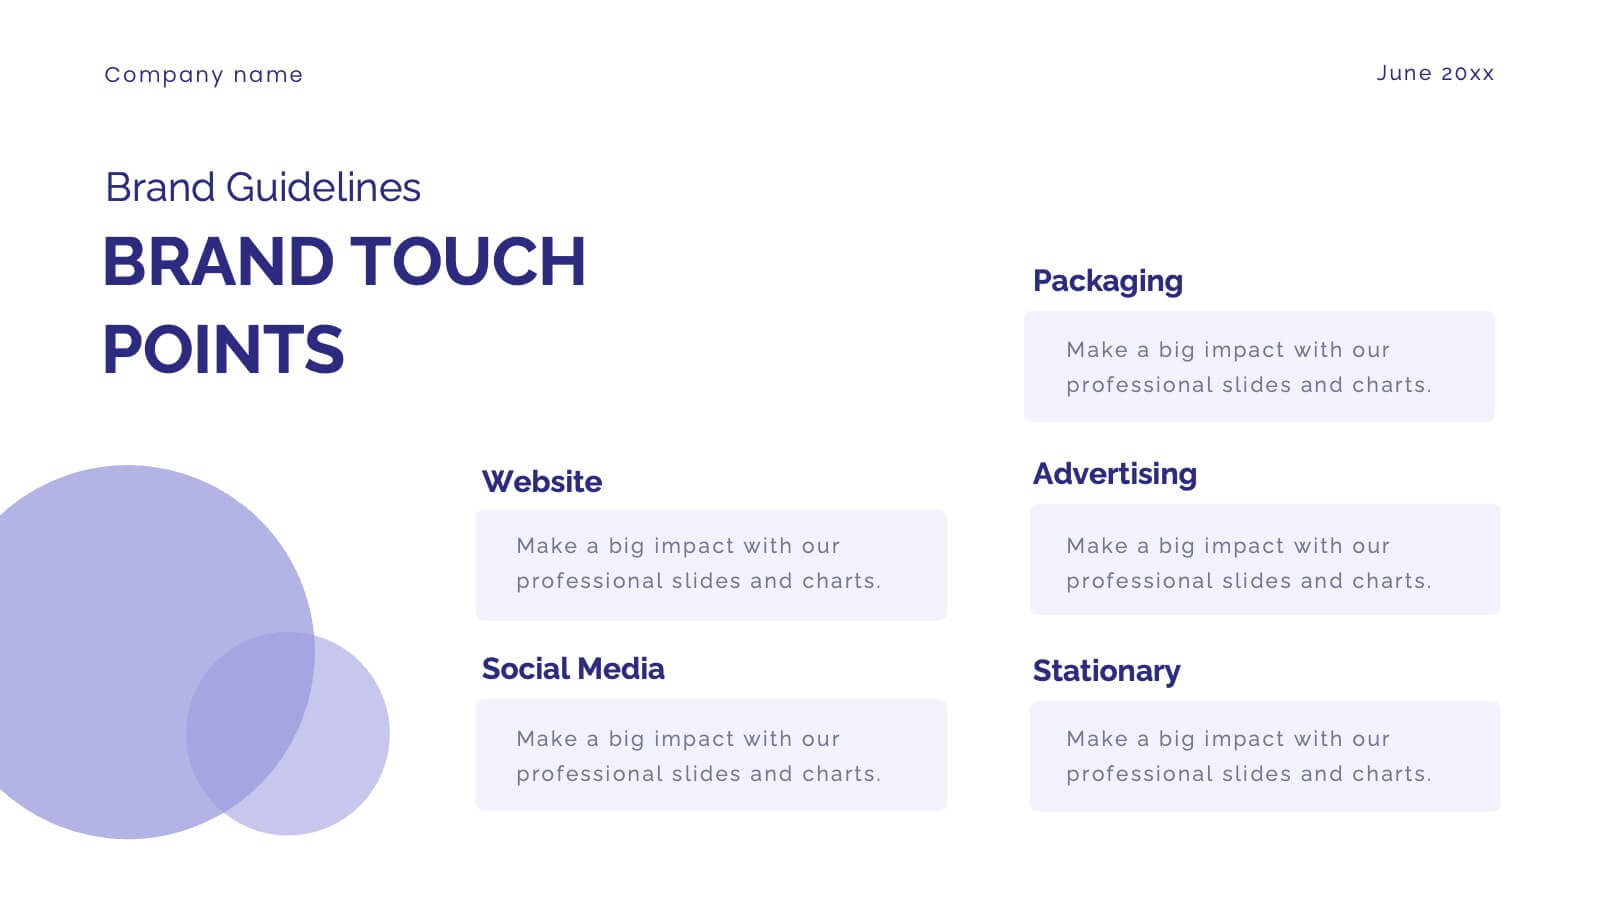
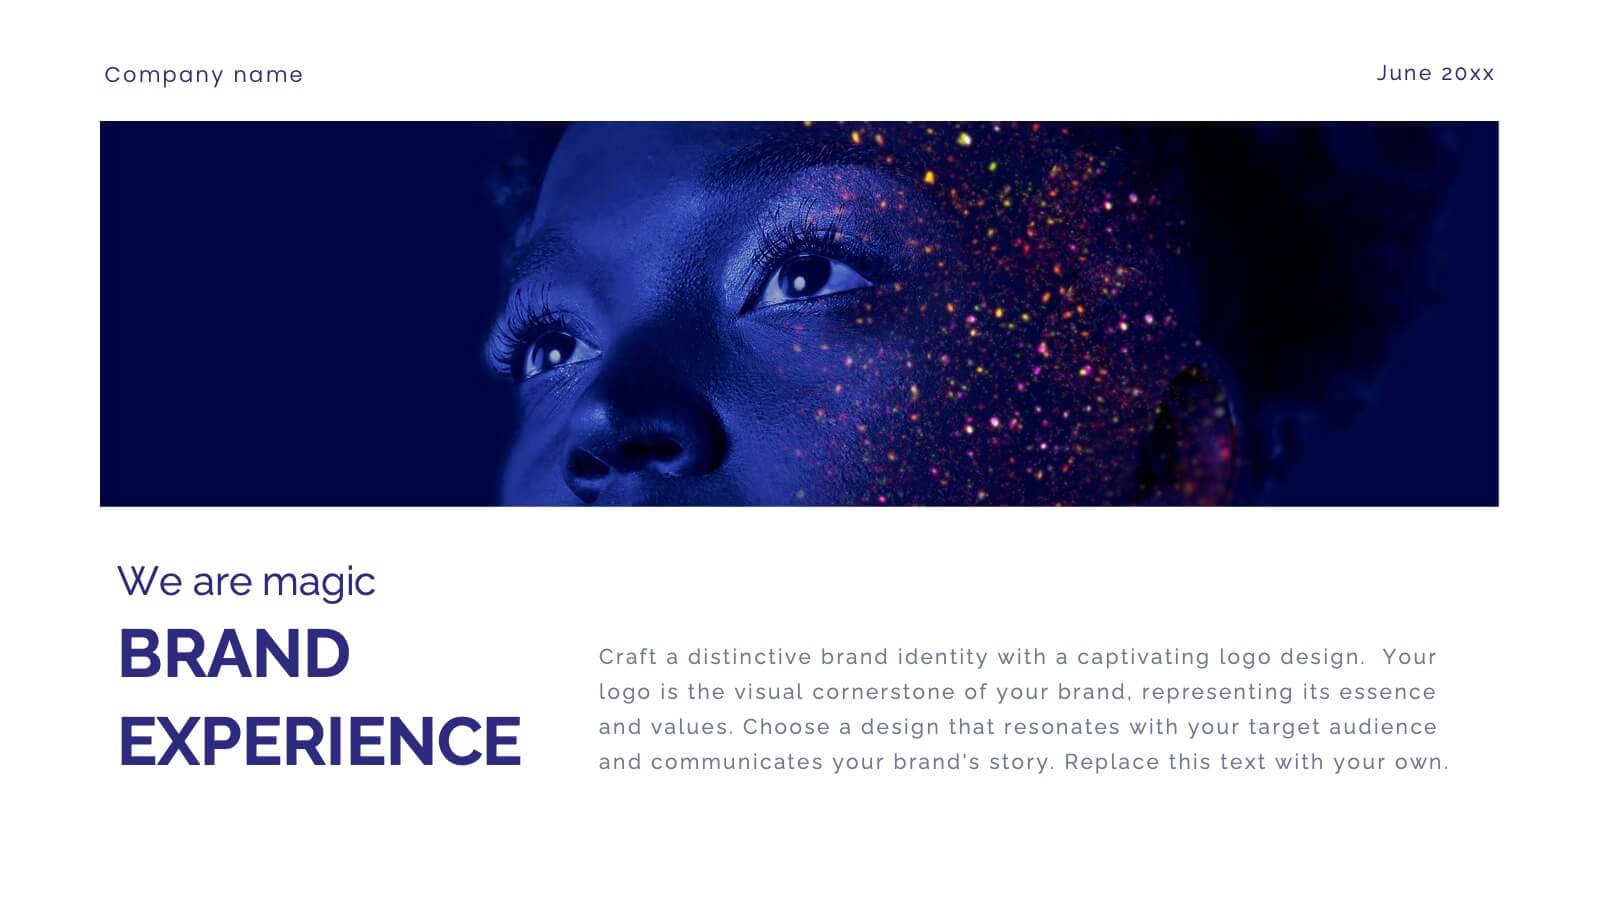
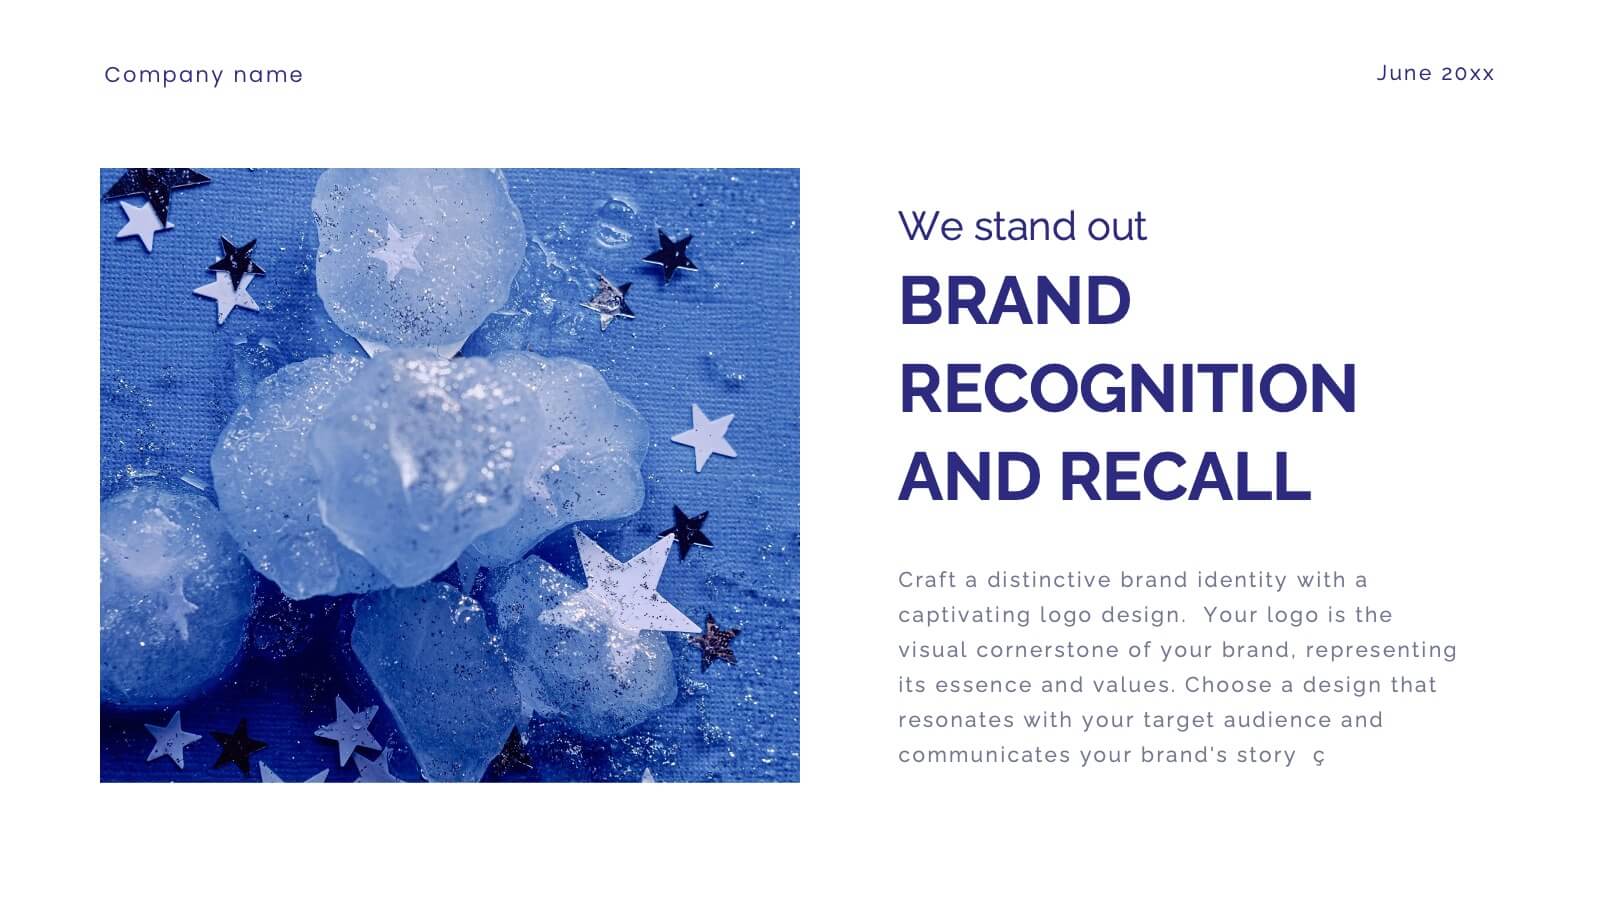
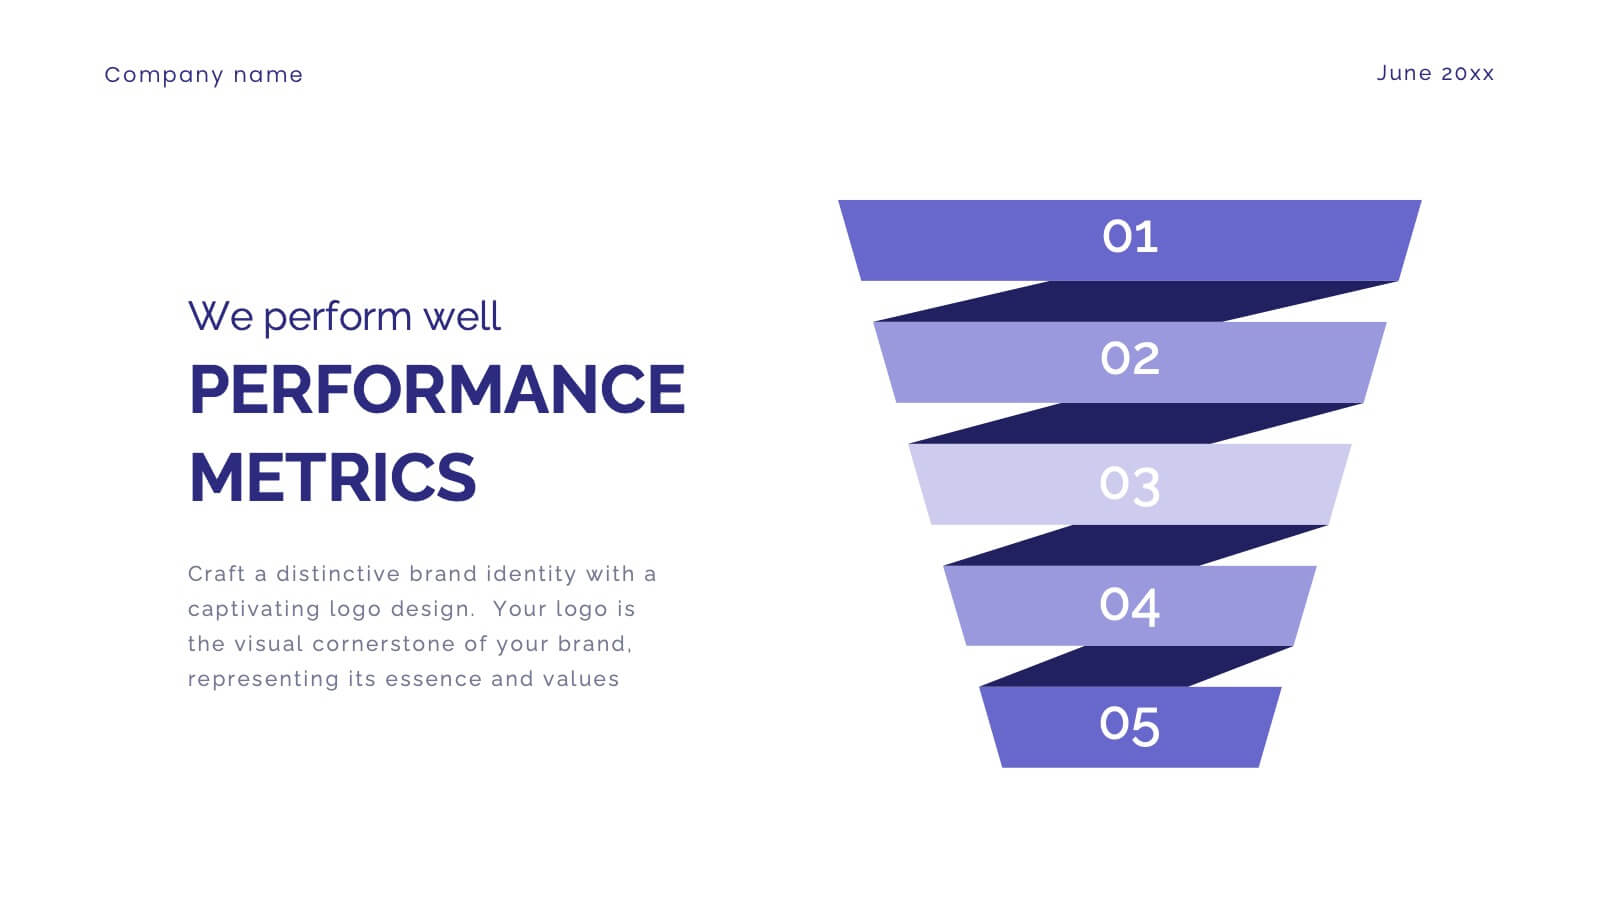
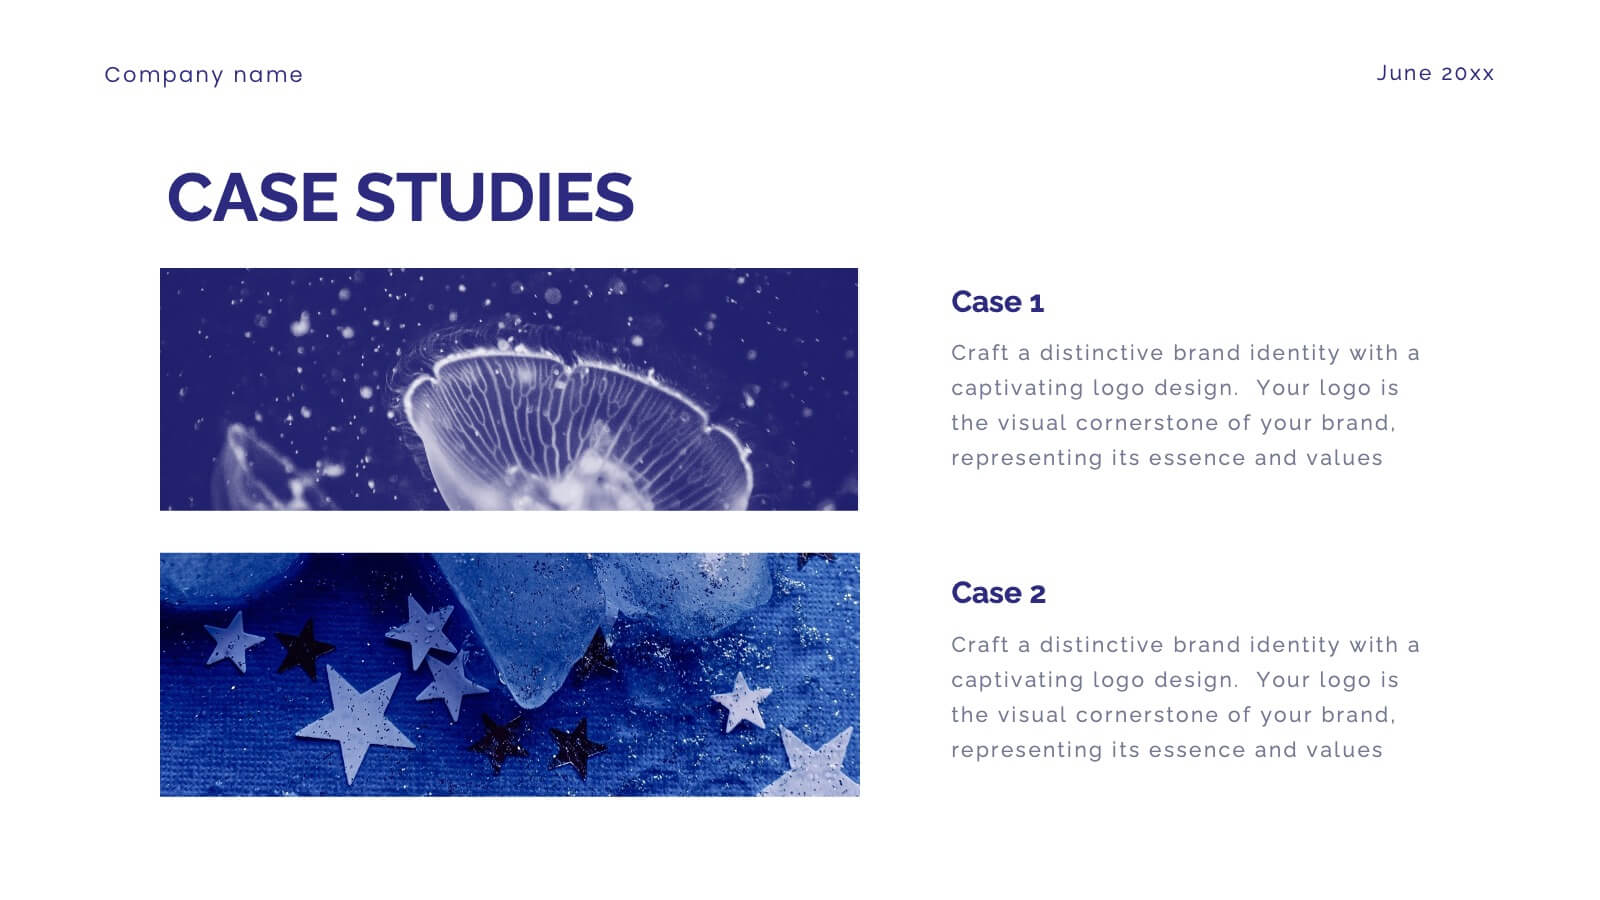
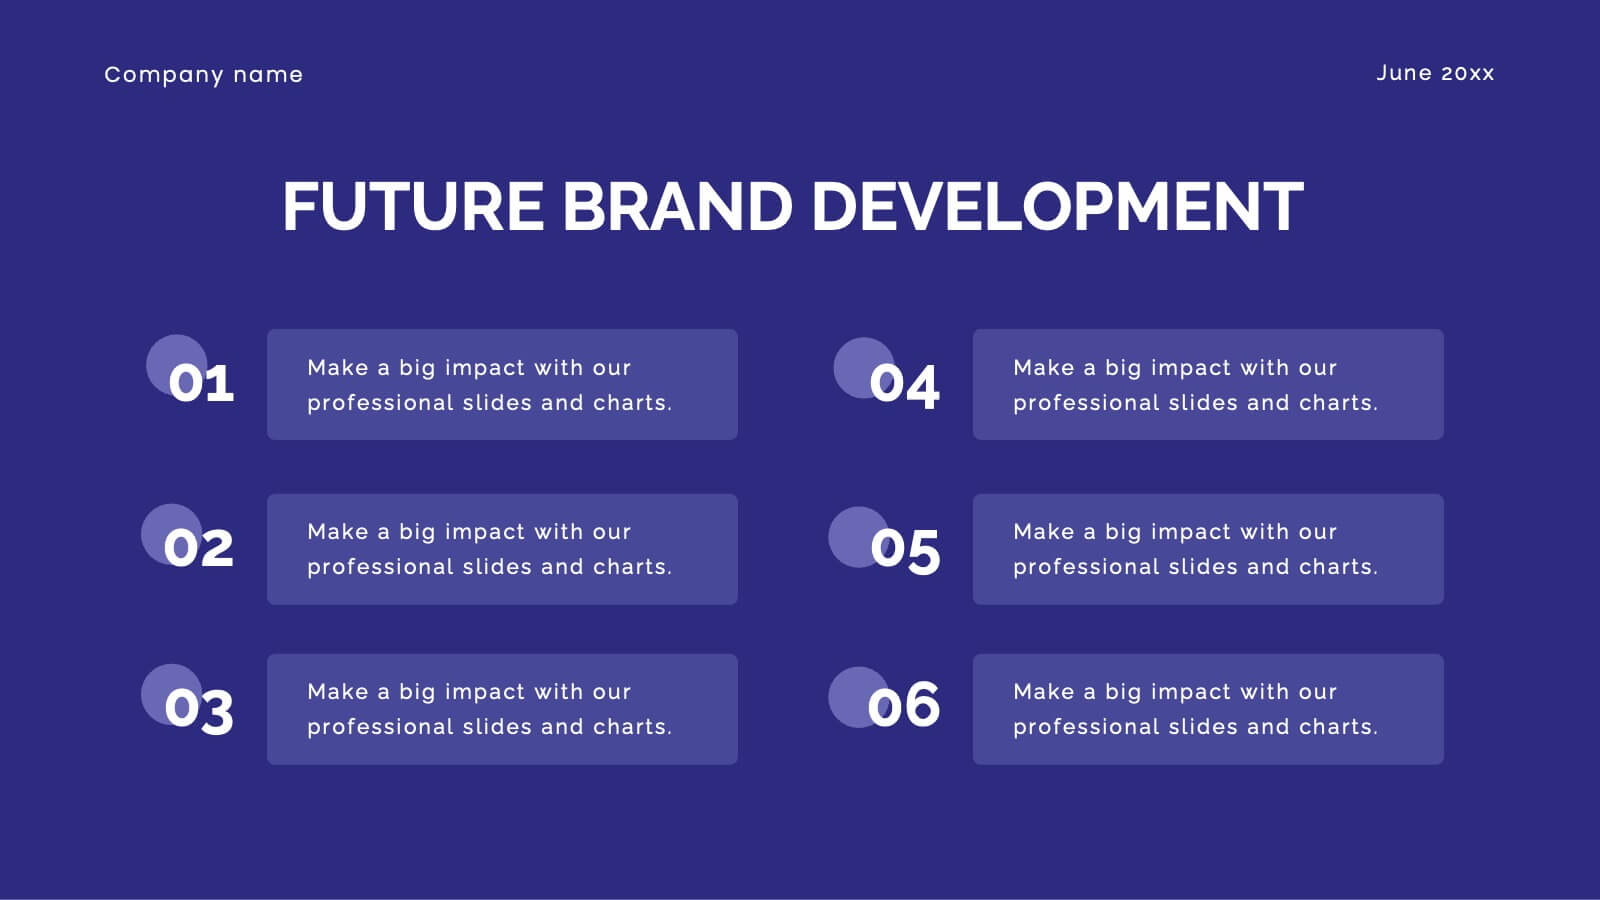
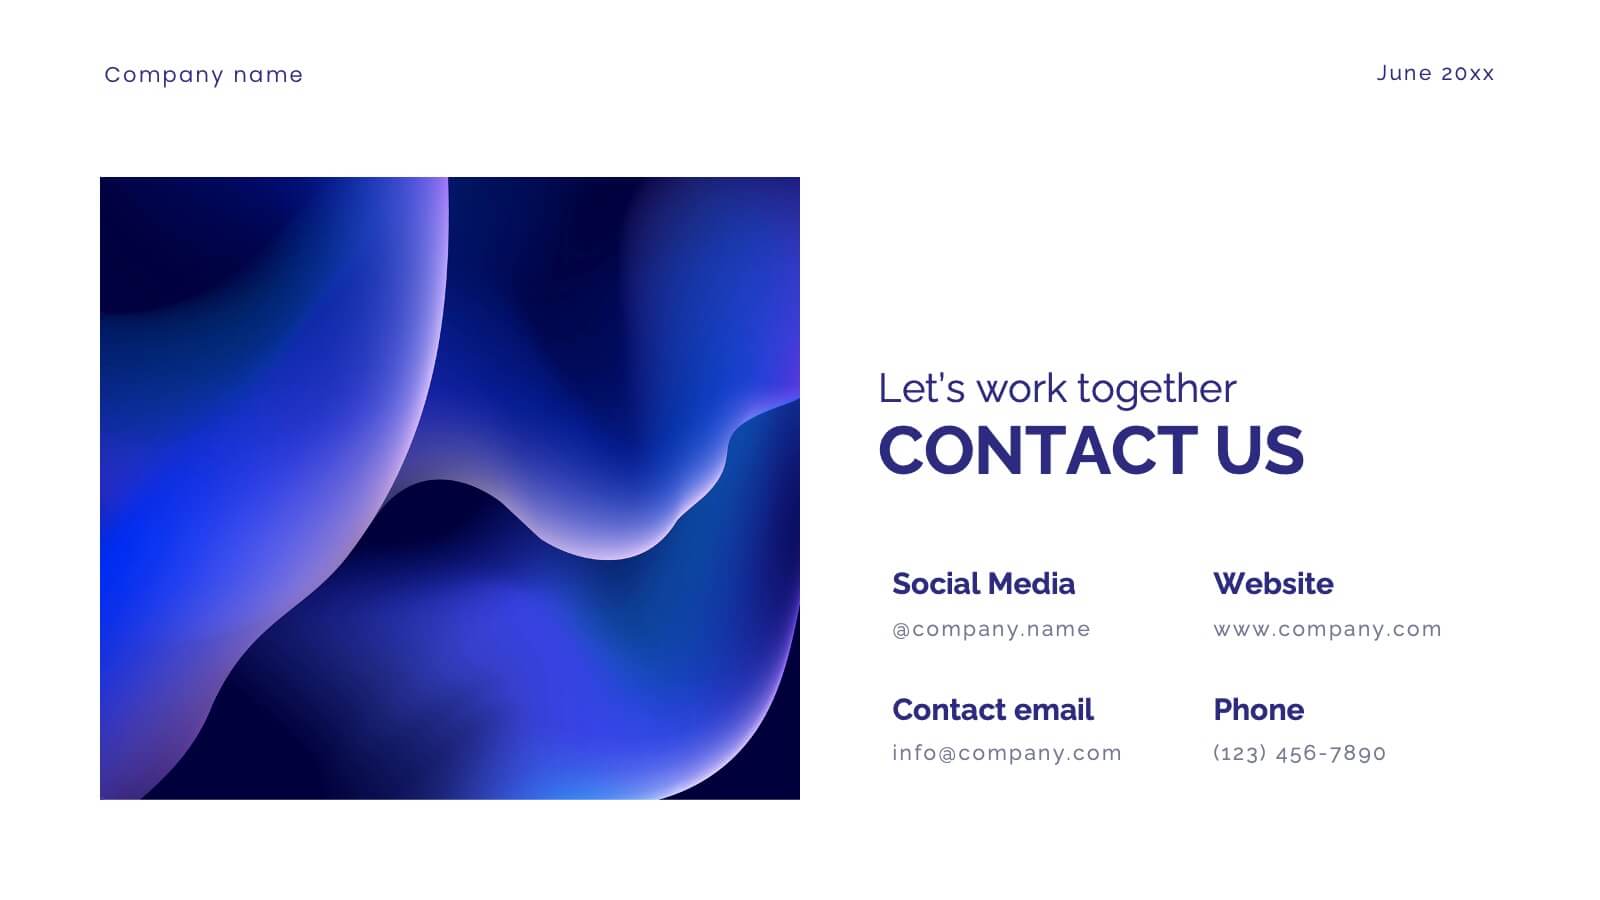
Glimmer Brand Development Pitch Deck Presentation
Elevate your brand with this comprehensive rebranding presentation template! Perfect for detailing your logo, color scheme, and market analysis, it includes slides for brand positioning, competitive landscape, and performance metrics. Engage your audience with clear visuals and structured content. Compatible with PowerPoint, Keynote, and Google Slides for seamless presentations on any platform.


6 diapositivas
Big Data Insights Visual Presentation
Transform complex analytics into clear, engaging visuals that tell a compelling story. This modern layout is perfect for showcasing data connections, performance metrics, and analytical insights in a visually balanced way. Fully editable and compatible with PowerPoint, Keynote, and Google Slides for seamless customization and professional presentations.


7 diapositivas
Success Business People Infographic Presentation
A Business People Infographic is a visual representation of data and information related to various aspects of business and the people involved in it. This infographic is a great way to illustrate your topic, point by point. This is an ideal template for making professional business presentations. This template is fully editable, perfect for business presentations and meetings. It includes all of the graphics you need to shows your audience interesting statistics and data. Compatible with Powerpoint, Keynote and Google Slides, your audience will be impressed by the dynamic slides!


6 diapositivas
5-Stage Sales Funnel Presentation
Visualize your sales process effortlessly with this 5-Stage Sales Funnel template. Ideal for showcasing lead conversion, customer journey, and sales strategies, this design is fully customizable. Adjust colors, text, and icons to fit your needs. Compatible with PowerPoint, Keynote, and Google Slides for seamless integration into your presentations.


5 diapositivas
4-Phase Product Lifecycle Diagram Presentation
Visualize your product’s evolution with the 4-Phase Product Lifecycle Diagram Presentation. Perfect for marketing, strategy, and product teams, this template maps out introduction, growth, maturity, and decline stages. Fully editable in PowerPoint, Keynote, and Google Slides—ideal for product managers, analysts, and educators presenting strategic roadmaps or lifecycle planning.


22 diapositivas
Meteor Academic Research Report Presentation
Get ready to make your research presentation stand out with the Meteor Academic Research Report template! This elegant and sophisticated design is perfect for showcasing your research findings with clarity and impact. The template features a refined color scheme of earthy browns and soft greens, giving your presentation a polished and professional look. Each slide is carefully crafted to highlight key aspects of your research, from objectives and methodology to data analysis and conclusions. With dedicated sections for literature review, key findings, and future research directions, this template ensures that your audience can follow your research journey from start to finish. The clean and structured layout makes it easy to present complex information in a way that is easy to understand. Fully compatible with PowerPoint, Keynote, and Google Slides, the Meteor template is the ideal choice for delivering compelling and visually appealing academic presentations.


5 diapositivas
Linear Business Process Flowchart Presentation
Visualize sequential processes with this clean linear flowchart layout. Ideal for workflows, decision-making steps, or procedural overviews. Featuring directional connectors and labeled shapes, this design keeps your message structured and easy to follow. Fully editable in PowerPoint, Keynote, or Google Slides—perfect for business processes, planning, and operations presentations.