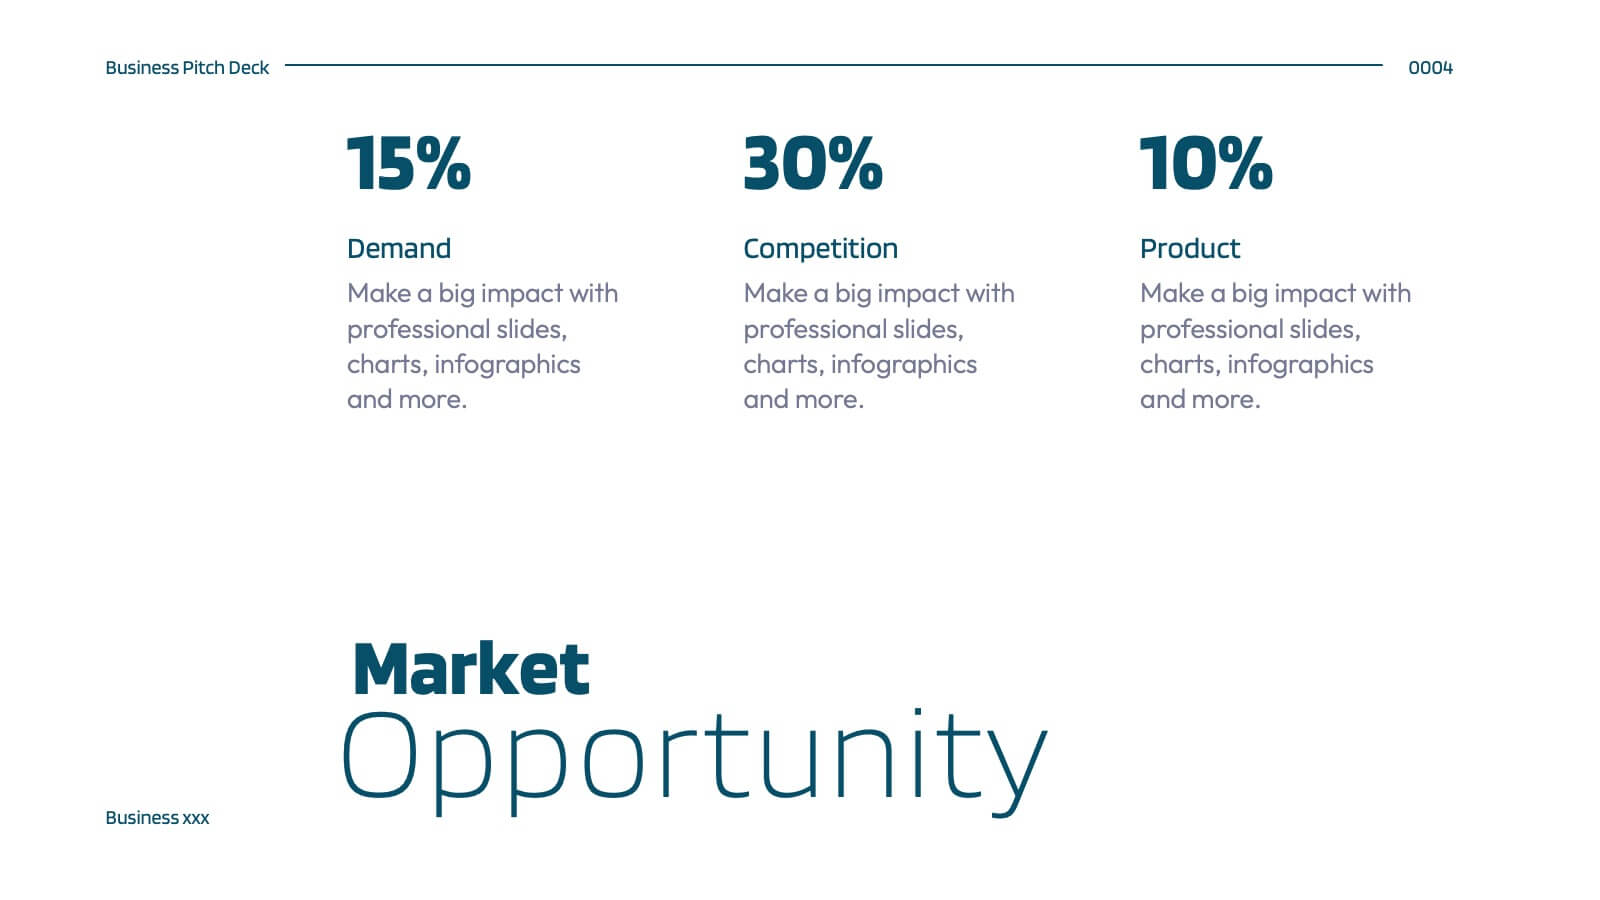
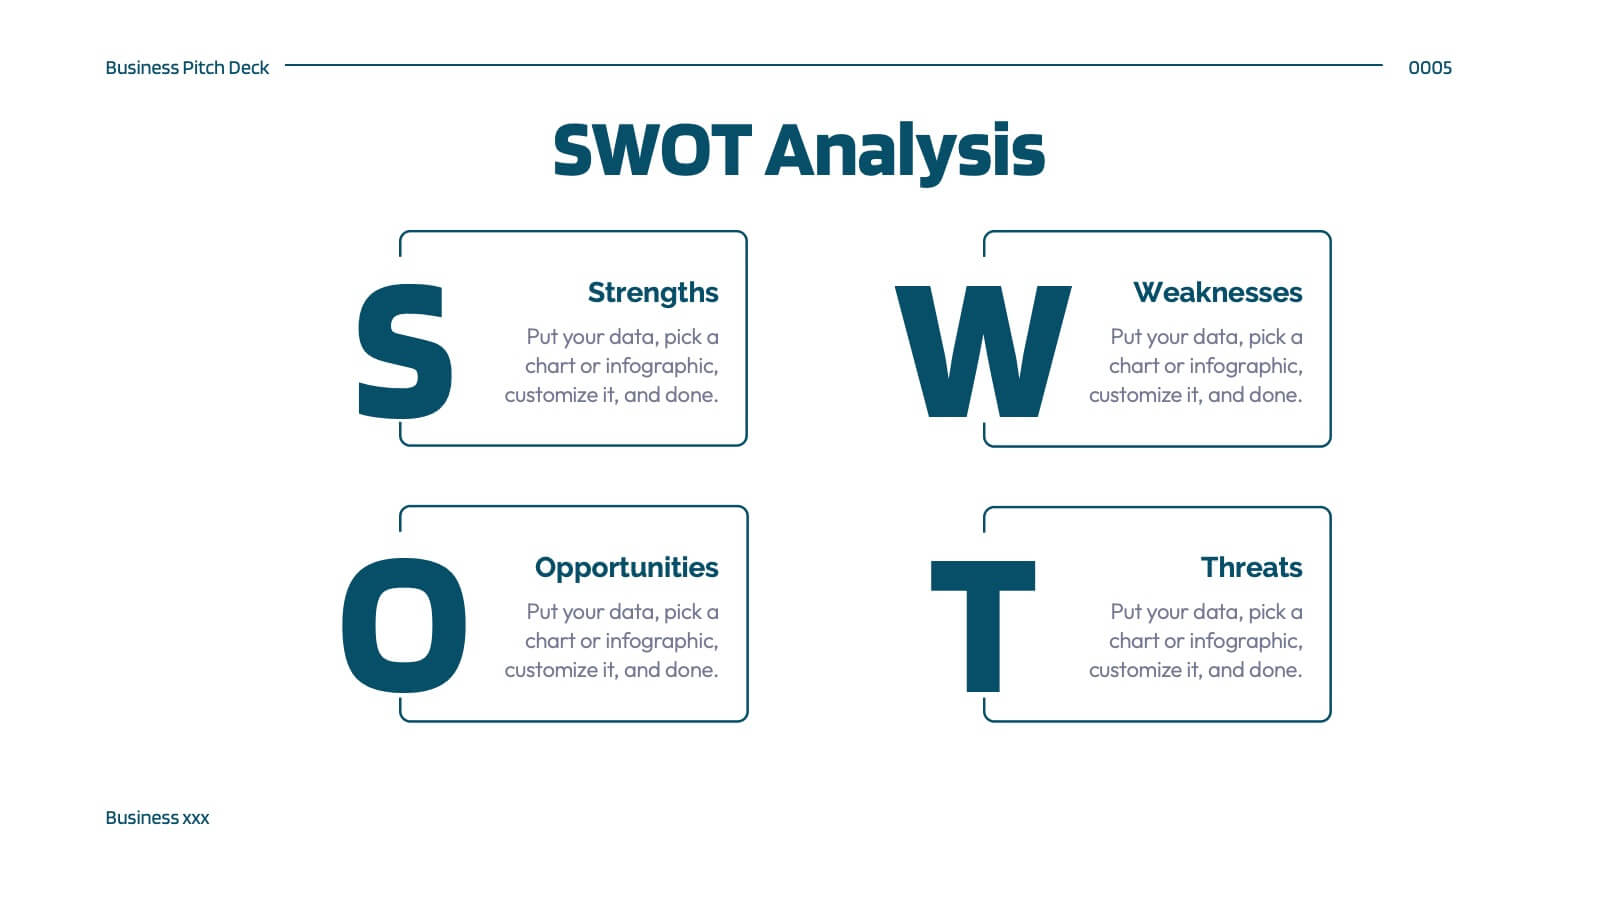
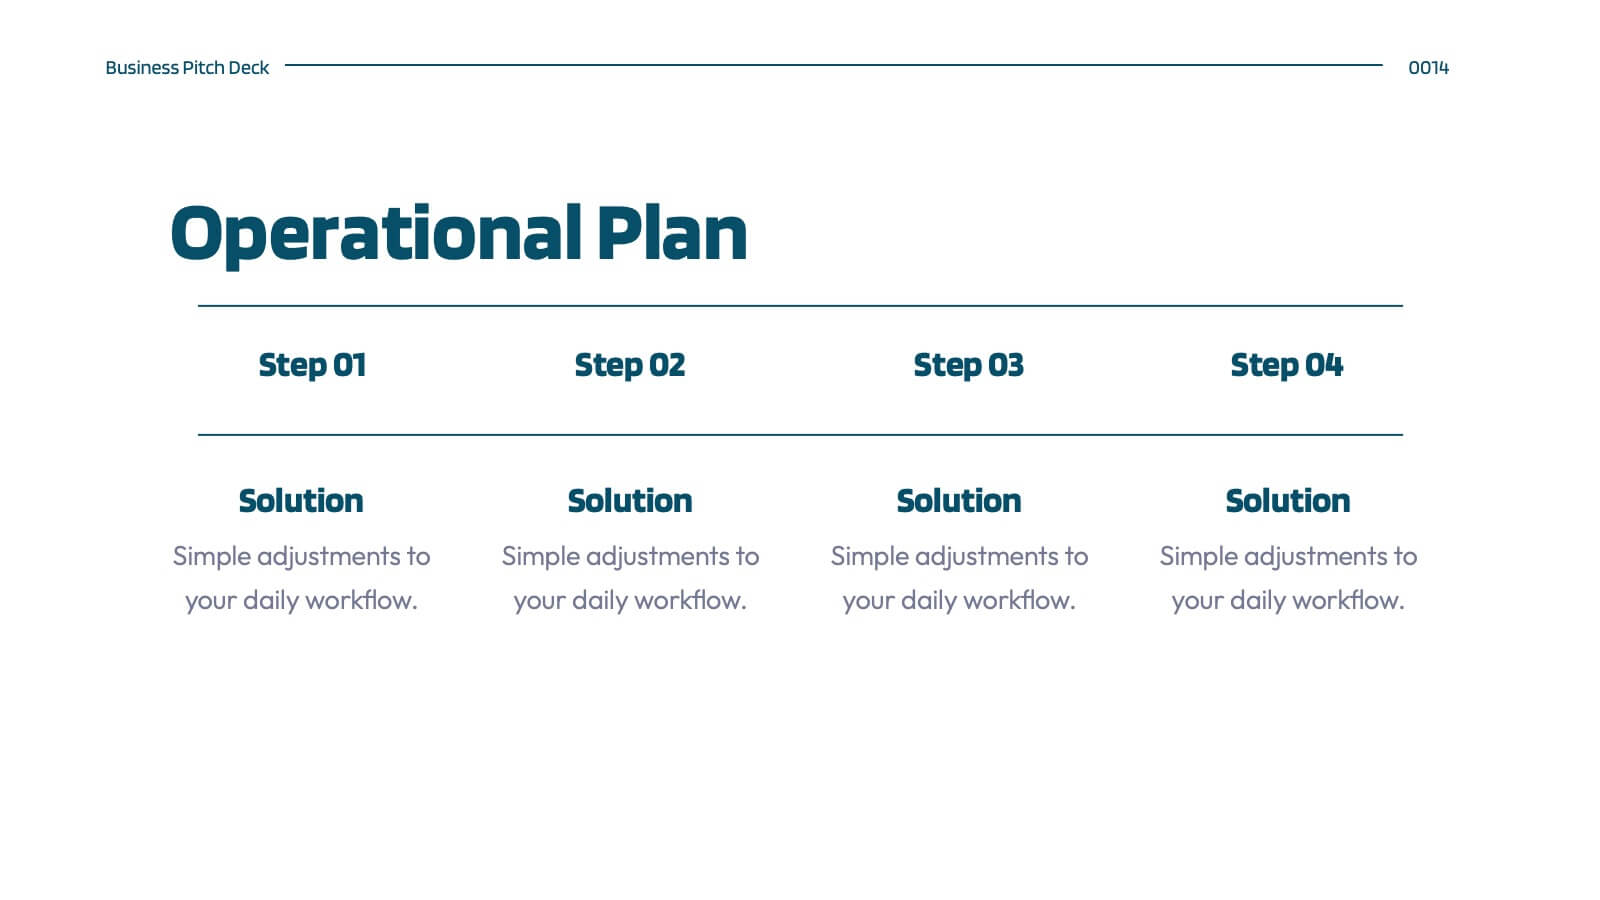
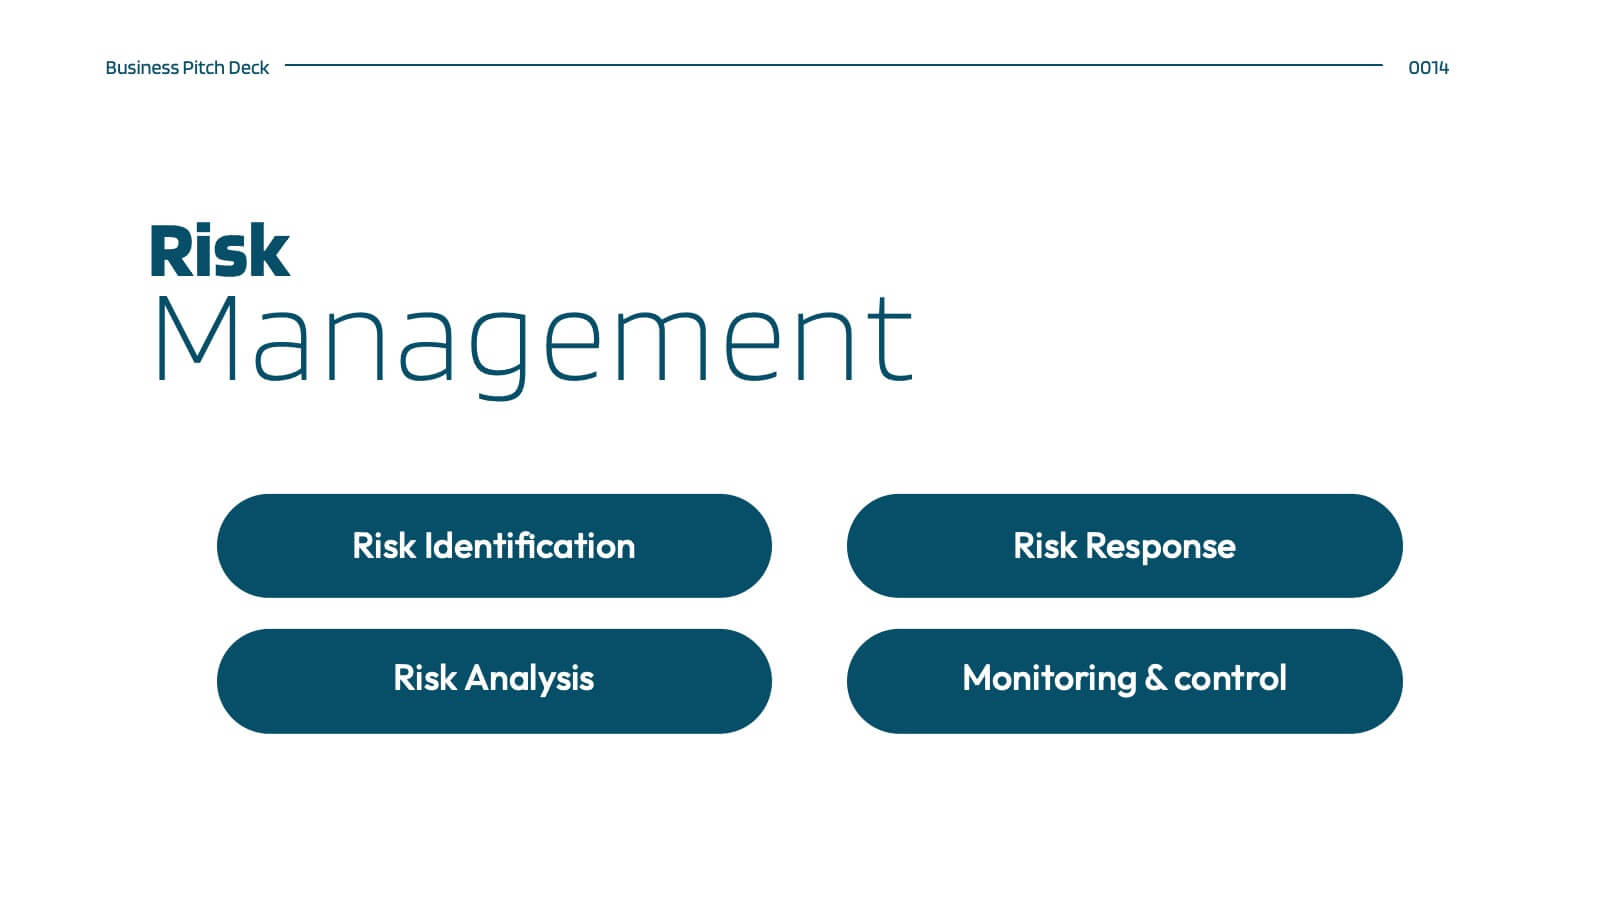
Business Lifecycle Circle Format Presentation
PowerPoint Template and Google Slides Theme


Características
- Eliminar de favoritos
Plantilla de PowerPoint
1 MB
Plantilla de Google Slides
Enlace externo
Plantilla de Keynote
1 MB
Recomendar
- Eliminar de favoritos
Plantilla de PowerPoint
1 MB
Plantilla de Google Slides
Enlace externo
Plantilla de Keynote
1 MB
4 diapositivas
Medical Overview and Clinical Solutions Presentation
Present medical insights with clarity using the Medical Overview and Clinical Solutions Presentation. This slide features a segmented pill bottle graphic paired with three labeled sections (A, B, C), ideal for explaining treatments, protocols, or phased approaches. Fully editable in Canva, PowerPoint, Keynote, and Google Slides for seamless customization.
- Eliminar de favoritos
Plantilla de PowerPoint
9 MB
Plantilla de Google Slides
Enlace externo
Plantilla de Keynote
5 MB
23 diapositivas
Phantasia Sales Pitch Deck Presentation
Impress stakeholders and close deals effectively with this sleek and dynamic pitch deck template. With structured slides for company overview, problem statements, and market opportunities, you can present your solutions with clarity and impact. Showcase your business model, revenue streams, and unique selling propositions to stand out in a competitive landscape. This template also includes slides for financial projections, growth strategies, and funding requirements, making it an excellent choice for entrepreneurs, sales teams, and business leaders. The modern design ensures your data is engaging and easy to follow, keeping your audience focused on your message. Fully editable and compatible with PowerPoint, Google Slides, and Keynote, this template provides the customization options you need to align with your branding and goals. Perfect for delivering professional and persuasive presentations.
- Eliminar de favoritos
Plantilla de PowerPoint
1 MB
Plantilla de Google Slides
Enlace externo
Plantilla de Keynote
1 MB
7 diapositivas
Smart House Concept and Design Layout Presentation
Present your smart home innovations with the Smart House Concept and Design Layout Presentation. This slide features a central house icon and six circular nodes, ideal for explaining home automation systems, IoT integrations, or security features. Fully editable in Canva, PowerPoint, Keynote, and Google Slides—perfect for tech startups, product demos, and future living pitches.
- Eliminar de favoritos
Plantilla de PowerPoint
1 MB
Plantilla de Google Slides
Enlace externo
Plantilla de Keynote
1 MB
5 diapositivas
Food Waste in School Infographics
Food Waste in schools is a significant issue that can have economic, environmental, and social impacts. These vertical infographics aim to raise awareness about the magnitude of the problem and provide actionable steps to reduce food waste in schools. These can be used as valuable tools to highlight the issue of food waste in school environments. The visually appealing illustrations, informative content, and color schemes make it effective for raising awareness and promoting sustainable practices in school environments. Compatible with Powerpoint, Keynote, and Google Slides.
- Eliminar de favoritos
Plantilla de PowerPoint
1 MB
Plantilla de Google Slides
Enlace externo
Plantilla de Keynote
1 MB
7 diapositivas
Six Sigma Methodology Infographic Presentation Template
Our Six Sigma Methodology template is a great way to start any project. This can be used as a guideline to create the foundations of the Six Sigma model and allow you to think about how to approach your project in terms of how it will be analyzed, making it easier for people working on the same projects to analyze their own results and make sure they are all aligned with the core principles of Six Sigma. With our Six Sigma Methodology template, you can easily organize and manage your entire process. Using this template will save you time and allow you to get more work done in less time.
- Eliminar de favoritos
Plantilla de PowerPoint
Enlace externo
Plantilla de Google Slides
Enlace externo
Plantilla de Keynote
Enlace externo
7 diapositivas
Structure Diagram Infographics
Structure is important because it provides a framework for organization and order, which helps to facilitate efficiency, productivity, and success in many different areas of life. This template is a powerful tool that can help you organize, visualize, and present your data in a compelling way. This infographic template is designed to illustrate the structure and workings of a company or organization. It includes a variety of customizable photo layouts and charts so you can edit the look to suit your needs. This presentation is designed for use in Powerpoint, Keynote and Google Slides.
- Eliminar de favoritos
Plantilla de PowerPoint
1 MB
Plantilla de Google Slides
Enlace externo
Plantilla de Keynote
1 MB
6 diapositivas
Business Risk Mitigation Framework Presentation
Visualize and communicate your risk management strategies with this two-part puzzle-style framework. Ideal for showcasing problems and solutions, action plans, or risk-response workflows. Clean and modern layout enhances clarity. Fully editable in PowerPoint, Keynote, and Google Slides—perfect for business continuity planning, operational strategy, and stakeholder presentations.
- Eliminar de favoritos
Plantilla de PowerPoint
2 MB
Plantilla de Google Slides
Enlace externo
Plantilla de Keynote
3 MB
22 diapositivas
Hellenic Small Business Pitch Deck Presentation
Unleash the spirit of entrepreneurship with this captivating Hellenic-themed presentation! Designed specifically for small business pitches, this template allows you to showcase your business concept, market analysis, and financial plans with elegance and clarity. Its vibrant visuals will engage your audience and leave a lasting impression. Compatible with PowerPoint, Keynote, and Google Slides.
- Eliminar de favoritos
Plantilla de PowerPoint
1 MB
Plantilla de Google Slides
Enlace externo
Plantilla de Keynote
1 MB
6 diapositivas
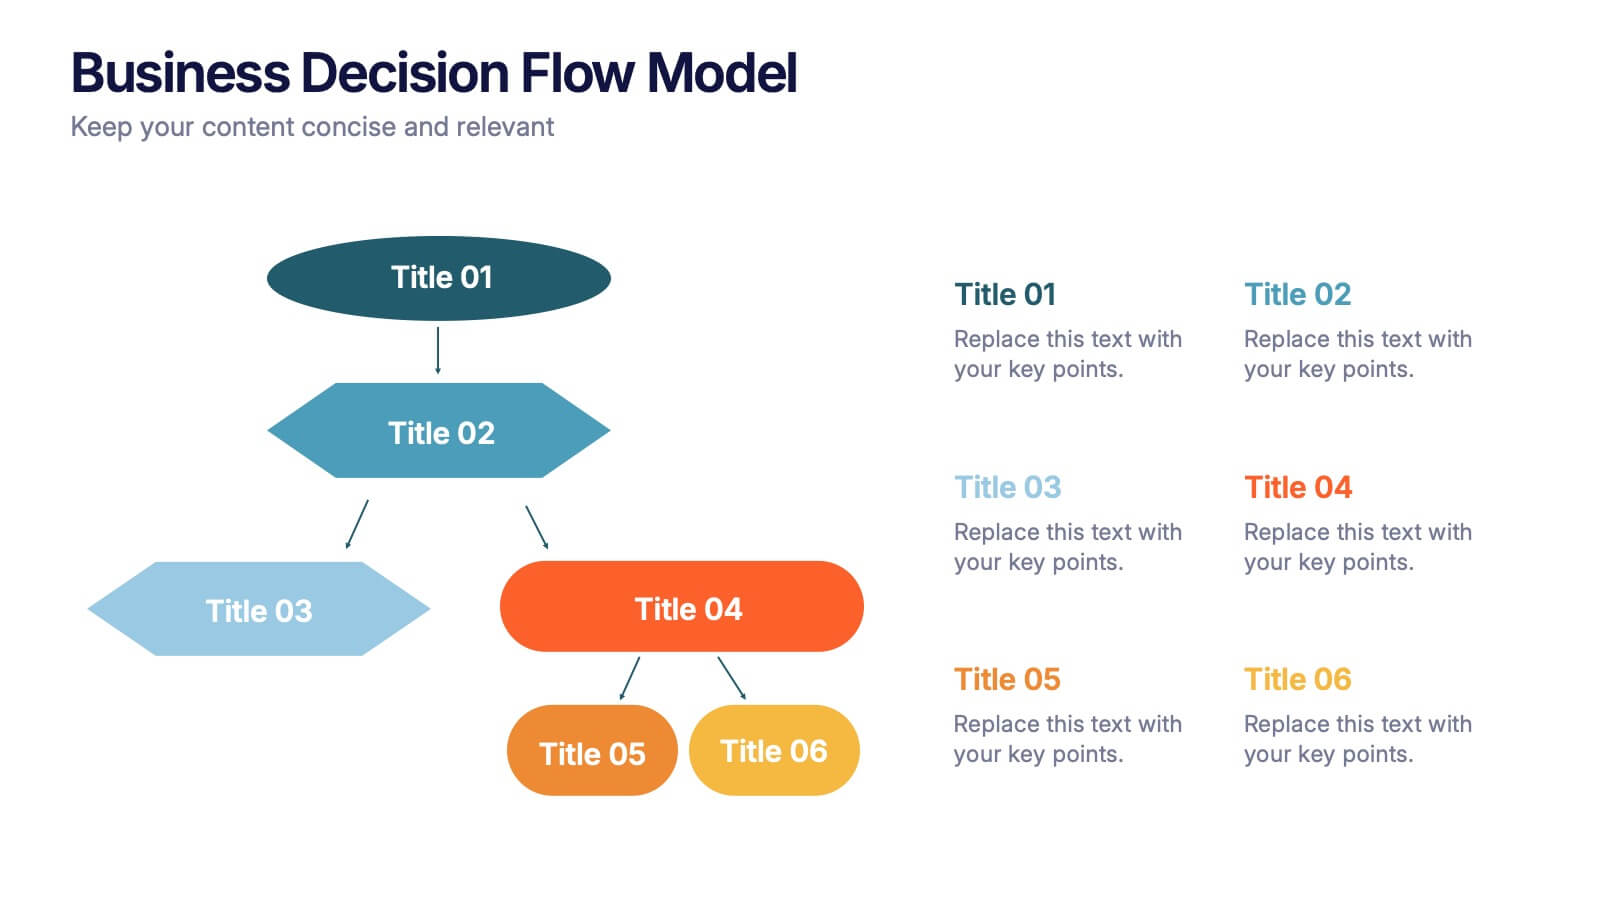
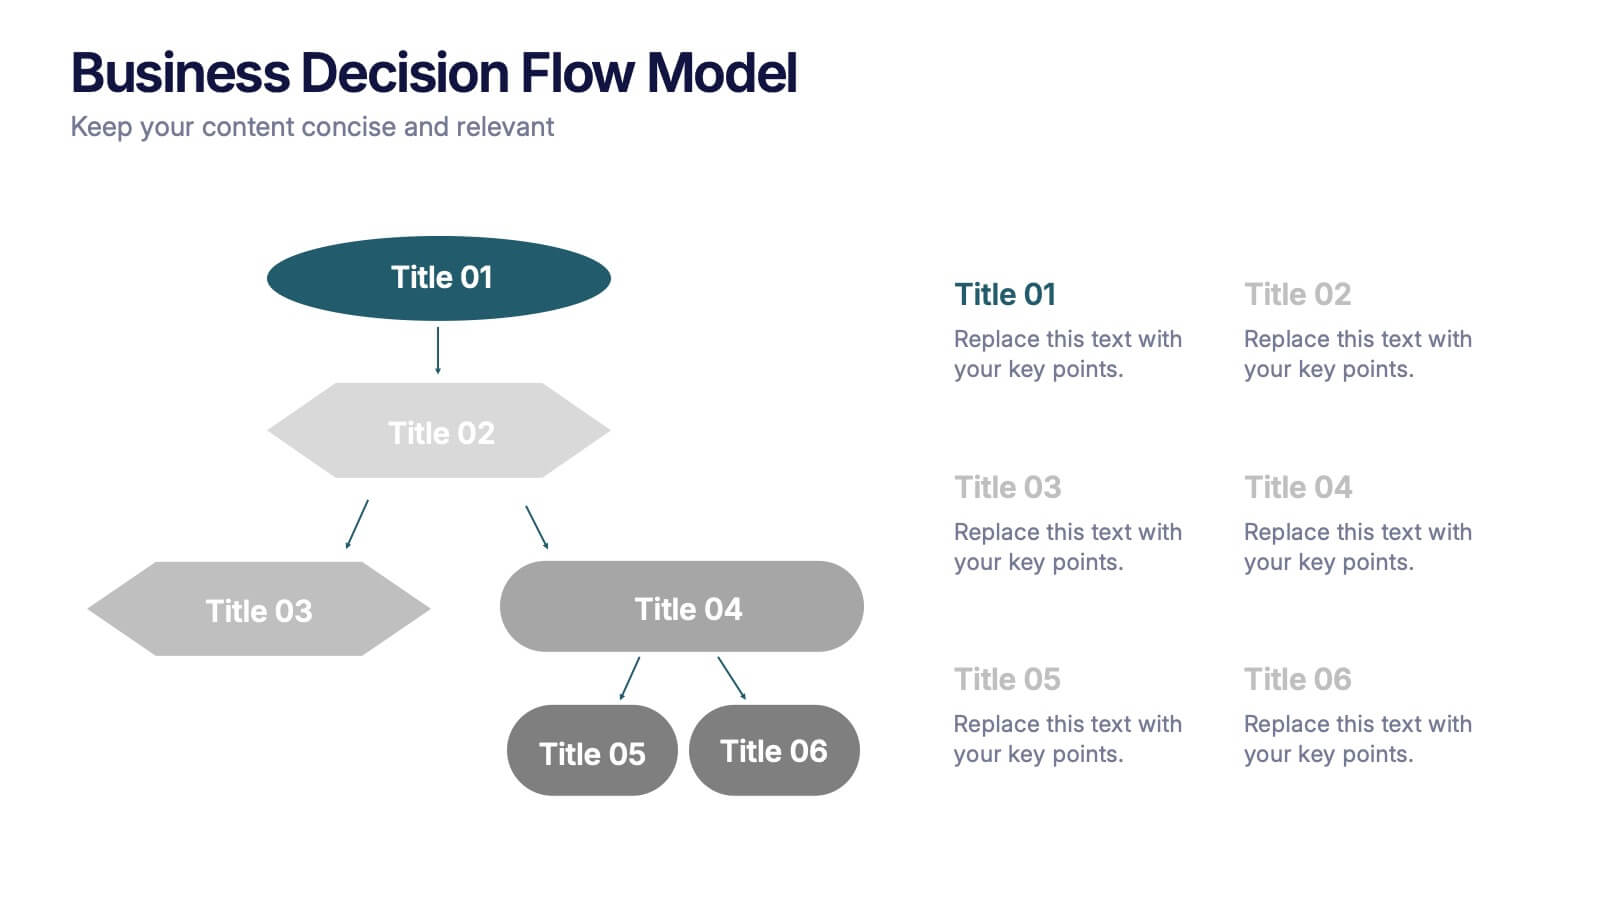
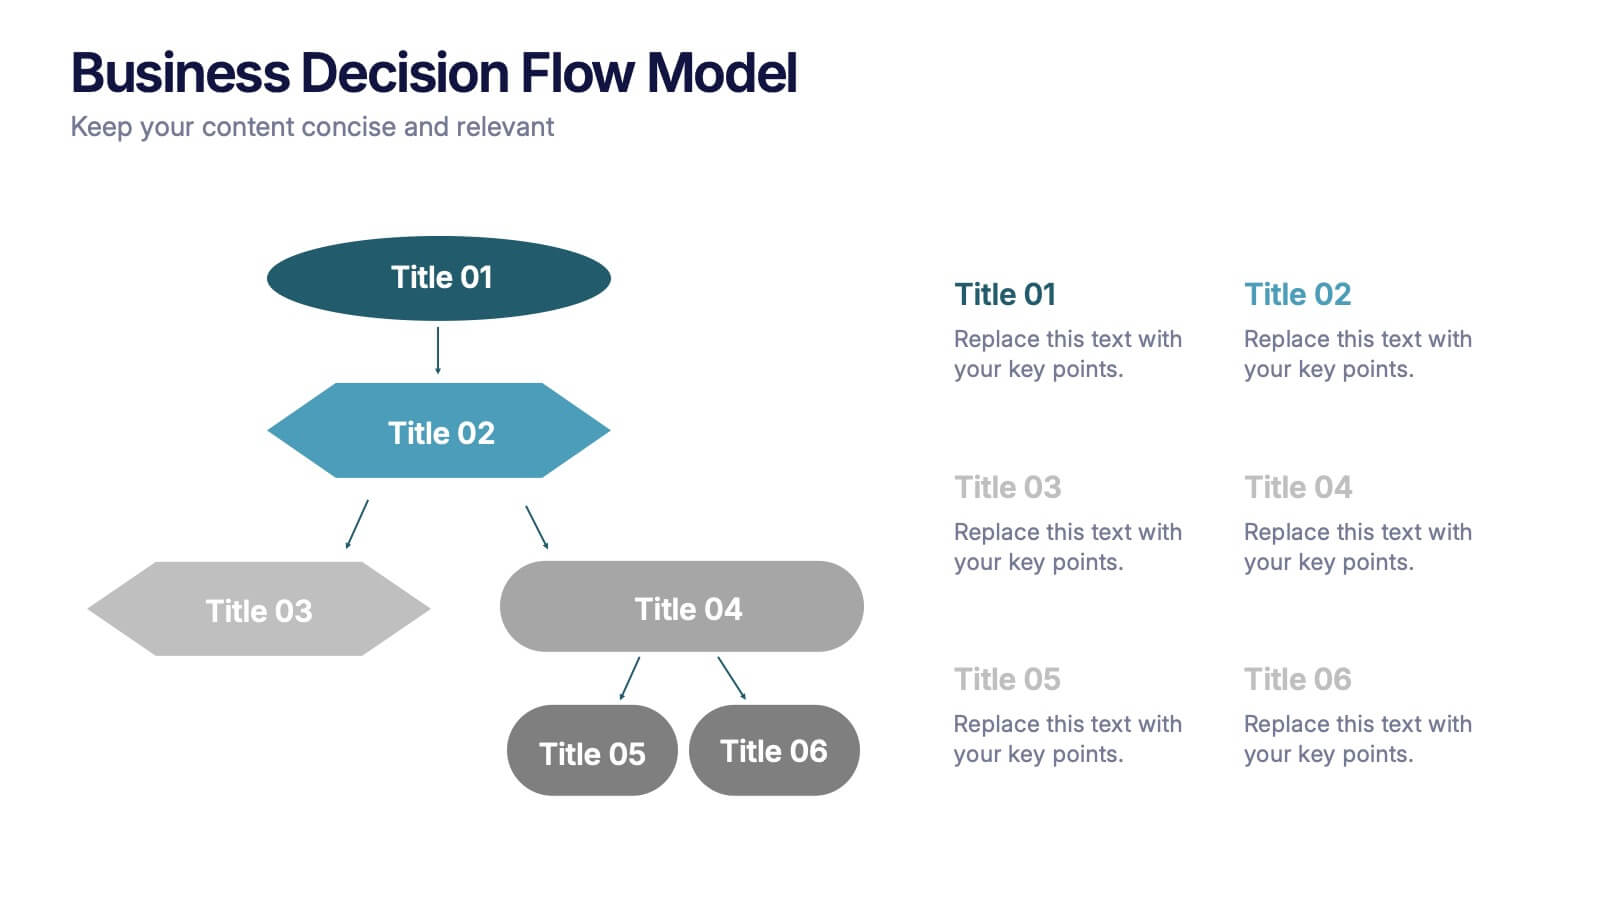
Business Decision Flow Model Presentation
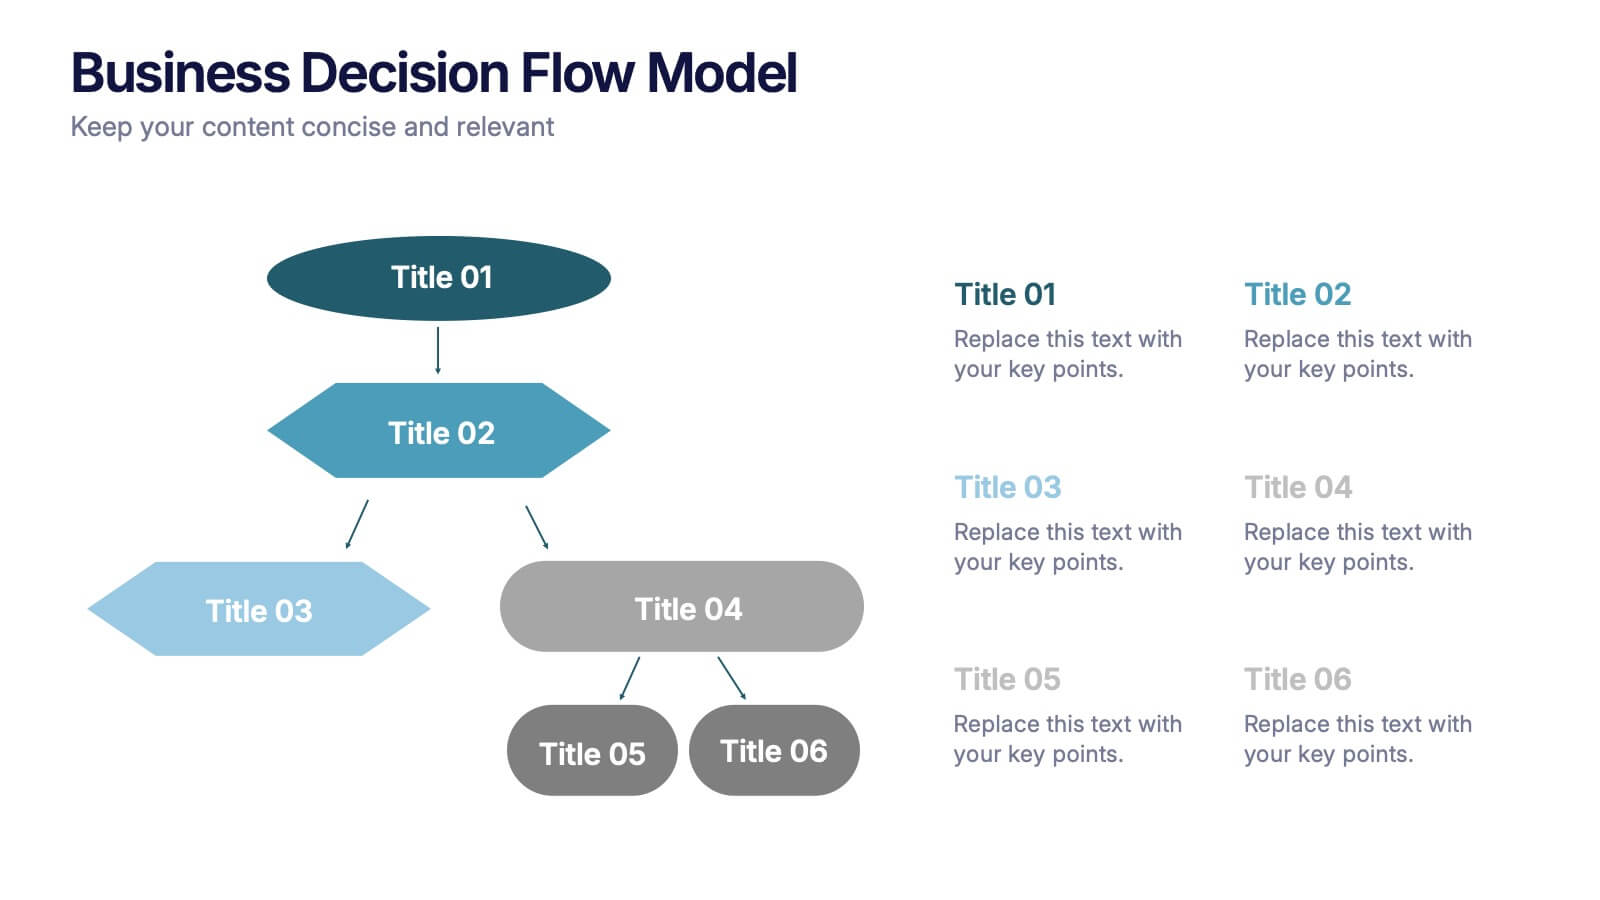
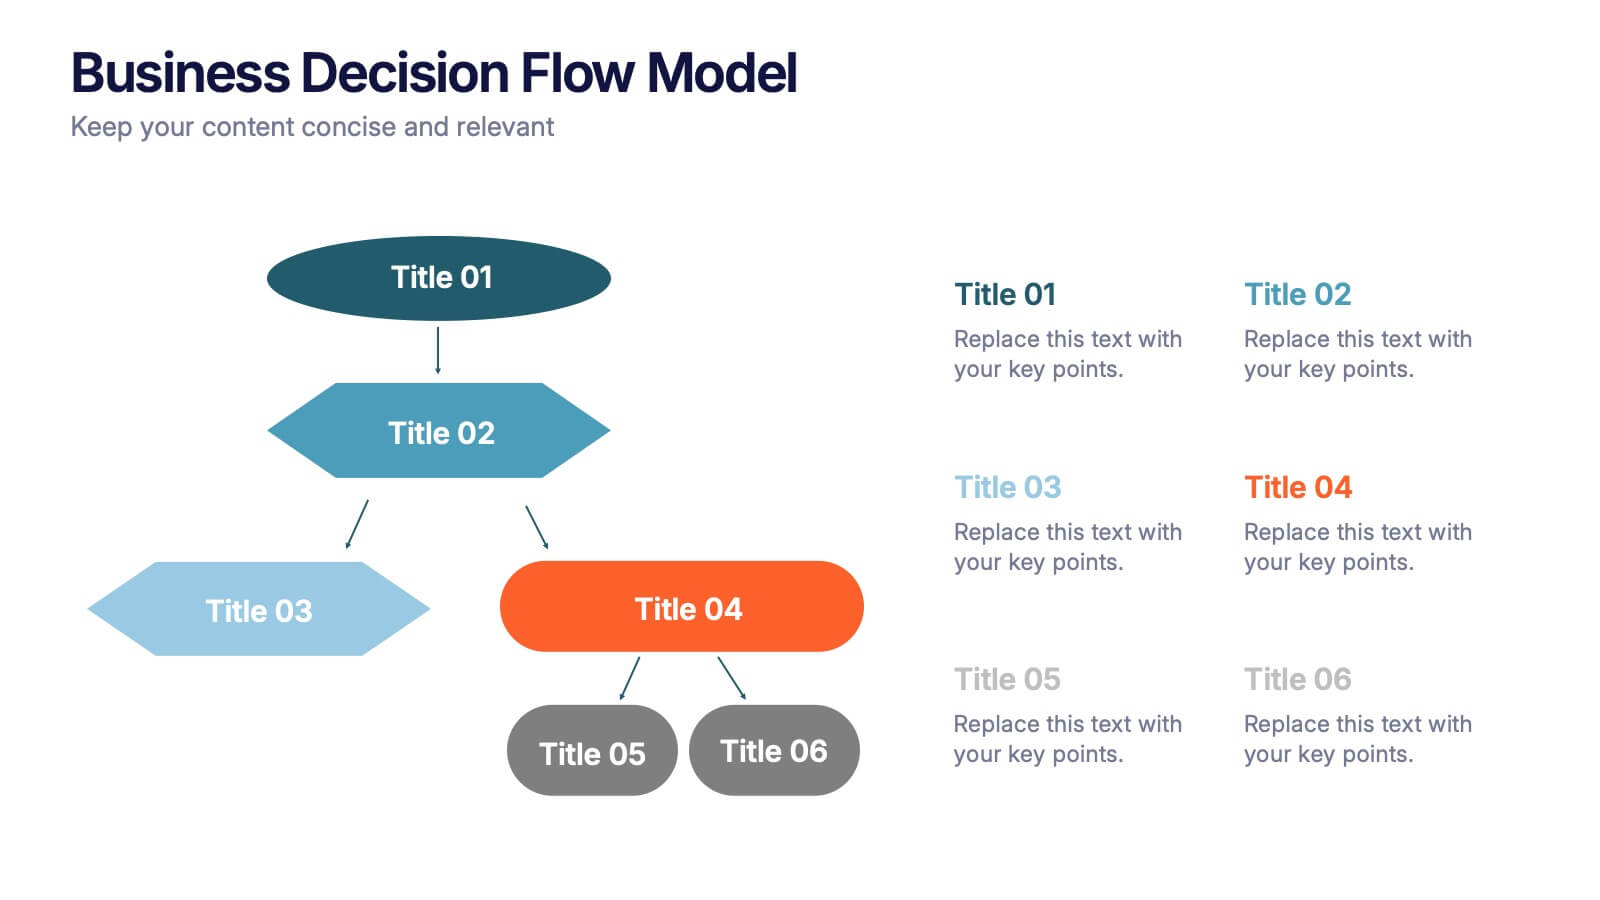
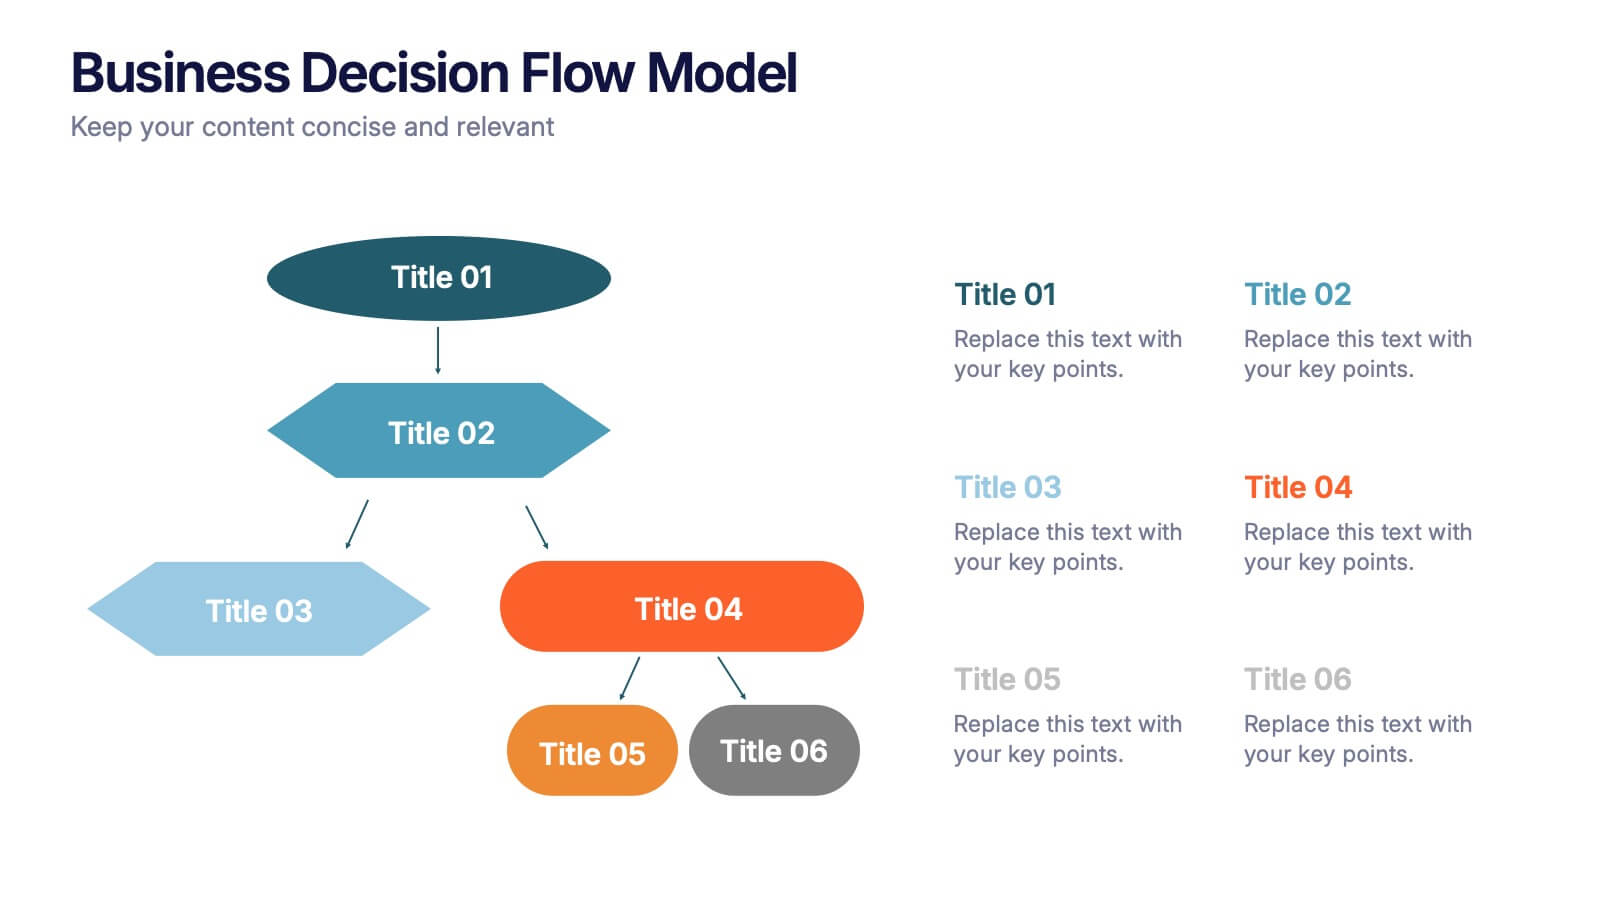
Make smarter choices with this Business Decision Flow Model presentation. Clearly map out key decisions, steps, and potential outcomes using a structured, color-coded flow. Perfect for strategy reviews, team meetings, and executive briefings. Fully editable in Canva, PowerPoint, and Google Slides for seamless customization.
- Eliminar de favoritos
Plantilla de PowerPoint
1 MB
Plantilla de Google Slides
Enlace externo
Plantilla de Keynote
1 MB
5 diapositivas
Banking Security Service Infographics
Navigate the complexities of financial safety with our banking security services infographics template. Dressed in calming pastel tones of cream, blue, purple, and yellow, this invaluable tool is tailored for banking professionals, financial consultants, and cybersecurity experts. Its vertical, creative, and informative design is dense with up-to-date graphics and icons, simplifying intricate data into engaging content. Whether it's for client presentations, or internal communications, this template translates banking security concepts into visually striking, easily understandable infographics, bolstering confidence and comprehension.
- Eliminar de favoritos
Plantilla de PowerPoint
1 MB
Plantilla de Google Slides
Enlace externo
Plantilla de Keynote
2 MB
6 diapositivas
RACI Matrix Management Infographics
Streamline your project management with our RACI Matrix Management infographic template, compatible with PowerPoint, Keynote, and Google Slides. This template is a valuable tool for project managers, team leaders, and professionals involved in collaborative projects. Our template distinctly outlines the four key roles of RACI - Responsible, Accountable, Consulted, and Informed. Each section is clearly demarcated, making it easy to assign and display roles and responsibilities within your team. This structured approach ensures that everyone involved in a project understands their tasks and the hierarchy of accountability. The color scheme of the template is subtle and business-like, ideal for a corporate environment. It enhances readability and comprehension, ensuring that the RACI matrix is not only informative but also visually appealing. This template is an essential asset for efficient team management, enabling clear communication and organization in any project.
- Eliminar de favoritos
Plantilla de PowerPoint
1 MB
Plantilla de Google Slides
Enlace externo
Plantilla de Keynote
1 MB
10 diapositivas
Professional Business People Icons Presentation
The "Professional Business People Icons" presentation template offers a range of icons designed to represent business roles or activities visually. These slides are structured to incorporate iconography alongside text placeholders, allowing for easy customization to describe specific business functions or departments. The use of simple, clean icons ensures that the content is accessible and straightforward, suitable for professional presentations that require a blend of visual appeal and clarity. This template can effectively communicate various aspects of business operations or team roles in corporate presentations.
- Eliminar de favoritos
Plantilla de PowerPoint
1 MB
Plantilla de Google Slides
Enlace externo
Plantilla de Keynote
1 MB
5 diapositivas
Manufacturing Insights Infographics
Manufacturing insights refer to valuable information, analysis, and observations derived from the manufacturing industry. These vertical set of infographics are designed to provide valuable insights and data related to the manufacturing industry. This template is ideal for manufacturing companies and researchers looking to present complex data in an engaging manner. The template includes infographics that break down the manufacturing process into easily understandable steps, using simple graphics and icons. This template is easily editable, allowing users to adjust colors, charts, and data to match their specific manufacturing insights.
- Eliminar de favoritos
Plantilla de PowerPoint
1 MB
Plantilla de Google Slides
Enlace externo
Plantilla de Keynote
2 MB
6 diapositivas
Academy Sports Infographic
Sports are physical activities or games that involve individual or team competition and are typically governed by specific rules. This infographic template highlights key aspects of sports and physical activities in an academy setting. Whether it's a school sports program, a community sports academy, or a professional training institute, this infographic provides a comprehensive overview of the benefits, programs, and facilities offered by an academy sports institution. This template is compatible with Powerpoint, Keynote, and Google Slides making it easy to navigate and can be easily customized to fit your presentation needs.
- Eliminar de favoritos
Plantilla de PowerPoint
1 MB
Plantilla de Google Slides
Enlace externo
Plantilla de Keynote
1 MB
4 diapositivas
Learning Plan Presentation
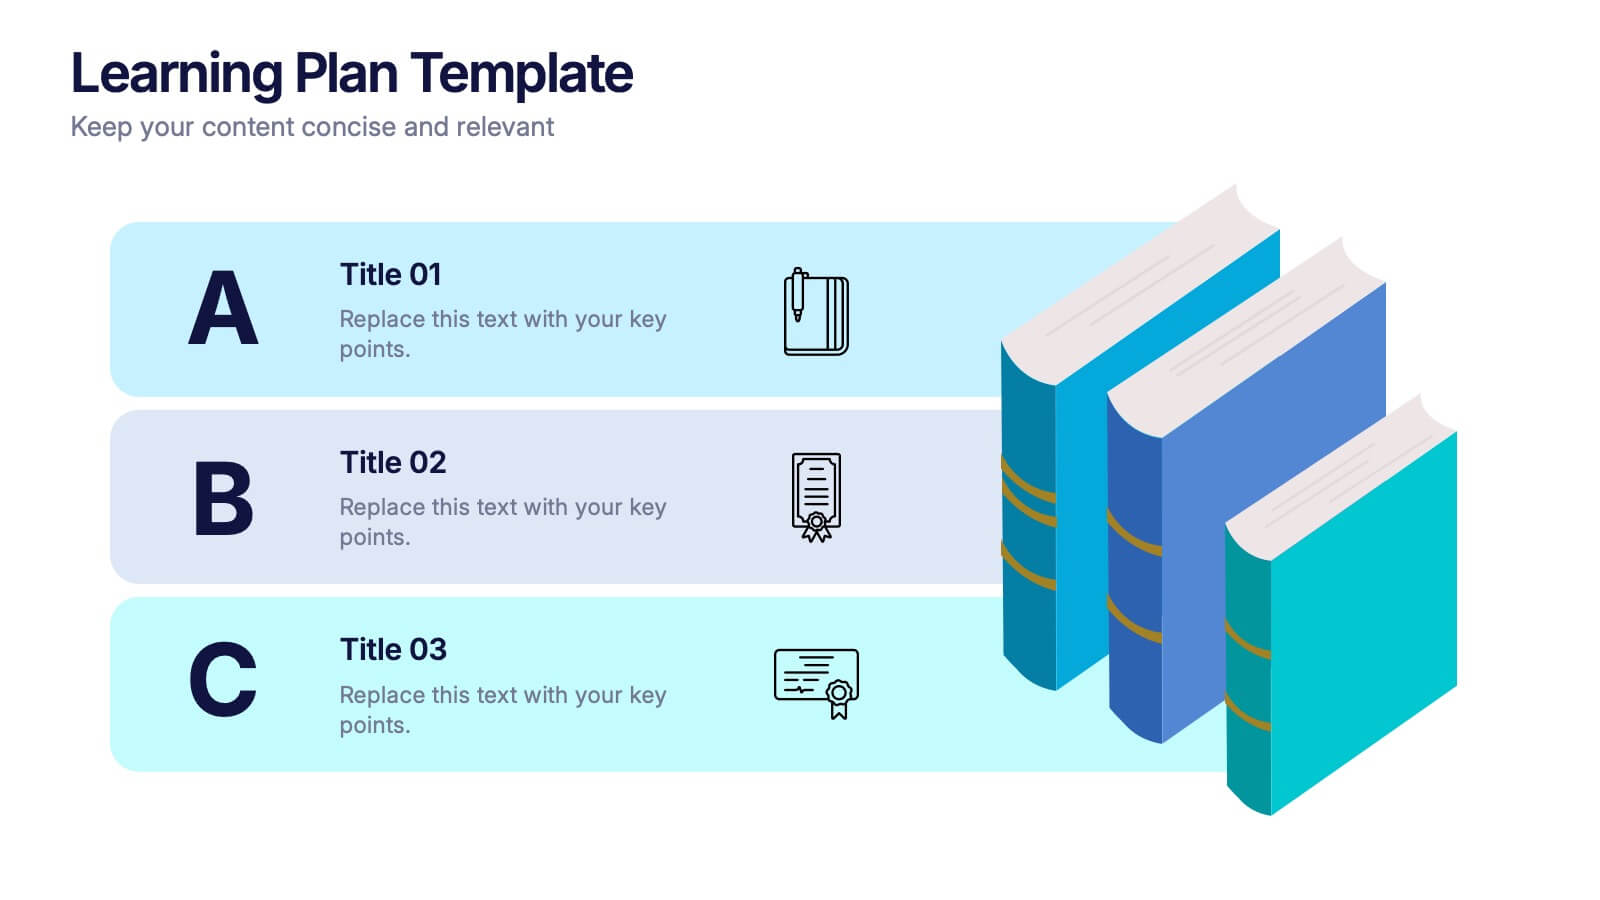
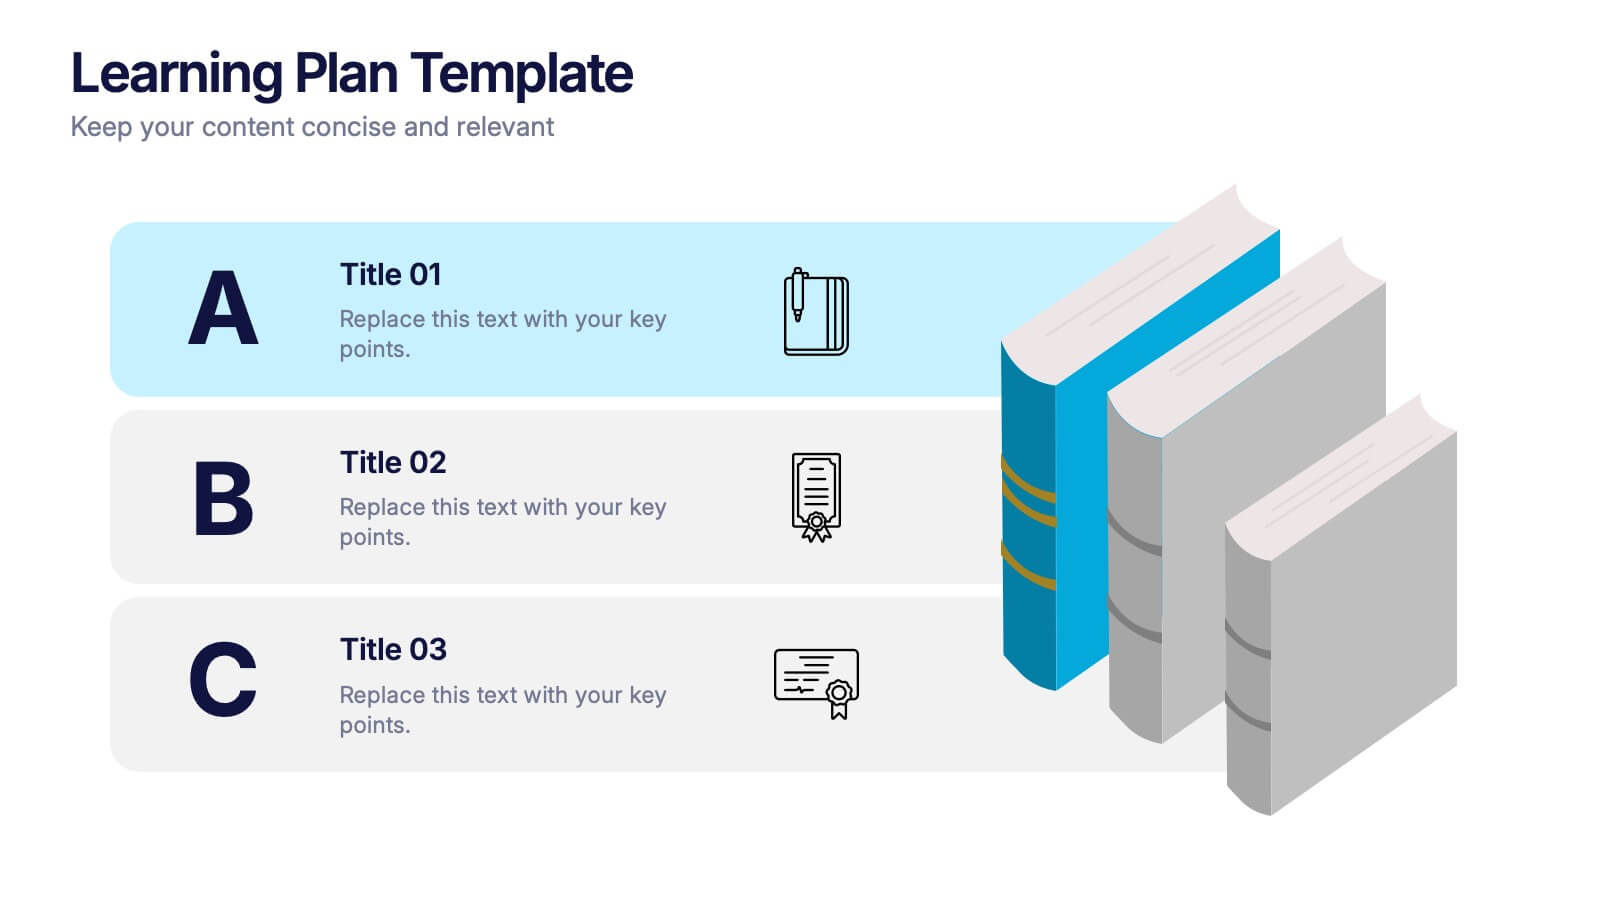
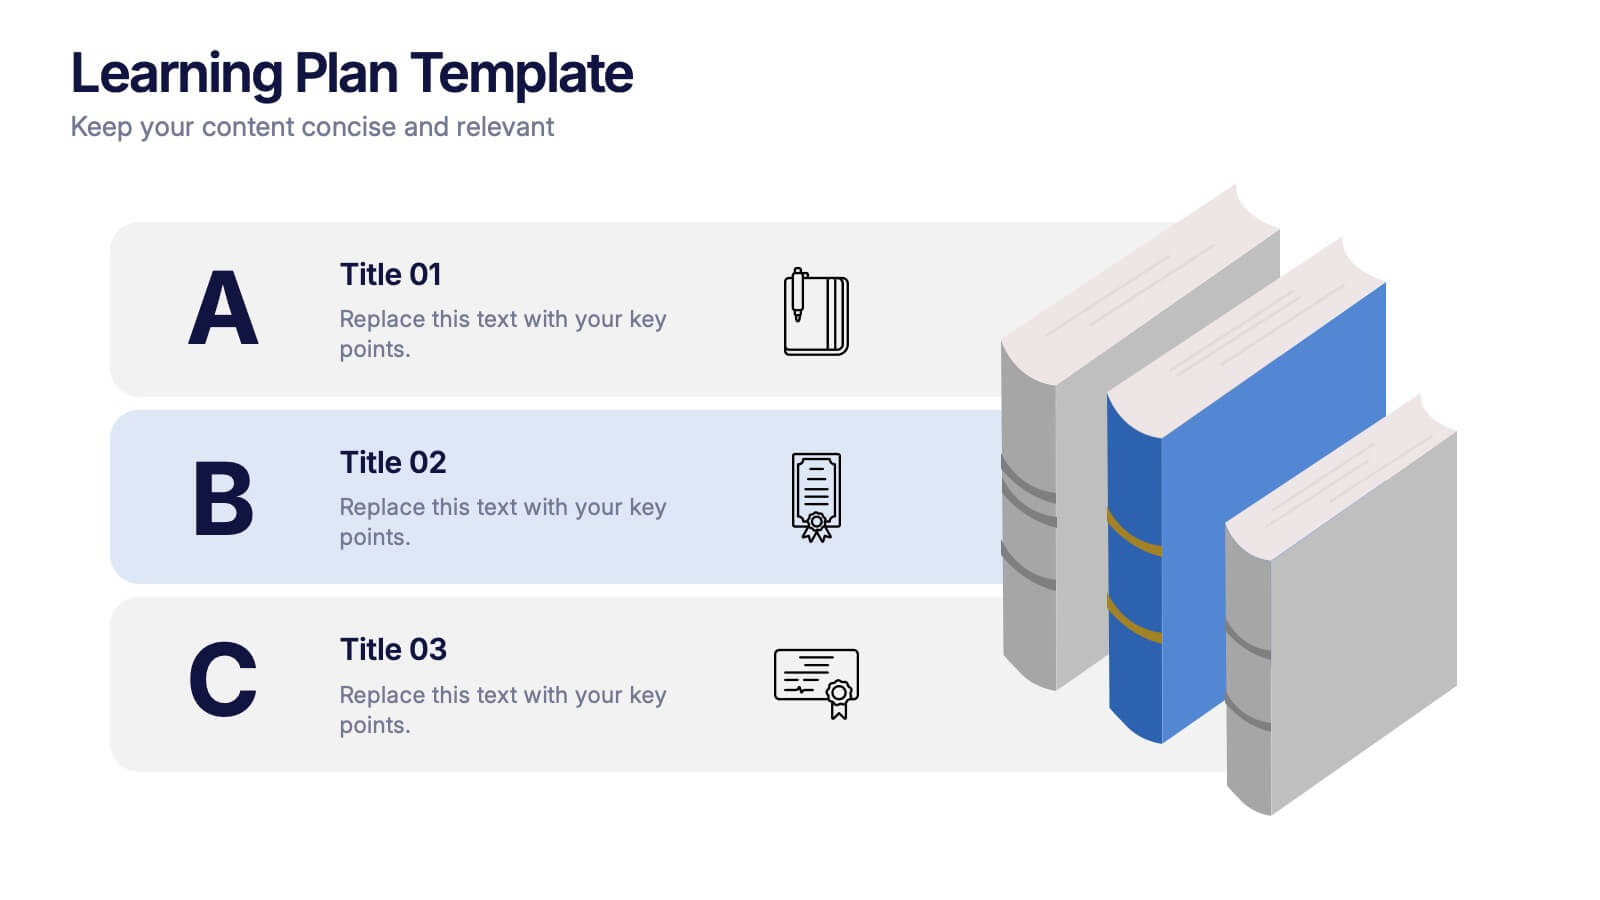
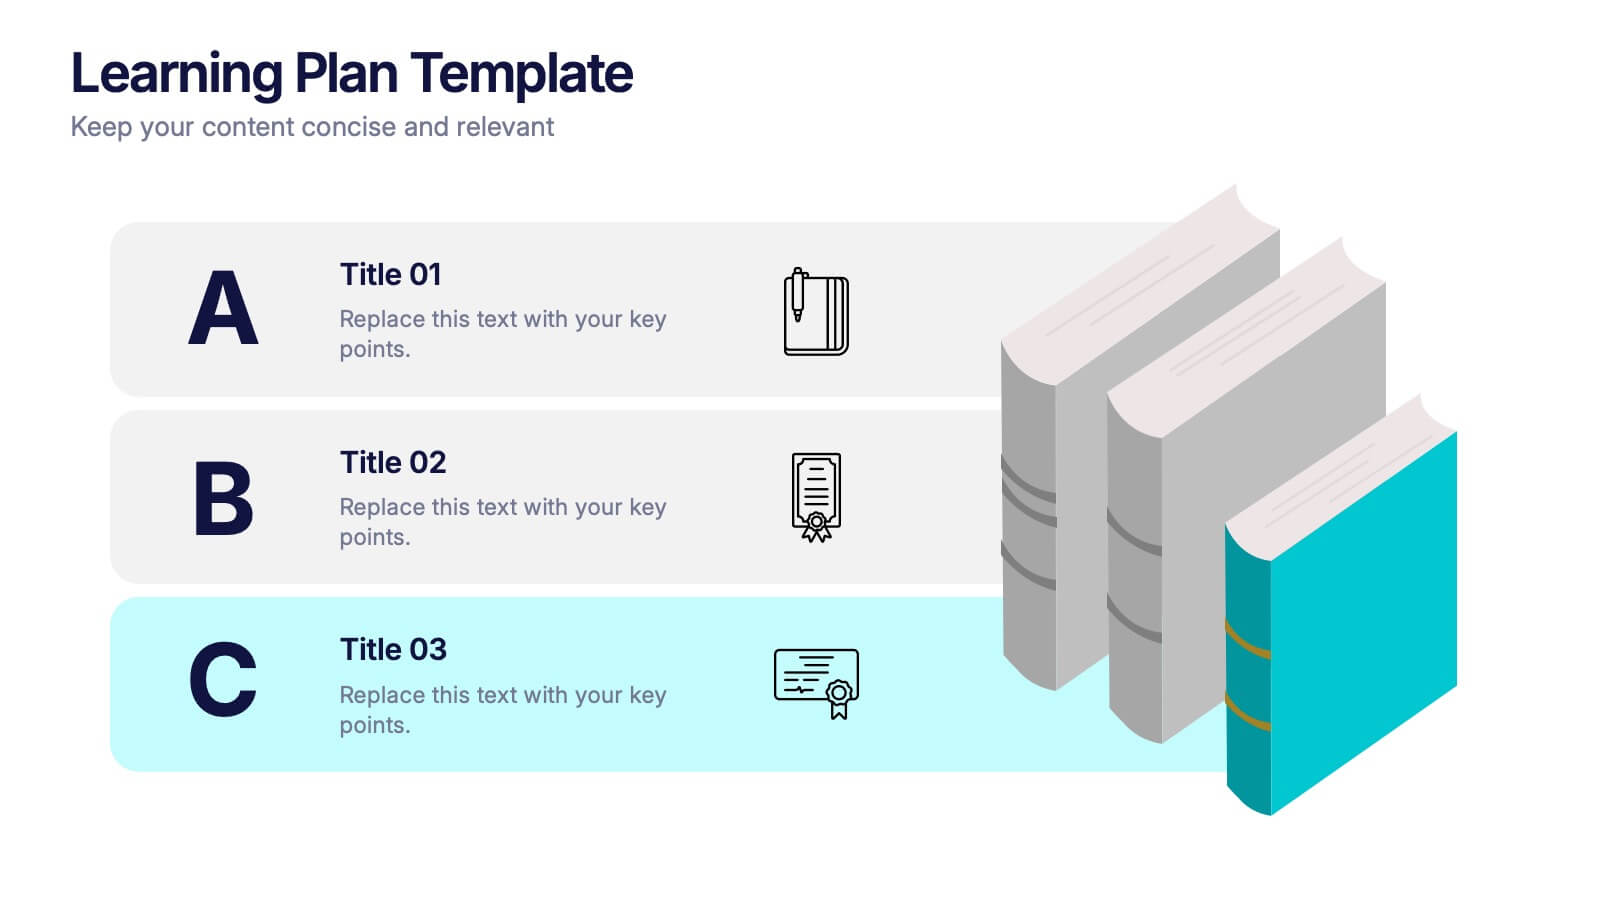
Kick off your lesson planning with a bright, organized layout that makes learning goals feel simple, structured, and easy to follow. This presentation helps outline steps, milestones, and study priorities in a clear visual format that keeps students or teams on track. Fully compatible with PowerPoint, Keynote, and Google Slides.
- Eliminar de favoritos
Plantilla de PowerPoint
1 MB
Plantilla de Google Slides
Enlace externo
Plantilla de Keynote
1 MB
8 diapositivas
Quarterly Sales Report Presentation
Streamline your quarterly sales review with our "Quarterly Sales Report Presentation" template. This infographic is expertly designed to display sales data across various categories, using a series of shopping cart icons that represent different products or services. Each cart is labeled with a title and associated with a percentage, clearly illustrating sales performance metrics. The color-coded elements help distinguish between different data points, making complex information easily digestible. Ideal for sales managers and teams, this template aids in analyzing trends, identifying growth opportunities, and planning future sales strategies. Compatible with PowerPoint, Keynote, and Google Slides, it's a vital tool for effective sales presentations.
- Eliminar de favoritos
Plantilla de PowerPoint
1 MB
Plantilla de Google Slides
Enlace externo
Plantilla de Keynote
1 MB
5 diapositivas
Business SWOT Infographics
Dive deep into organizational analysis with our business SWOT infographics. Crafted in engaging shades of blue and pink, this collection is an essential tool for businesses aiming to uncover their strengths, weaknesses, and threats. This template, brimming with creative graphics and icons, is specifically designed for business strategists, educational instructors, and company executives who are keen to present SWOT analysis with clarity. Compatible with Powerpoint, keynote, and Google Slides. Its vertical, creative styling makes complex information digestible, fostering understanding and strategic thinking in your business planning sessions.


