


Características


¿Tienes alguna pregunta?
Recomendar


20 diapositivas
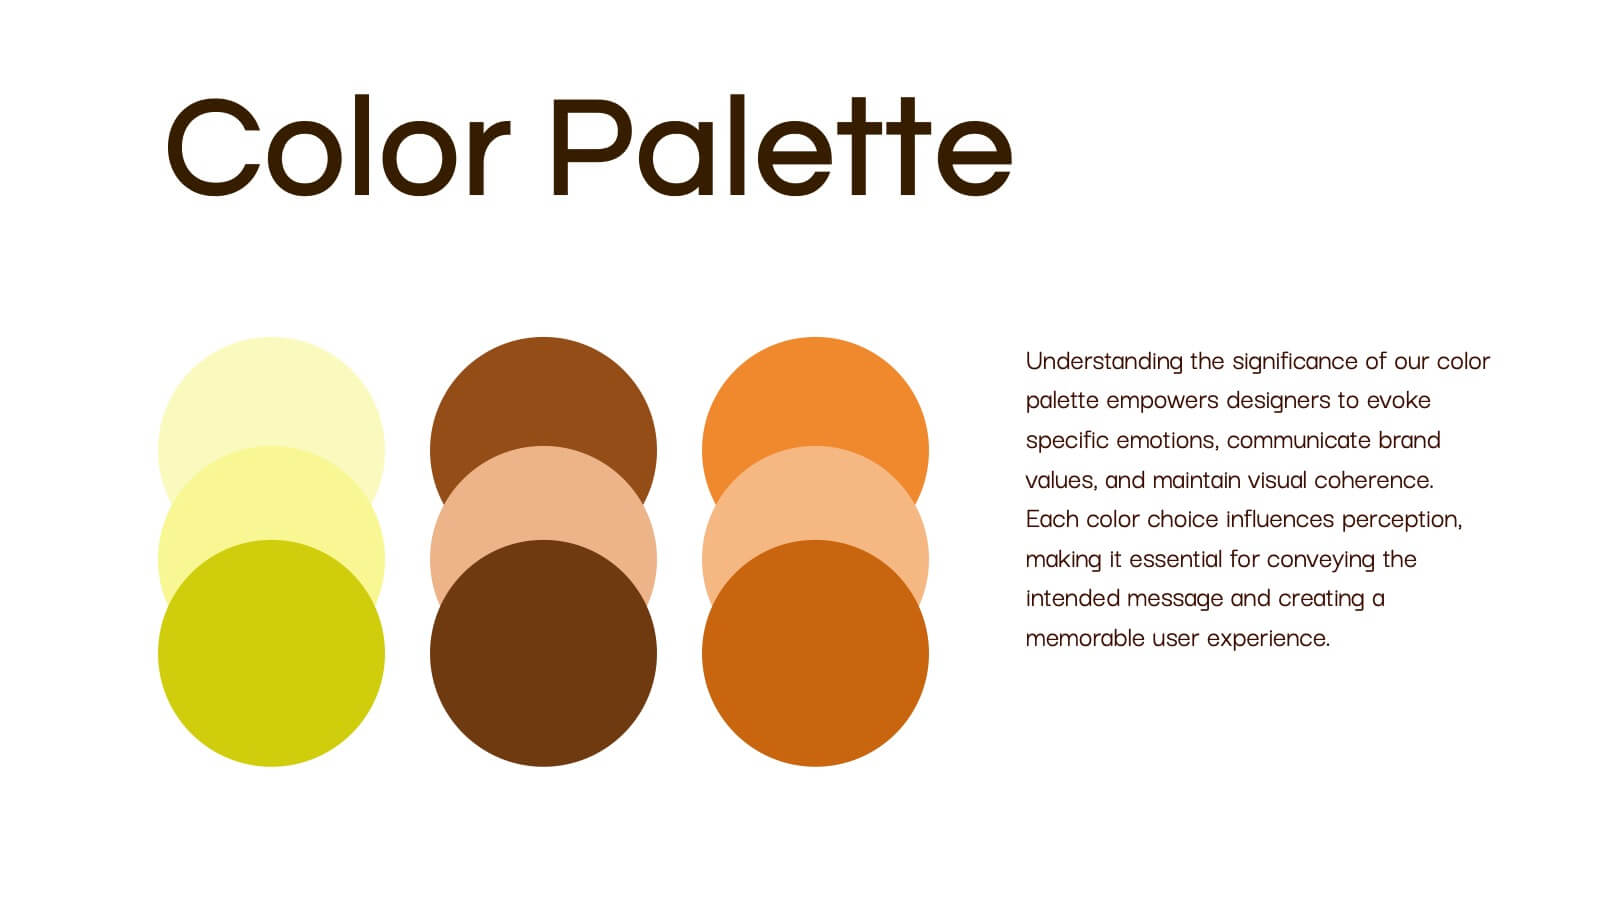
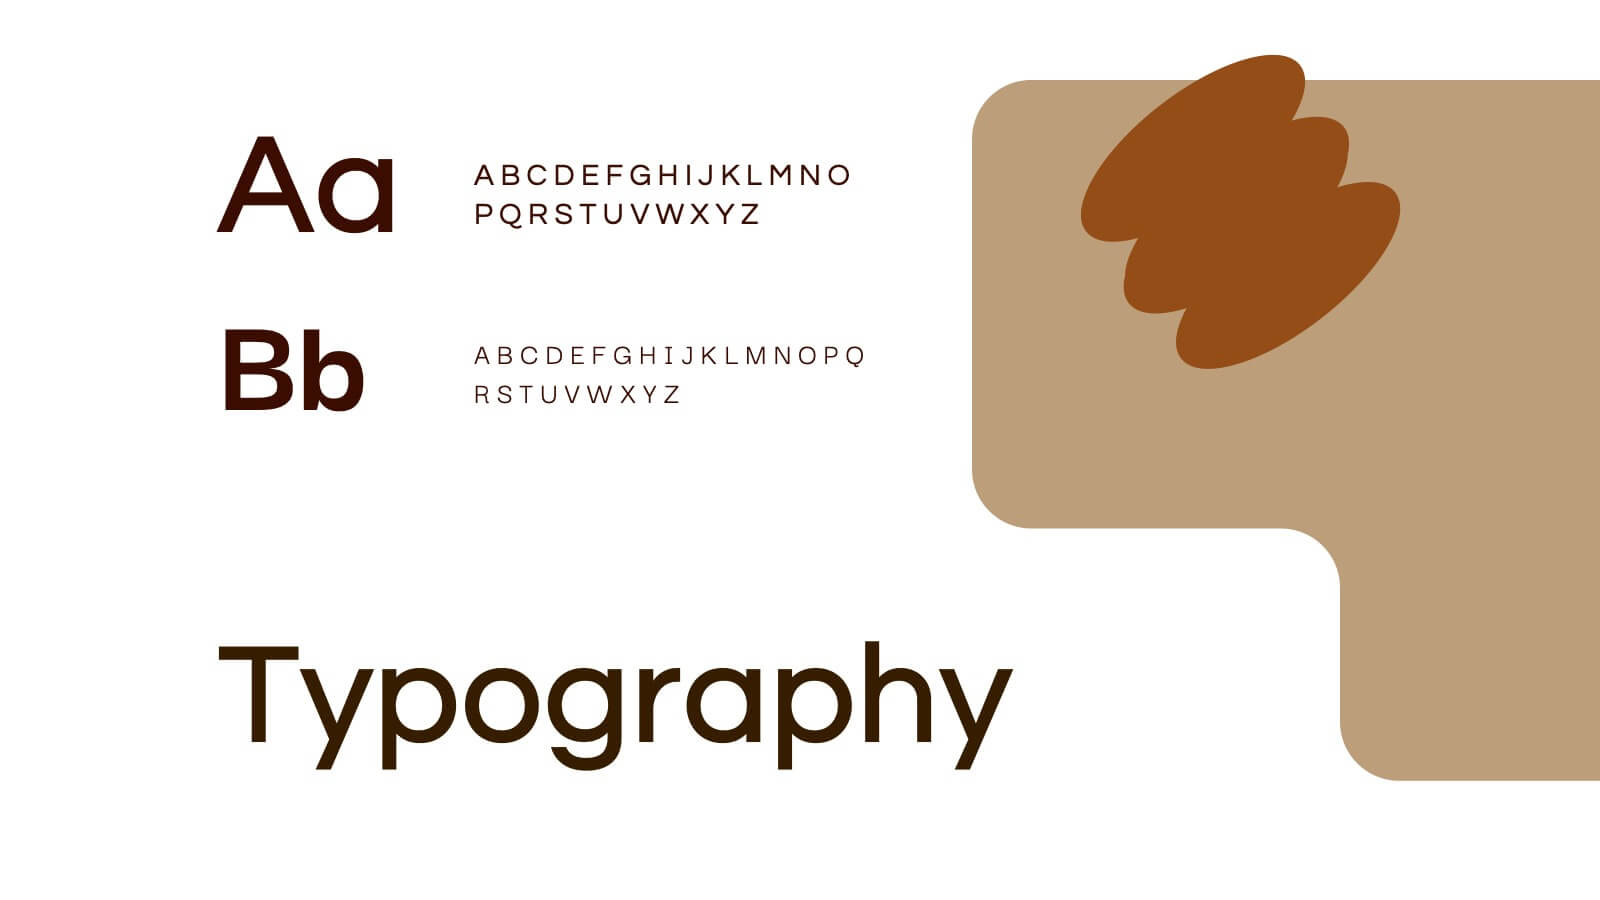
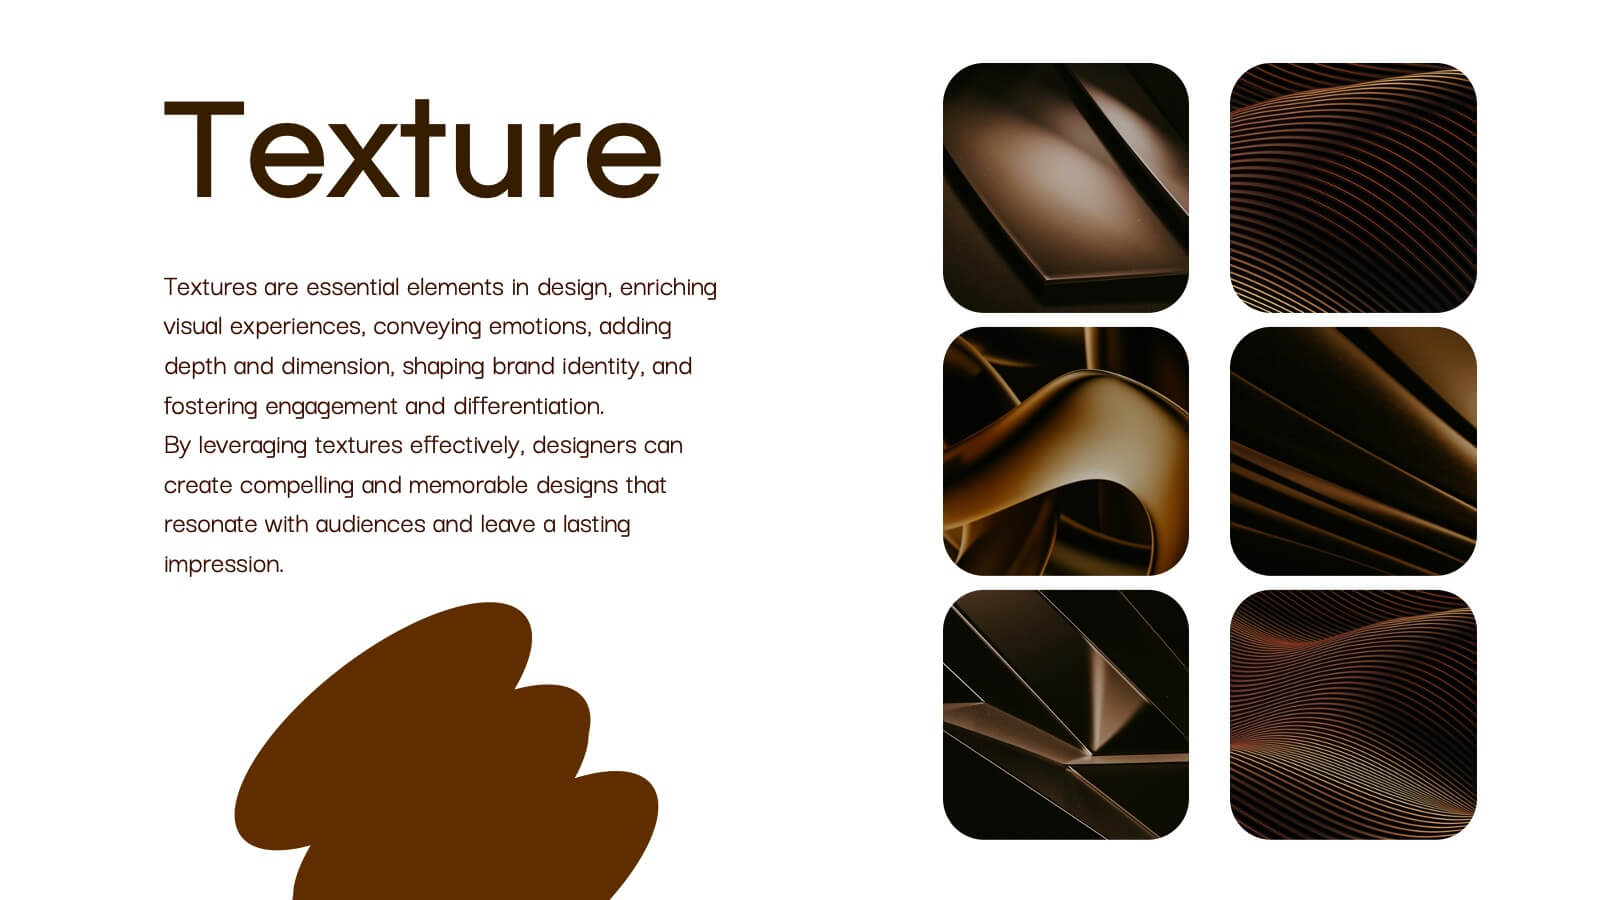
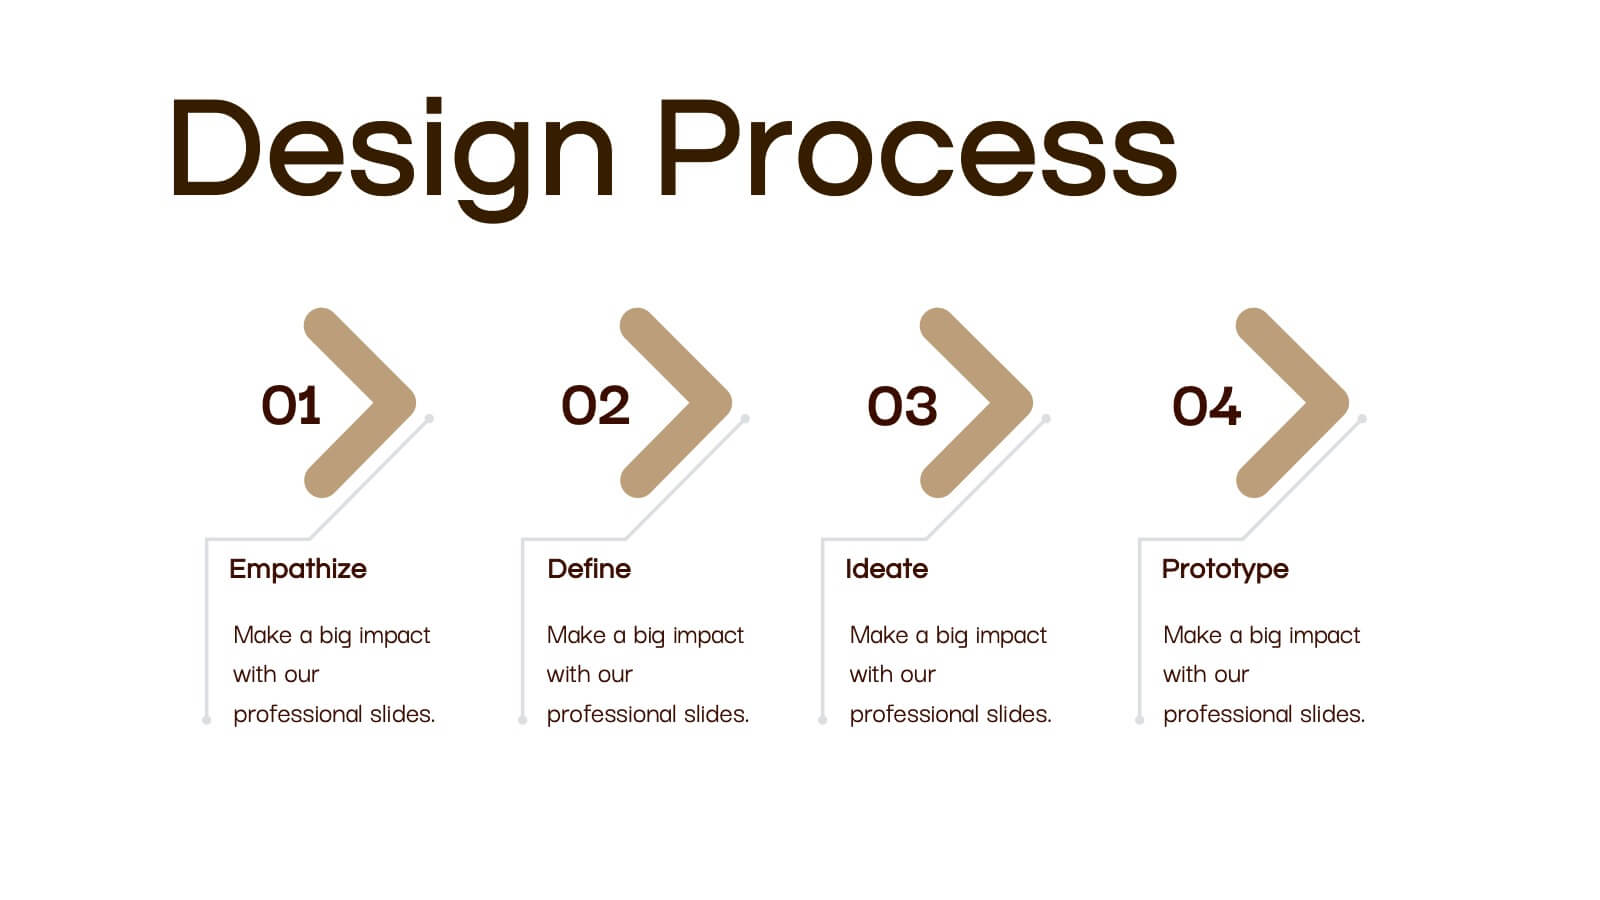
Obsidian Creative Design Report Presentation
Bring your creative vision to life with this stunning design presentation template! Perfect for showcasing your design process, from concept development and mood boards to typography and final assets. Ideal for creative professionals, this template offers clarity and style at every step. Compatible with PowerPoint, Keynote, and Google Slides, it’s your ultimate tool for design presentations.


6 diapositivas
Clarifying Questions and Response Slide Presentation
Help your audience follow complex topics with the Clarifying Questions and Response Slide Presentation. Designed around a bold question mark layout, this slide format highlights five key clarifications or FAQs alongside thoughtful responses. Ideal for training, onboarding, or product demos, it enhances understanding and engagement. Fully editable in Canva, PowerPoint, Keynote, and Google Slides.


8 diapositivas
End-to-End Supply Chain Optimization
Enhance your supply chain efficiency with this dynamic circular diagram slide. Ideal for logistics experts, supply chain strategists, and consultants, this template visually captures the continuous flow of an 8-step supply chain cycle. Each step is customizable with editable icons and text in PowerPoint, Keynote, and Google Slides.


22 diapositivas
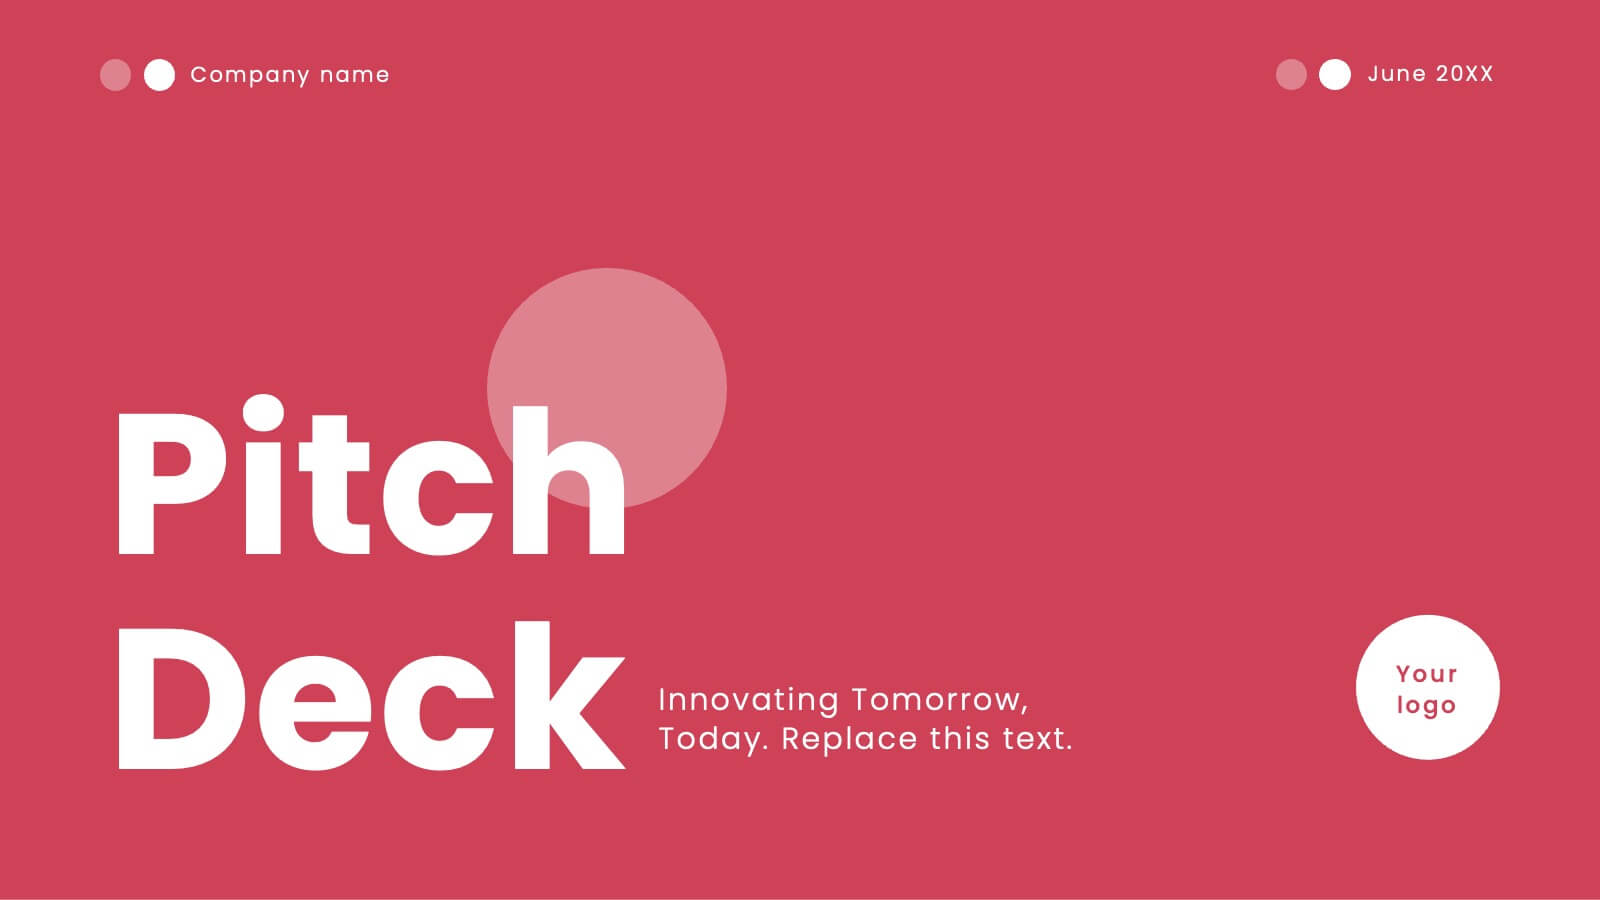
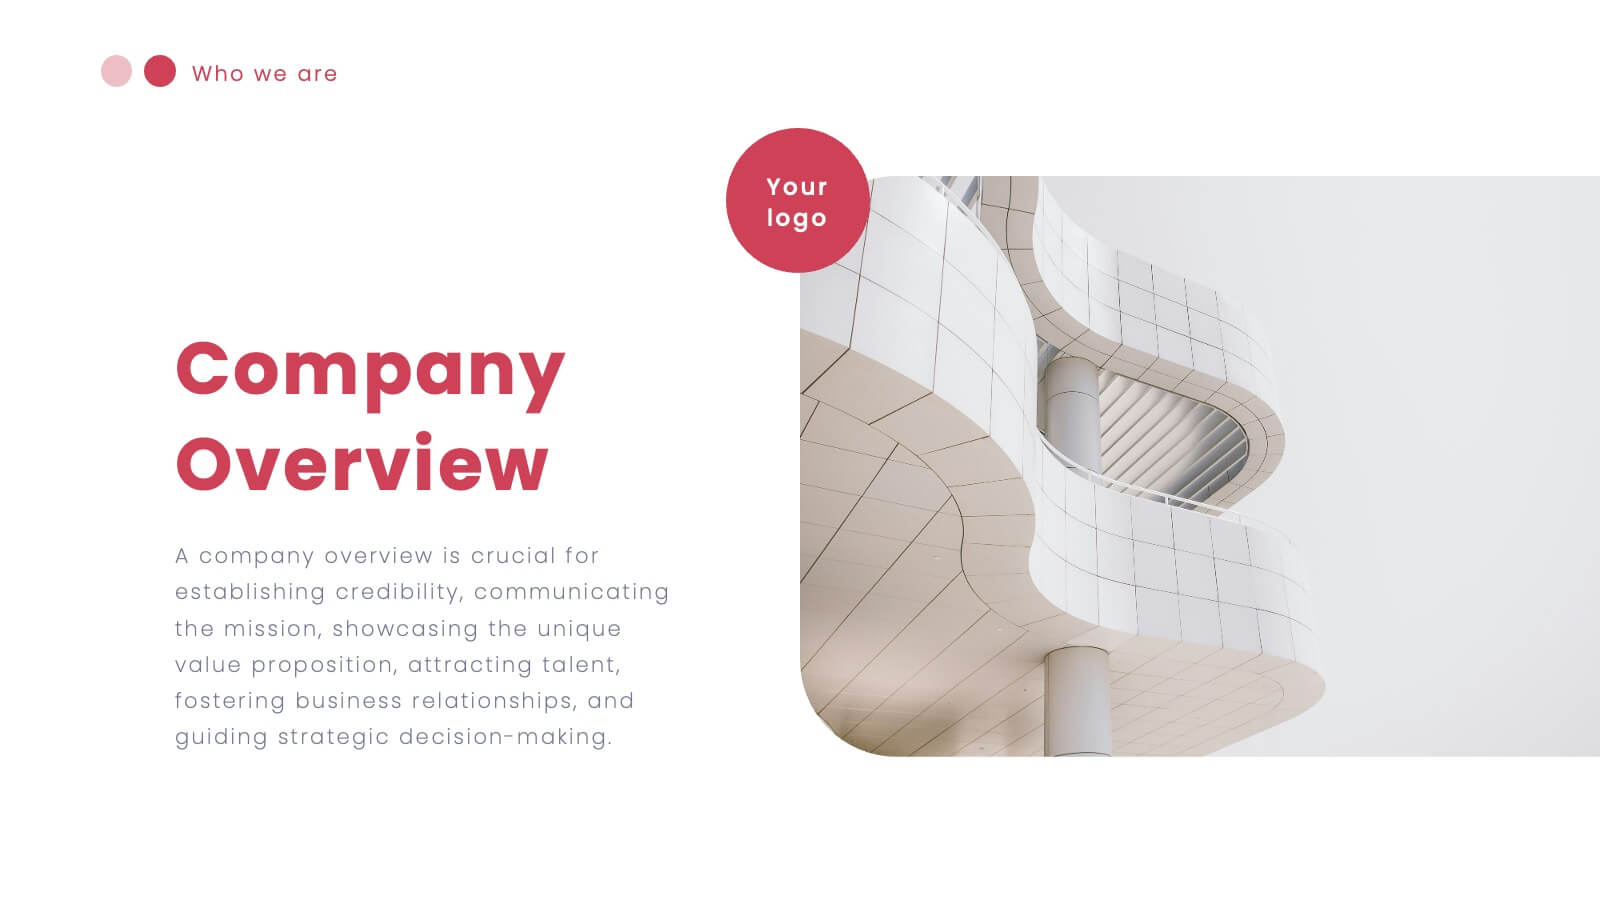
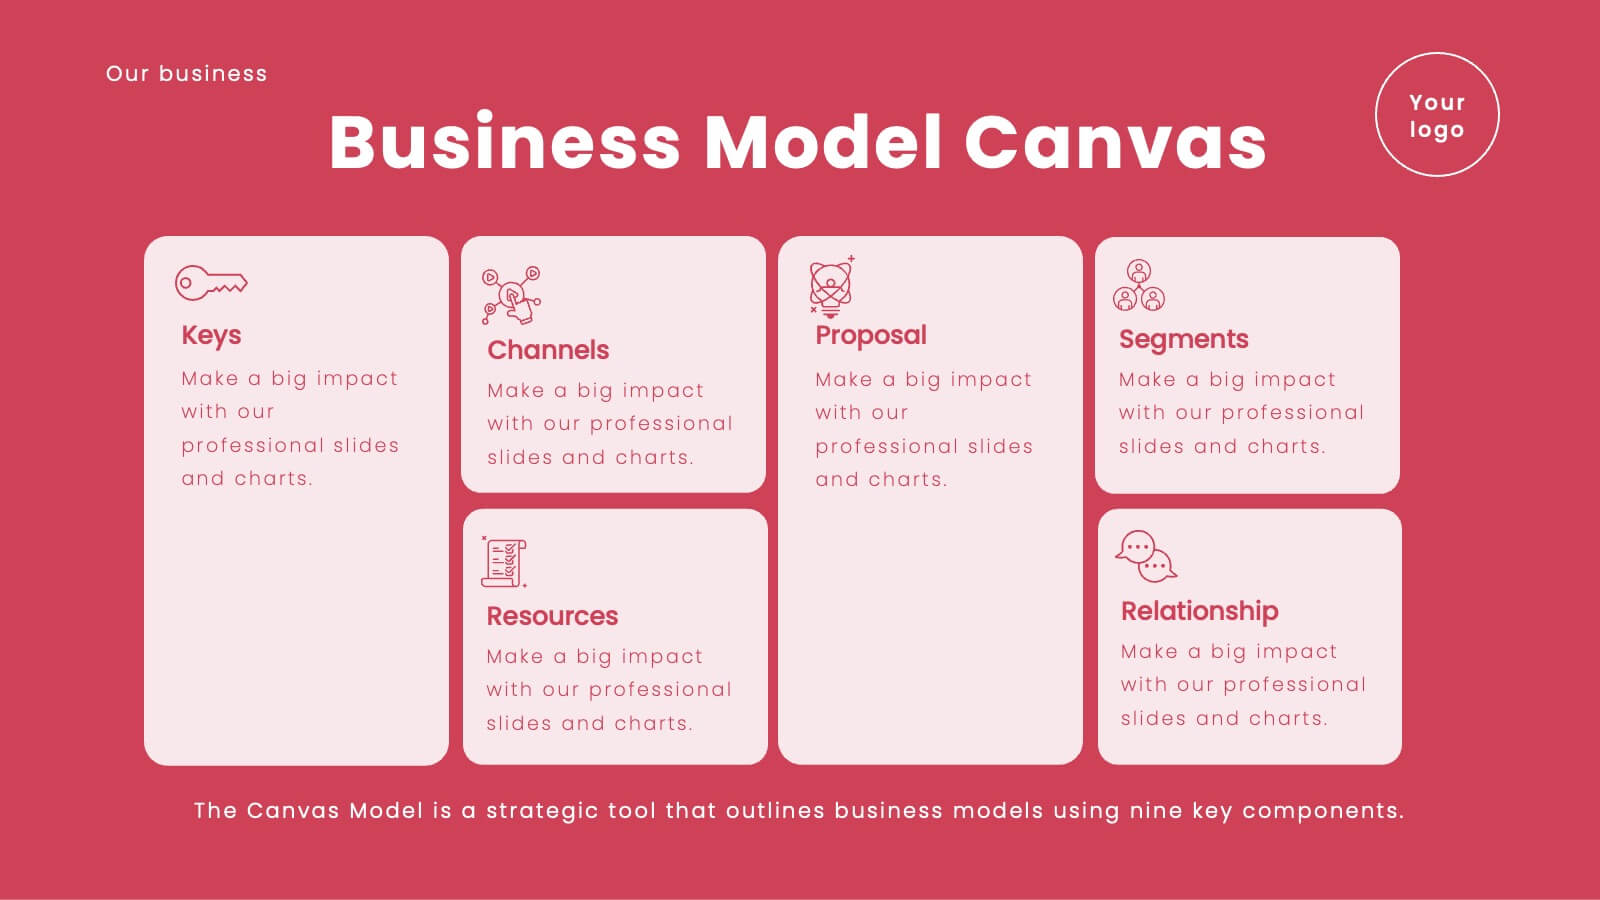
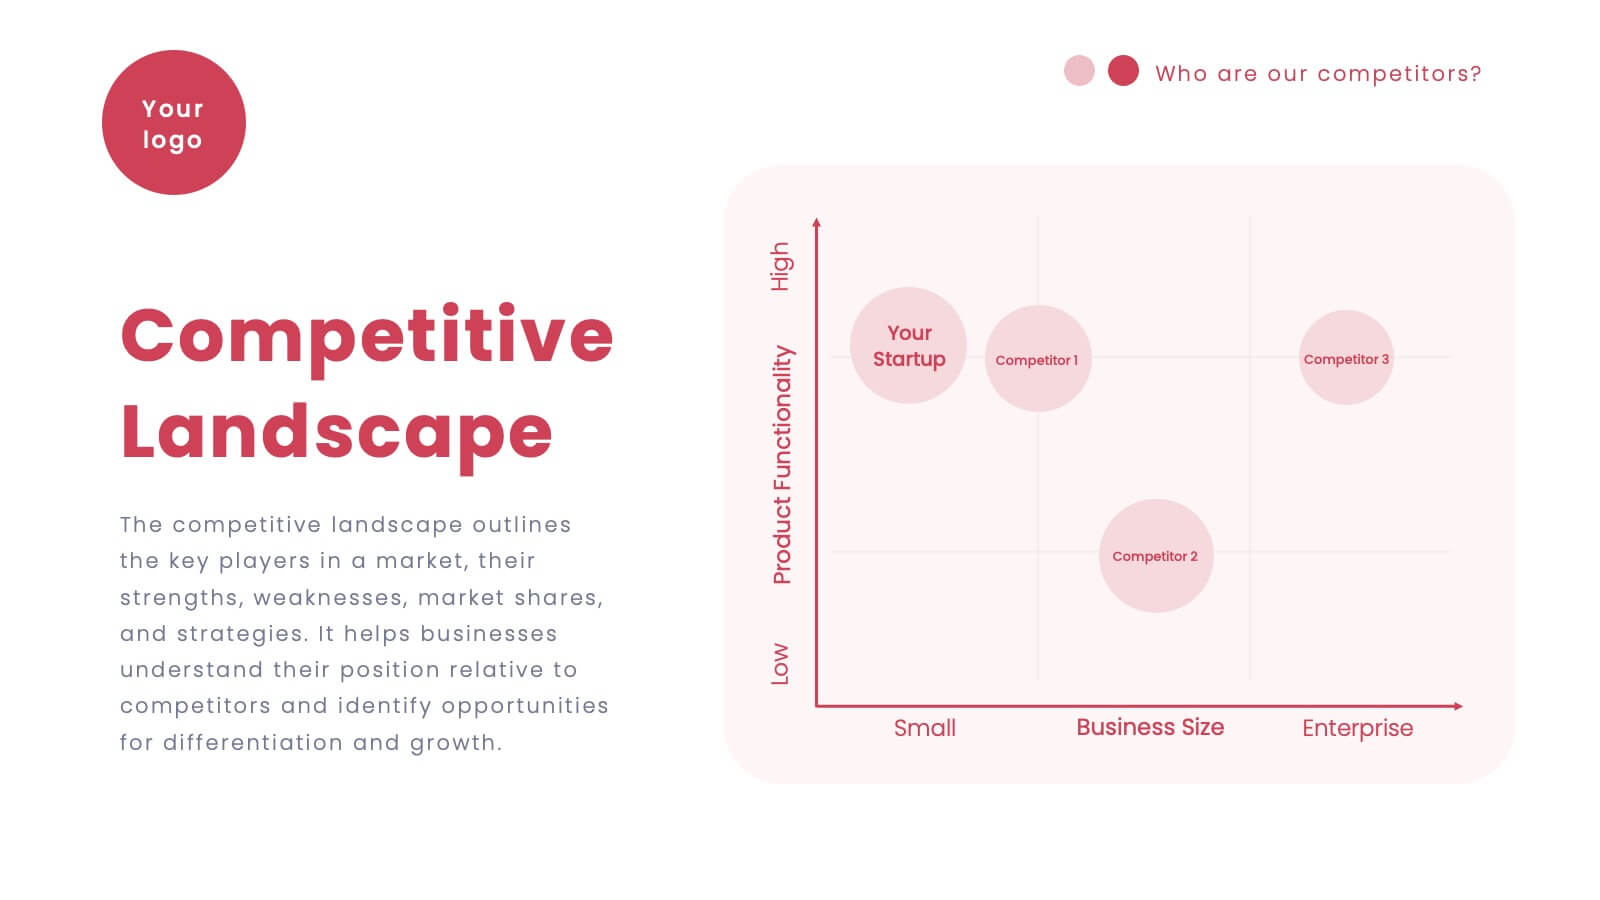
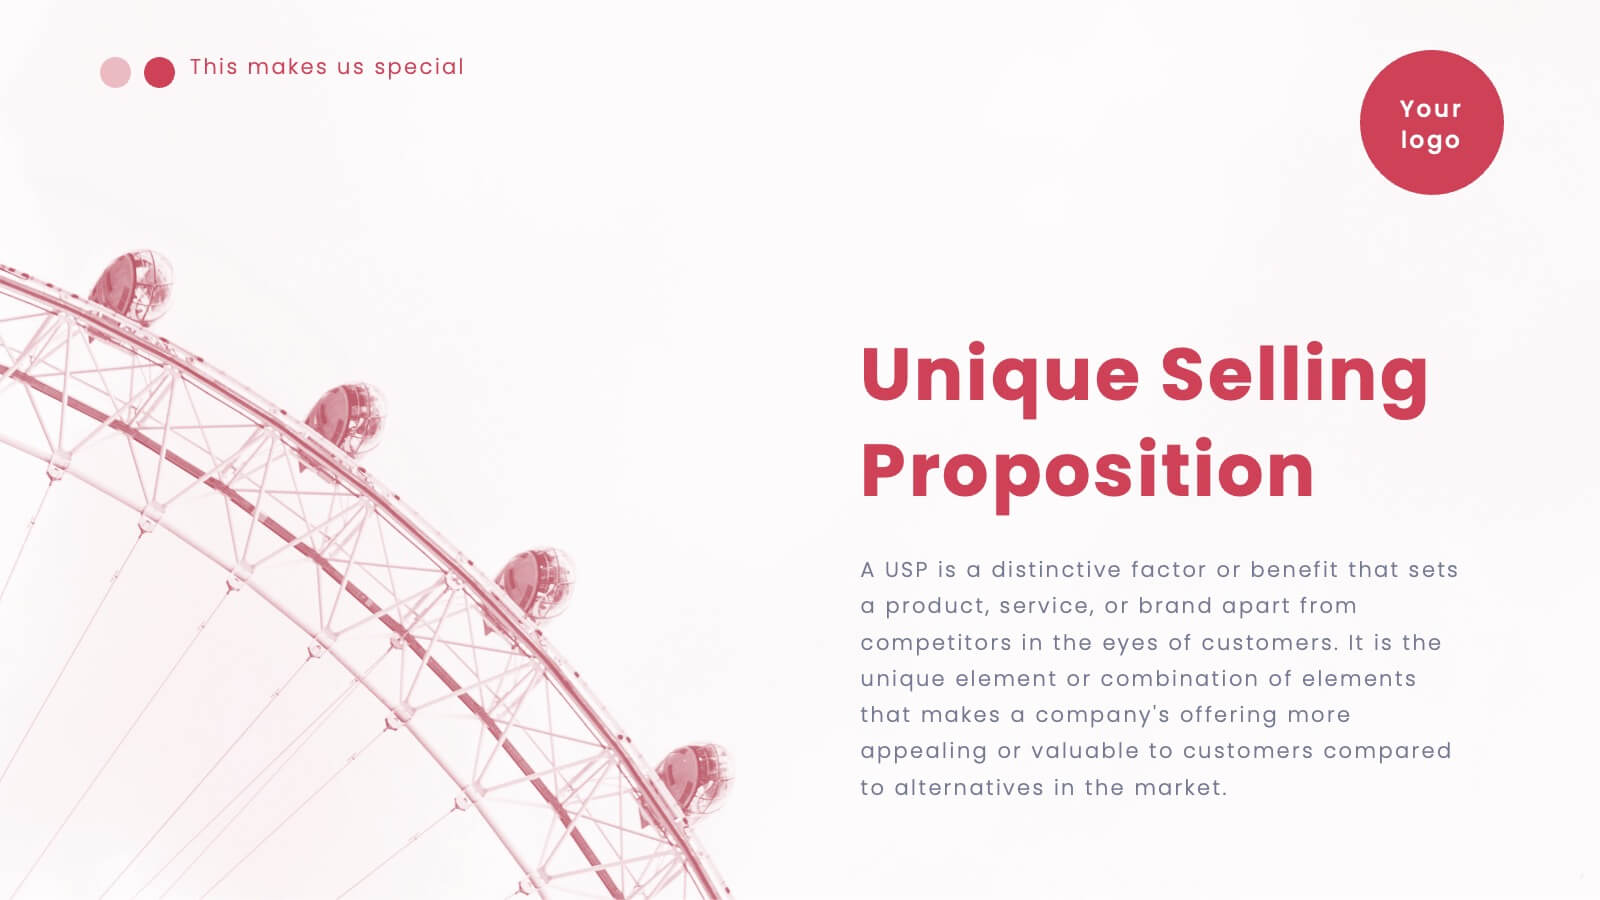
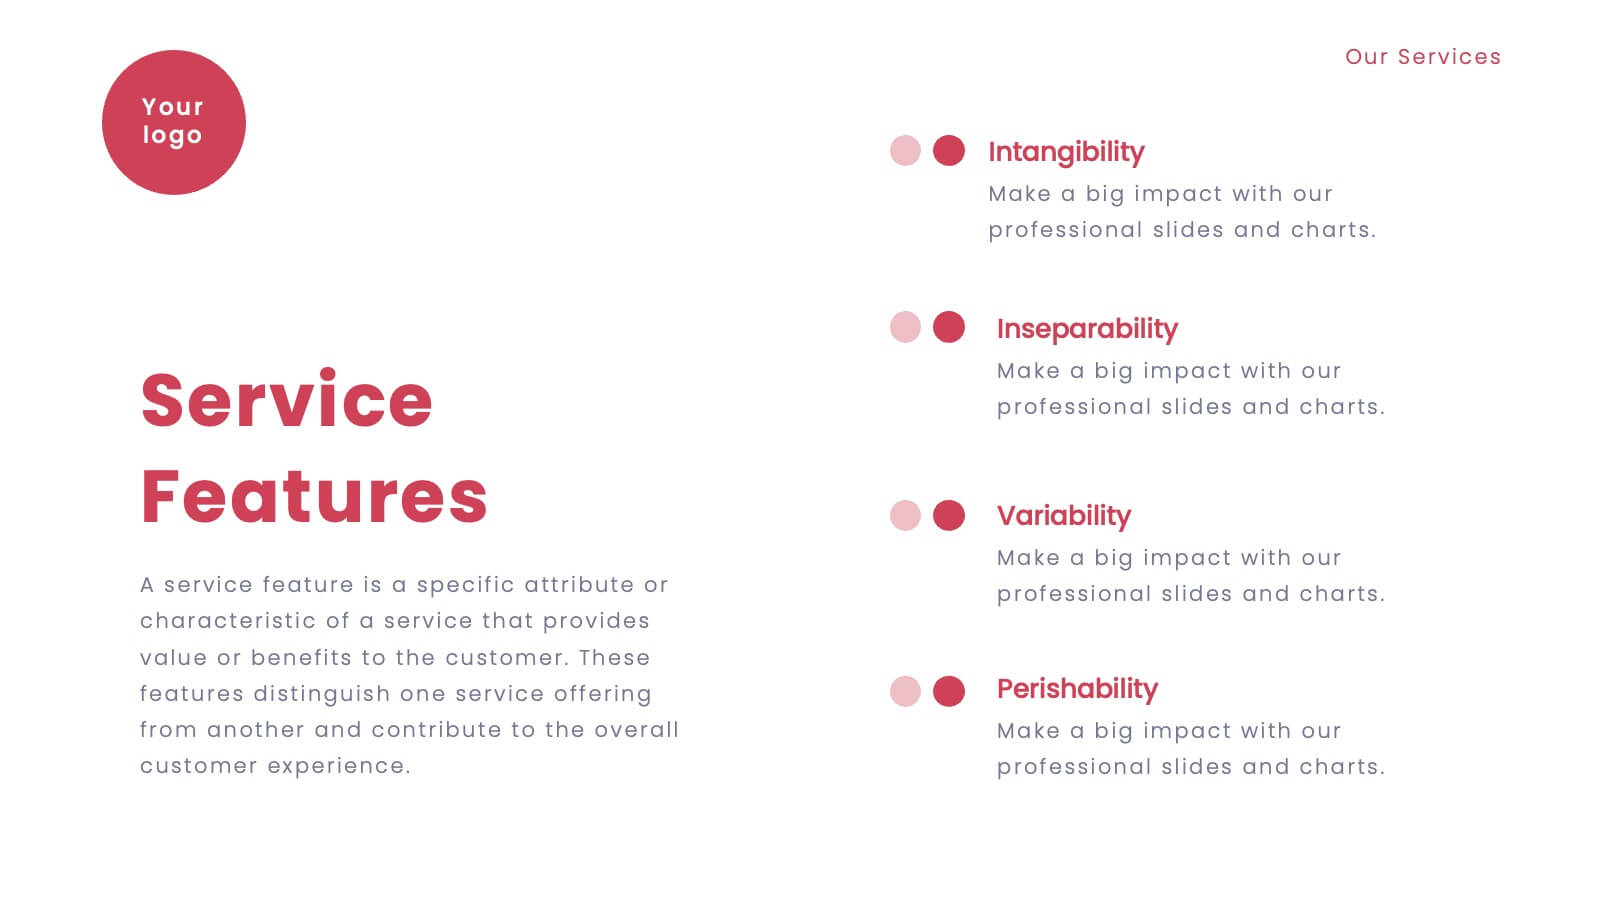
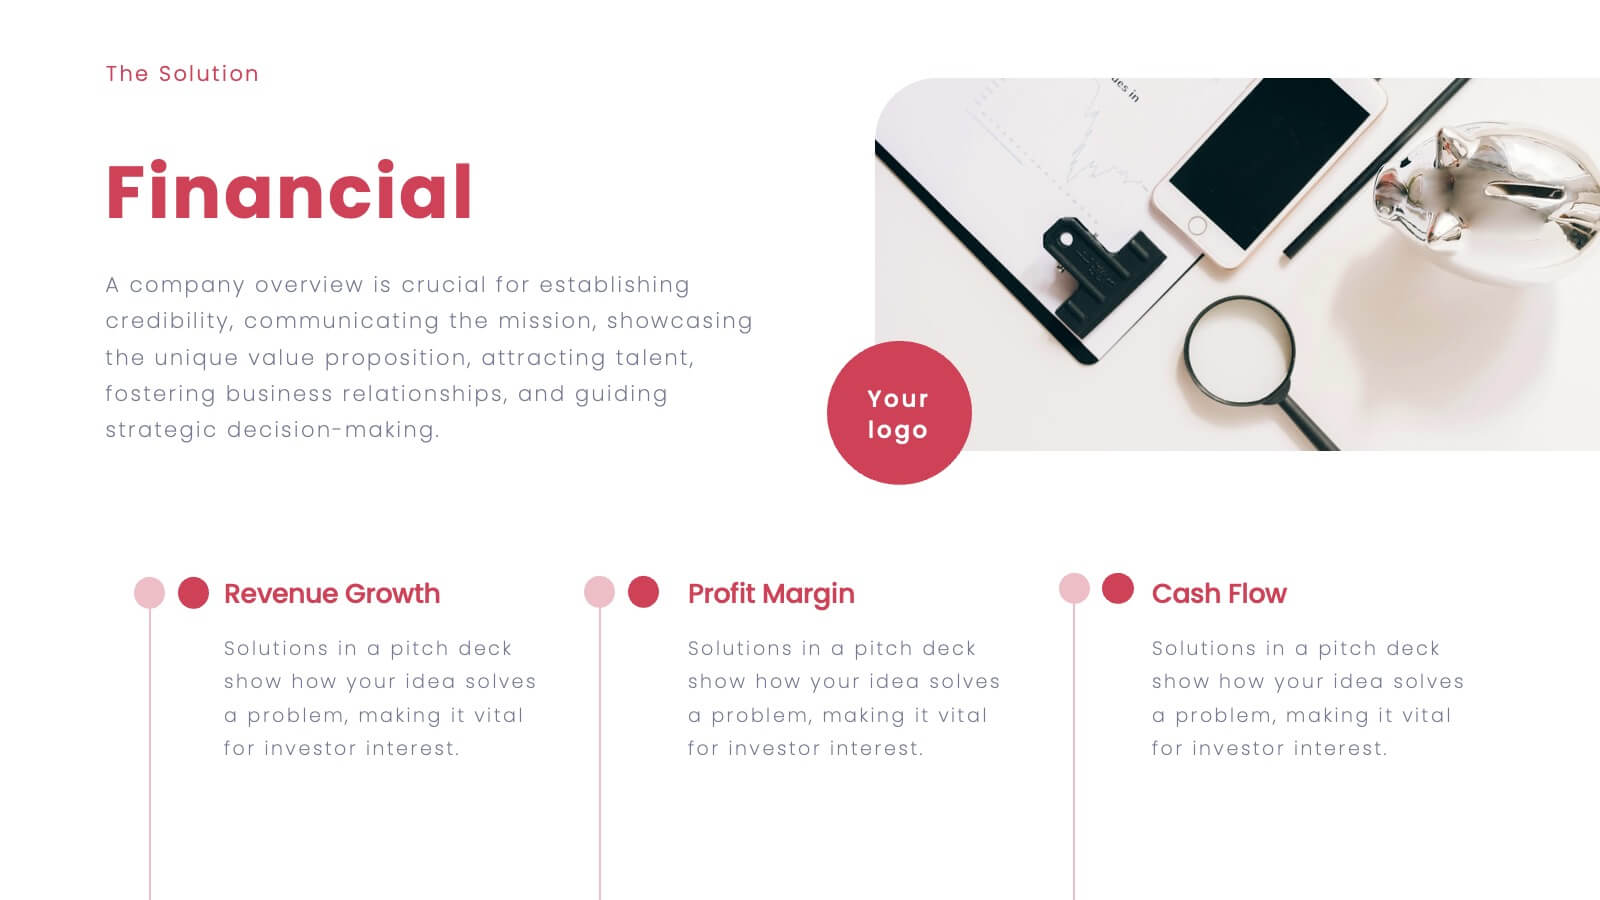
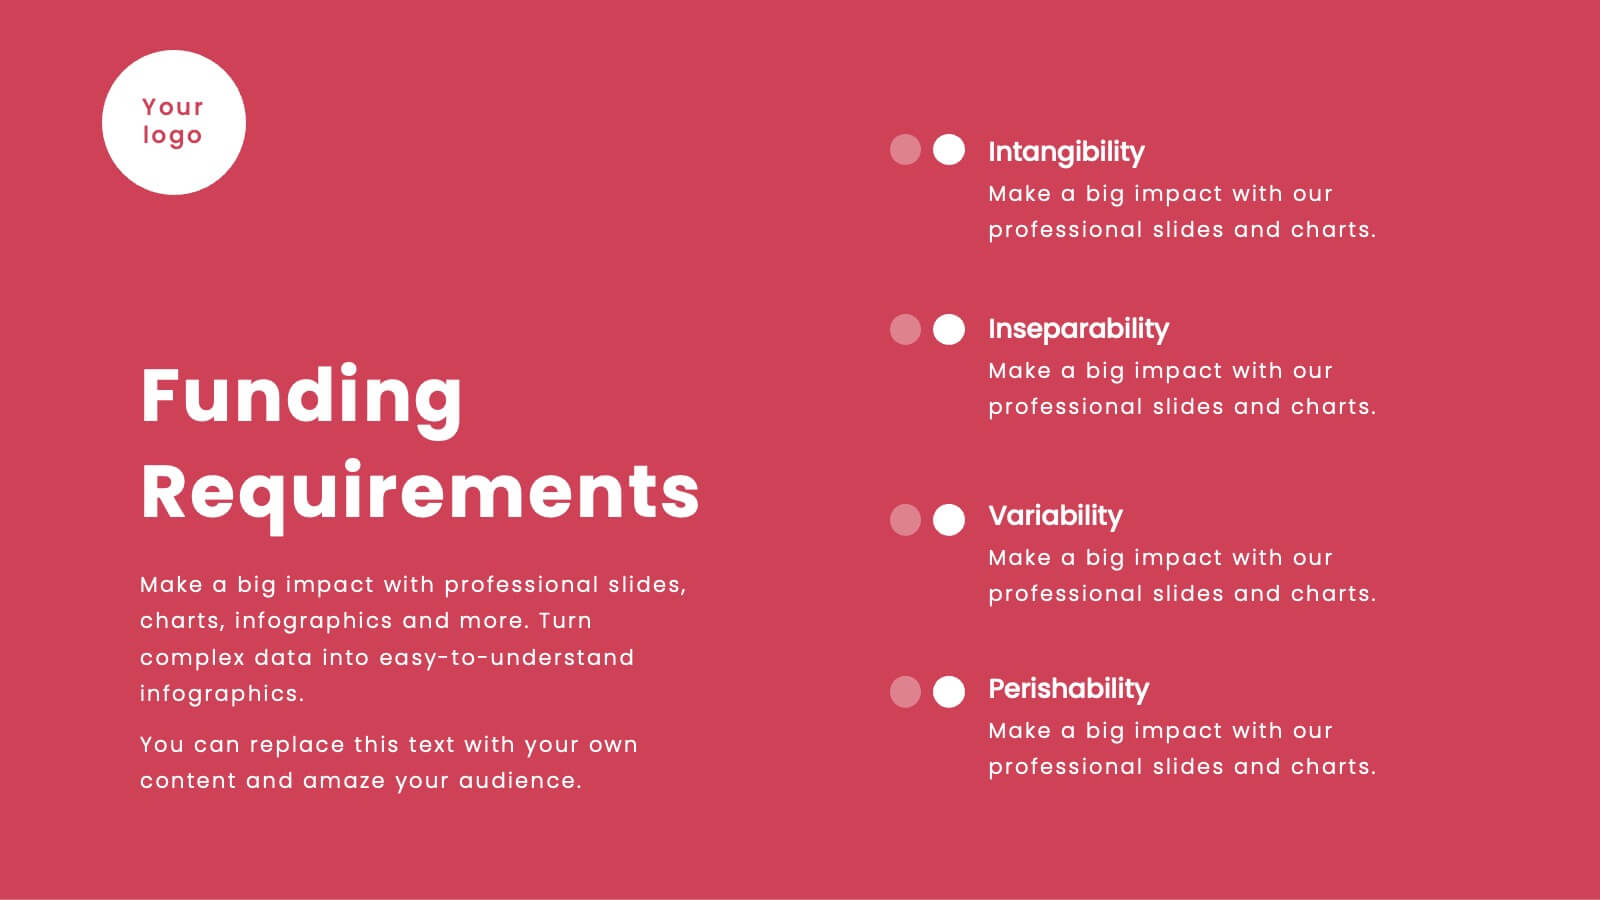
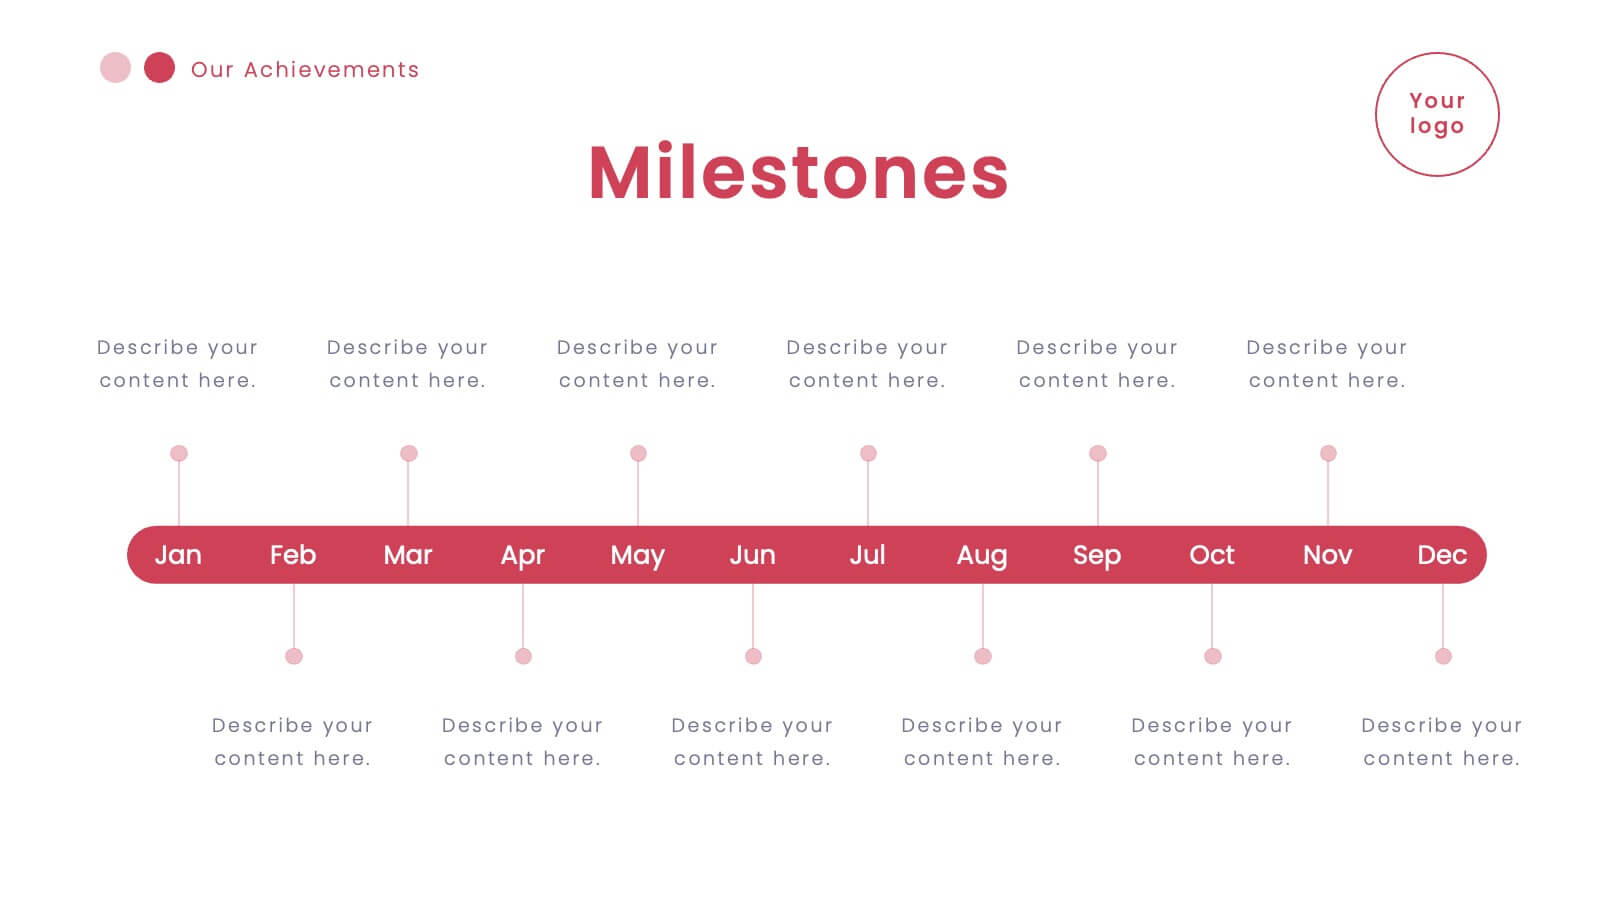
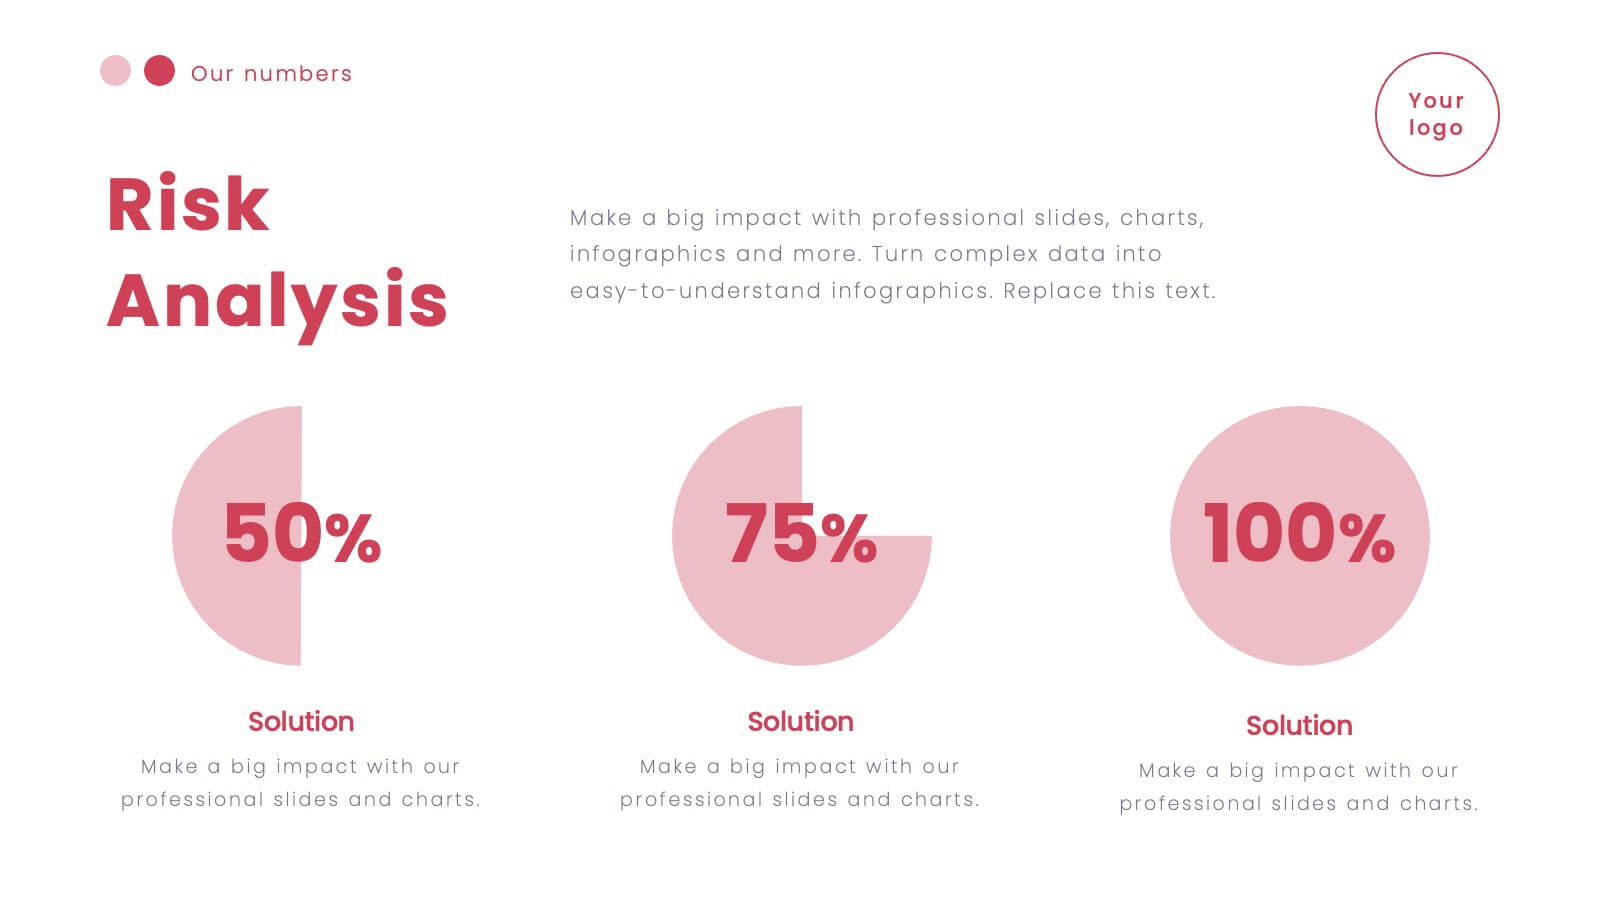
Vortex Startup Pitch Deck Presentation
Launch your ideas into action with this vibrant red pitch deck template, designed to captivate and inform potential investors. It covers everything from company overview to financials and market strategy, ensuring your vision is communicated effectively. Compatible with PowerPoint, Google Slides, and Keynote, this template is perfect for startups seeking to impress and engage.


21 diapositivas
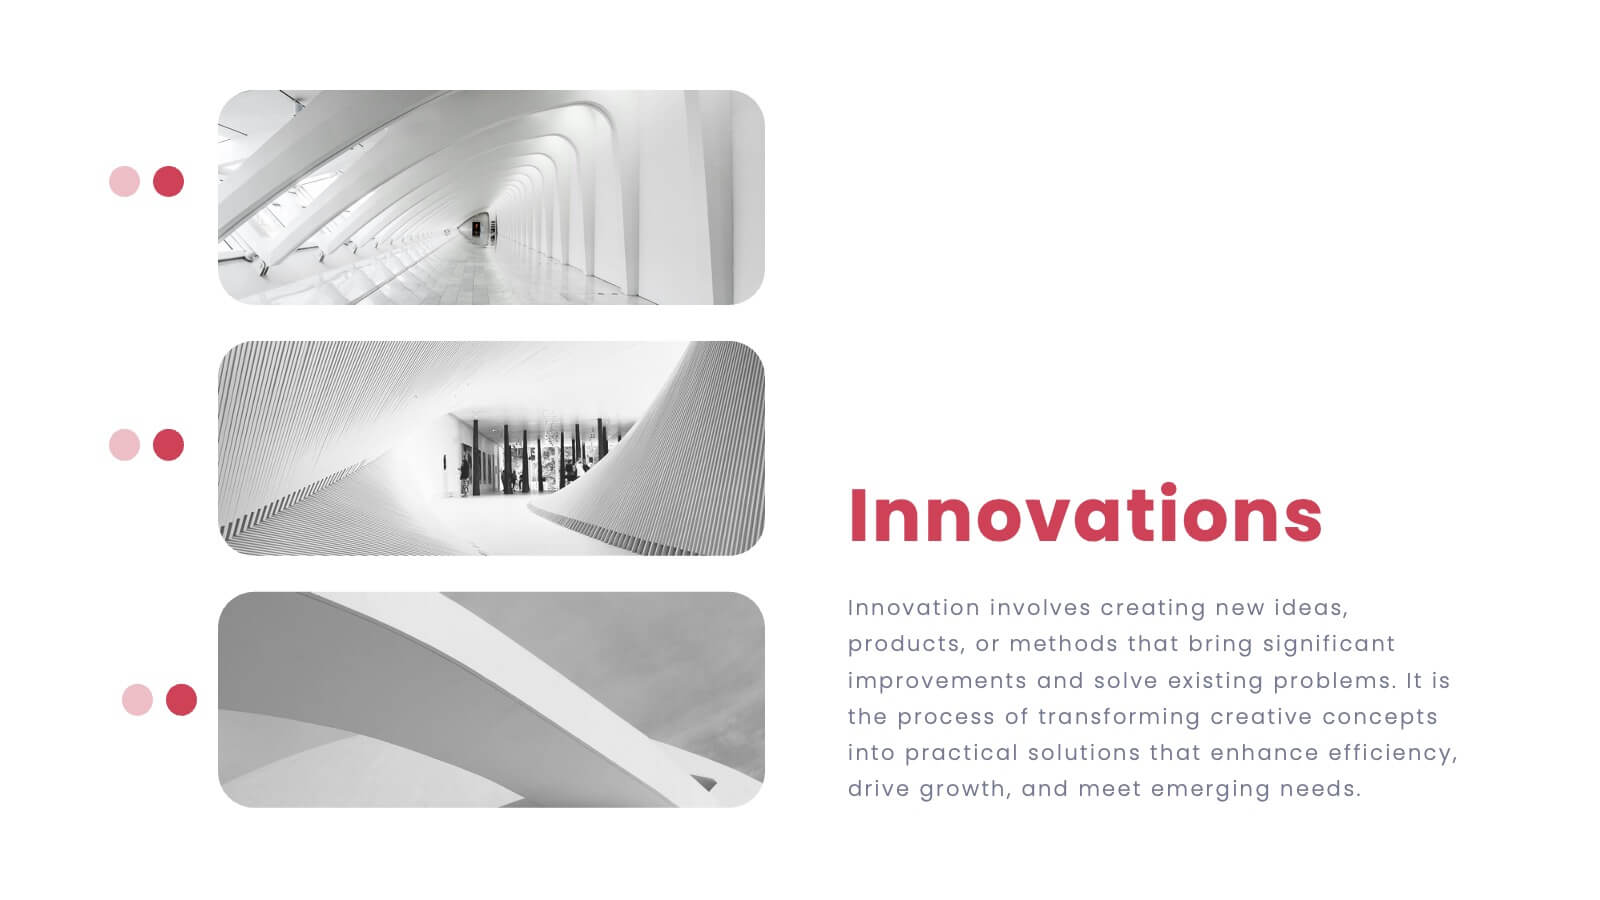
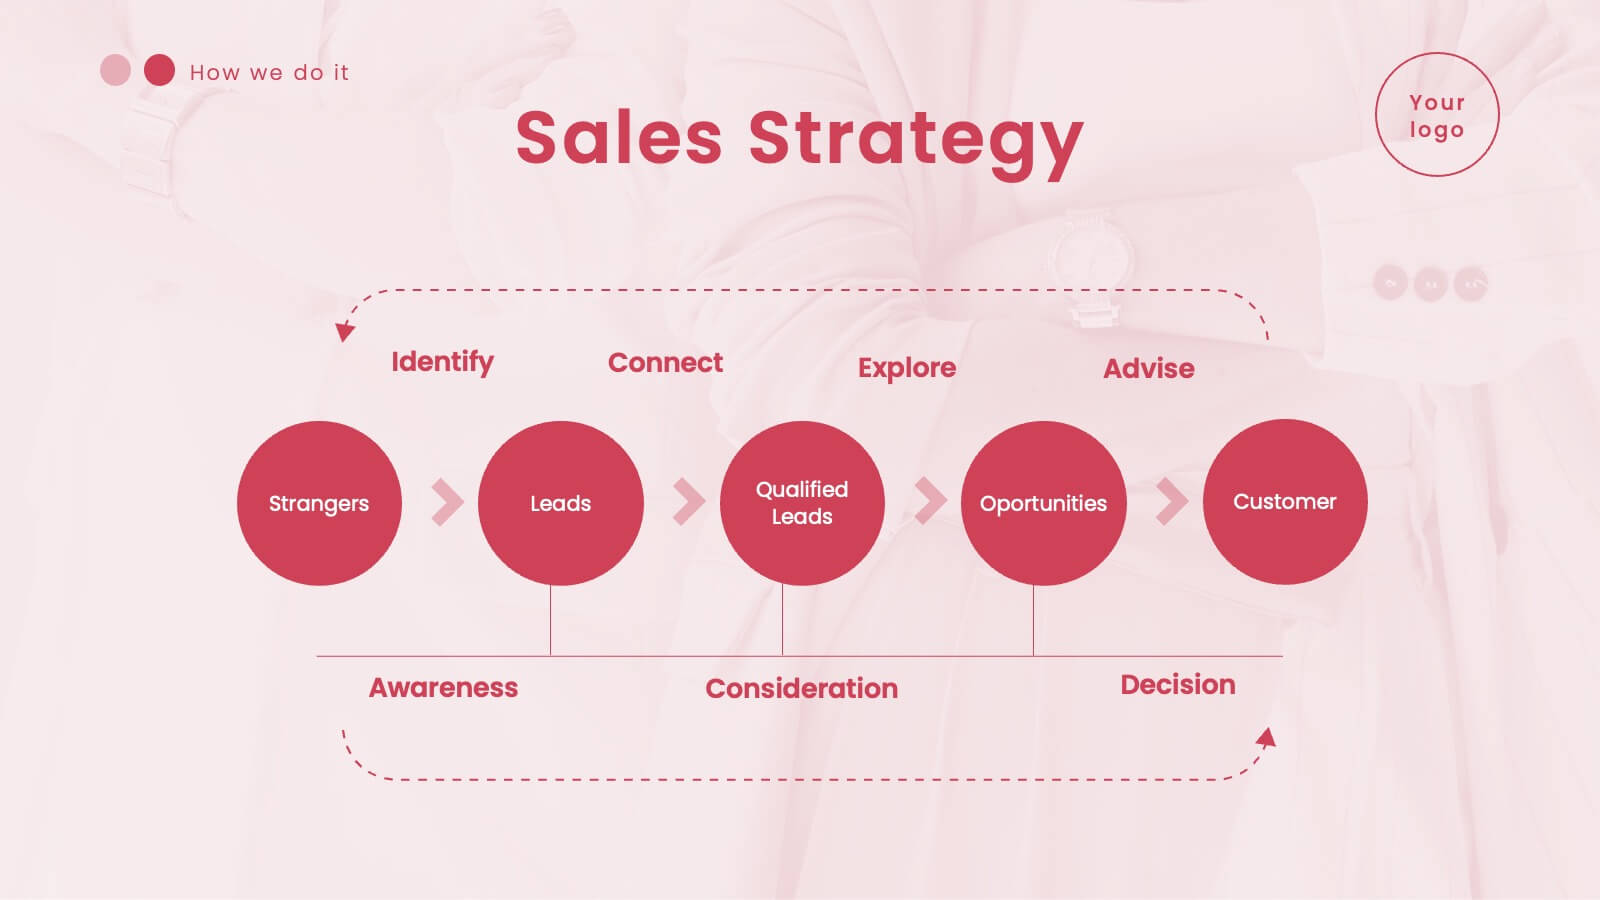
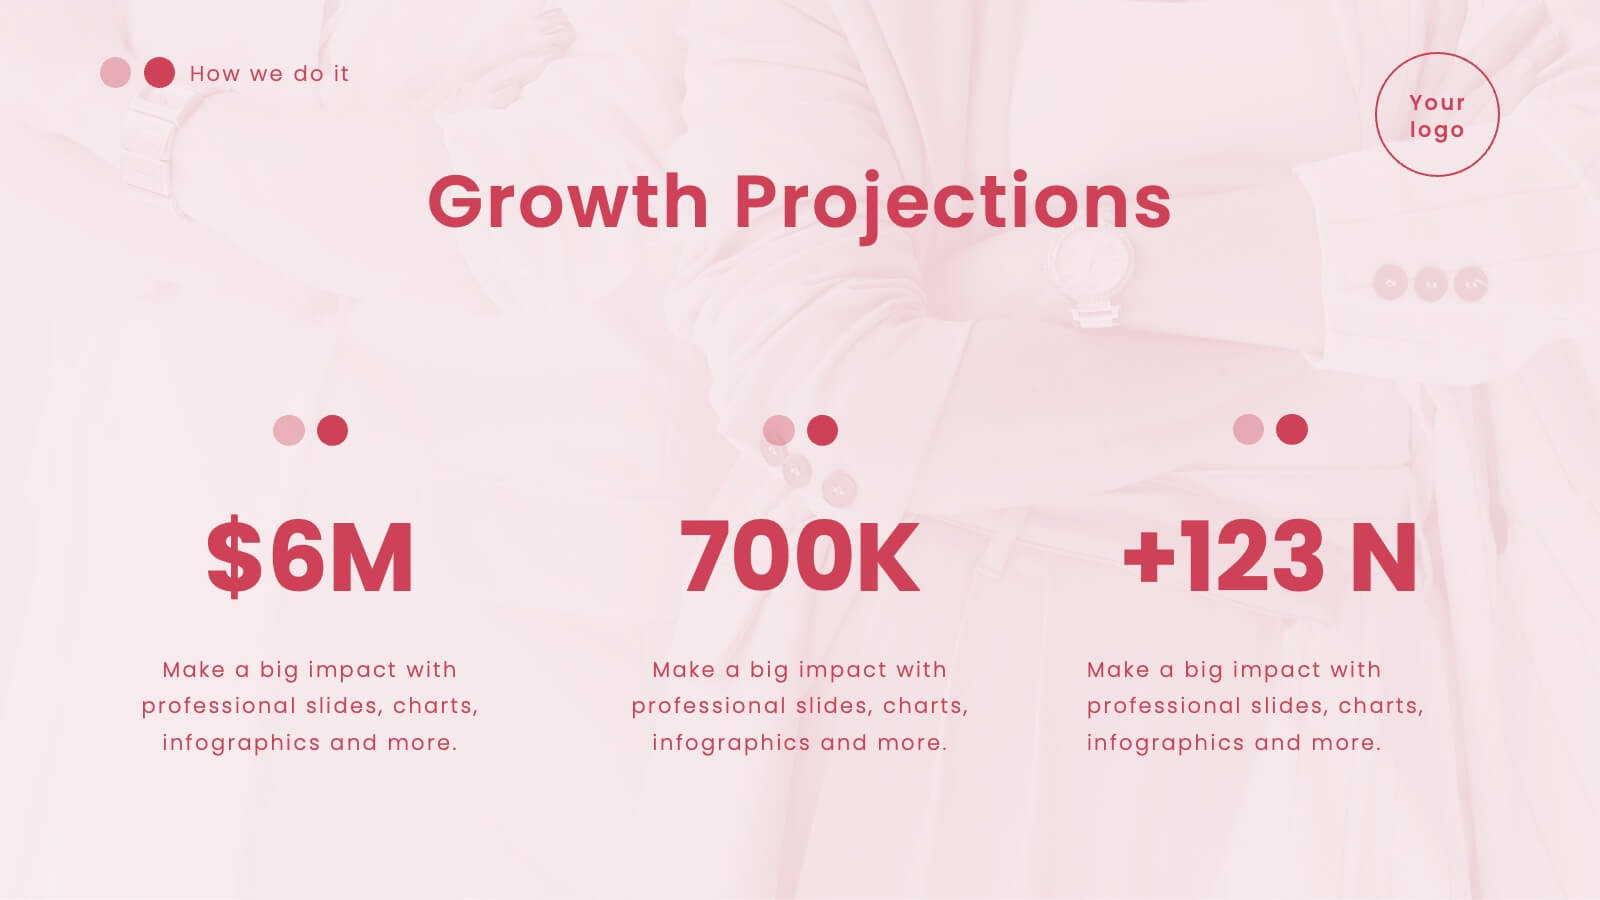
Cascade Marketing Proposal Template Presentation
Ignite your creativity with our dazzling Cascade Marketing Proposal Template Presentation! This captivating design brings your ideas to life, ensuring your presentation stands out. The sleek, dark theme is punctuated by electric blue accents, adding a modern, professional touch. Each slide is meticulously crafted, offering a perfect blend of visuals and content that keeps your audience engaged from start to finish. From the Company Overview to Growth Projections, every aspect of your pitch is highlighted with style and clarity. The template is fully customizable, allowing you to tailor it to your brand's identity effortlessly. Whether you're pitching to investors or presenting internally, this template has everything you need to make a lasting impression. Compatible with PowerPoint, Keynote, and Google Slides, it’s versatile and easy to use. Get ready to electrify your next presentation and leave your audience in awe!


6 diapositivas
Asia Colonization Map Infographics
Discover the versatility of our Asia Colonization Map infographic template, a powerful tool for visualizing the historical impact of colonization across the diverse continent of Asia. This template is fully compatible with popular presentation software like PowerPoint, Keynote, and Google Slides, enabling effortless customization to suit your specific needs. The Asia Colonization Map infographic template offers a robust foundation for illustrating colonization timelines, colonial powers, and regions affected by colonization throughout Asia's rich history. Whether you're a historian, educator, or simply intrigued by Asia's colonial past, this template provides a user-friendly platform to create engaging presentations and informative materials. Impress your audience with this SEO-optimized Asia Colonization Map infographic template, expertly designed for clarity and ease of use. Tailor it to showcase the historical narratives, impact, and legacies of colonization in Asia, making it a valuable asset for your projects and presentations. Start crafting your personalized infographic today!


6 diapositivas
Scrum Team Roles and Sprint Planning Presentation
Visualize your Agile workflow with this Scrum team diagram. Highlight roles, responsibilities, and key sprint planning phases in a clear, circular flow. Ideal for project managers, team leads, or Agile coaches. Fully editable in PowerPoint, Keynote, and Google Slides to support your software development or Agile training presentations.


23 diapositivas
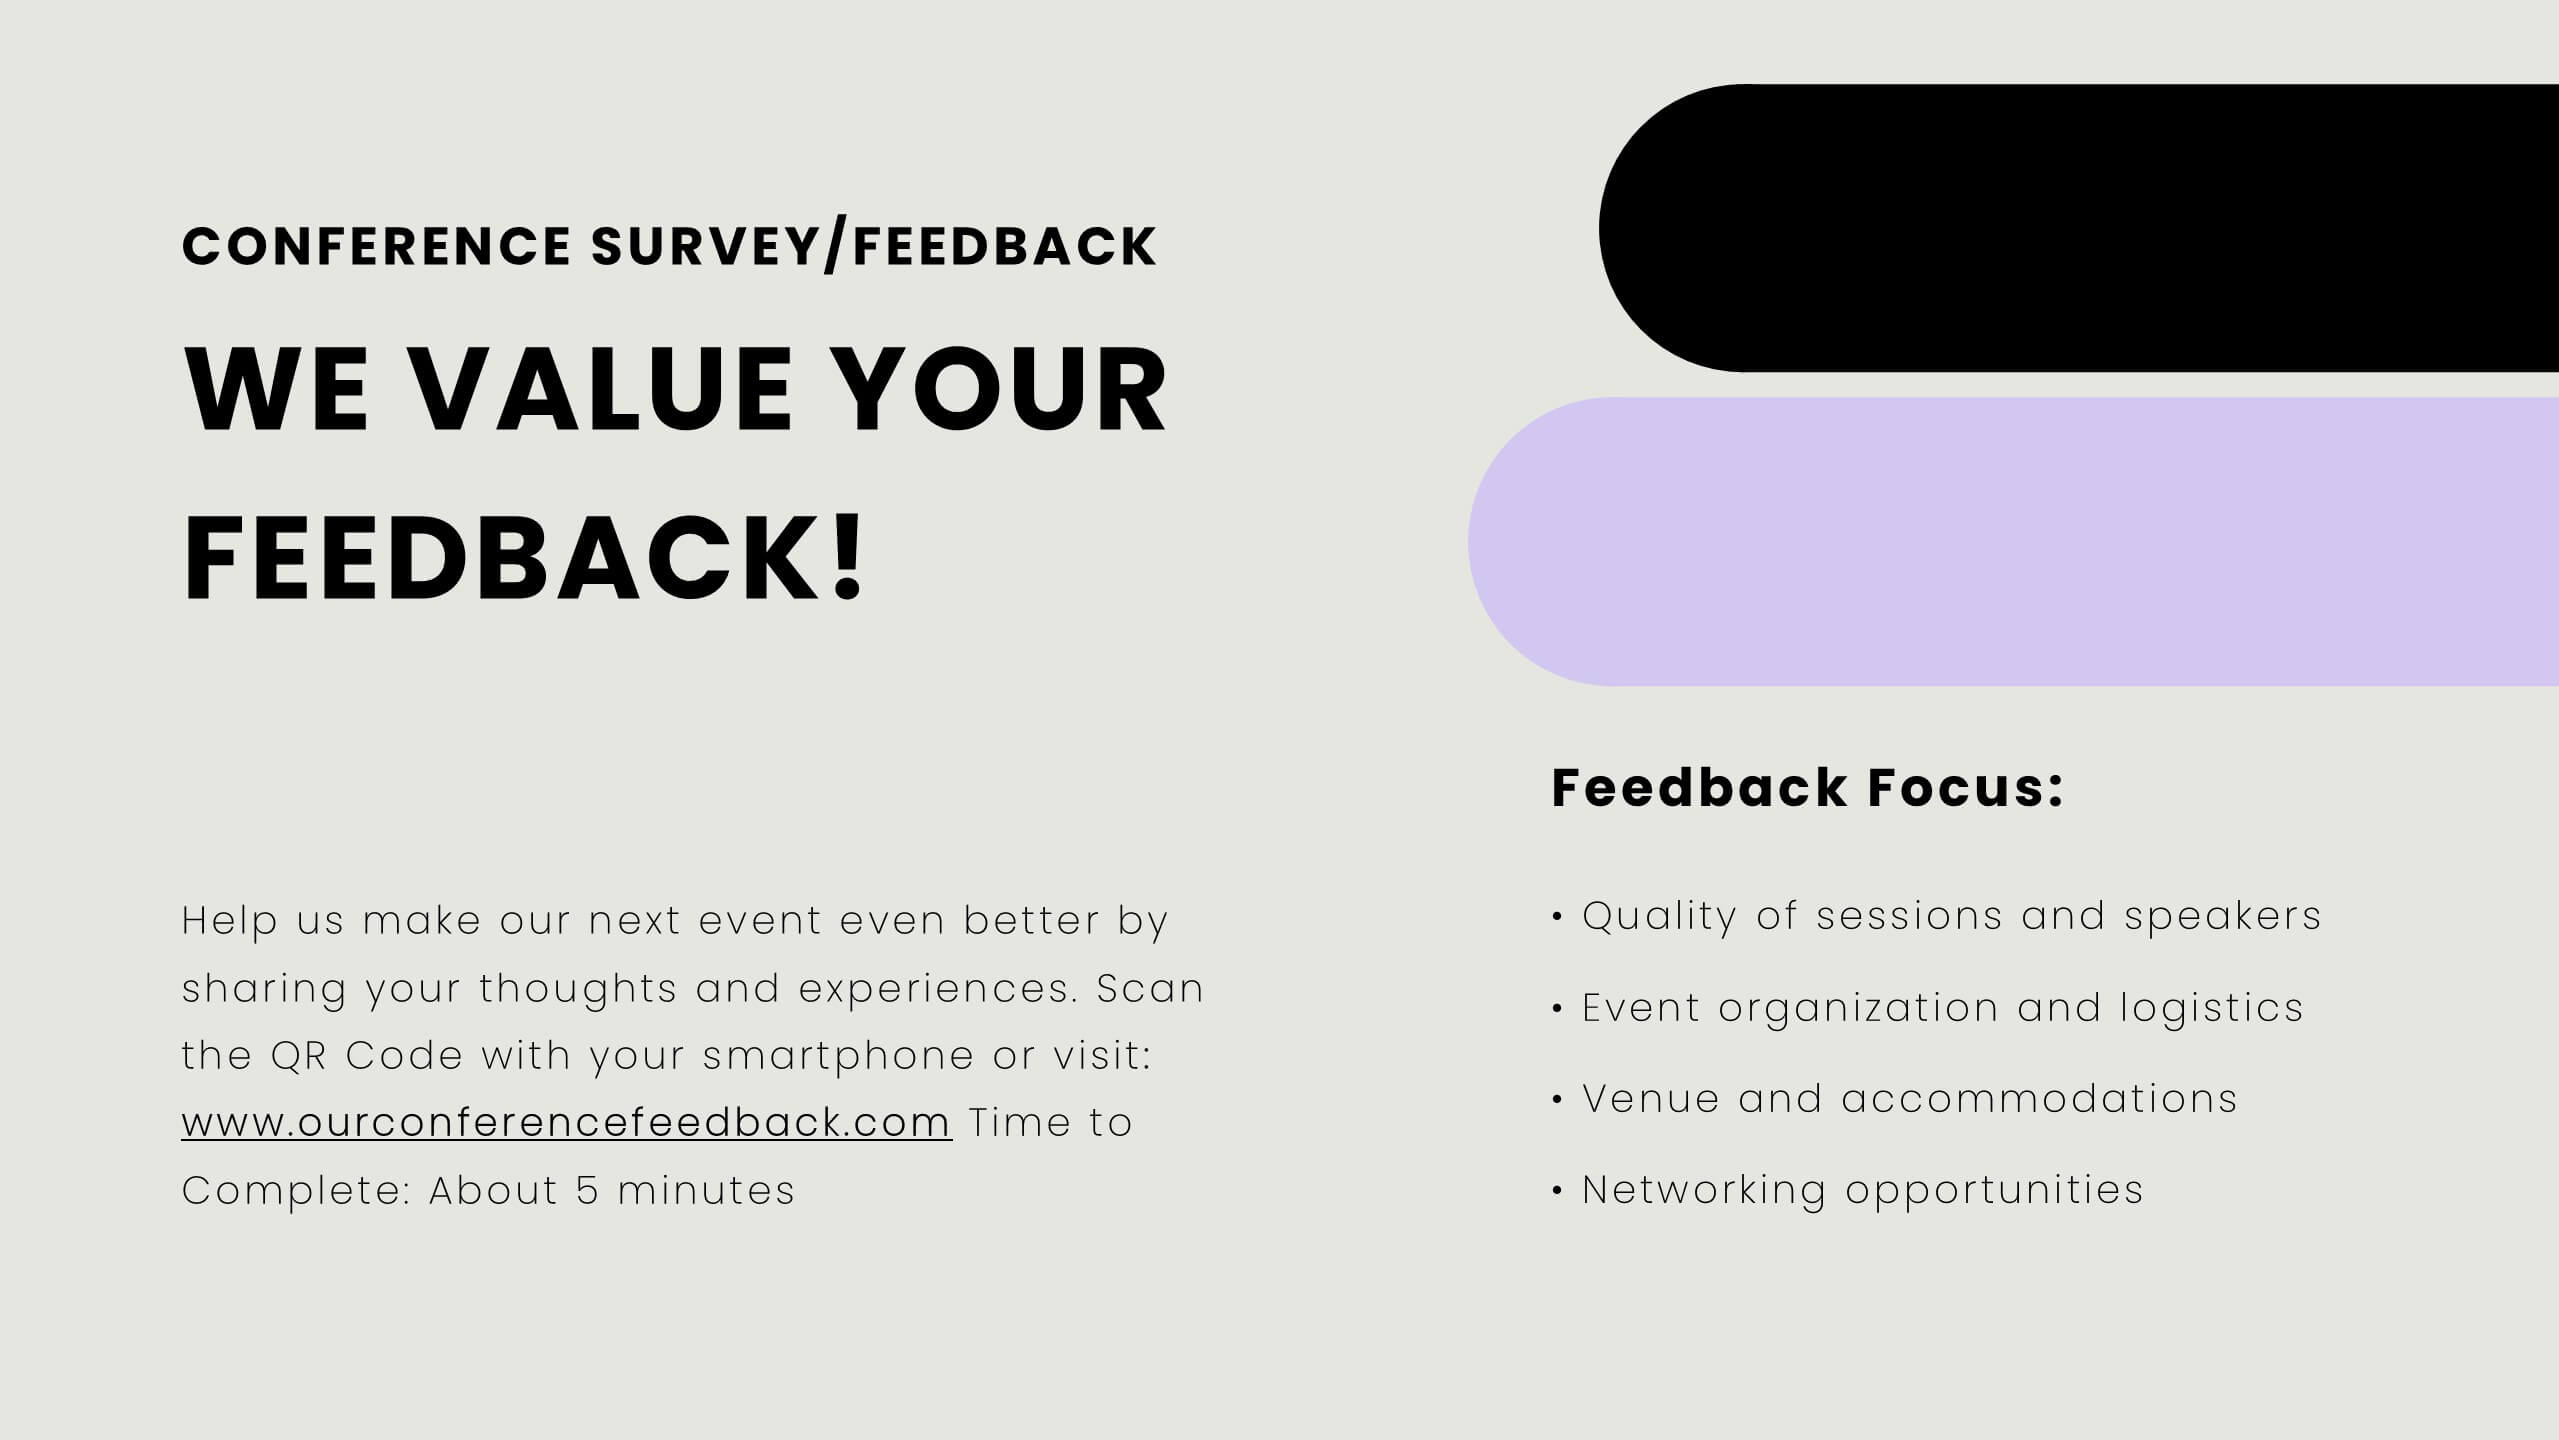
Ionian Corporate Strategy Report Presentation
The Ionian Corporate Strategy Report template offers a modern and dynamic approach to corporate presentations, designed to keep your audience engaged throughout. With a sleek, contemporary design in black, white, and purple tones, this template is perfect for presenting strategic plans, conference overviews, session breakdowns, and more. Each slide is crafted to facilitate a seamless flow of information, whether you're introducing a keynote speaker, discussing key objectives, or outlining conference agendas. The template includes placeholders for breakout sessions, networking breaks, Q&A sessions, and more, making it versatile and adaptable for various corporate events. It's fully compatible with PowerPoint, Keynote, and Google Slides, ensuring easy customization and a professional presentation experience. Use the Ionian Corporate Strategy Report template to make your next corporate presentation both impactful and memorable.


6 diapositivas
Buyer Behavior Trends Infographic
Unlock the secrets of consumer psychology with our Buyer Behavior Trends Infographic Template. This template offers a compelling visual exploration of modern consumer trends, designed to capture and convey the nuances of buyer behavior in today’s fast-paced market. Featuring a sleek, modern design, each slide is tailored to present data effectively, from spending habits and brand loyalty to digital consumption and decision-making processes. Use this template to illustrate the underlying factors that influence consumer choices and how these trends shape the future of marketing. Perfect for marketers, researchers, and business strategists, this template allows you to customize layouts, colors, and fonts to align with your brand or study focus. It's an invaluable tool for presentations, reports, and digital content, helping you to communicate complex data in an accessible and engaging way.


4 diapositivas
Social Media Calendar Overview
Stay organized and consistent with your posting schedule using the Social Media Calendar Overview Presentation. This clean, visual weekly planner helps you map out daily content across multiple categories with color-coded bullets and structured columns from Monday to Sunday. Perfect for content teams, marketers, and freelancers managing multi-platform campaigns. Fully customizable in PowerPoint, Keynote, and Google Slides.


5 diapositivas
Actionable Steps for Team Execution Presentation
Highlight progress and key insights with the Actionable Steps for Team Execution Presentation. This vertically stacked arrow slide uses five colorful blocks ascending upward to represent steps, milestones, or growth metrics. Each step includes space for a title and description to clearly outline tasks or performance trends. Ideal for showcasing team roadmaps, strategic plans, or KPIs. Compatible with PowerPoint, Keynote, and Google Slides.


7 diapositivas
Team Work Strategy Infographic
Harness the collective strength of your team with our team work strategy infographic. Set against a pristine white backdrop, this design is accentuated with vivid strokes of purple, blue, yellow, and orange, symbolizing the diverse skills and unity in a team. Crafted for seamless compatibility with Powerpoint, Keynote, and Google Slides, the template features versatile graphics, detailed icons, and adaptable image placeholders. Envisage the synergy, collaboration, and the strategic prowess of a unified team, all laid out in a visually appealing format.


5 diapositivas
5 Module Online Training Content Presentation
Kick off your training session with a clean, engaging visual that maps out each module in a clear, easy-to-follow flow. This presentation helps you organize lessons, outline learning goals, and guide learners through a structured digital program. Fully compatible with PowerPoint, Keynote, and Google Slides.


6 diapositivas
Stakeholder Analysis and Engagement
Effectively map out internal and external stakeholders with this structured hexagon-based layout. This presentation highlights six key groups—Employee, Manager, Shareholder, Society, Media, and Customer—centered around your company. Ideal for corporate strategy, stakeholder engagement, or CSR planning. Fully customizable in PowerPoint, Keynote, and Google Slides.


6 diapositivas
KPI Data Visualization and Metrics Overview Presentation
Get a clear snapshot of your performance with this KPI Data Visualization and Metrics Overview Presentation. Designed with bold triangle charts, percentage rings, and a color-coded value panel, it’s perfect for summarizing five key metrics in a compact, visual format. Easily editable in PowerPoint, Google Slides, Keynote, and Canva.


4 diapositivas
RACI Responsibility Assignment Matrix
Streamline your project roles with this clear and customizable RACI Matrix template. Easily define who's Responsible, Accountable, Consulted, and Informed across tasks or phases. Perfect for project managers, team leads, and business strategists. Fully editable in PowerPoint, Keynote, and Google Slides.


7 diapositivas
Cloud Infographic Presentation Template
This Cloud infographic, is a versatile and professional template designed for corporate presentations. This is perfect for businesses and organizations in the technology and IT field, as well as any company looking to showcase their data and information in a visually appealing way. This template features a corporate style with a blue theme, which gives it a professional look and feel. The slides are filled with icons, and other visual elements that will help you communicate your message in an effective way. This template has everything you need to create an engaging and informative presentation.