


Características


¿Tienes alguna pregunta?
Recomendar


6 diapositivas
RAPID Framework for Business Strategy Presentation
Unveil a dynamic approach to strategic decision-making with the RAPID Framework for Business Strategy template. This structured layout covers the Recommend, Agree, Perform, Input, and Decide stages, offering a comprehensive toolkit for business planning and execution. This versatile template is essential for teams aiming to enhance strategic planning and is compatible with PowerPoint, Keynote, and Google Slides, making it accessible for a wide range of business professionals.


5 diapositivas
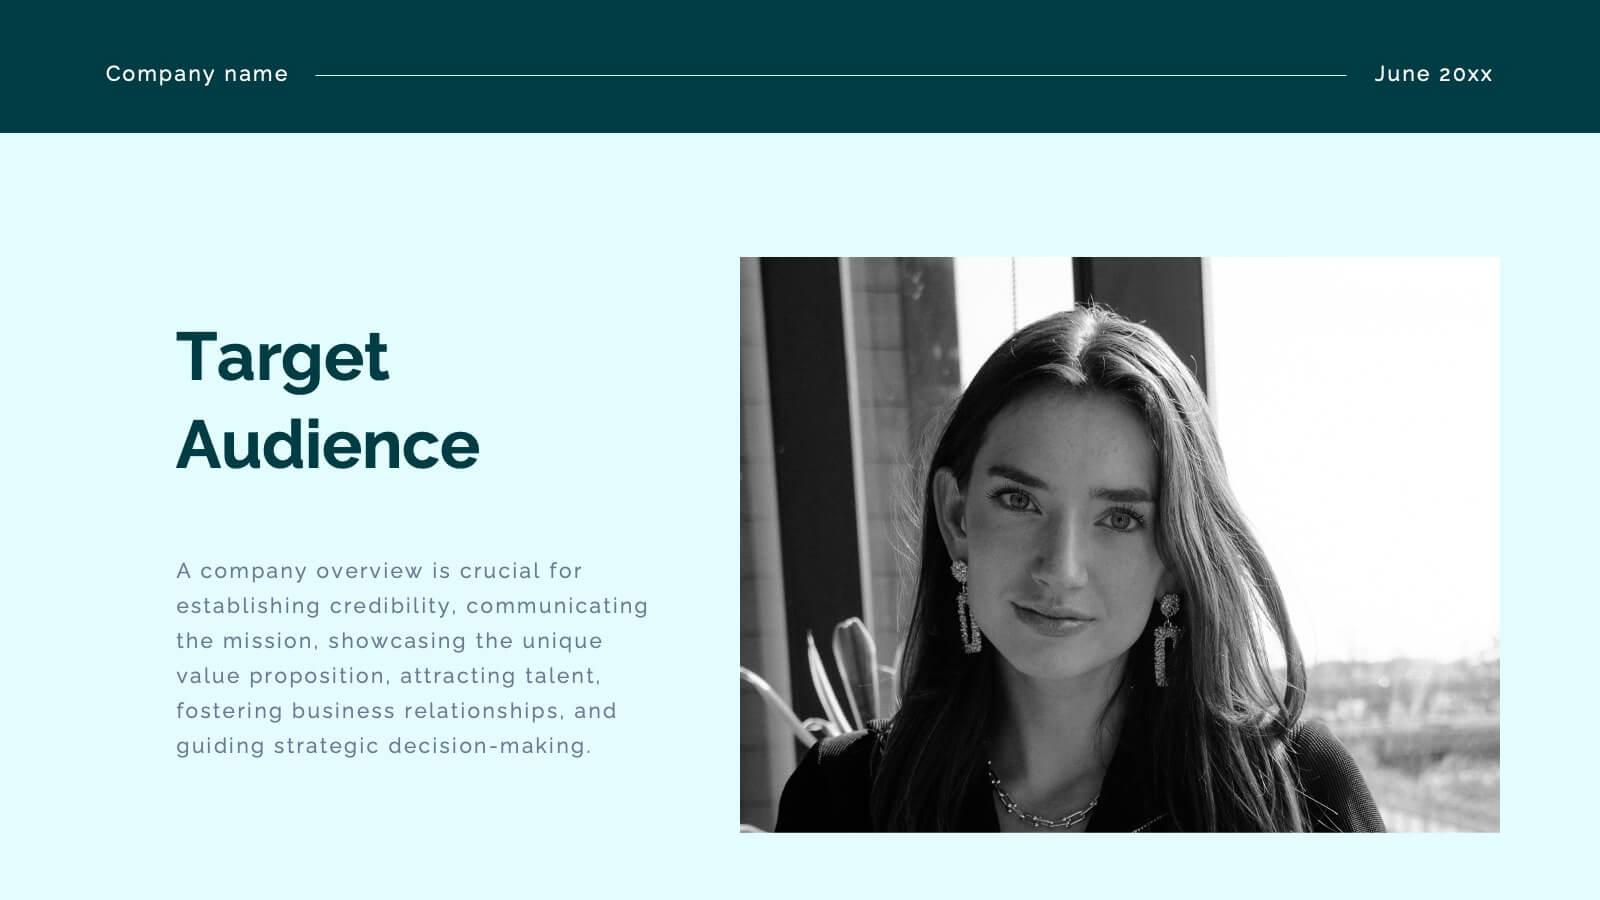
Target Audience Analysis Slide Presentation
Discover who your audience truly is with this clear and visually balanced layout designed to simplify audience insights. Perfect for marketing plans, presentations, and strategy reports, it helps you visualize key demographics and behaviors effortlessly. Fully customizable and compatible with PowerPoint, Keynote, and Google Slides for easy editing.


21 diapositivas
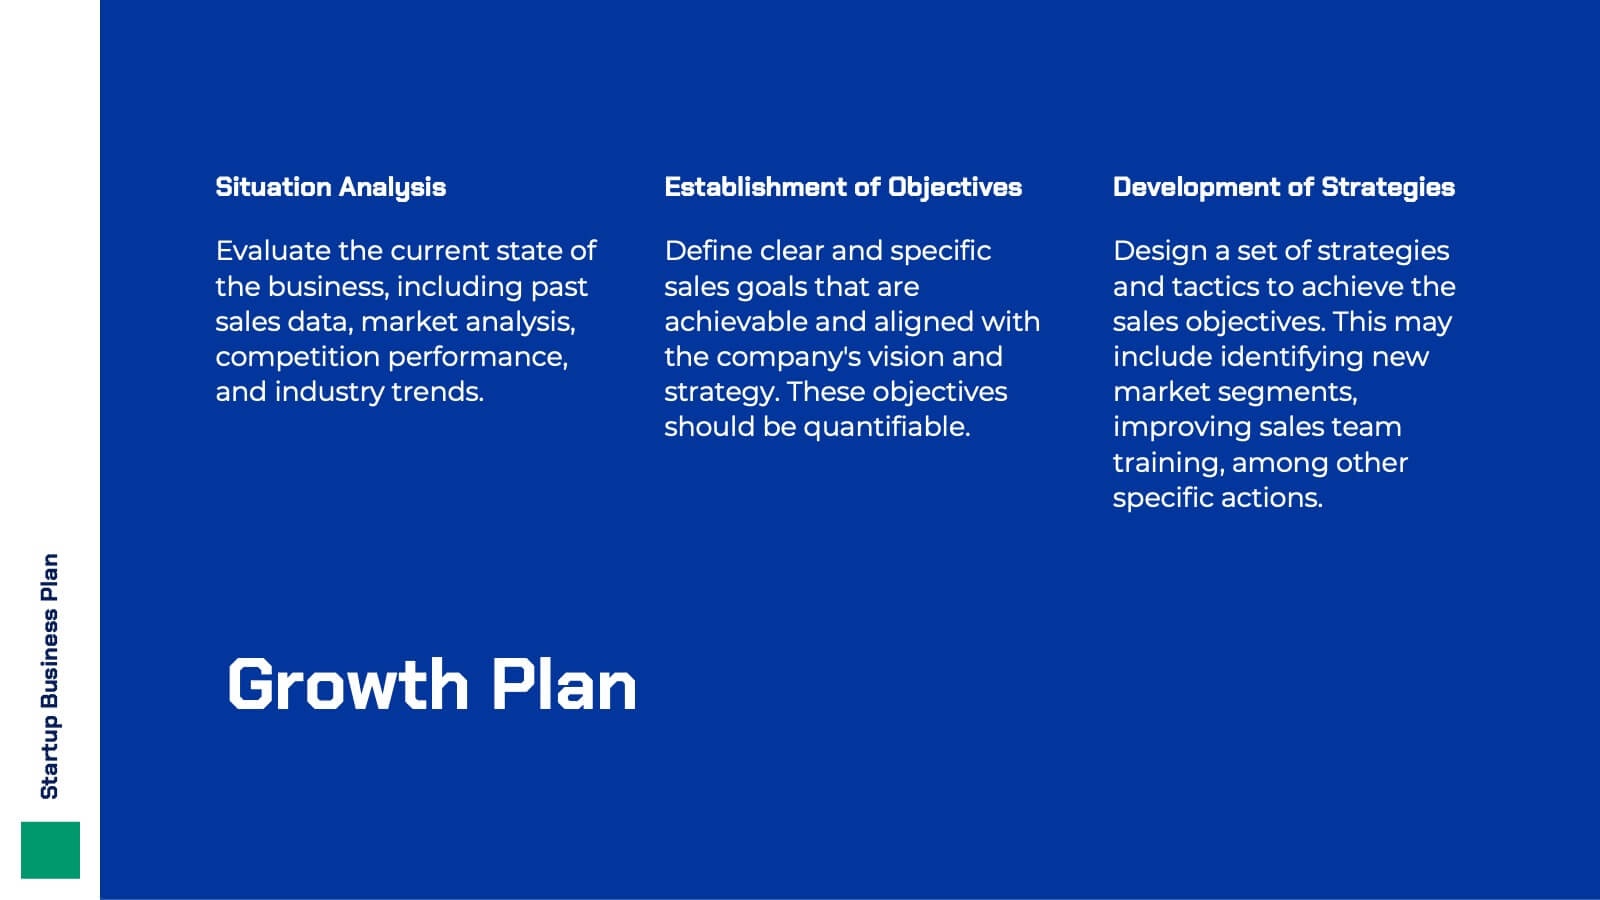
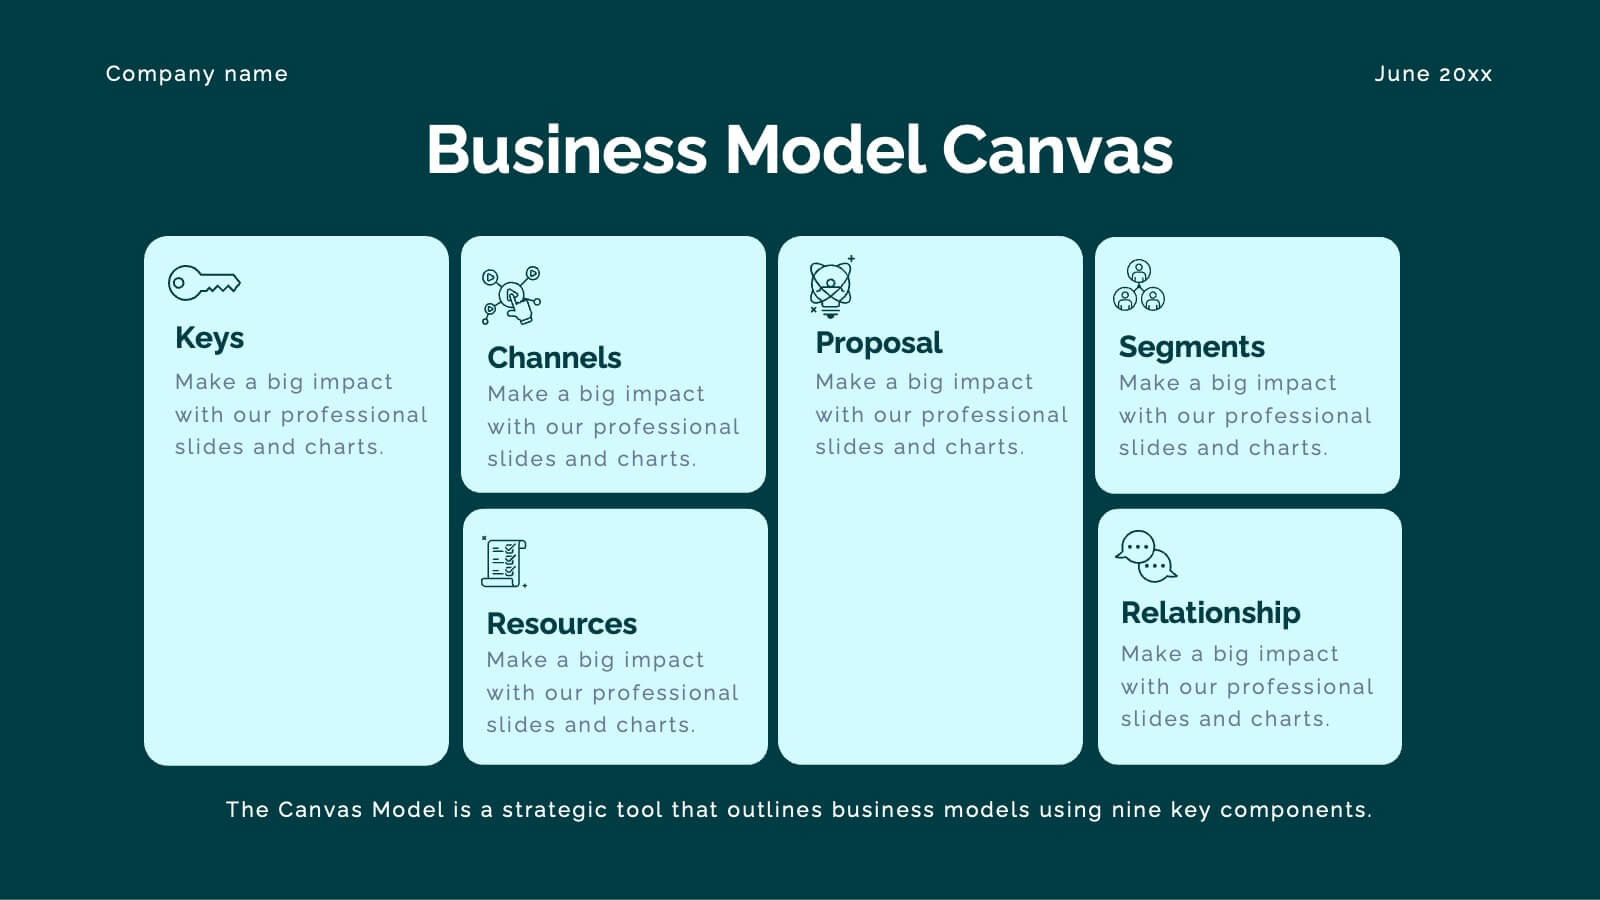
Hyperluma Startup Business Plan Presentation
Launch your vision with this startup business plan template, crafted to communicate your mission, market potential, and growth strategy with clarity and impact. Covering customer needs, unique value propositions, and financial projections, it’s ideal for entrepreneurs and founders. This template is compatible with PowerPoint, Keynote, and Google Slides, ready to fuel your startup’s journey.


7 diapositivas
Female Anatomy Infographic
Anatomy is the branch of biology that focuses on the structure and organization of living things. Step into a world of discovery with our infographic template, this is an enlightening visual guide that celebrates the intricate beauty and functionality of the female body. This infographic is designed to educate and empower, offering a clear and artistic representation of the anatomy that defines women. This template will take your audience through an educational journey through the various systems that make up a woman's body. This is fully customizable and compatible with Powerpoint, Keynote, and Google Slides.
23 diapositivas
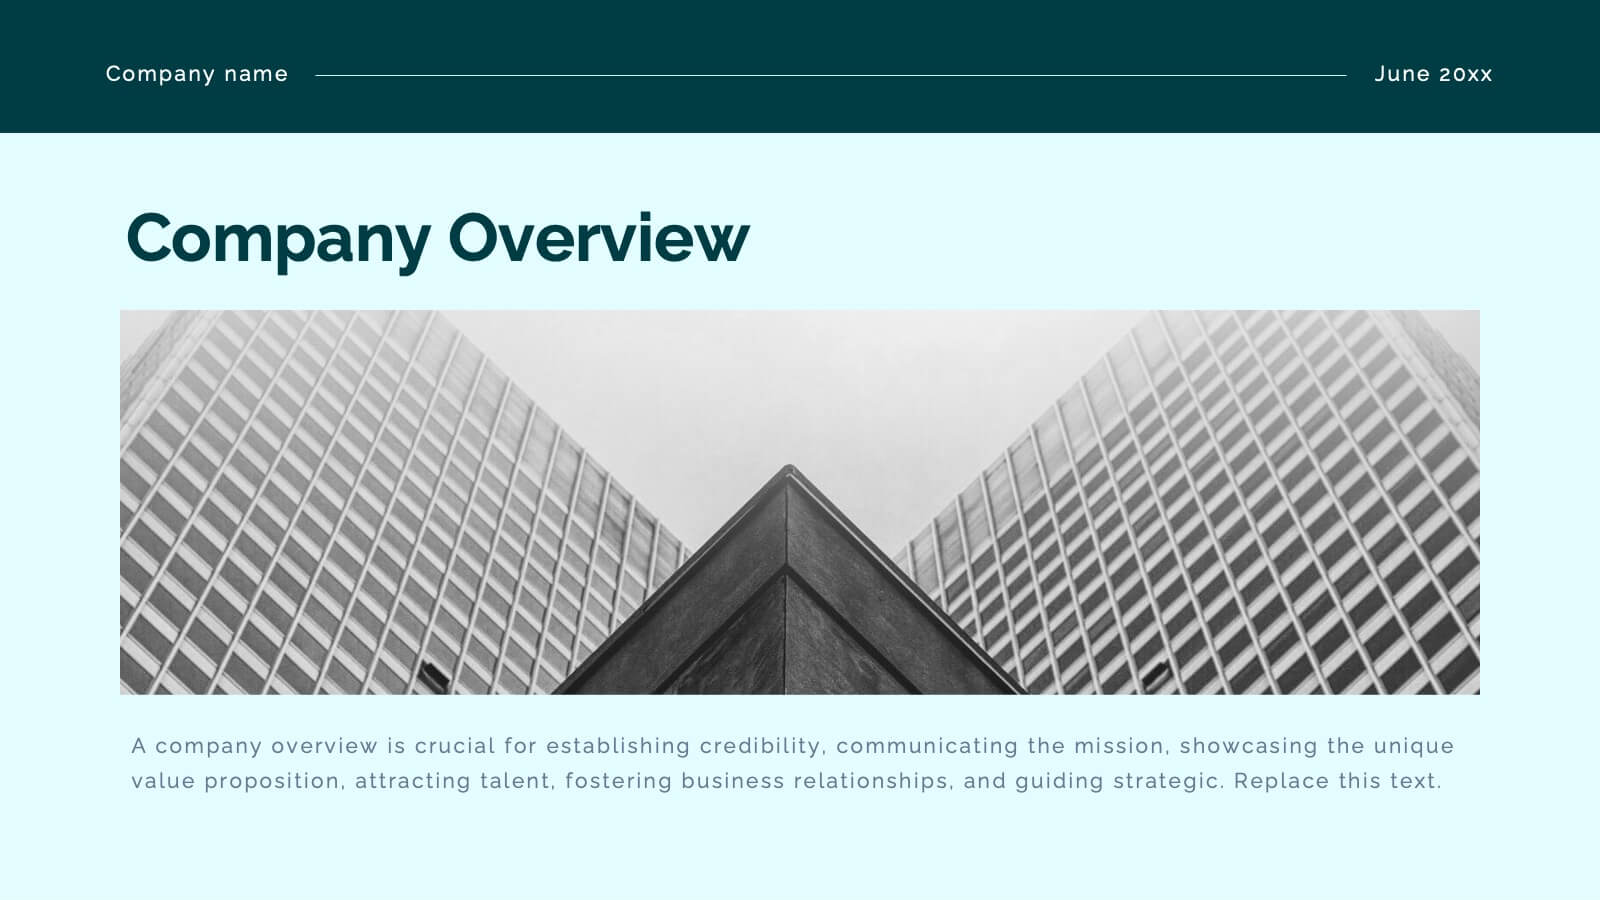
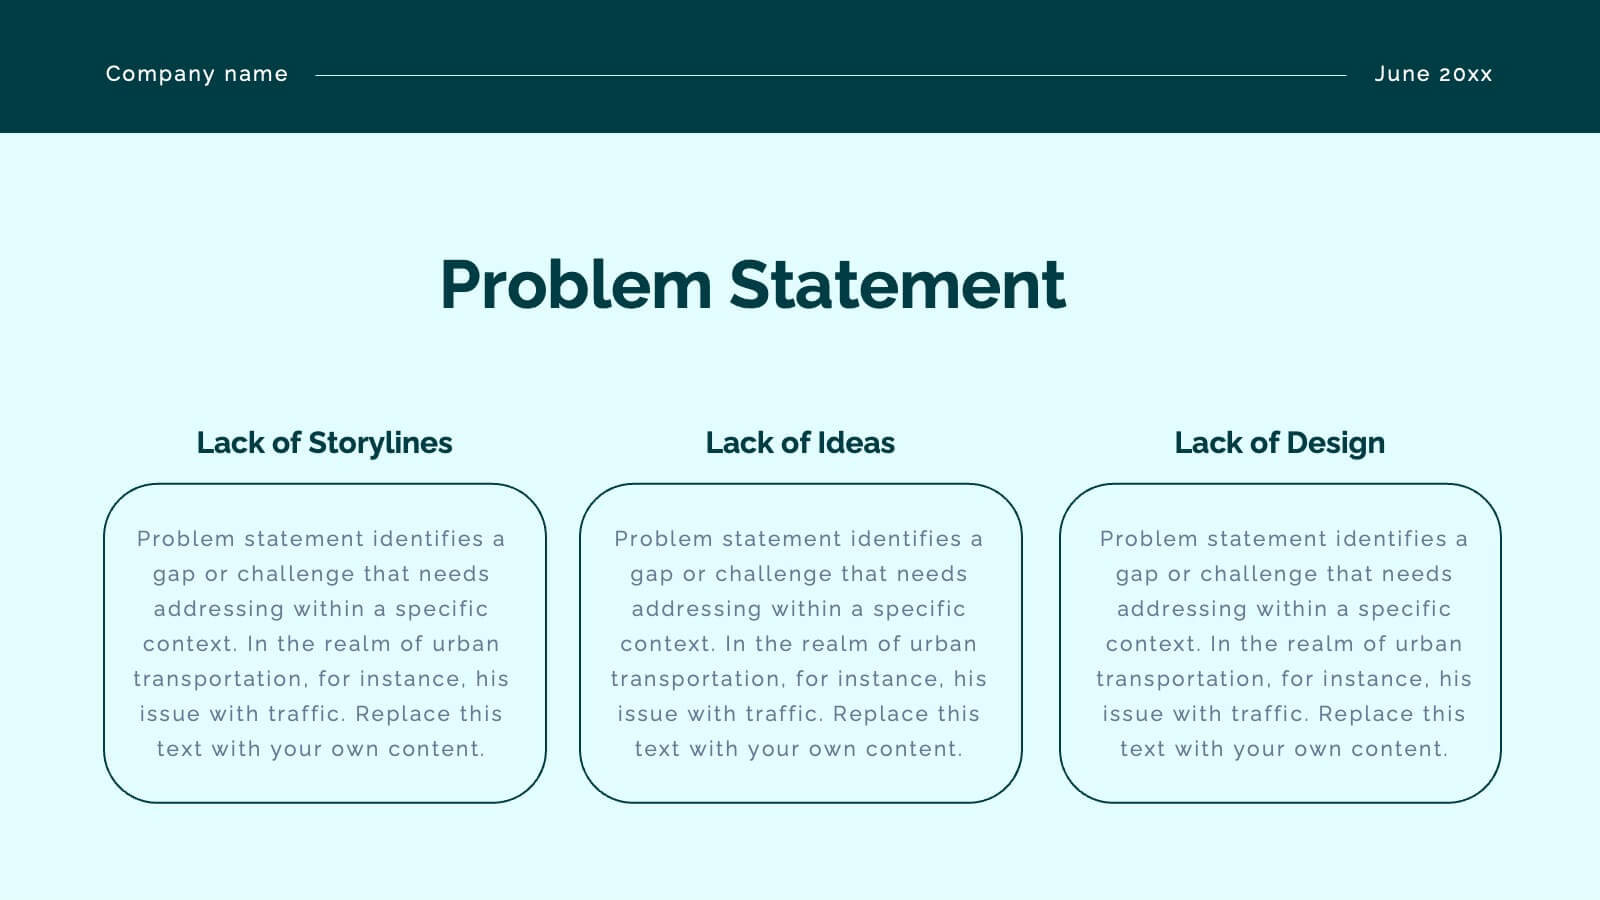
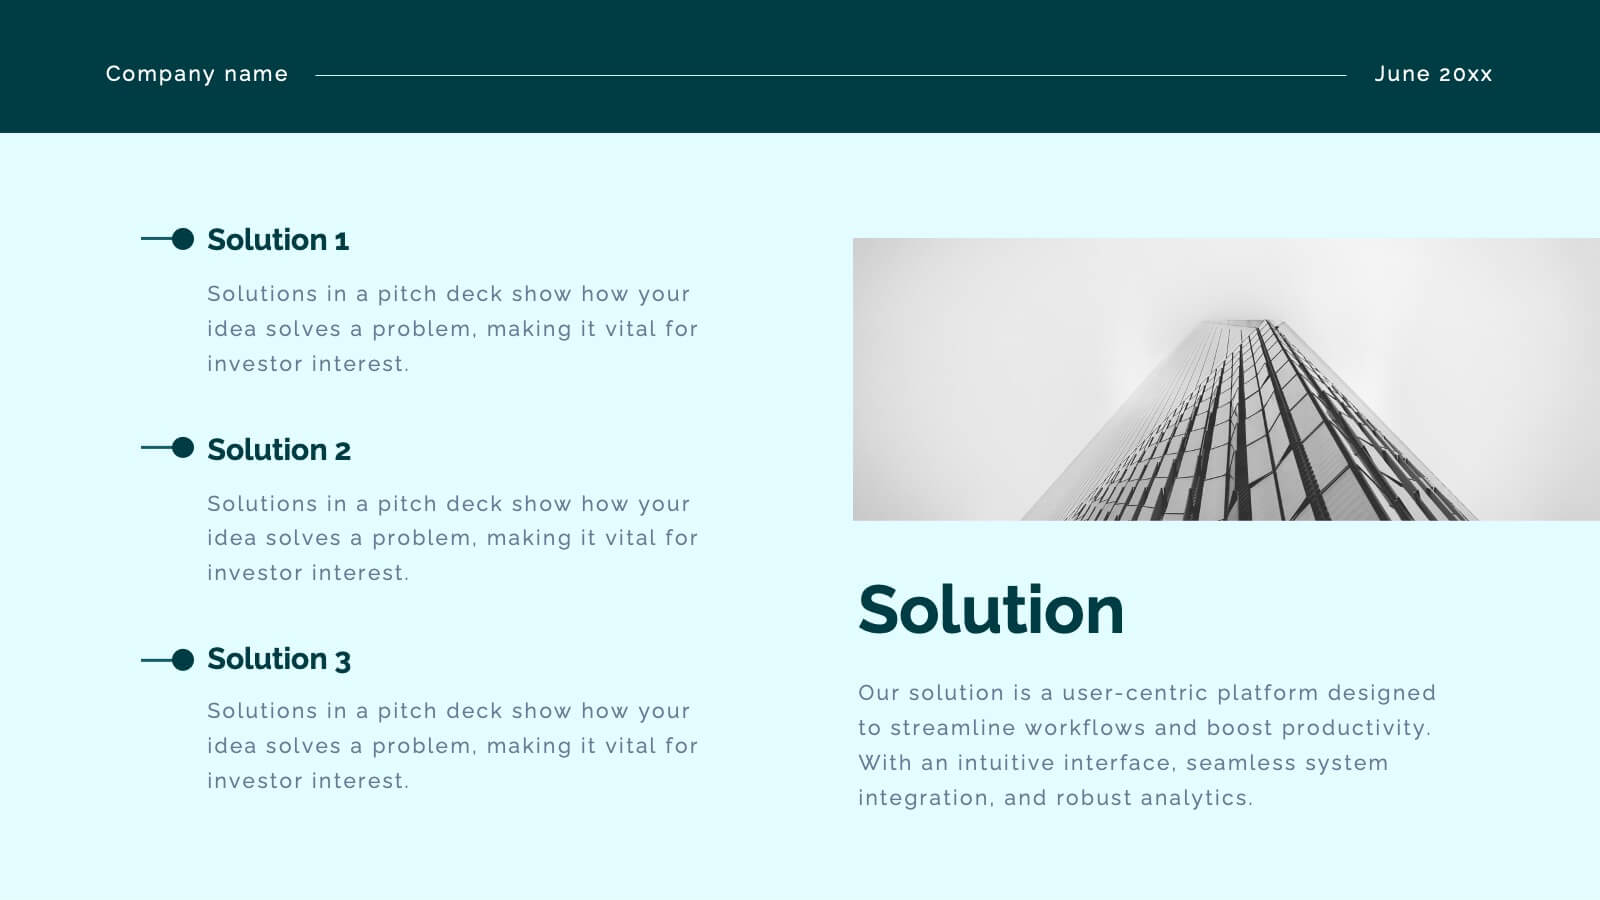
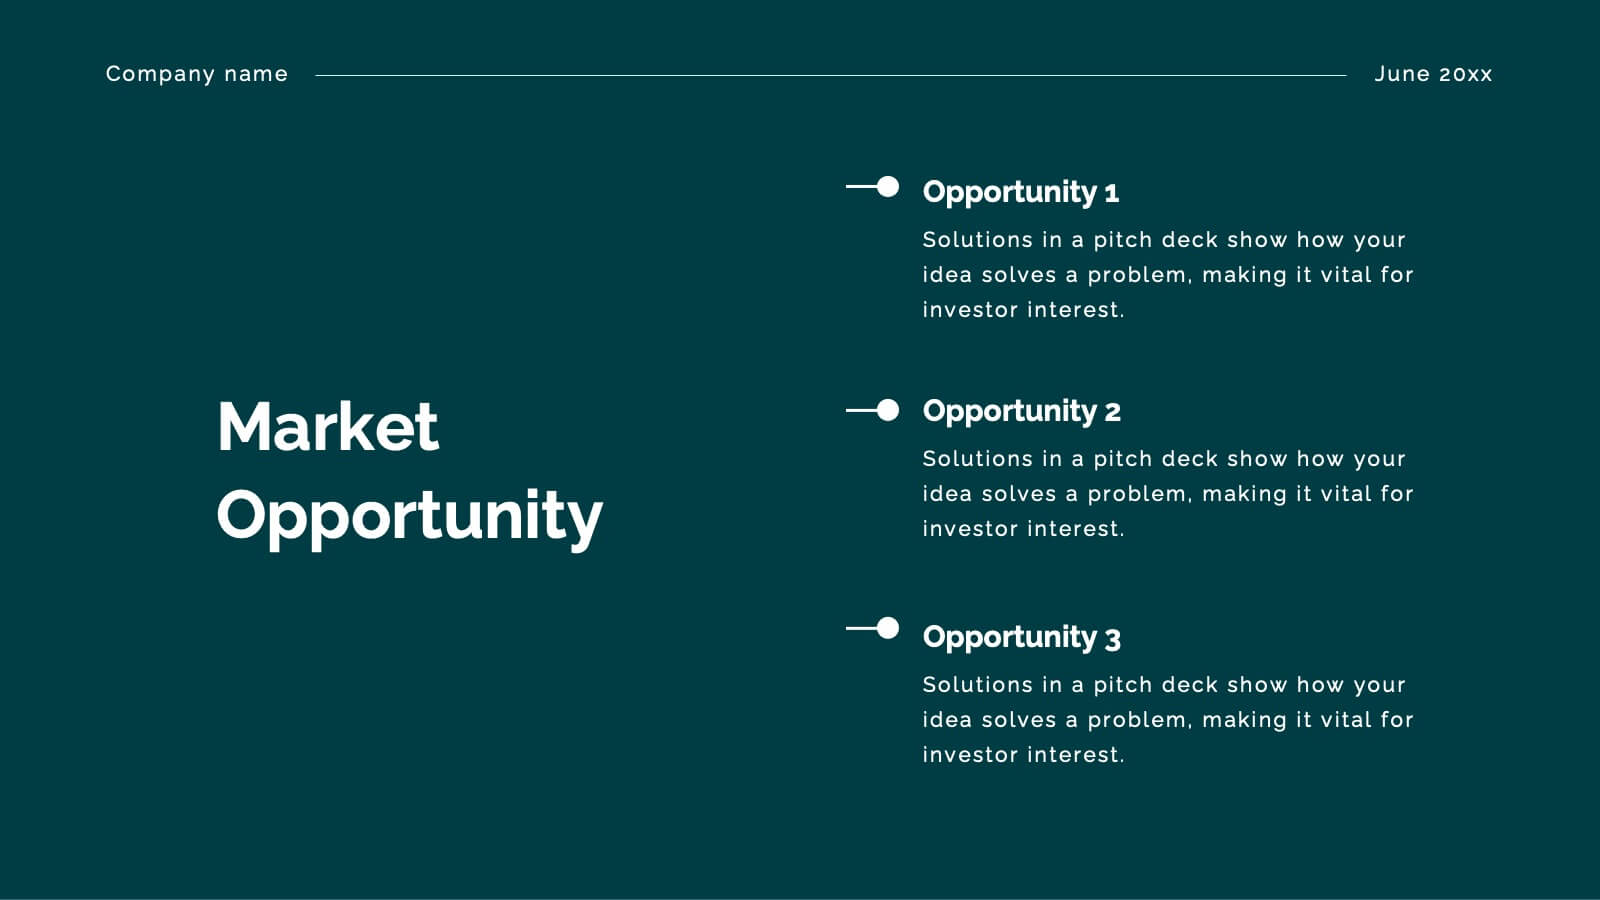
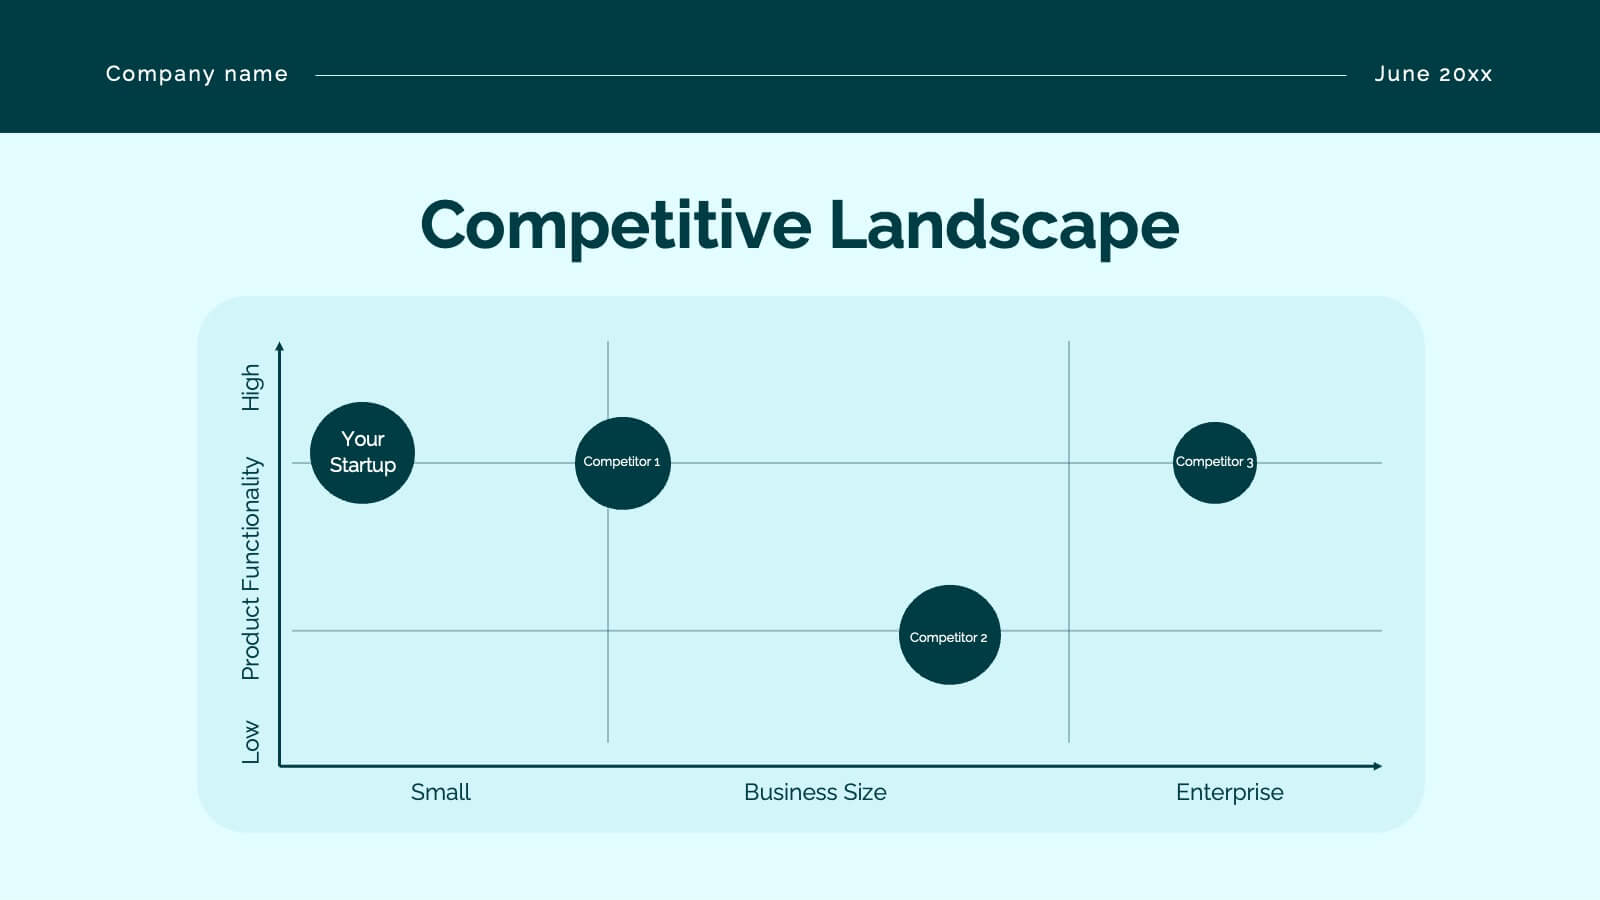
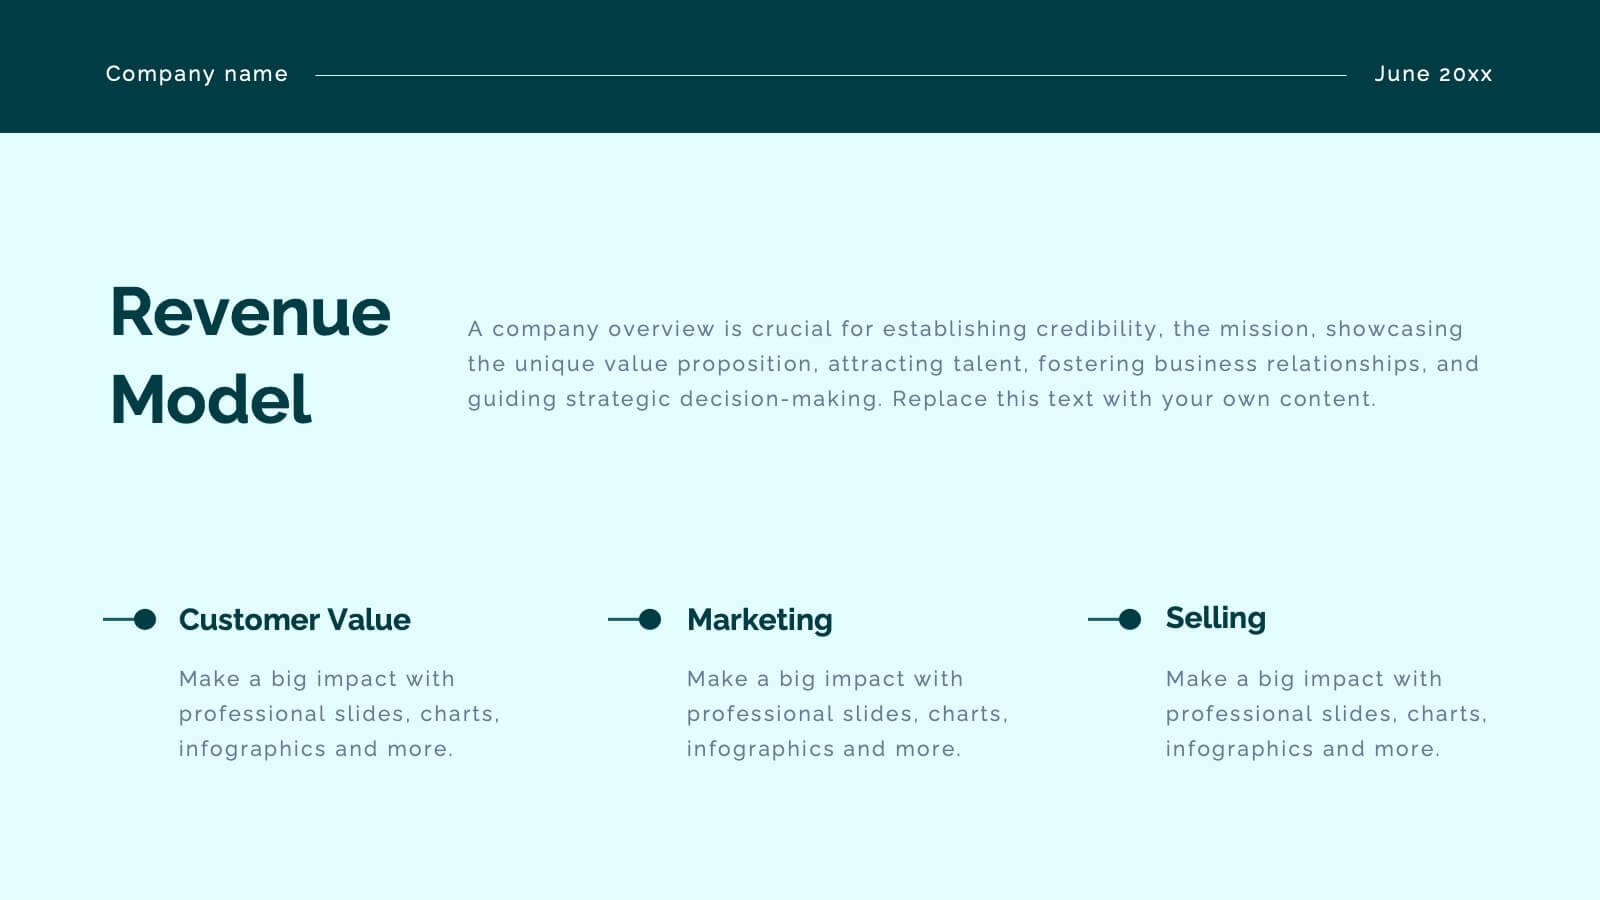
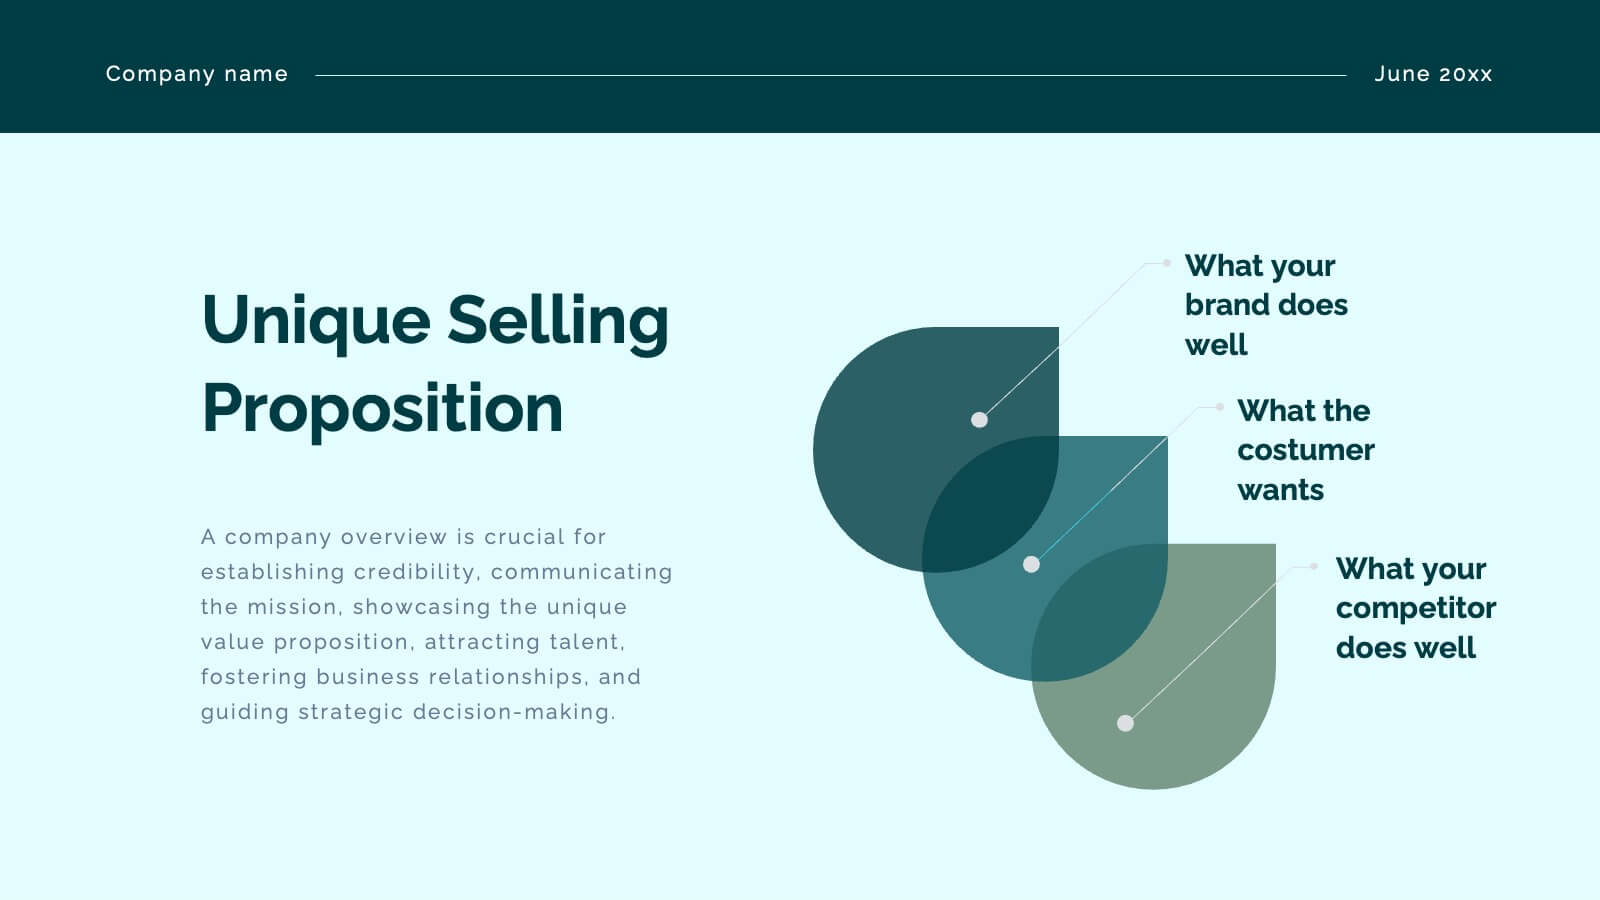
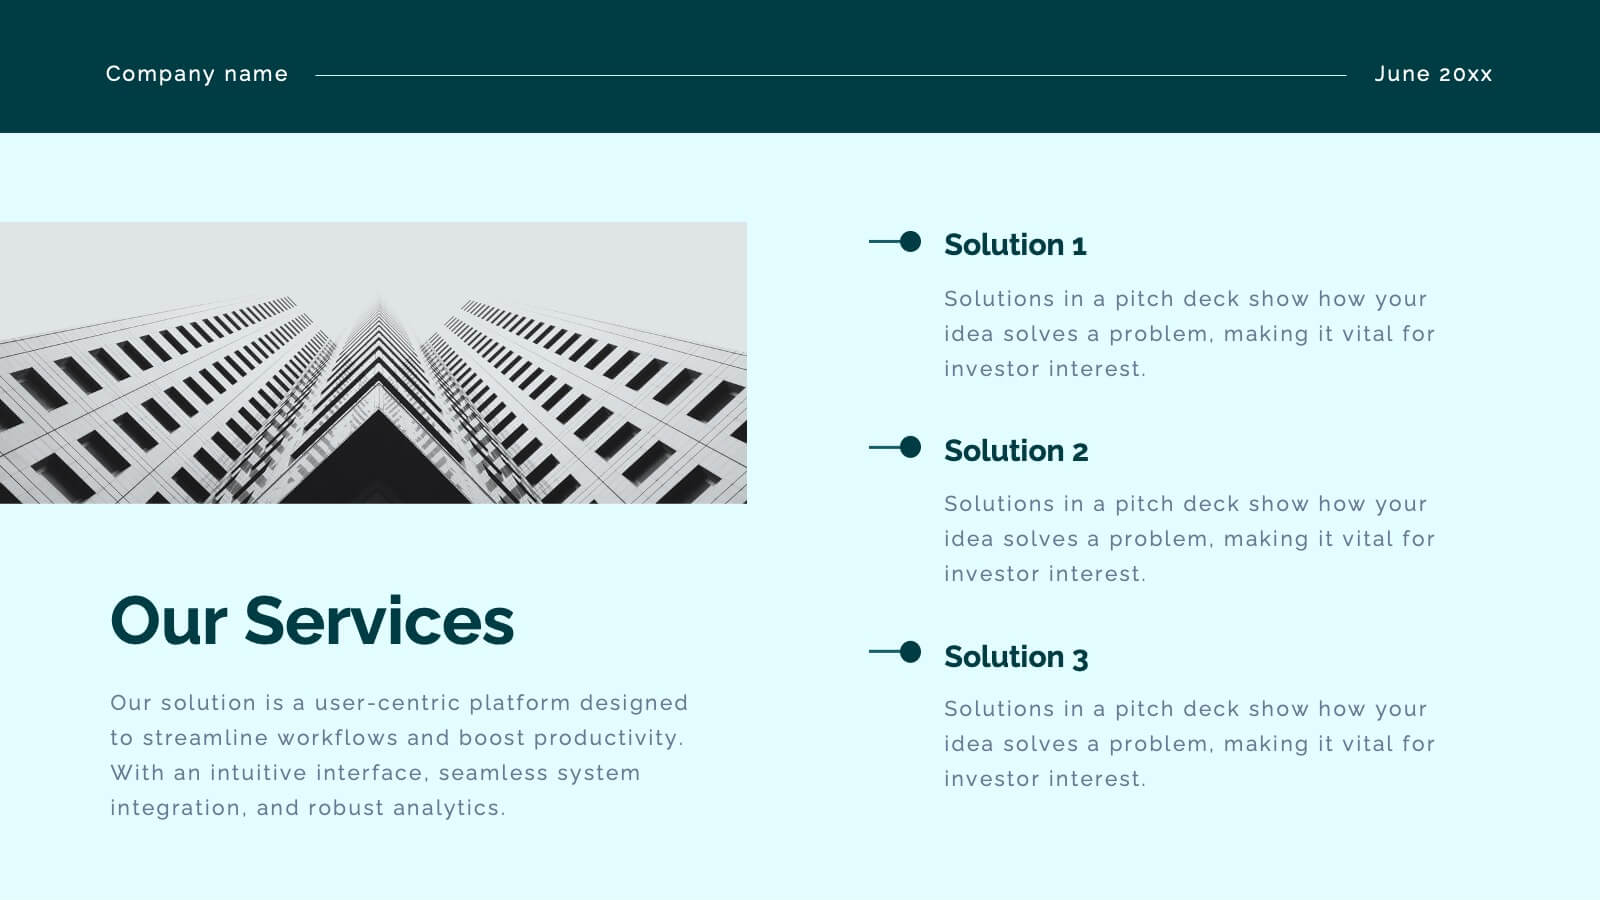
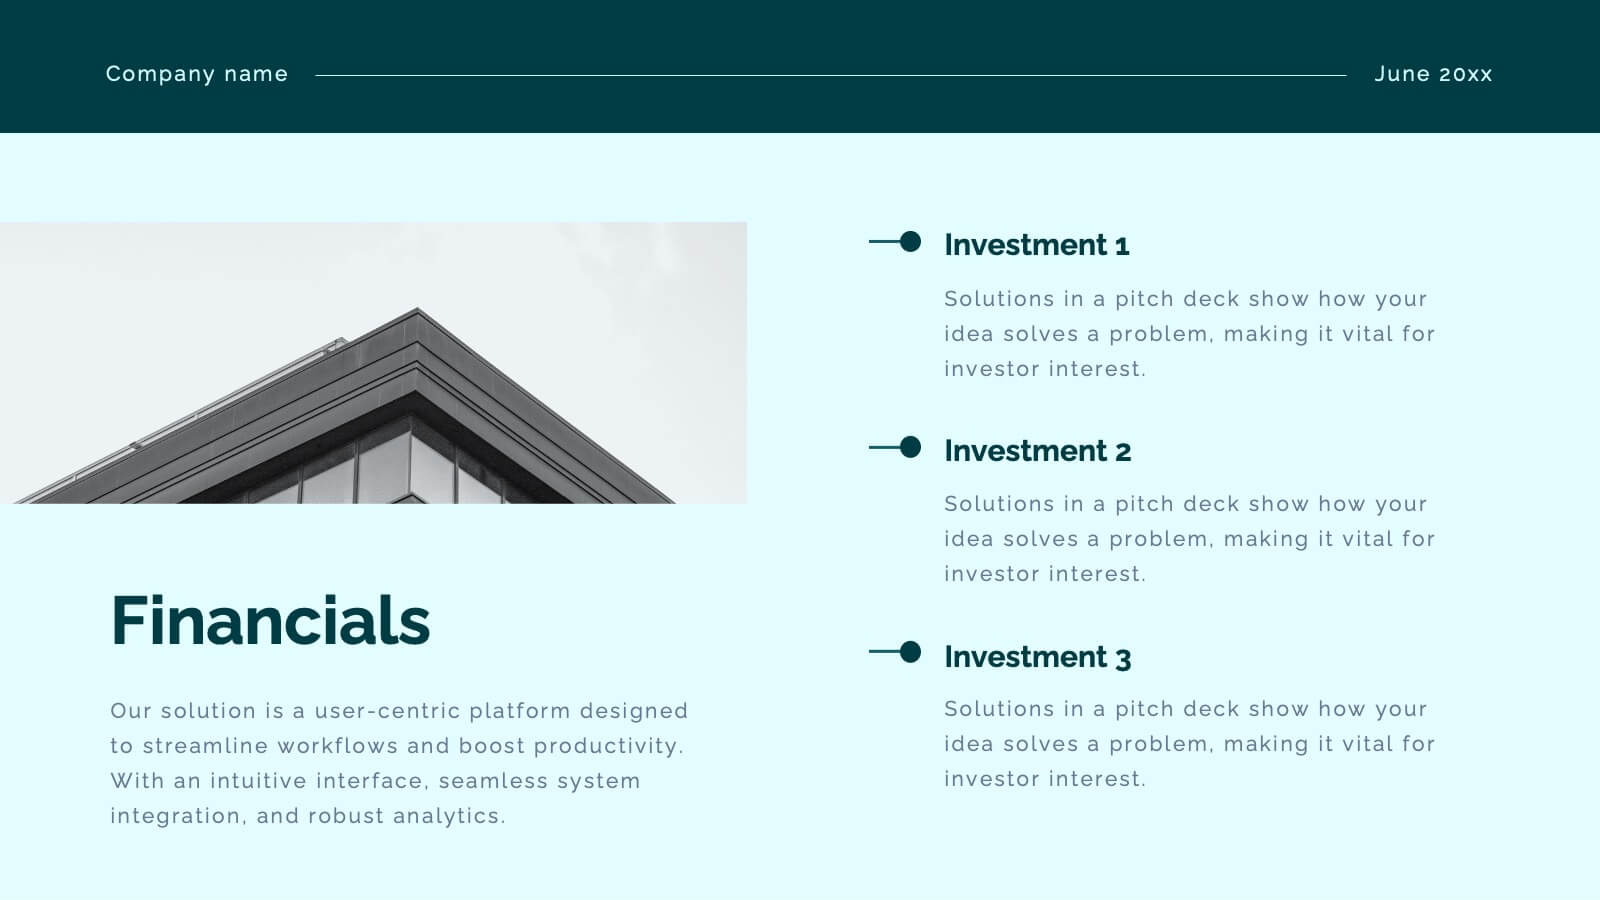
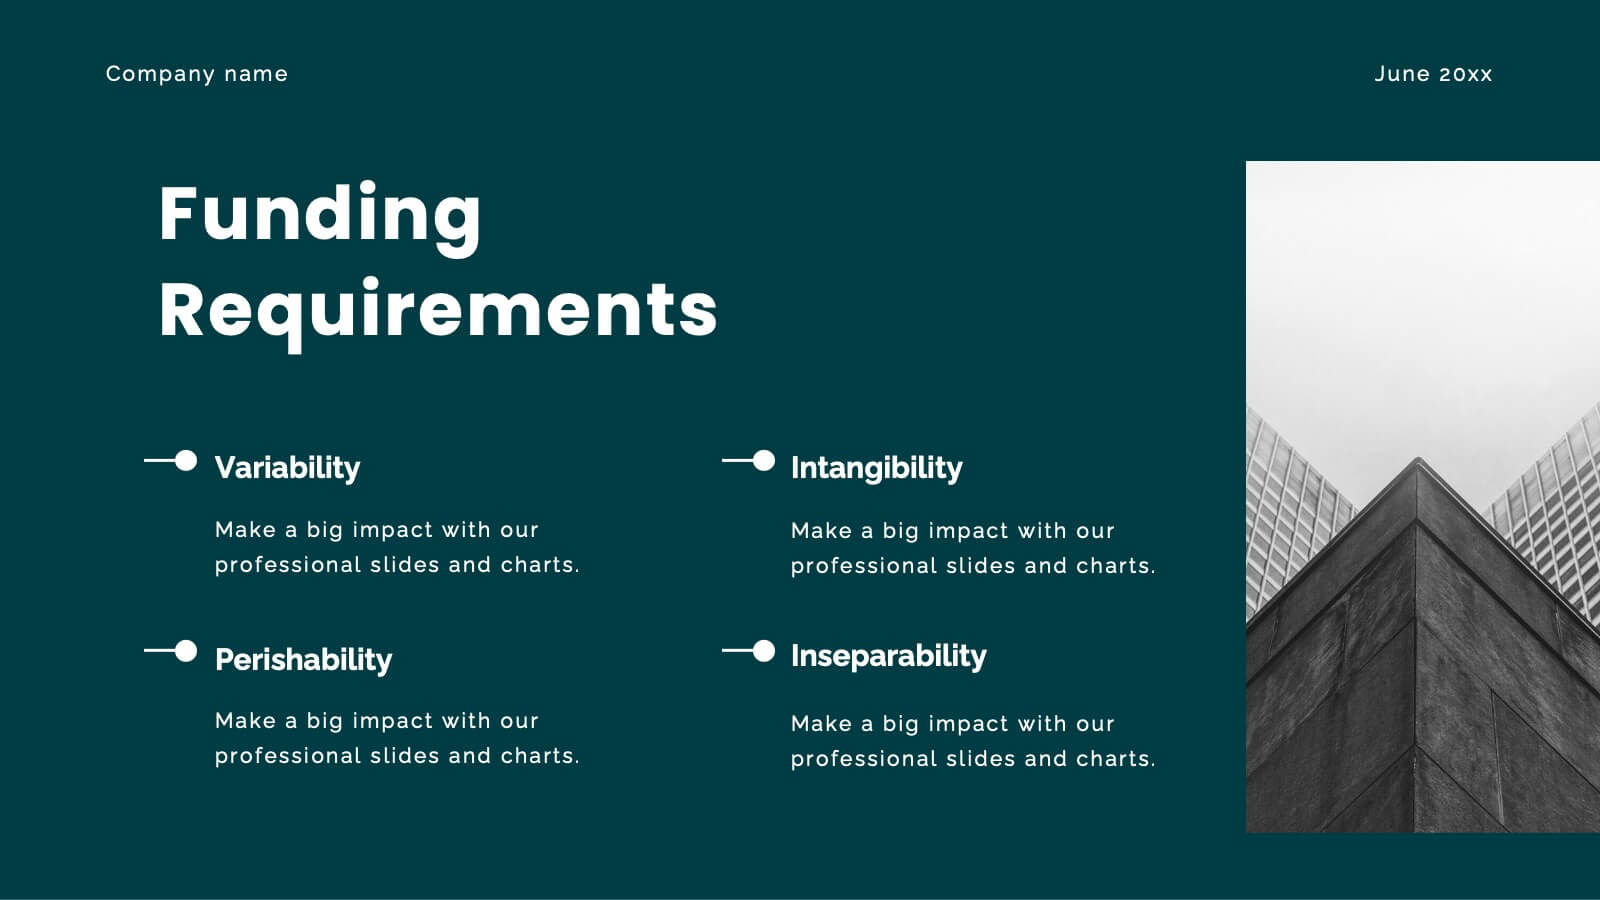
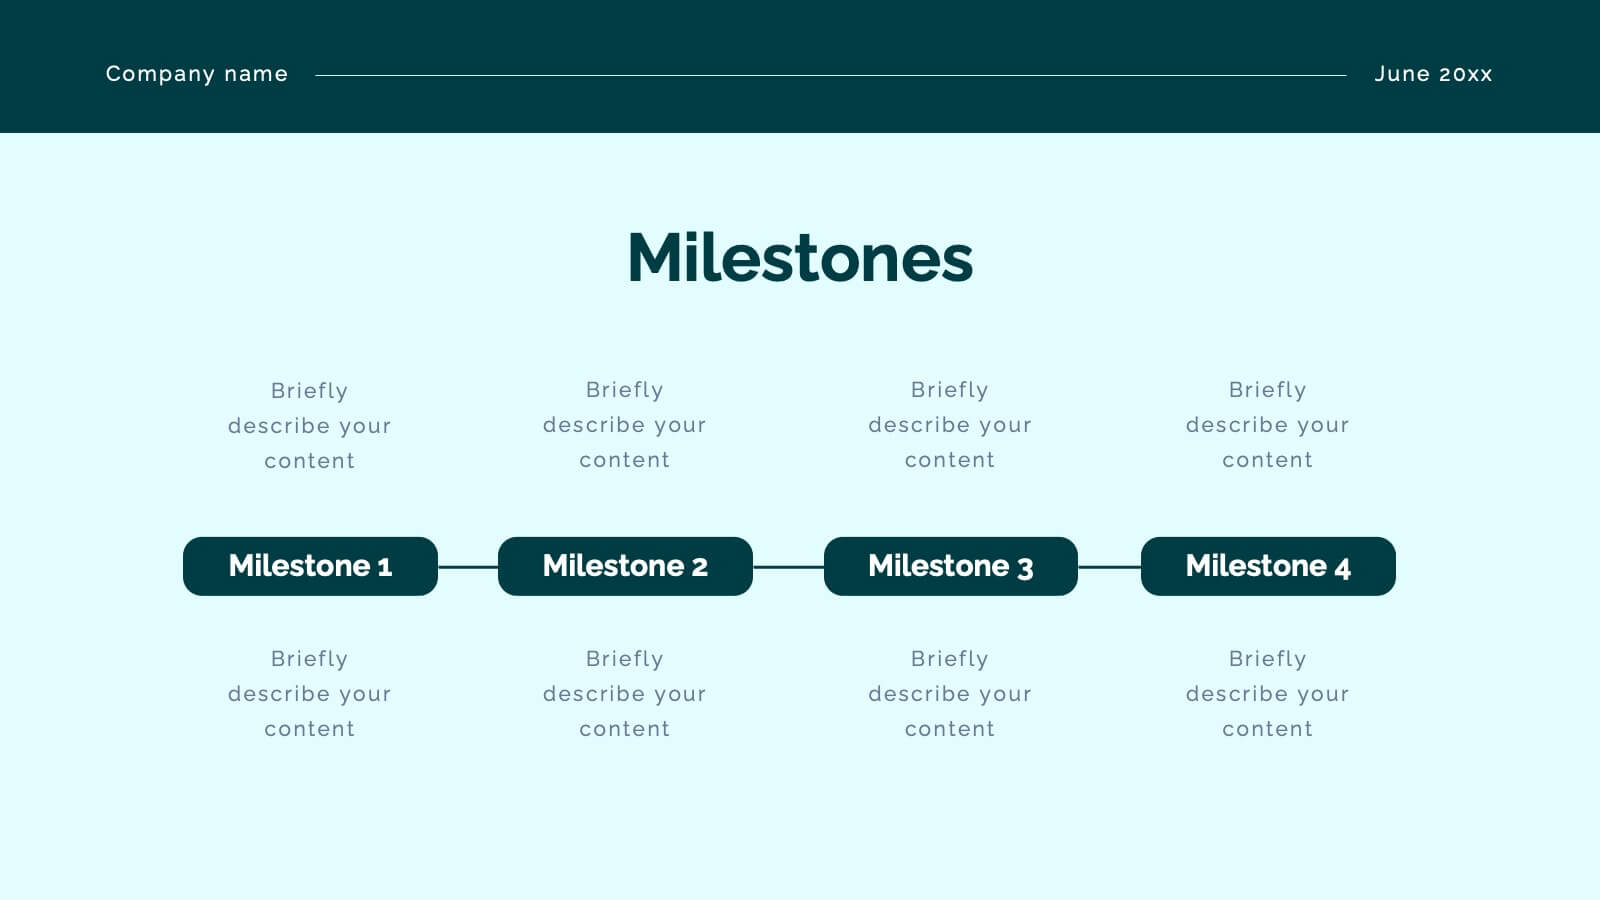
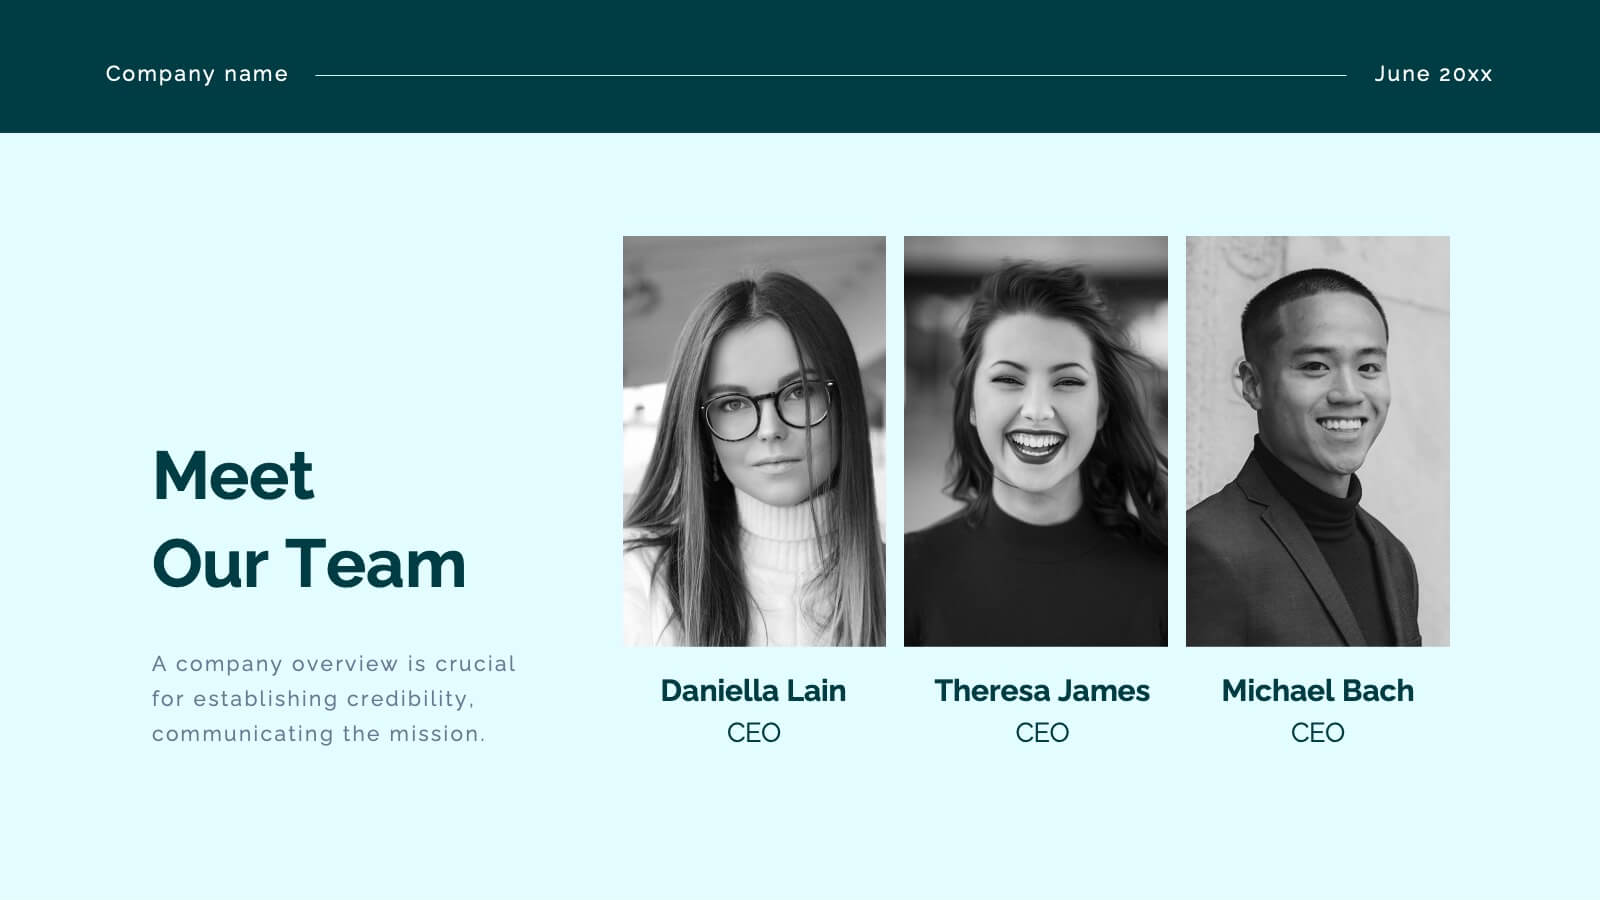
Crest Investor Pitch Presentation Presentation
Unleash your potential with this powerful pitch deck template! Tailored for presenting innovative business ideas, it features slides for company overview, market opportunity, competitive landscape, and financial projections. Clearly communicate your value proposition and impress investors with professional design and concise content. Compatible with PowerPoint, Keynote, and Google Slides for seamless presentations on any platform.


7 diapositivas
Business Pricing Table Slides Infographic
Streamline your product offerings with our Business Pricing Infographic, designed to clearly present pricing tiers and package options. This infographic is essential for sales teams, marketing professionals, and business owners to communicate value propositions to potential customers. Our Business Pricing Infographic allows for a clean, comparative view of different pricing plans, showcasing features, benefits, and cost-effectiveness at a glance. It includes customizable sections for various packages, making it easy to distinguish between basic, standard, and premium options. With this tool, you can highlight key differences and unique selling points of each package, aiding customers in making informed purchasing decisions. This SEO-friendly infographic is crafted to attract and educate potential buyers, providing them with transparent pricing information. Adopt this infographic in your marketing materials to facilitate a straightforward shopping experience, helping customers choose the right product that fits their needs and budget.


7 diapositivas
Environmental Specialist Infographic
An Environmental Specialist, is a professional who focuses on environmental issues and challenges, aiming to develop solutions and strategies to address them. This engaging infographic template is designed to shed light on the critical role of environmental specialists, presenting data, facts, and strategies to inspire and educate on the path towards a sustainable and eco-friendly world. Fully customizable and compatible with Powerpoint, Keynote, and Google Slides. This infographic is your guide to understanding and appreciating the invaluable work of environmental specialists.


12 diapositivas
Simple Gantt Chart Template Presentation
Track your project progress at a glance with this Simple Gantt Chart Template. Featuring color-coded circles for weekly task planning across two timelines, it’s perfect for visual project tracking. Easily customizable for PowerPoint, Keynote, or Google Slides. Ideal for quick updates, team syncs, and keeping your workflow organized.


7 diapositivas
Balance Sheet and Profit Overview Presentation
Give your financial summary a clean, modern look with the Balance Sheet and Profit Overview Presentation. This slide offers a dual-column layout with icons and space for six key financial metrics or business insights—ideal for summarizing assets, liabilities, profits, and more. Easily editable in Canva, PowerPoint, and Google Slides.


10 diapositivas
Cause and Effect Fishbone Presentation
Visualize root causes and streamline analysis with this Cause and Effect Fishbone infographic. Ideal for identifying issues across categories, it helps present logical flows clearly. Fully editable and perfect for business, strategy, or process improvement discussions. Compatible with PowerPoint, Keynote, and Google Slides for effortless customization.


7 diapositivas
PESTEL Framework Business Presentation
The "PESTEL Framework Business" presentation effectively utilizes a segmented color scheme to categorize different environmental factors impacting business strategy: Political, Economic, Social, Technological, Environmental, and Legal. Each segment is color-coded and designated space for text, making it easy to highlight how each factor can influence business operations and decision-making processes. This visual arrangement not only aids in easy comprehension but also allows for a systematic review of external factors, essential for strategic planning.


7 diapositivas
Goals Infographic Presentation Template
A goals infographic is a set of goals, objectives, or plans, often used for personal or organizational planning and development. This template allows you to include information about your specific goals, the steps required to achieve them, the timeline for completion, and any relevant metrics or targets. The purpose of our goals infographic is to help you provide a clear and concise overview of what is to be accomplished, and help you keep focus on achieving those goals. This well-designed infographic can help you prioritize and track progress, and can serve as a visual reminder.


26 diapositivas
Remote Work Best Practices Creative Presentation
Navigate the world of telecommuting with our Remote Work Best Practices presentation template, available for Powerpoint, Google Slides, and Keynote. This template is specially designed for the modern remote work environment, incorporating a blend of professional and engaging visuals that reflect the flexibility and innovation of working from home. The template features customizable slides for outlining communication tools, scheduling, and mental health tips. Whether you're onboarding new staff or refining your company's remote policies, this template will help you present a comprehensive guide to succeeding in the remote work landscape.


4 diapositivas
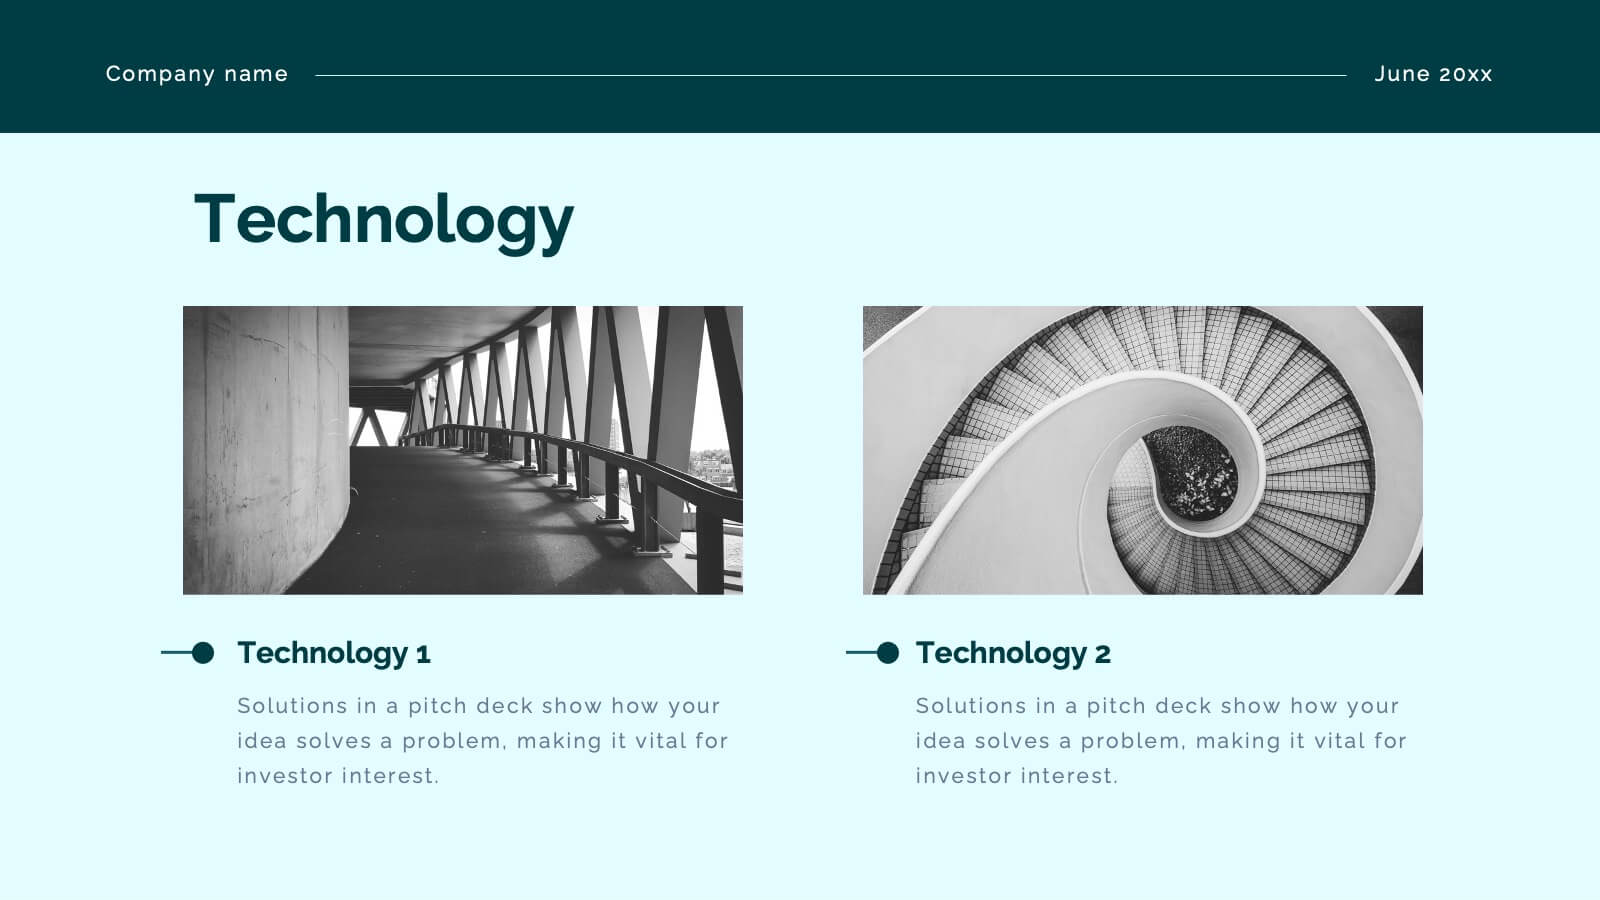
Corporate Portfolio of Achievements Presentation
Present your professional milestones with this sleek, image-focused layout. Featuring a large photo placeholder and three clearly defined highlights, this slide is ideal for showcasing company achievements or project phases. Fully editable in PowerPoint, Keynote, and Google Slides—perfect for client updates, internal reviews, or corporate storytelling.


4 diapositivas
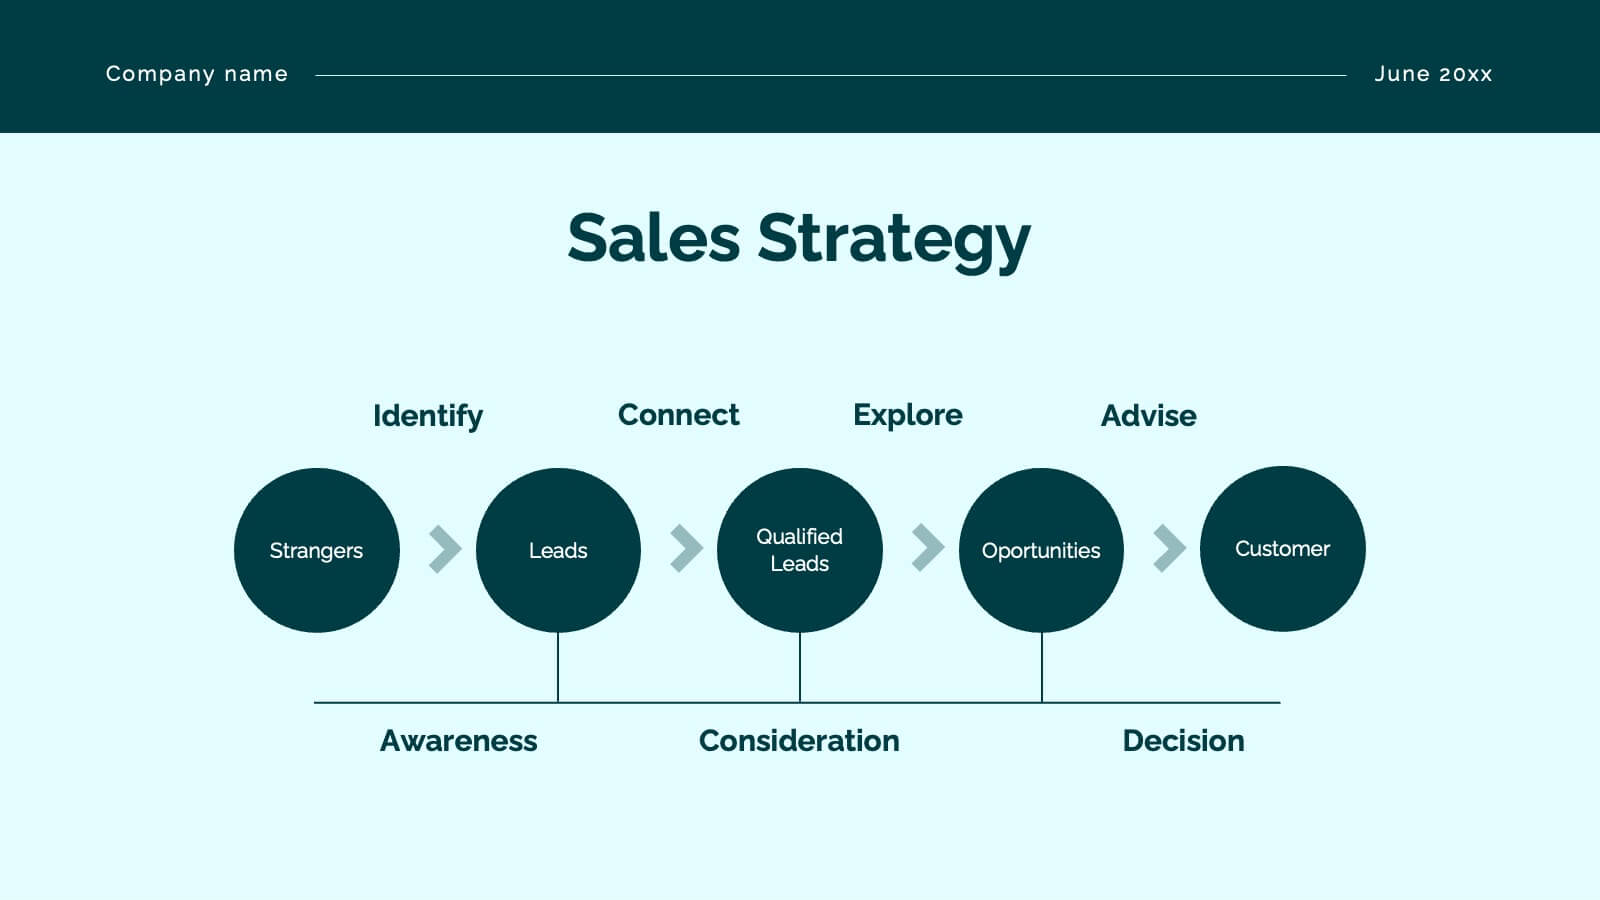
Business Communication Strategy
Visualize communication channels with this walkie-talkie themed strategy layout. Each section represents a key step in your communication plan—ideal for internal operations, team workflows, or stakeholder messaging. Easily editable in PowerPoint, Keynote, and Google Slides.


7 diapositivas
Editable Gantt Timeline Presentation
Stay on top of your project deadlines with this Editable Gantt Timeline Presentation. Designed with a clean monthly layout and six task rows, it makes scheduling and tracking progress simple. Customize task names, durations, and icons easily. Perfect for PowerPoint, Keynote, or Google Slides for professional project planning.


7 diapositivas
Corporate Sustainability Management
Visualize your sustainability priorities with this hexagon-based framework slide, designed to highlight areas like environmental impact, health, welfare, and ethical governance. Ideal for CSR reporting, ESG strategy sessions, or internal sustainability initiatives. Easy to customize in PowerPoint, Keynote, and Google Slides.