


Características


¿Tienes alguna pregunta?
Recomendar


7 diapositivas
Construction Management Infographic Presentation
A Construction Infographic is a visual representation of data related to the construction industry and processes. This templates uses colorful construction illustrations to presents data, statistics, and other information in a visually appealing way. You can uses this to cover a wide range of topics, including project timelines, budget breakdowns, safety statistics, materials usage, sustainability practices, and more. This infographic uses illustrations, icons, text boxes and other visual elements to help convey your information. This can be easily edited in Powerpoint, Keynote and Google Slides.


3 diapositivas
Work from Home Setup and Productivity Plan Presentation
Ready to supercharge your productivity from your kitchen table to your couch office? This visual template helps you map out ideal remote work setups, task plans, and daily focus routines. Organize workspace essentials and time blocks in a clean, engaging format. Fully compatible with PowerPoint, Keynote, and Google Slides.


5 diapositivas
Business Overview and Highlights Summary
Summarize your company’s key milestones with this Business Overview and Highlights Summary slide. Featuring a clean layout with a bold briefcase visual and four spotlight areas, it’s ideal for showcasing achievements. Fully editable in PowerPoint, Keynote, and Google Slides.


6 diapositivas
TAM SAM SOM Market Infographic
TAM, SAM, and SOM are terms used in business and marketing to represent different levels of market potential and segmentation. This Infographic is a visual representation that explains the concepts of Total Addressable Market (TAM), Serviceable Available Market (SAM), and Serviceable Obtainable Market (SOM) in the context of business and market analysis. This template will encourage your audience to share this infographic to help make informed decisions about market strategies and growth potential. Compatible with Powerpoint, Keynote, and Google Slides. Summarize the benefits of the TAM SAM SOM in market analysis concepts.


4 diapositivas
Property Investment and Housing Report Presentation
Present your Property Investment and Housing Report with this structured real estate-themed presentation template. Featuring a house-shaped design with ascending financial metrics, this layout is perfect for illustrating market trends, investment growth, and housing analysis. Ideal for real estate agents, property developers, and financial analysts, this template makes data visually engaging and easy to understand. Fully customizable and compatible with PowerPoint, Keynote, and Google Slides.


10 diapositivas
Process Flow Chart Presentation
Visualize your process with clarity using the Process Flow Chart Presentation. Featuring a central hexagon design branching out into four sequential steps, this layout is perfect for showcasing workflows, procedures, or business strategies. Color-coded options and dark/light theme variations add versatility. Fully customizable in PowerPoint, Keynote, and Google Slides.


12 diapositivas
AI and Innovation Technology Presentation
Visualize layered intelligence with this AI and Innovation Technology Presentation. Featuring a dynamic 3D stack layout with five labeled layers and downward data-flow arrows, this slide is ideal for presenting system architecture, AI pipelines, or innovation frameworks. Great for startups, IT teams, and R&D updates. Fully customizable in PowerPoint, Keynote, and Google Slides—includes light and dark mode options for modern appea


8 diapositivas
Concept Mapping with Bubble Map Presentation
Create a visually engaging Concept Mapping with Bubble Map presentation to organize ideas, processes, or strategies effectively. This customizable template enhances clarity in brainstorming sessions, strategic planning, and educational content. Compatible with PowerPoint, Keynote, and Google Slides.


8 diapositivas
Tech Product Showcase Mockup Presentation
Highlight your mobile or app-based product with this sleek tech showcase slide. Featuring a realistic smartphone mockup alongside three content sections, it's perfect for presenting app features, service tiers, or UI comparisons. Fully customizable in PowerPoint, Keynote, or Google Slides to suit tech startups, product demos, or marketing presentations.


7 diapositivas
Digital Marketing Services Infographic
A Digital Marketing Services Infographic is a visual representation of information and data related to digital marketing services. This template is a type of graphic design that presents complex or large amounts of information in a simple and informative way. This infographic includes statistics, charts, graphs, and other visual elements to convey your information about various aspects of digital marketing, such as social media marketing, content marketing, search engine optimization, email marketing, and paid advertising. Compatible with Powerpoint, Keynote and Google Slides.


6 diapositivas
Startup Investors Pitch Deck Presentation
Inspire confidence and spark investor interest with the Startup Investor Pitch Deck Presentation. Featuring a creative visual of a rocket launching from a piggy bank, this slide is ideal for illustrating funding momentum, business growth, or financial milestones. Each section allows space to highlight critical investment points such as traction, market opportunity, financials, and team highlights. Fully customizable in PowerPoint, Keynote, or Google Slides, this pitch-ready layout is perfect for entrepreneurs, startup founders, and innovation teams aiming to deliver a memorable and professional presentation.


20 diapositivas
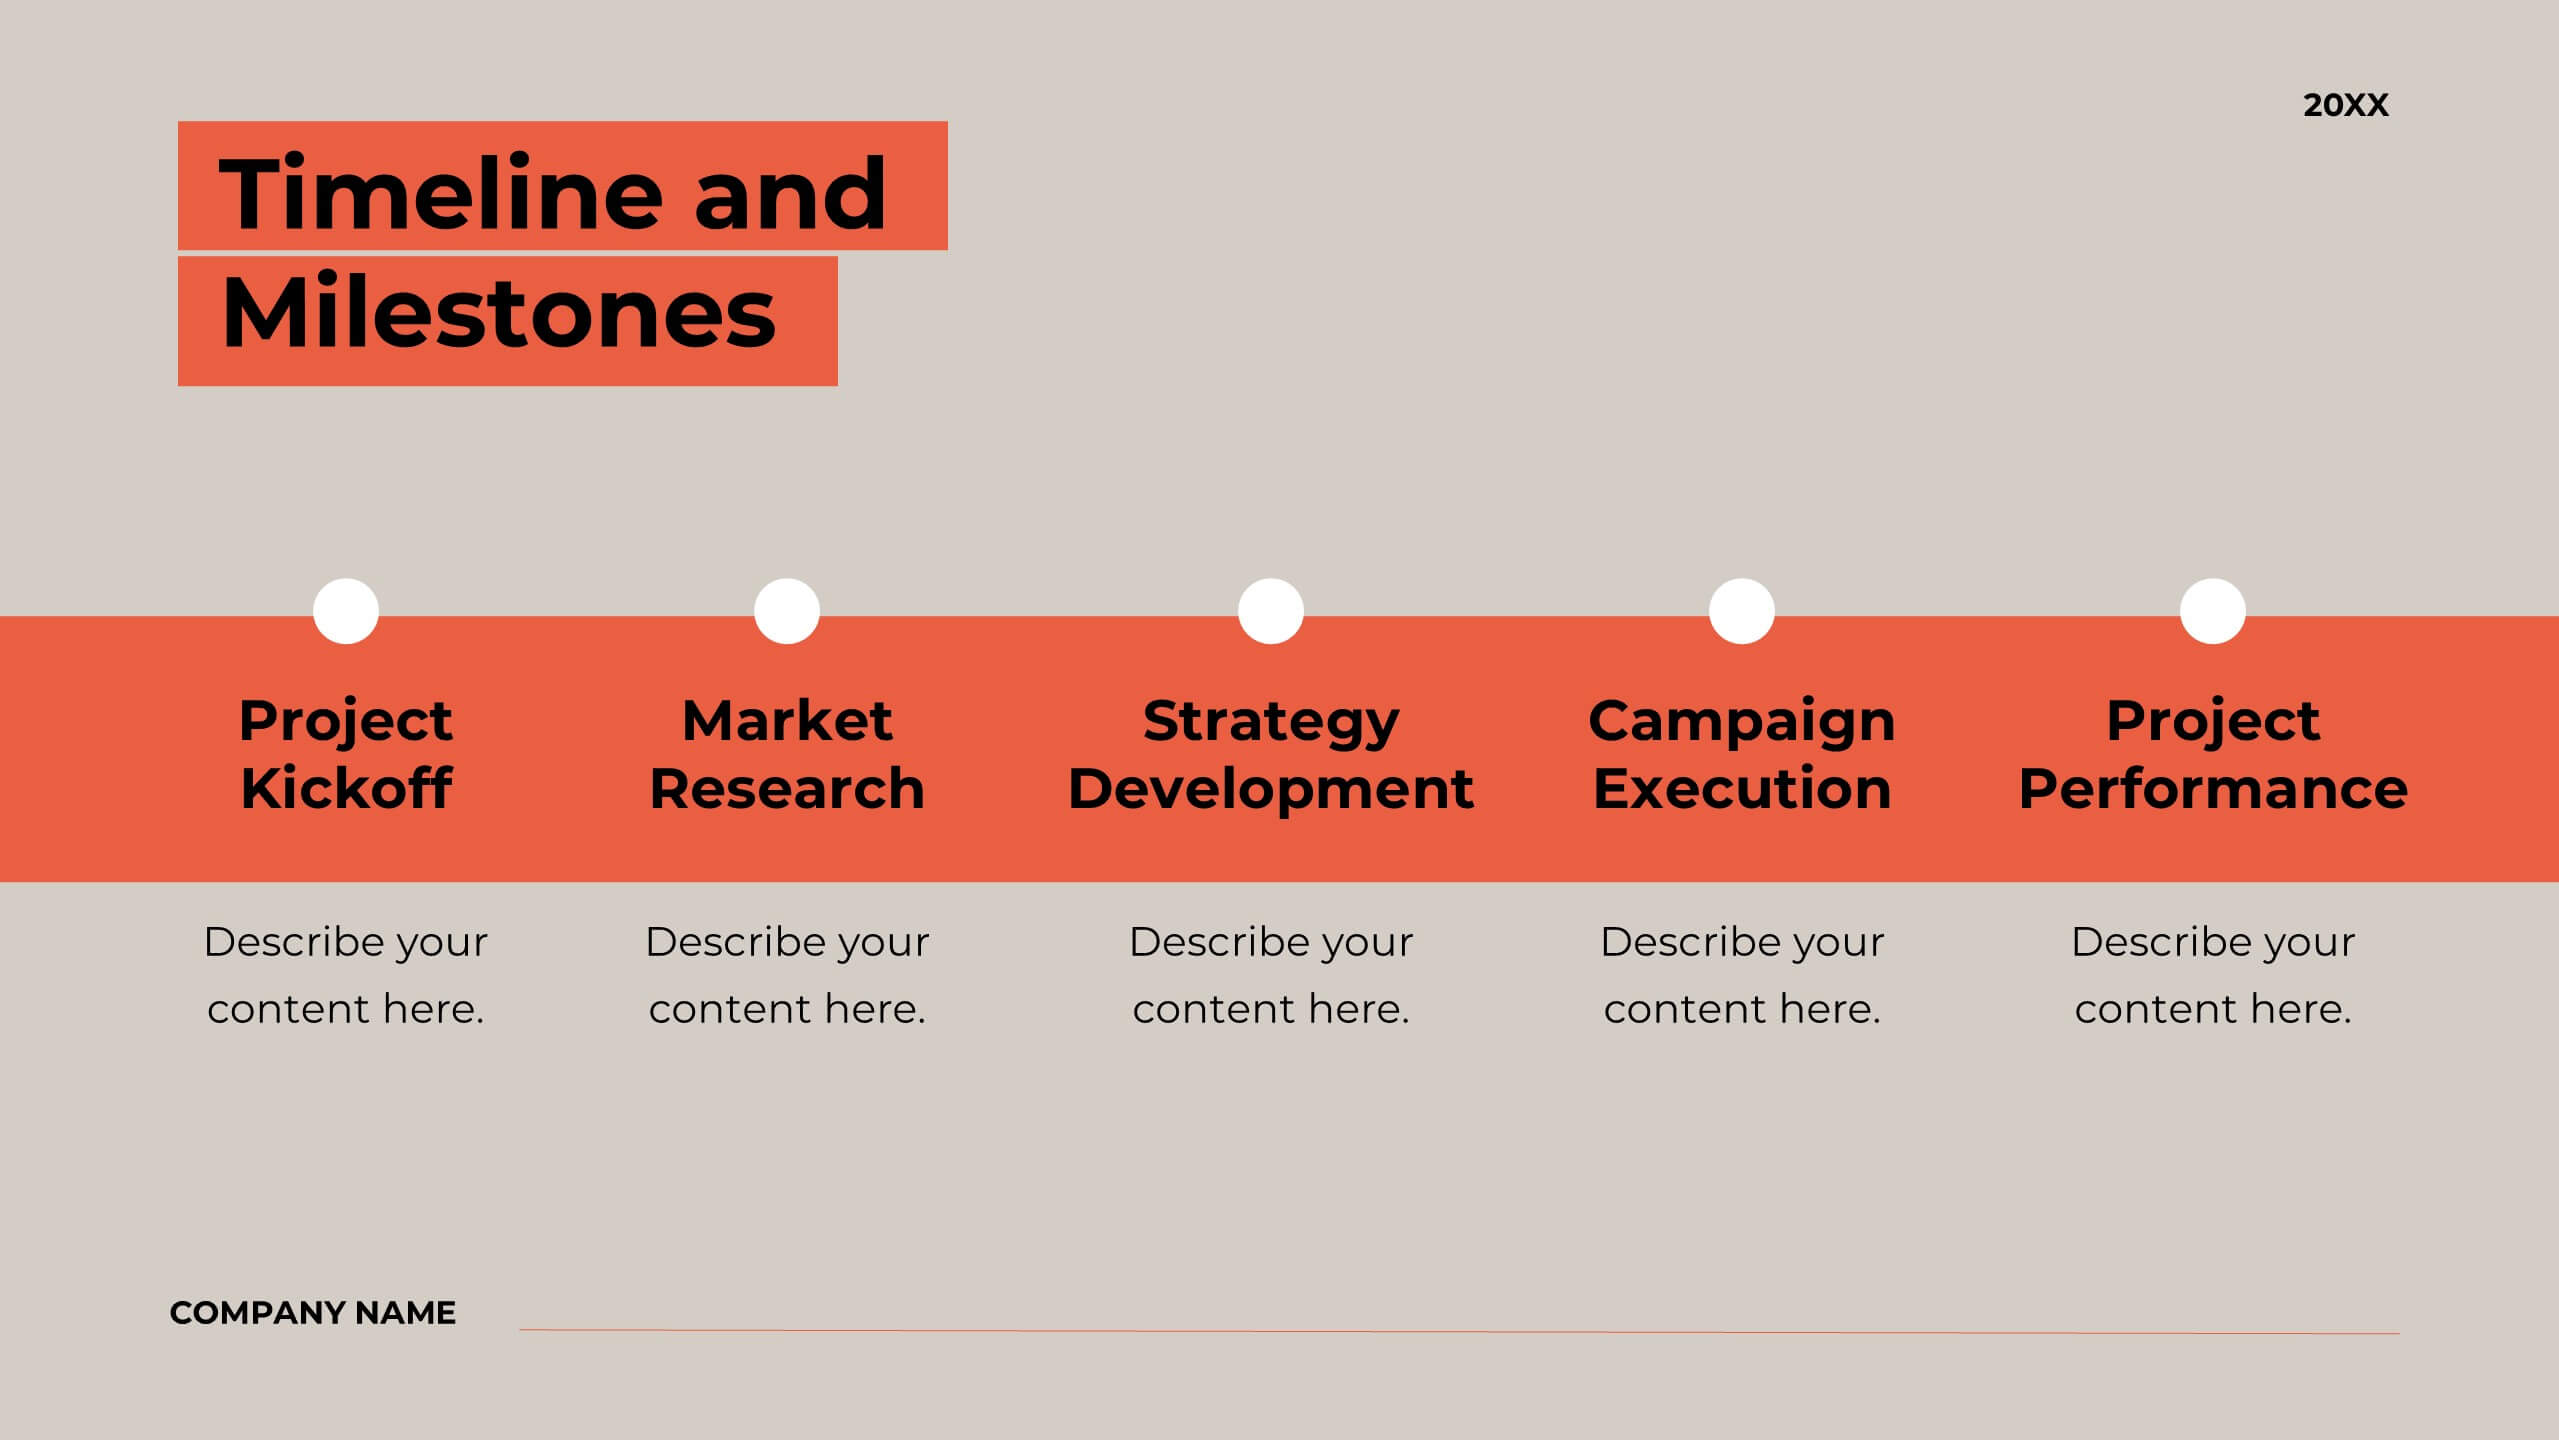
Bentom Marketing Proposal Presentation
This marketing proposal template is crafted to communicate your strategy with impact. With sections covering company overview, project summary, objectives, methodology, budget breakdown, and deliverables, it provides a professional layout for presenting key details to clients. Tailor it to fit your needs, and present confidently using PowerPoint, Keynote, or Google Slides.


5 diapositivas
Ideal Customer Profile Breakdown
Shine a light on your perfect customer with this bright, idea-inspired layout—designed to guide you through the essential traits, needs, and behaviors that define your ideal client. Perfect for marketing strategy, sales enablement, or persona creation. Fully compatible with PowerPoint, Keynote, and Google Slides.


4 diapositivas
Interlocking Puzzle Chart Design Presentation
Unlock big ideas with a visual design that clicks your concepts together like a seamless 3D puzzle. This presentation makes it easy to explain connected processes, relationships, or strategic components in a clean, engaging way. Perfect for business, planning, and team alignment. Fully compatible with PowerPoint, Keynote, and Google Slides.


7 diapositivas
Pyramid Scheme Infographic Presentation
A Pyramid Infographic is a great way to organize, highlight, and illustrate your ideas and content. This design uses visual hierarchy and colors to convey key information in an attractive way. The Pyramid incorporates colorful diagrams to allows your text to stand out while it is set against a white background. This is a simple, engaging design that can be easily edited. This is great for analyzing data and it is the perfect choice to impress the audience. It will surely help you convey your message in a much better way. It's a great way to communicate the key points of your Infographic.


5 diapositivas
The History of Beer Infographics
Beer has a long and fascinating history that dates back thousands of years, throughout its history beer has played a significant role in social, cultural, and economic contexts. These engaging infographics take viewers on a journey through the fascinating history of beer. It provides a comprehensive overview of the origins, evolution, and cultural significance of beer throughout different eras and regions. This visual resource is perfect for beer enthusiasts, historians, and anyone interested in the cultural and historical aspects of this beloved beverage. Compatible with Powerpoint, Keynote, and Google Slides.


10 diapositivas
Leadership and Organizational Vision Presentation
Showcase your company’s path to growth and alignment with this sleek Leadership and Organizational Vision slide. The diamond-shaped infographic flow is perfect for outlining mission pillars, executive strategies, or value-driven goals across five stages. Each section includes icons and editable descriptions for clarity and engagement. Ideal for strategic planning sessions, team briefings, or executive reports. Fully customizable in PowerPoint, Keynote, and Google Slides for seamless integration into your presentation.