


Características


¿Tienes alguna pregunta?
Recomendar


6 diapositivas
Vision to Execution Business Strategy Presentation
Bridge the gap between strategic vision and operational execution with this visual funnel-style template. Ideal for mapping high-level goals to tactical outcomes, this slide helps communicate transformation processes, business initiatives, or product strategies. Fully editable in PowerPoint, Keynote, or Google Slides for strategic planning, leadership sessions, or roadmap presentations.


7 diapositivas
Governance Infographics Presentation Template
Our Governance Infographic is designed to present complex information in an easy-to-understand format that is accessible to a wide audience. This template gives you the opportunity to create an infographic that is easy on the eye, but thorough and detailed enough to make sure all the points are covered. This template includes 7 slides that present a comprehensive framework for monitoring and evaluating a company's governance, risk management, and compliance programs. Packed with great content, this presentation tells the story of your governance system. Get started easily by adding your text!


24 diapositivas
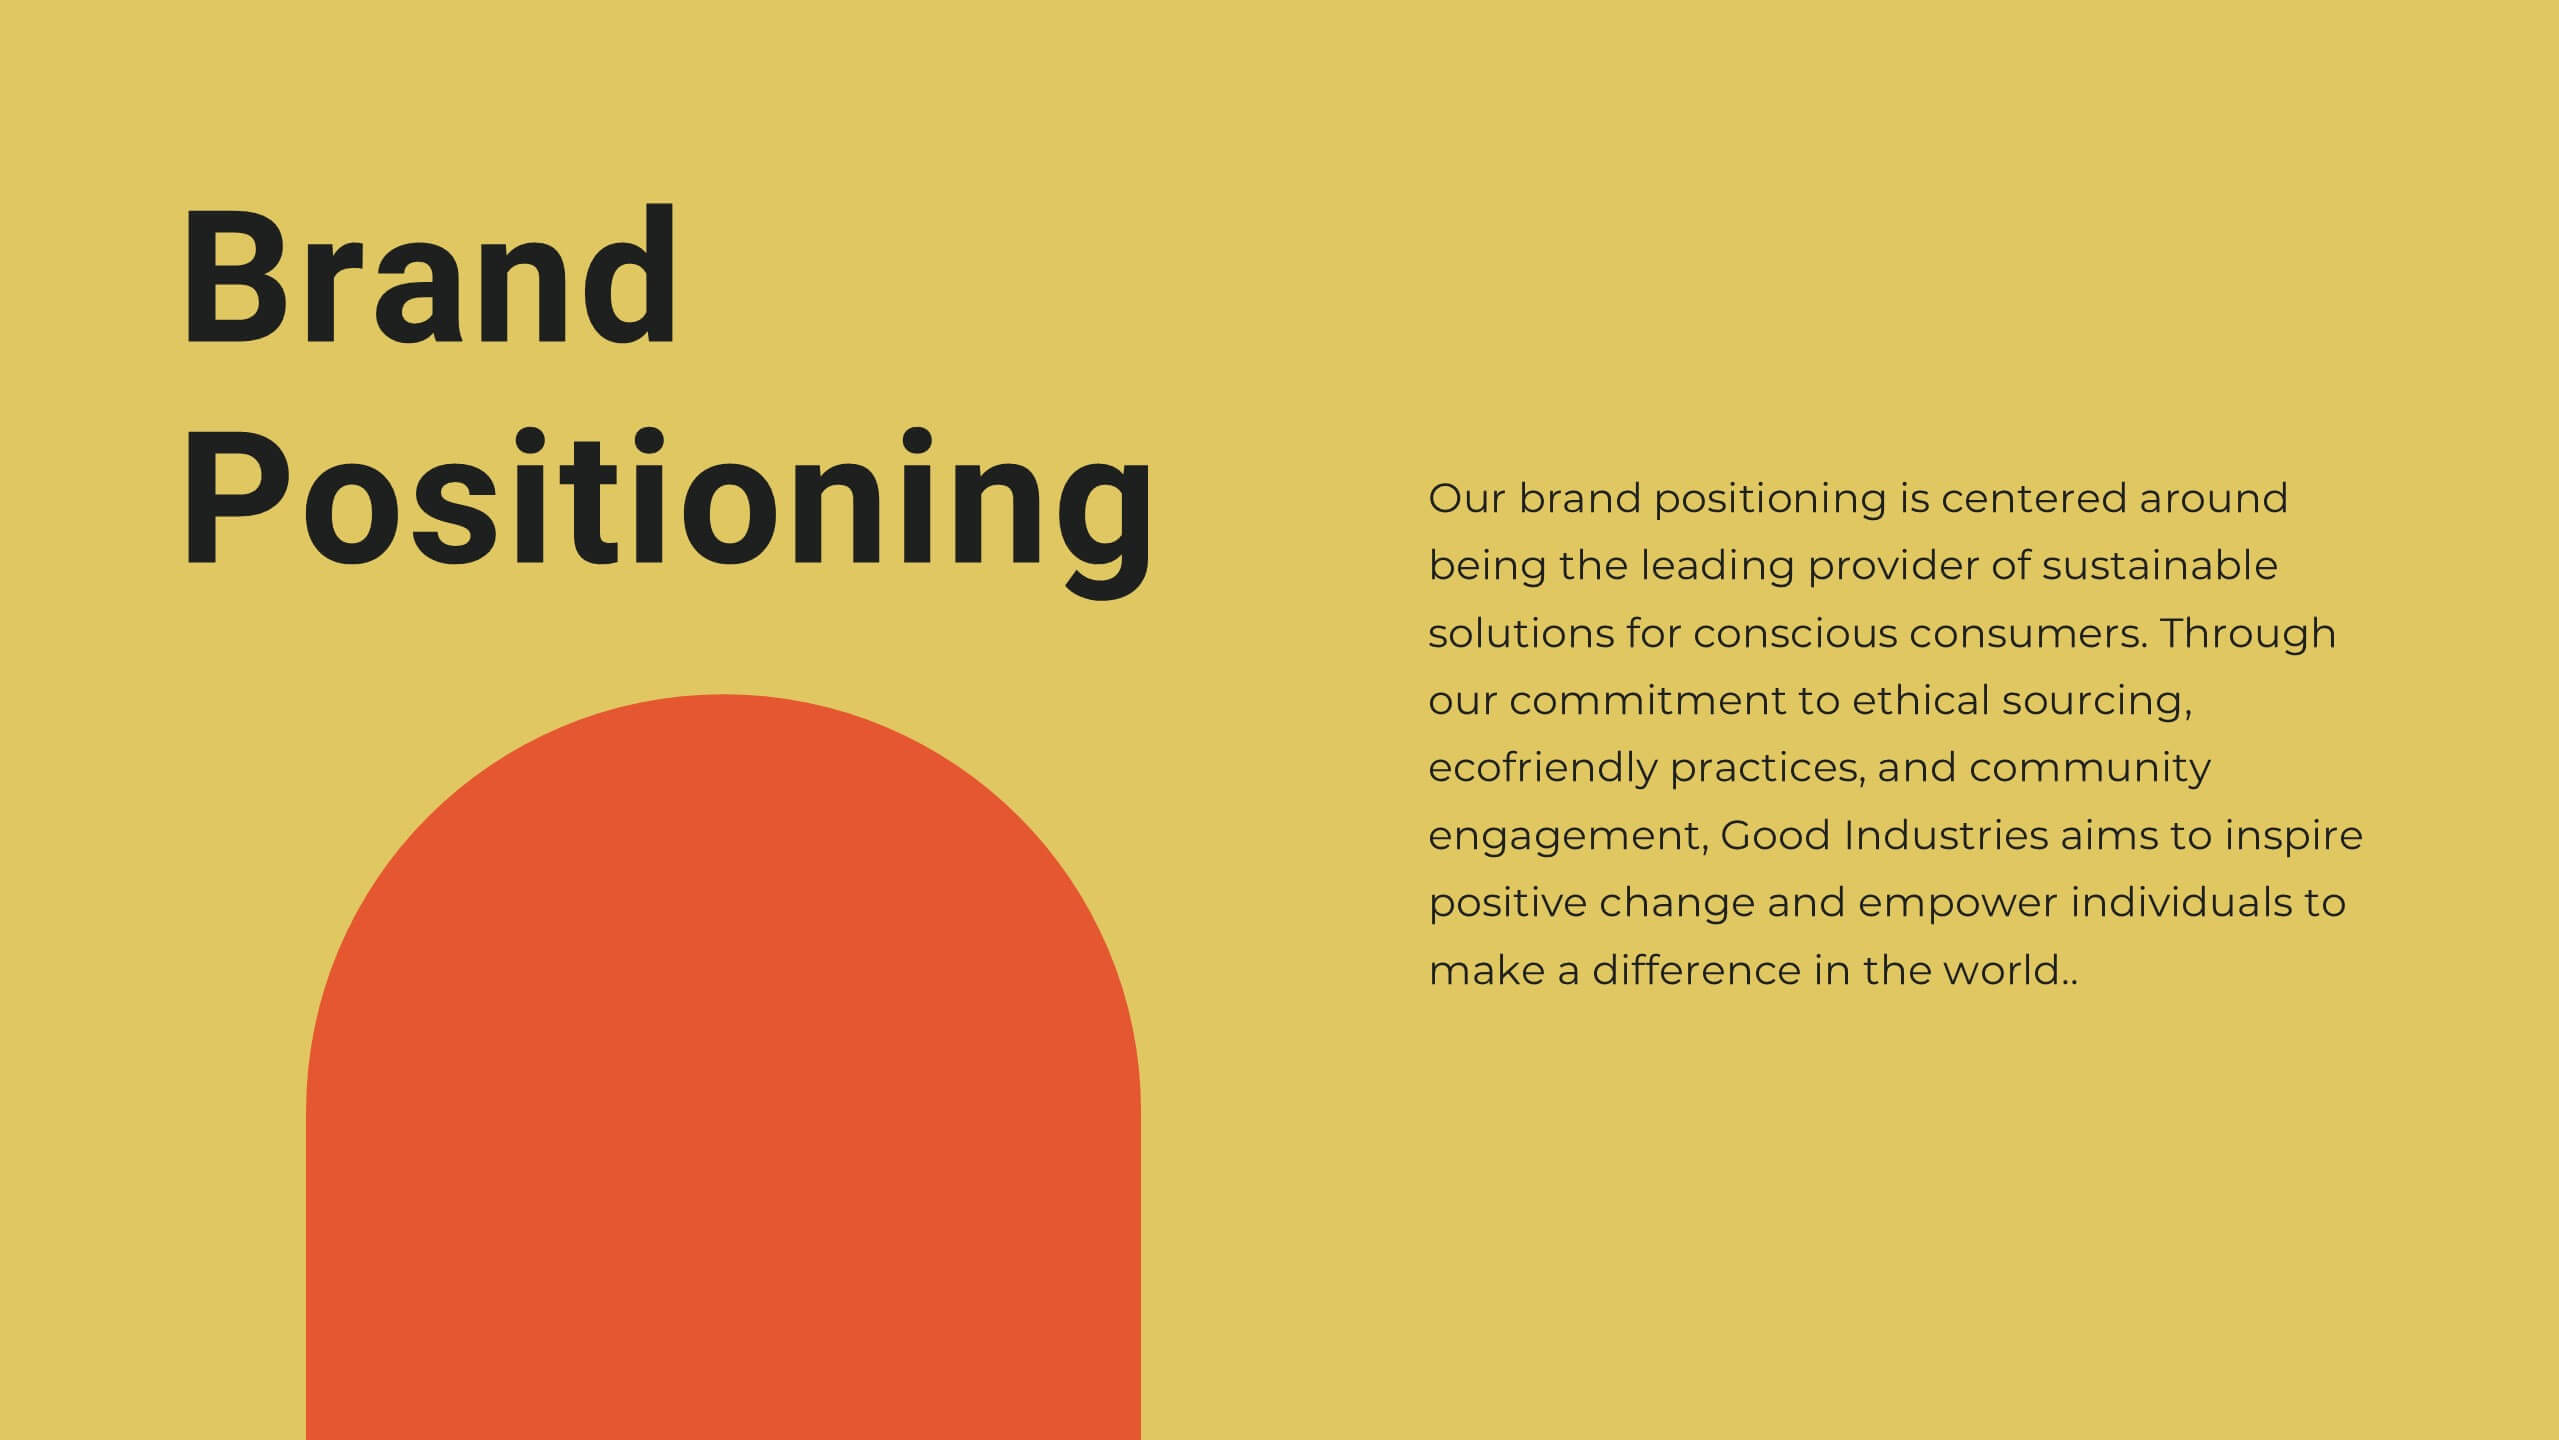
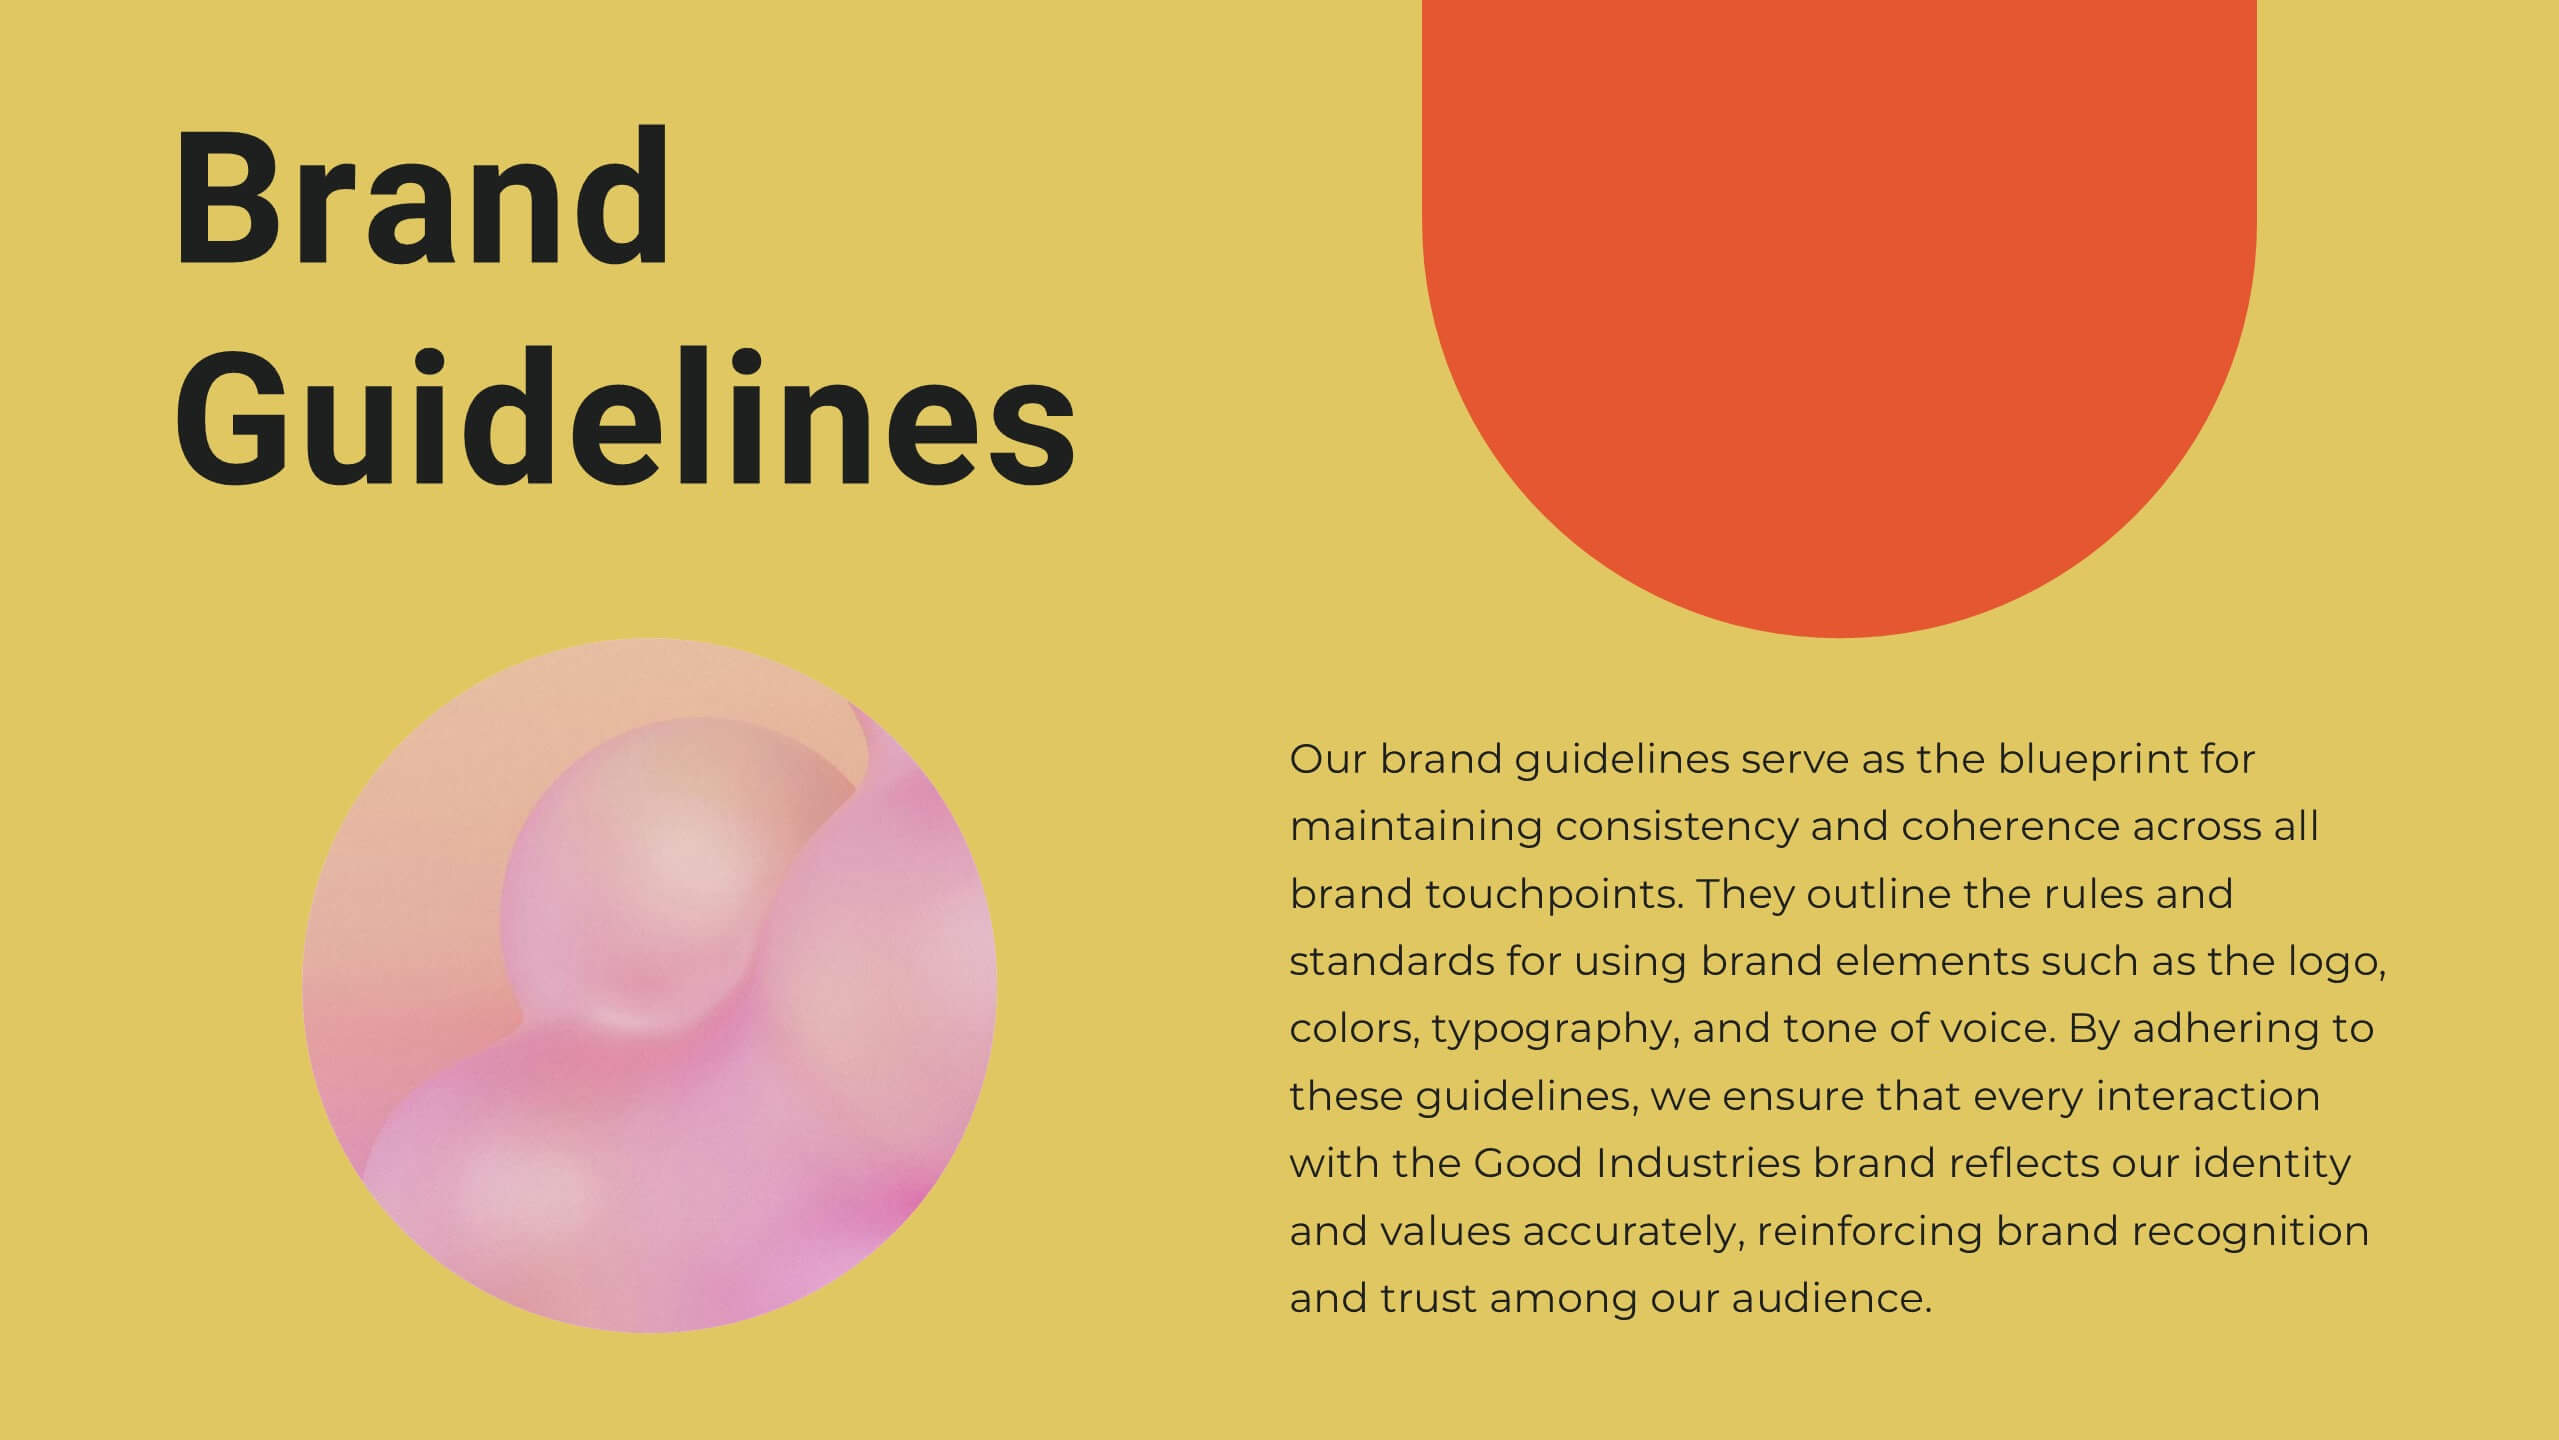
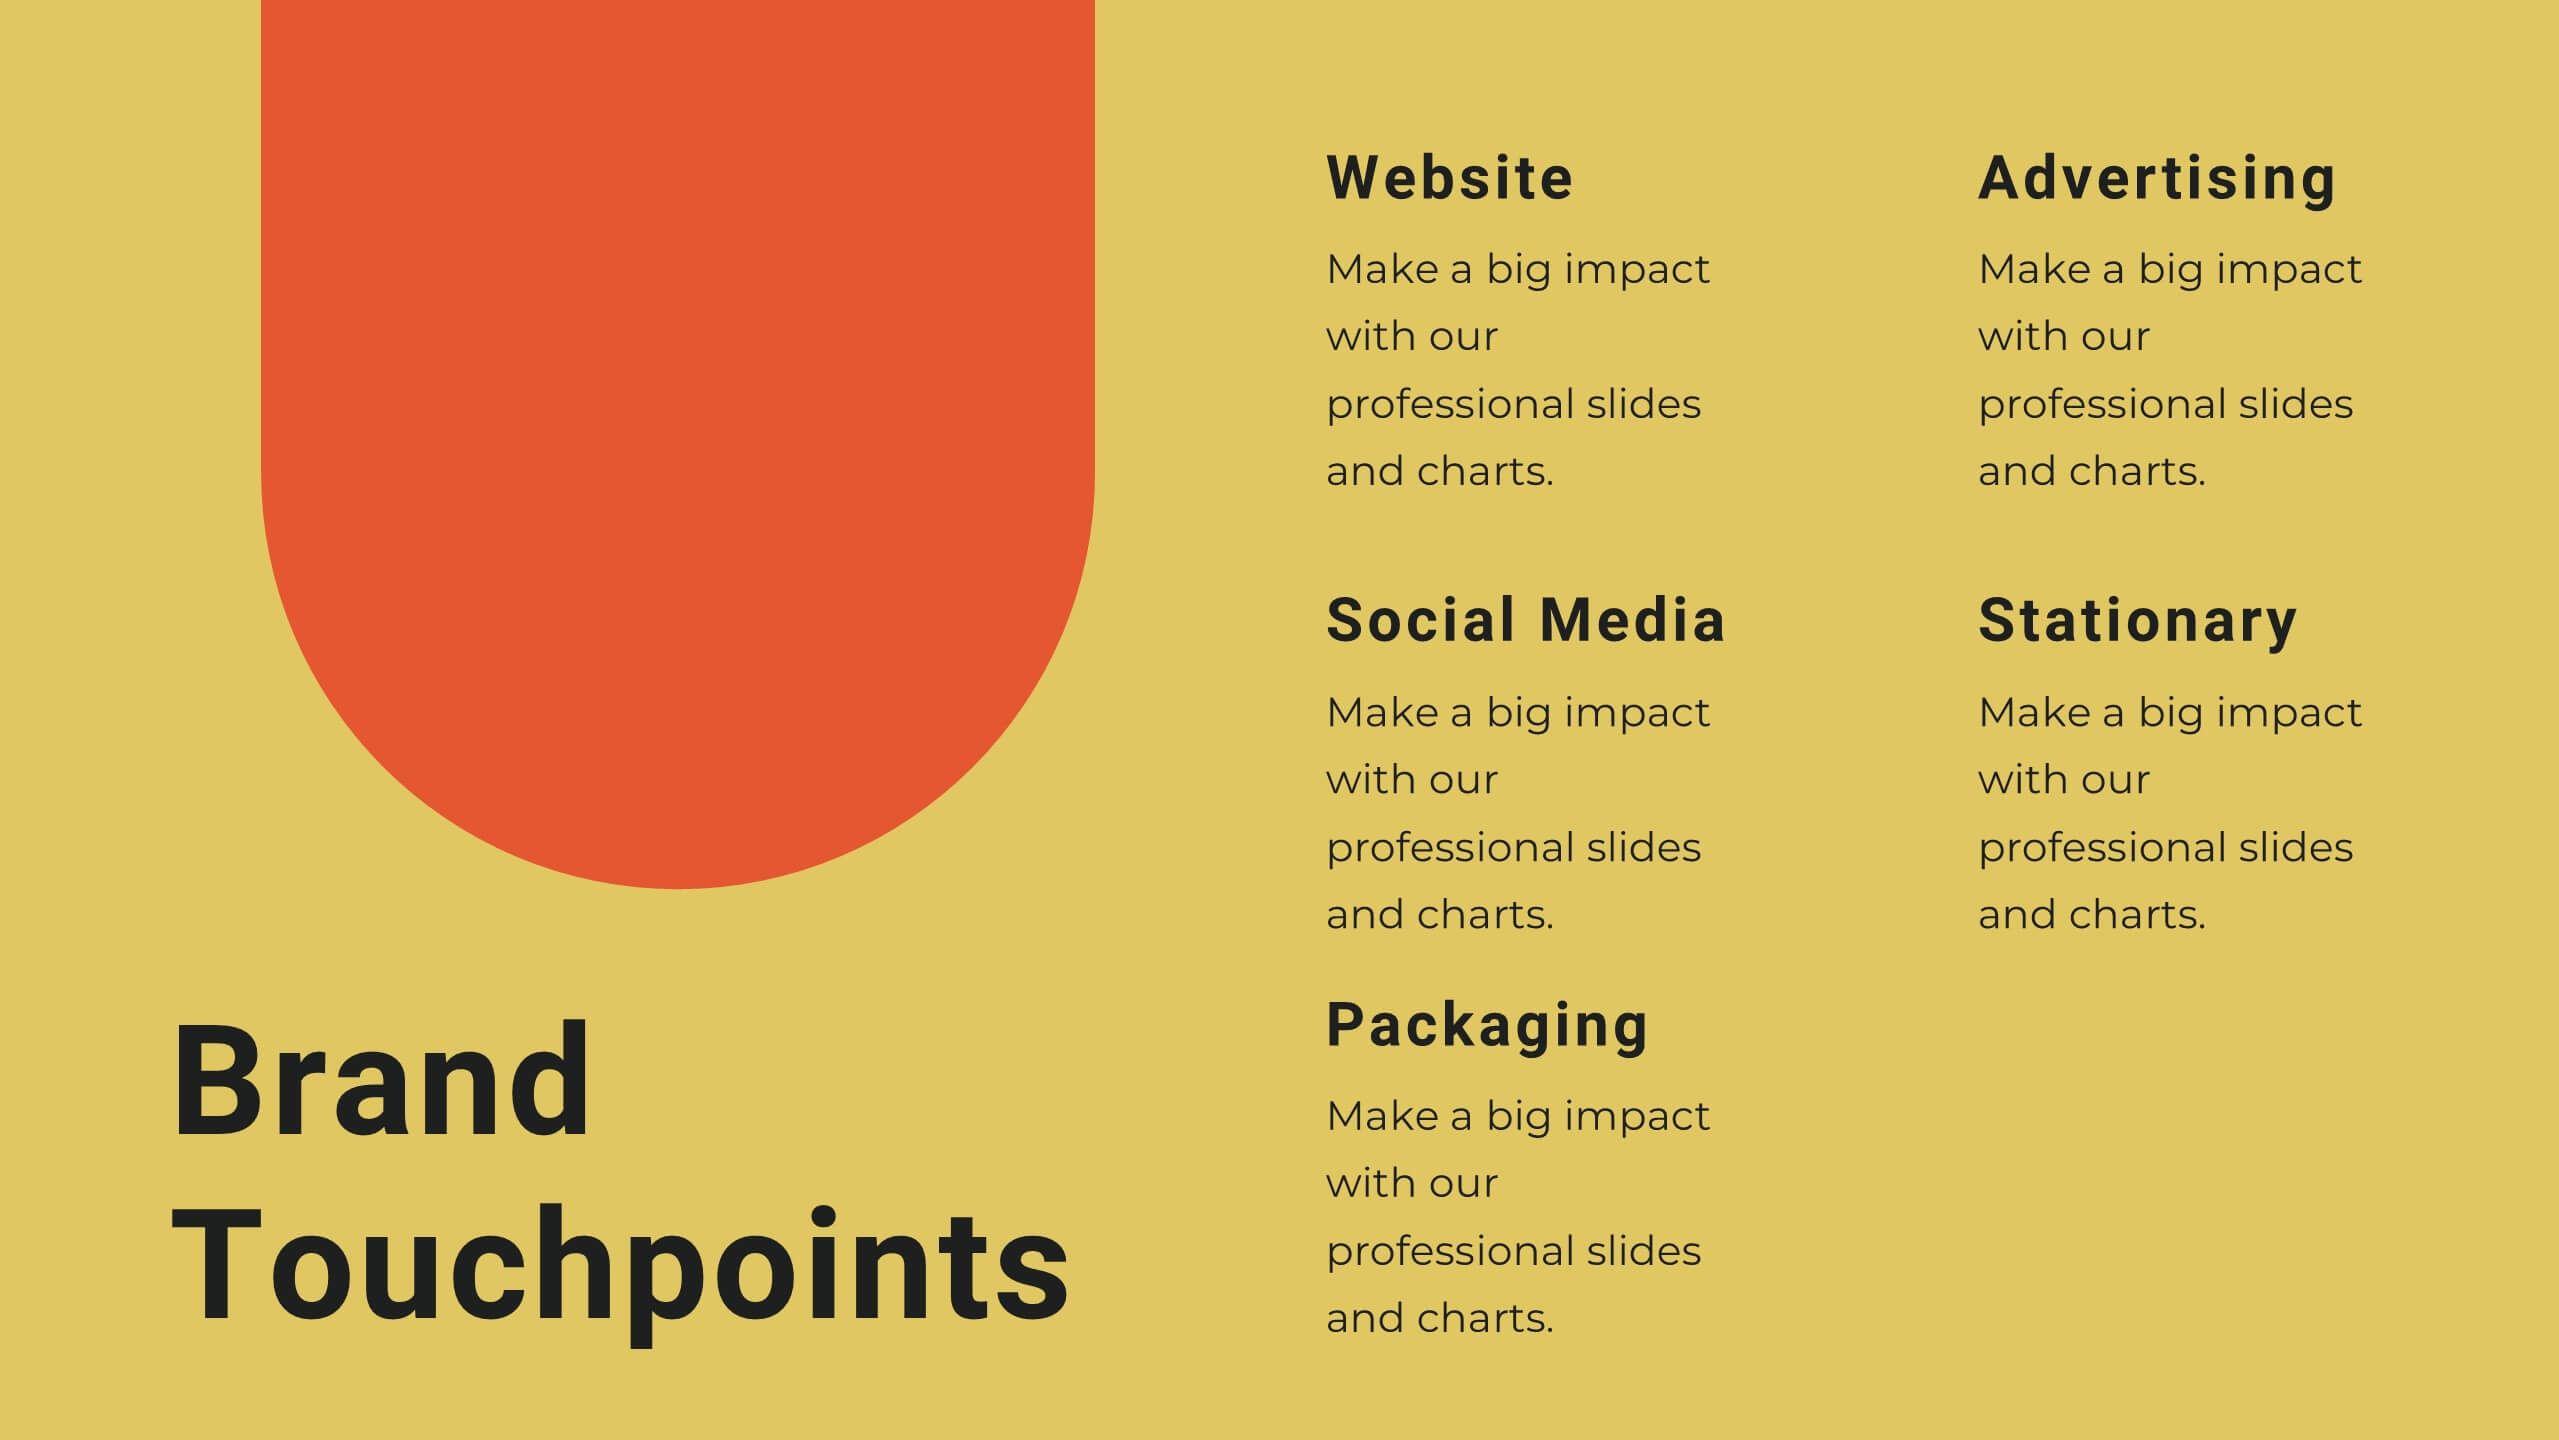
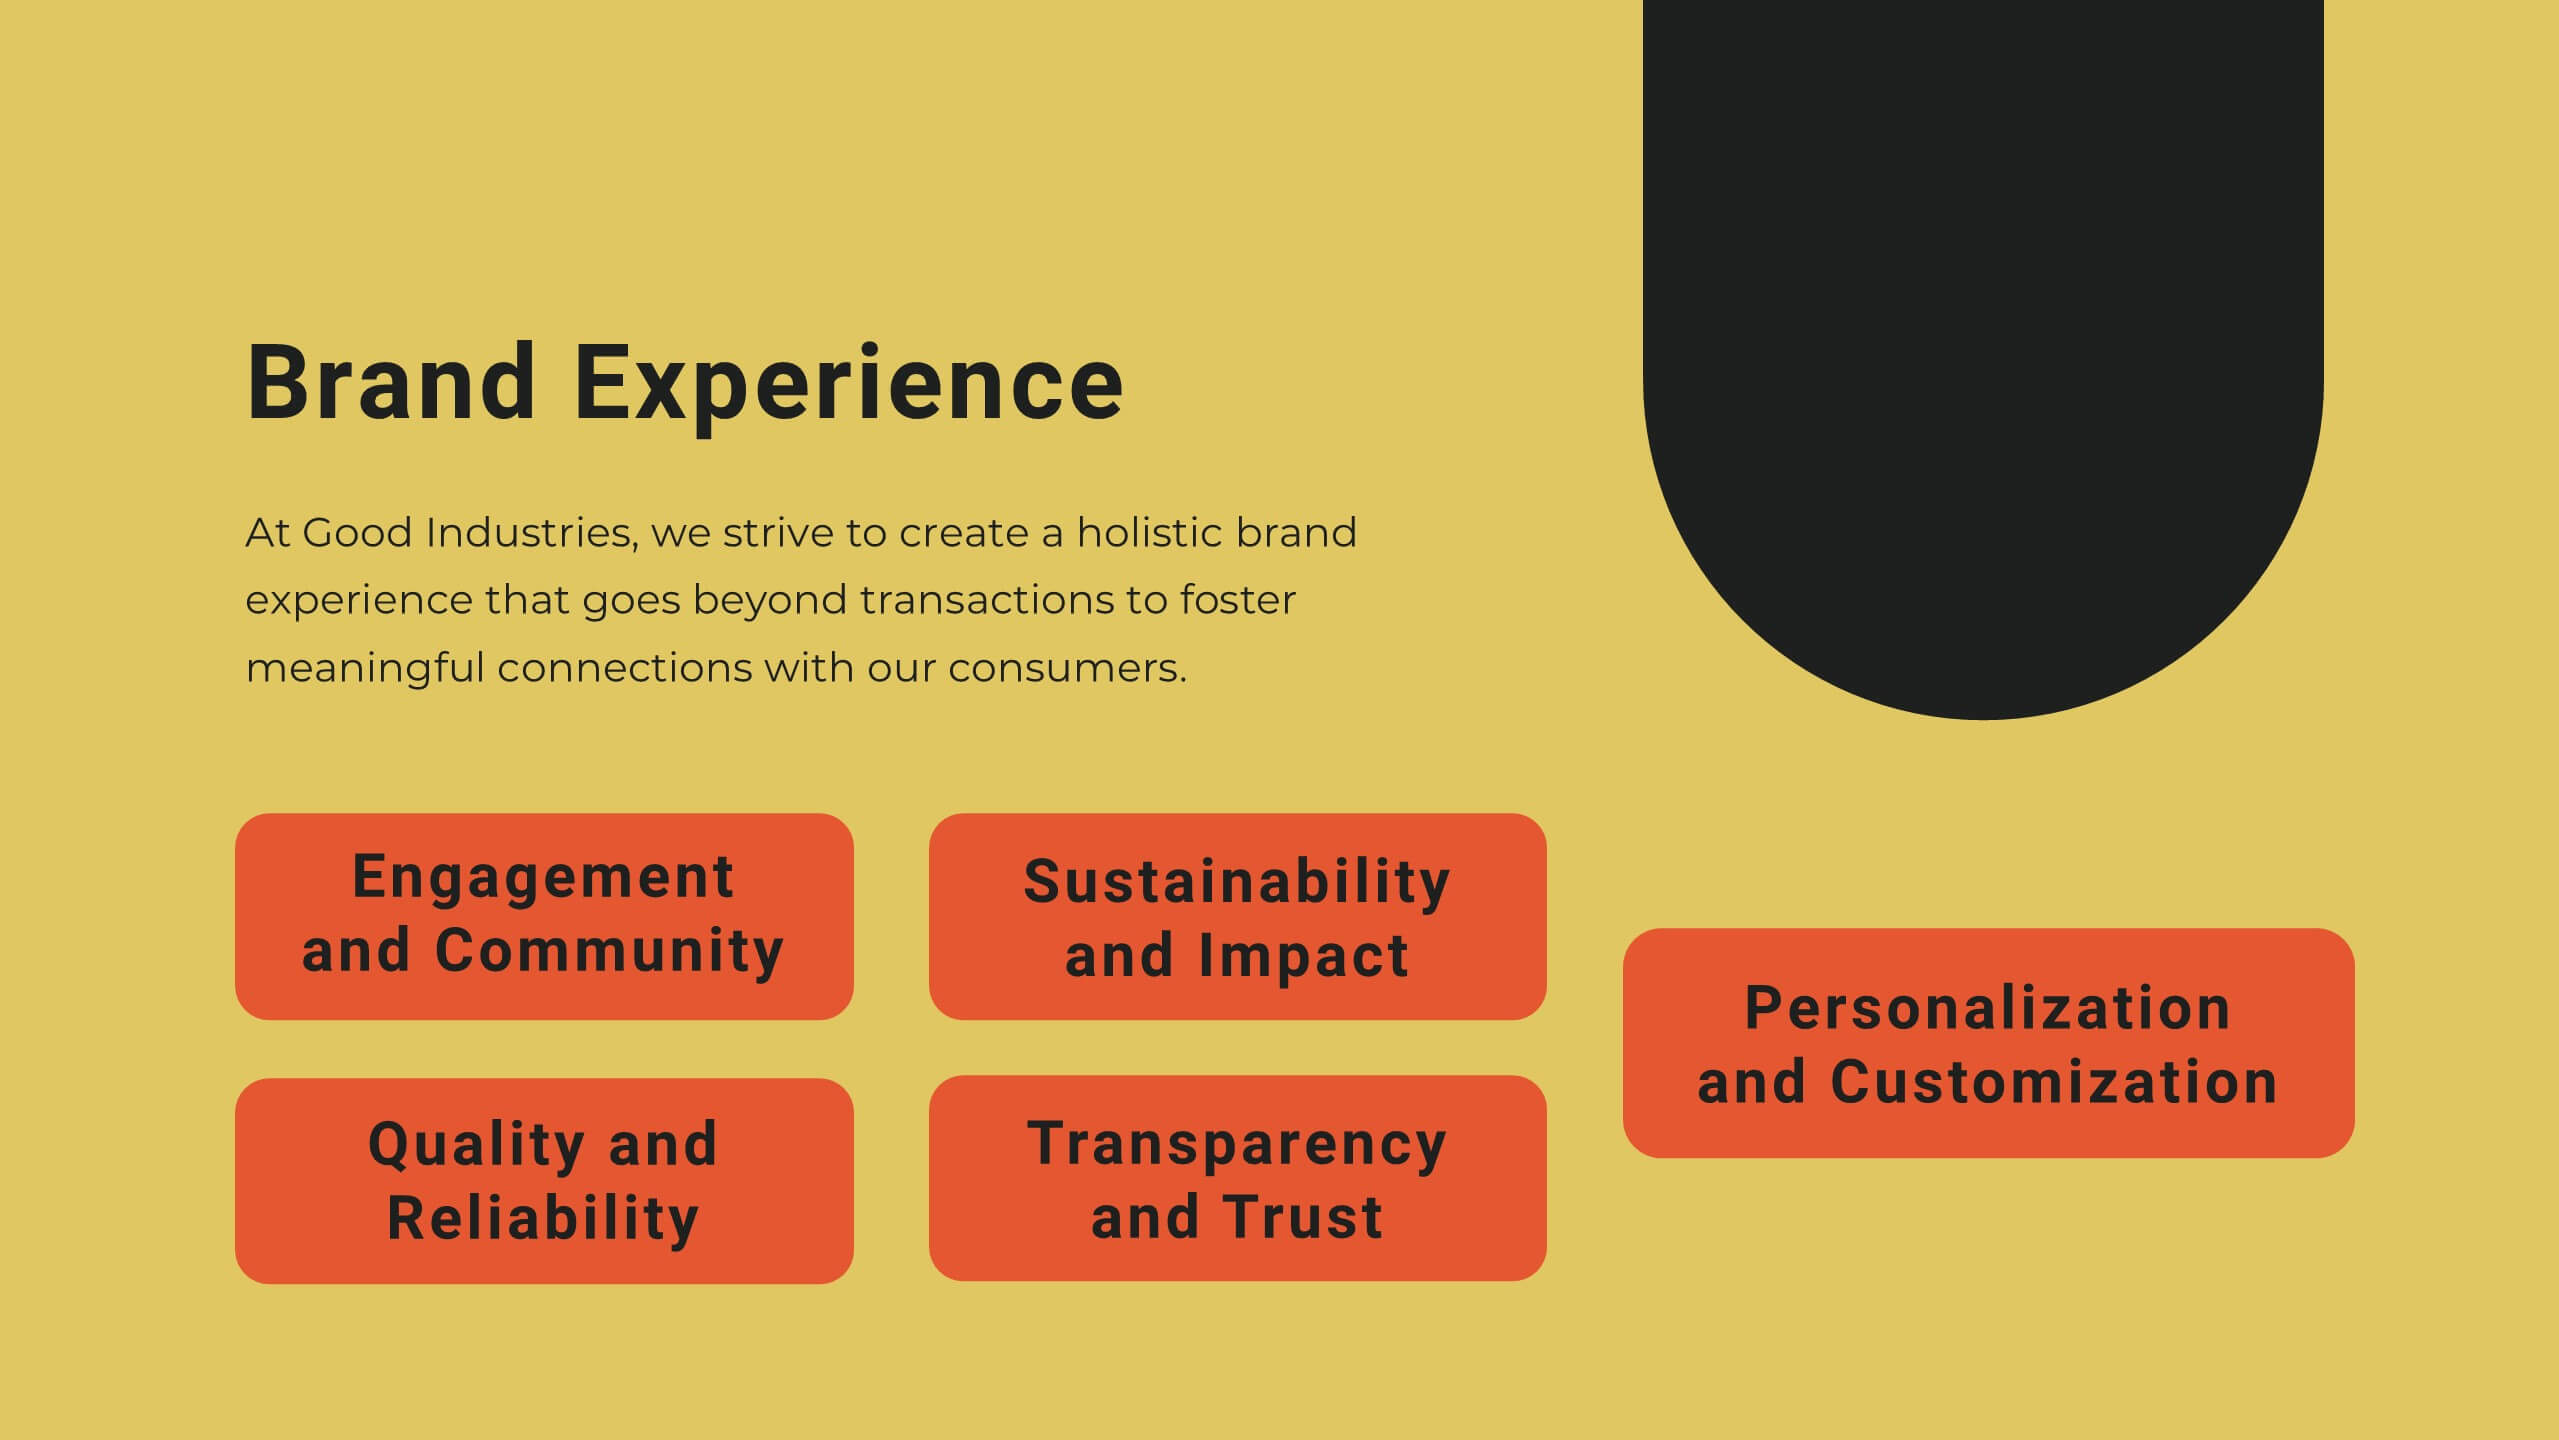
Brand Overview Presentation
Enhance your brand storytelling with our Brand Presentation template. Perfect for showcasing brand vision, values, and strategies, this template includes diverse slides for audience targeting and brand touchpoints. Suitable for all professional settings, it's compatible with PowerPoint, Keynote, and Google Slides.


6 diapositivas
Session-by-Session Agenda Breakdown Presentation
Easily outline and compare multiple sessions with this Session-by-Session Agenda Breakdown presentation. Designed to group agenda topics and supplementary content side by side, this layout is perfect for workshops, summits, or recurring meetings. Fully editable in Canva, PowerPoint, and Google Slides for seamless branding and customization.


26 diapositivas
Farming Company Profile Creative Presentation
Step onto the fertile grounds of the farming company landscape, where green fields stretch to the horizon and the golden sun promises a bountiful harvest. With a canvas painted in rich green and sunlit yellow, our template captures the heart and soul of farming life. Adorned with colorful farm-centric graphics, rustic icons, and evocative image placeholders, it's a visual ode to the age-old tradition of agriculture. Meticulously tailored for Powerpoint, Keynote, or Google Slides. Perfect for farming entrepreneurs, agricultural businesses, or anyone rooted in the rich soil of cultivation. Sow your ideas; watch your farming story grow.


4 diapositivas
Historical Event Timeline Presentation
Visualize your timeline with this Historical Event layout, ideal for showcasing progress, milestones, or key moments over time. Featuring a horizontal design with date markers and icons, it’s perfect for history, education, or project recaps. Fully editable in PowerPoint, Keynote, and Google Slides to match your content and branding.


26 diapositivas
Entrepreneurship 101 Professional Presentation
This template offers a modern, professional framework for presentations about Entrepreneurship 101. It combines a clean, contemporary design with a palette of cool blues and muted reds, setting a tone that's both creative and serious—just right for the innovative spirit of entrepreneurship. Within its slides, you'll find all the tools needed to outline the essentials of starting a new business, from identifying opportunities to understanding market trends. Perfect for aspiring entrepreneurs, business school classes, or startup workshops, the template includes varied slide types: team introductions, big ideas, comparative analyses, and growth charts. The slides also feature infographics for brainstorming sessions, process flows for business operations, and timeline representations for strategic planning. Designed for adaptability, the template works seamlessly with PowerPoint, Keynote, and Google Slides, ensuring your entrepreneurial vision can be shared with clarity and impact.


8 diapositivas
End-to-End Supply Chain Optimization
Enhance your supply chain efficiency with this dynamic circular diagram slide. Ideal for logistics experts, supply chain strategists, and consultants, this template visually captures the continuous flow of an 8-step supply chain cycle. Each step is customizable with editable icons and text in PowerPoint, Keynote, and Google Slides.


7 diapositivas
Business Networking Strategy Presentation
Build strong business connections with this Business Networking Strategy template. Featuring a circular segmented diagram, this slide helps illustrate key networking approaches, strategic partnerships, and relationship-building techniques in an easy-to-understand format. Ideal for entrepreneurs, business developers, and corporate leaders, this fully editable slide is compatible with PowerPoint, Keynote, and Google Slides.


3 diapositivas
Breakthroughs in Biology and Chemistry Presentation
Highlight your scientific discoveries with this Breakthroughs in Biology and Chemistry Presentation Template. Featuring illustrated lab elements like microscopes, DNA, and petri dishes, it's perfect for researchers and educators. Easily editable in PowerPoint, Keynote, or Google Slides, this template helps convey key insights with clarity and visual appeal.


6 diapositivas
Startup Investors Pitch Deck Presentation
Inspire confidence and spark investor interest with the Startup Investor Pitch Deck Presentation. Featuring a creative visual of a rocket launching from a piggy bank, this slide is ideal for illustrating funding momentum, business growth, or financial milestones. Each section allows space to highlight critical investment points such as traction, market opportunity, financials, and team highlights. Fully customizable in PowerPoint, Keynote, or Google Slides, this pitch-ready layout is perfect for entrepreneurs, startup founders, and innovation teams aiming to deliver a memorable and professional presentation.


6 diapositivas
ABC Alphabet Infographic
An "Alphabet Infographic" is a visually engaging way to present the letters of the alphabet along with corresponding words or images that start with each letter. This type of infographic is often used in educational settings to teach young children the alphabet and basic vocabulary. Display the letters of the alphabet in a clear and appealing layout. You can arrange them in rows or columns, using a bold and easily readable font. Use colorful and child-friendly illustrations for the images associated with each letter. This will make the infographic more captivating and engaging for young learners.


6 diapositivas
Executive Summary of Findings Presentation
Summarize your key insights with clarity using this Executive Summary of Findings slide. Designed with a centered target icon and surrounding data points, it’s ideal for spotlighting major conclusions. Fully editable in PowerPoint, Keynote, and Google Slides.


6 diapositivas
PESTEL Environment Analysis Infographics
Elevate your strategic analysis presentations with our PESTEL Environment Analysis infographic template. Designed for PowerPoint, Keynote, and Google Slides, this template is a must-have for business strategists, analysts, and students alike. This template efficiently breaks down the complex components of PESTEL analysis - Political, Economic, Social, Technological, Environmental, and Legal factors. Each segment is given its own distinct space, making it easy to input and display your analysis in a clear, organized manner. The sophisticated and educational design of the template ensures that your content is both accessible and engaging. The diverse yet harmonious color palette of the template enhances its visual appeal, reflecting the multifaceted nature of PESTEL analysis. This makes it ideal for detailed presentations where clarity and aesthetics are key. Whether you're presenting to a classroom, a boardroom, or at a conference, this infographic template will help you convey your environmental analysis with professionalism and style.


6 diapositivas
SWOT Analysis Matrix Infographic
This SWOT Analysis Matrix Infographic provides a visually compelling and straightforward framework for evaluating a company or project's Strengths, Weaknesses, Opportunities, and Threats. Its compatibility with PowerPoint, Google Slides, and Keynote ensures it is versatile for presentations. The design presents a balanced view of internal and external factors affecting decision-making and strategic planning. The template is user-friendly, allowing for easy customization to suit specific scenarios, educational purposes, or personal projects. This infographic is ideal for business analysts, students, and anyone looking to present a complete SWOT analysis in a concise and attractive format.


26 diapositivas
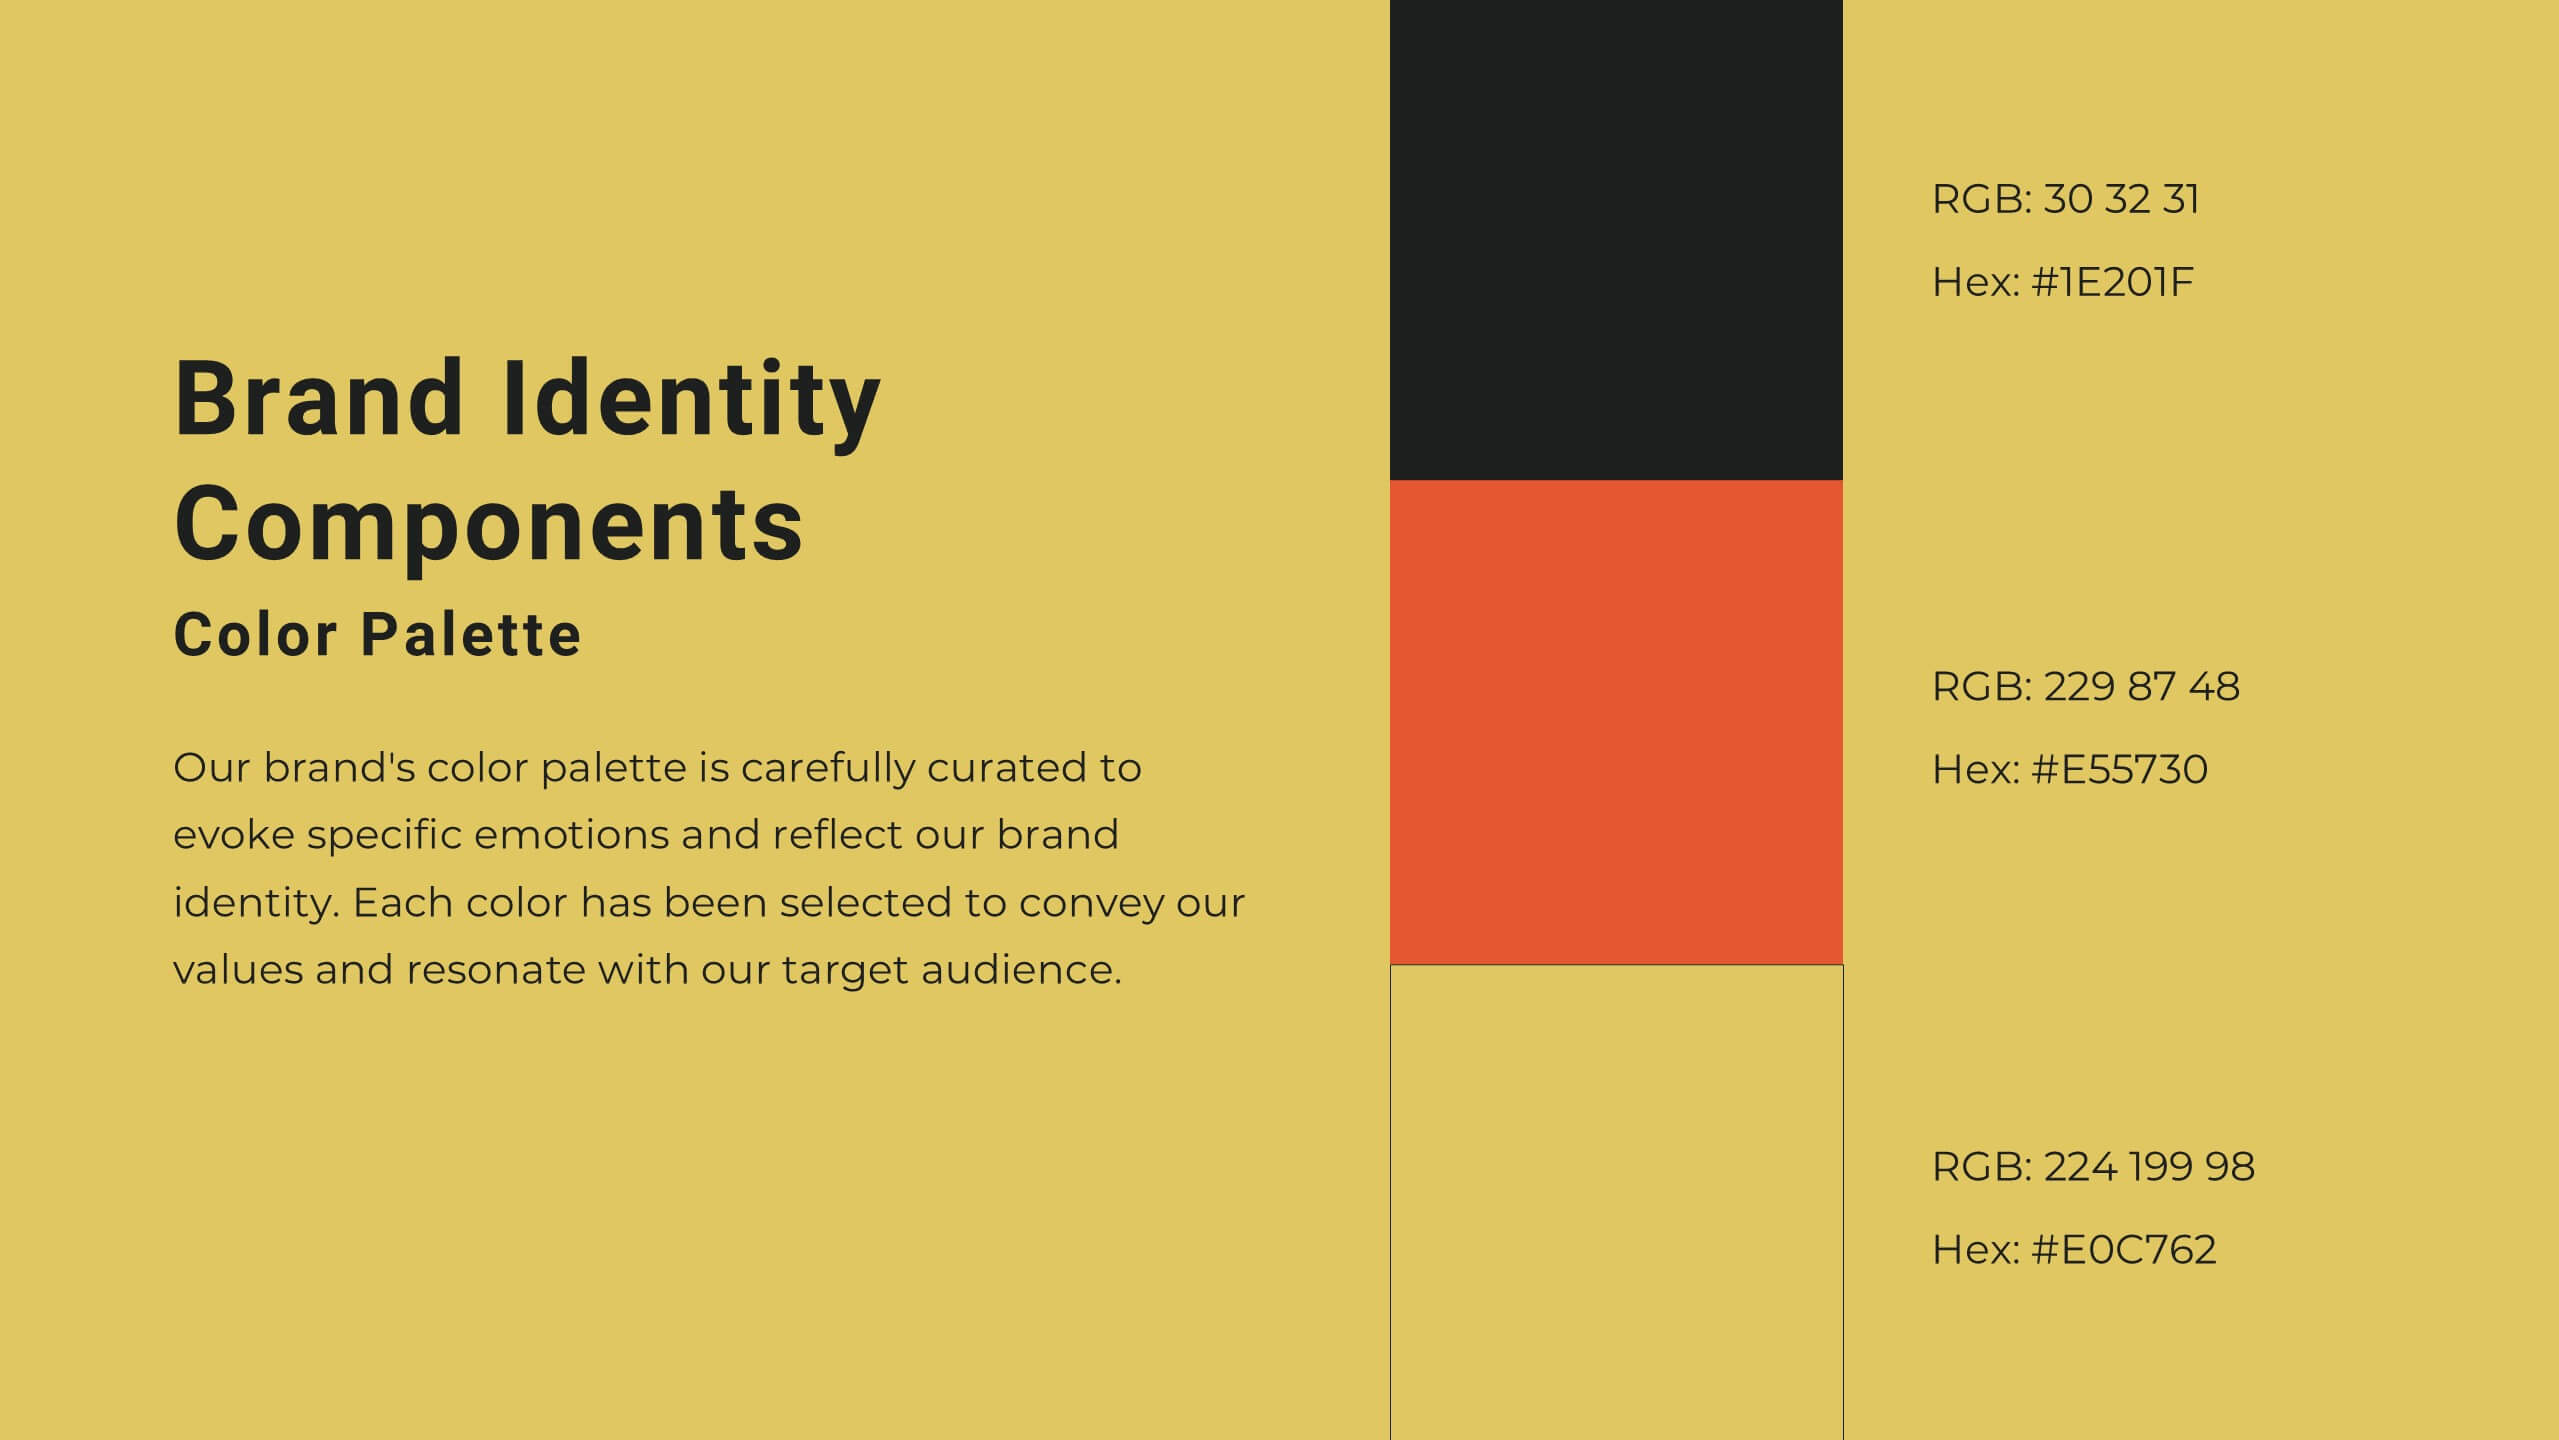
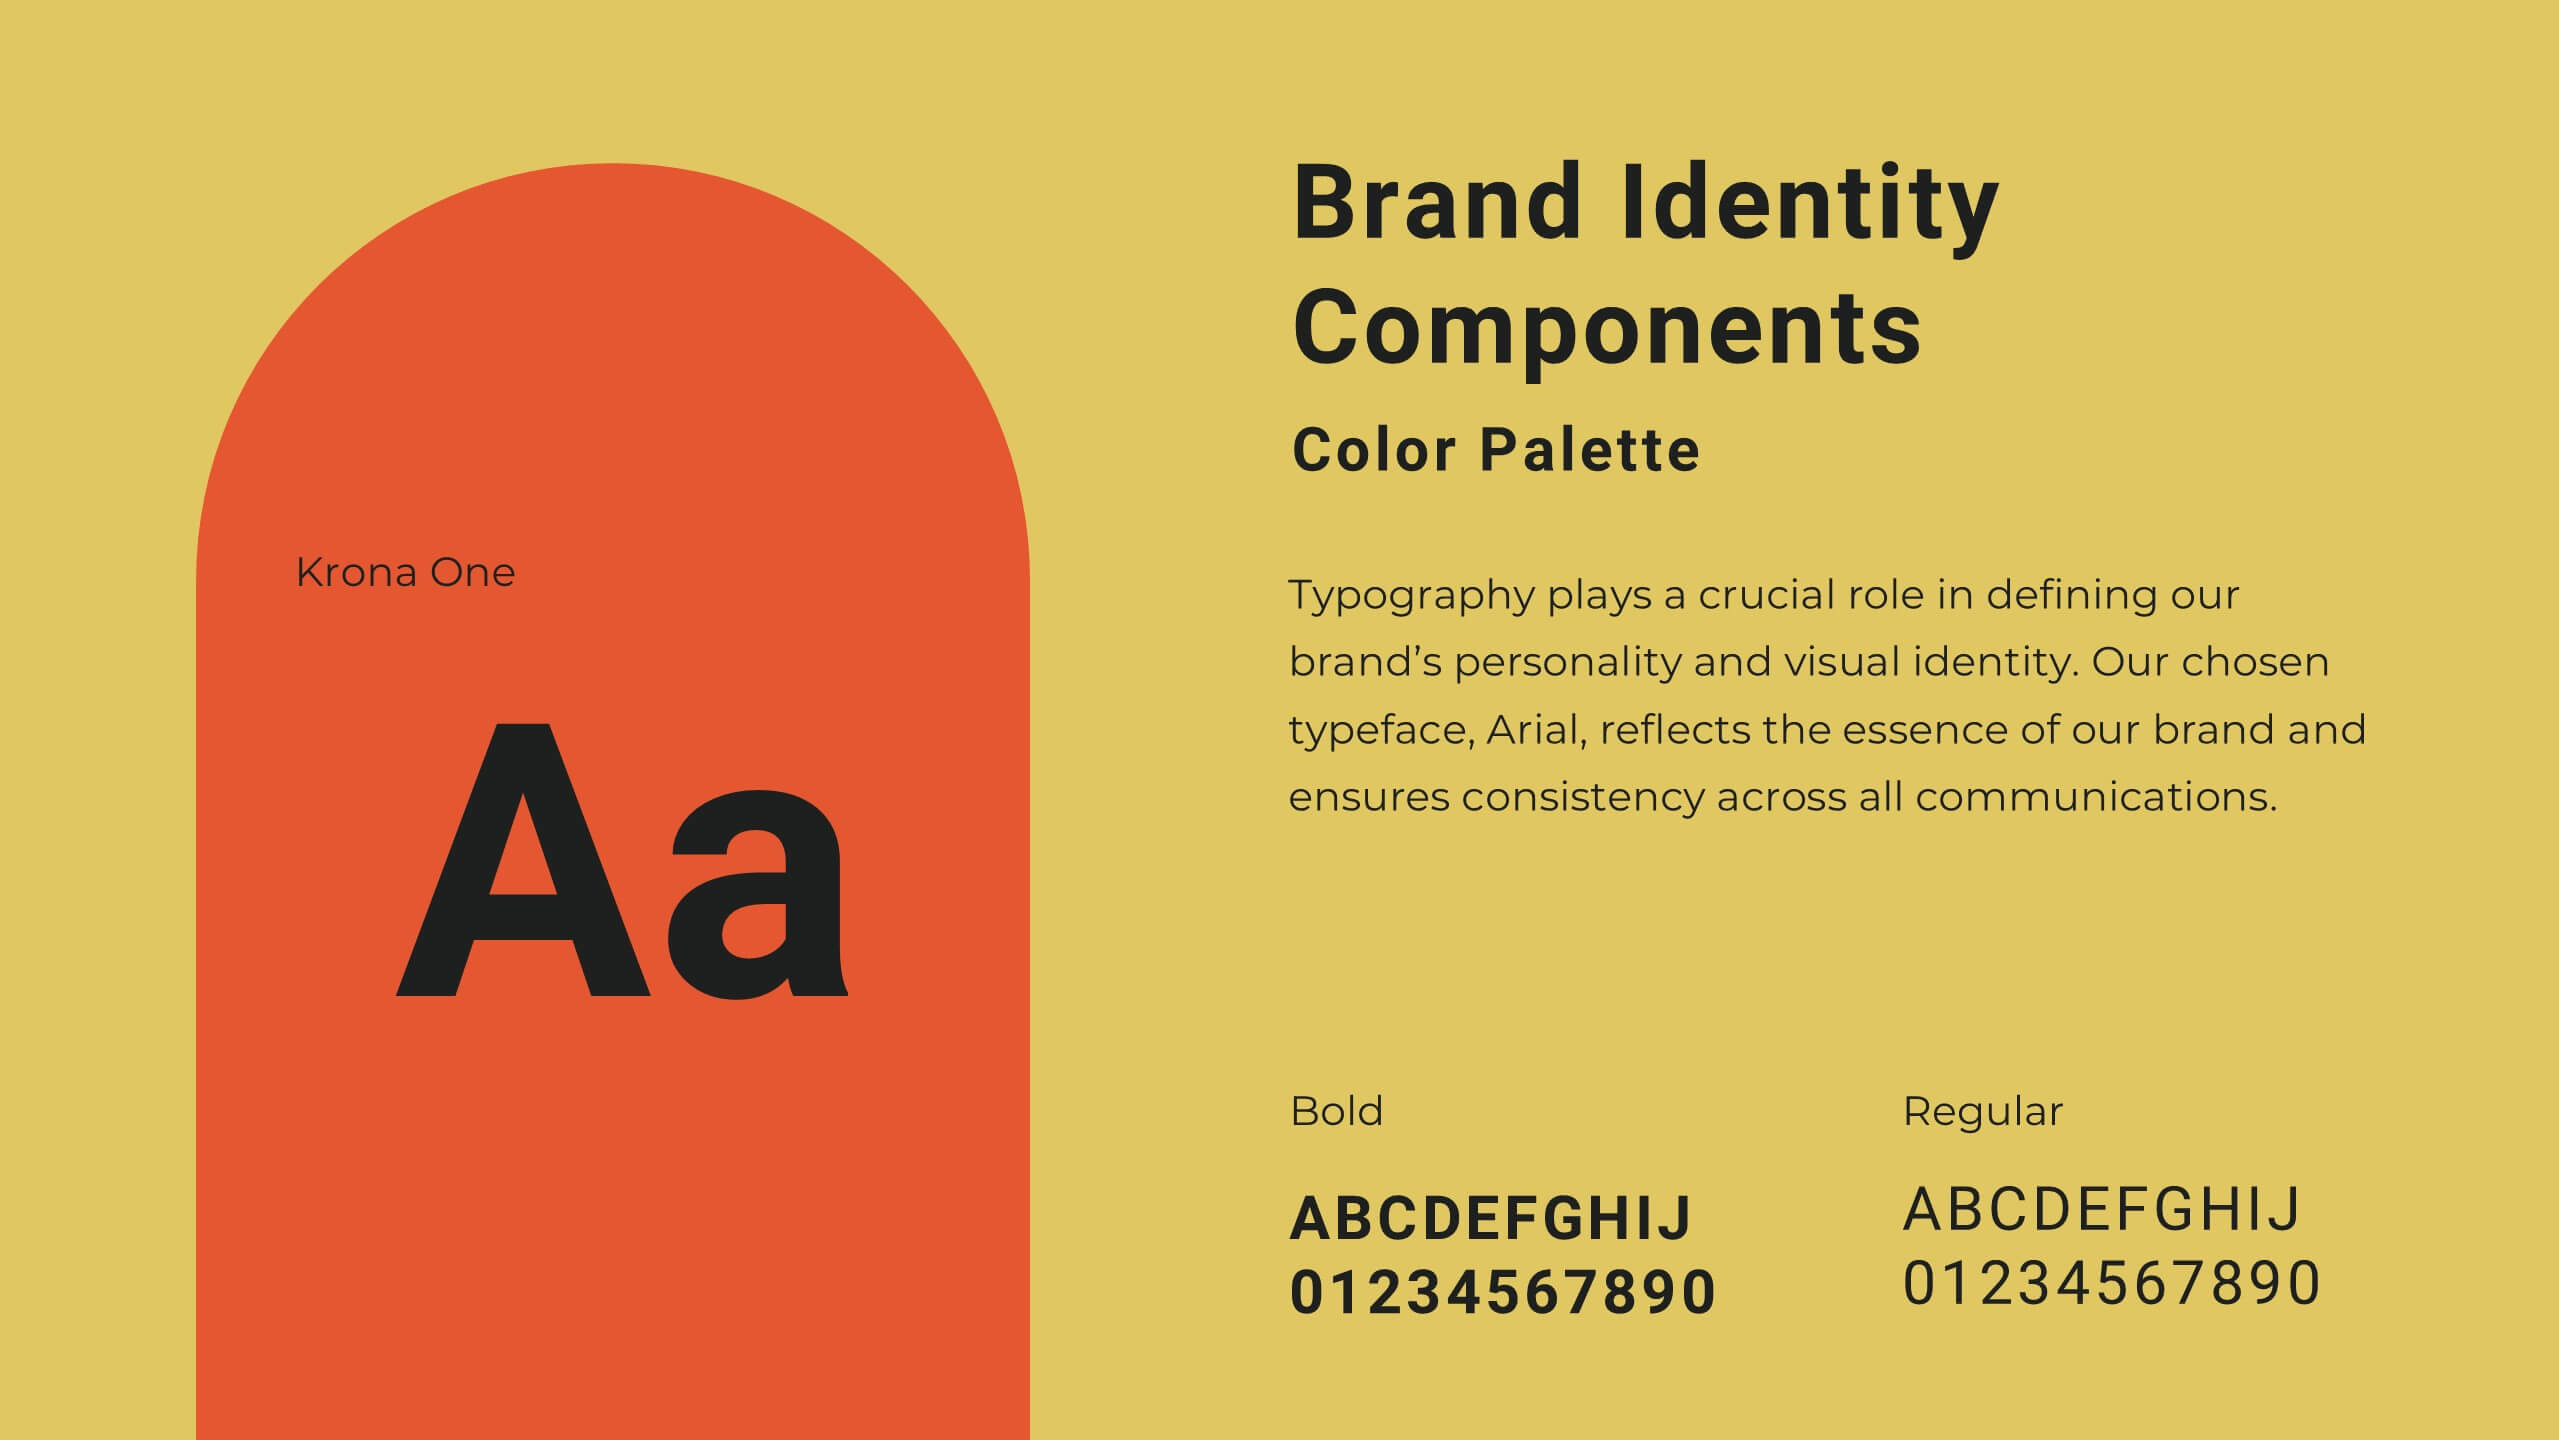
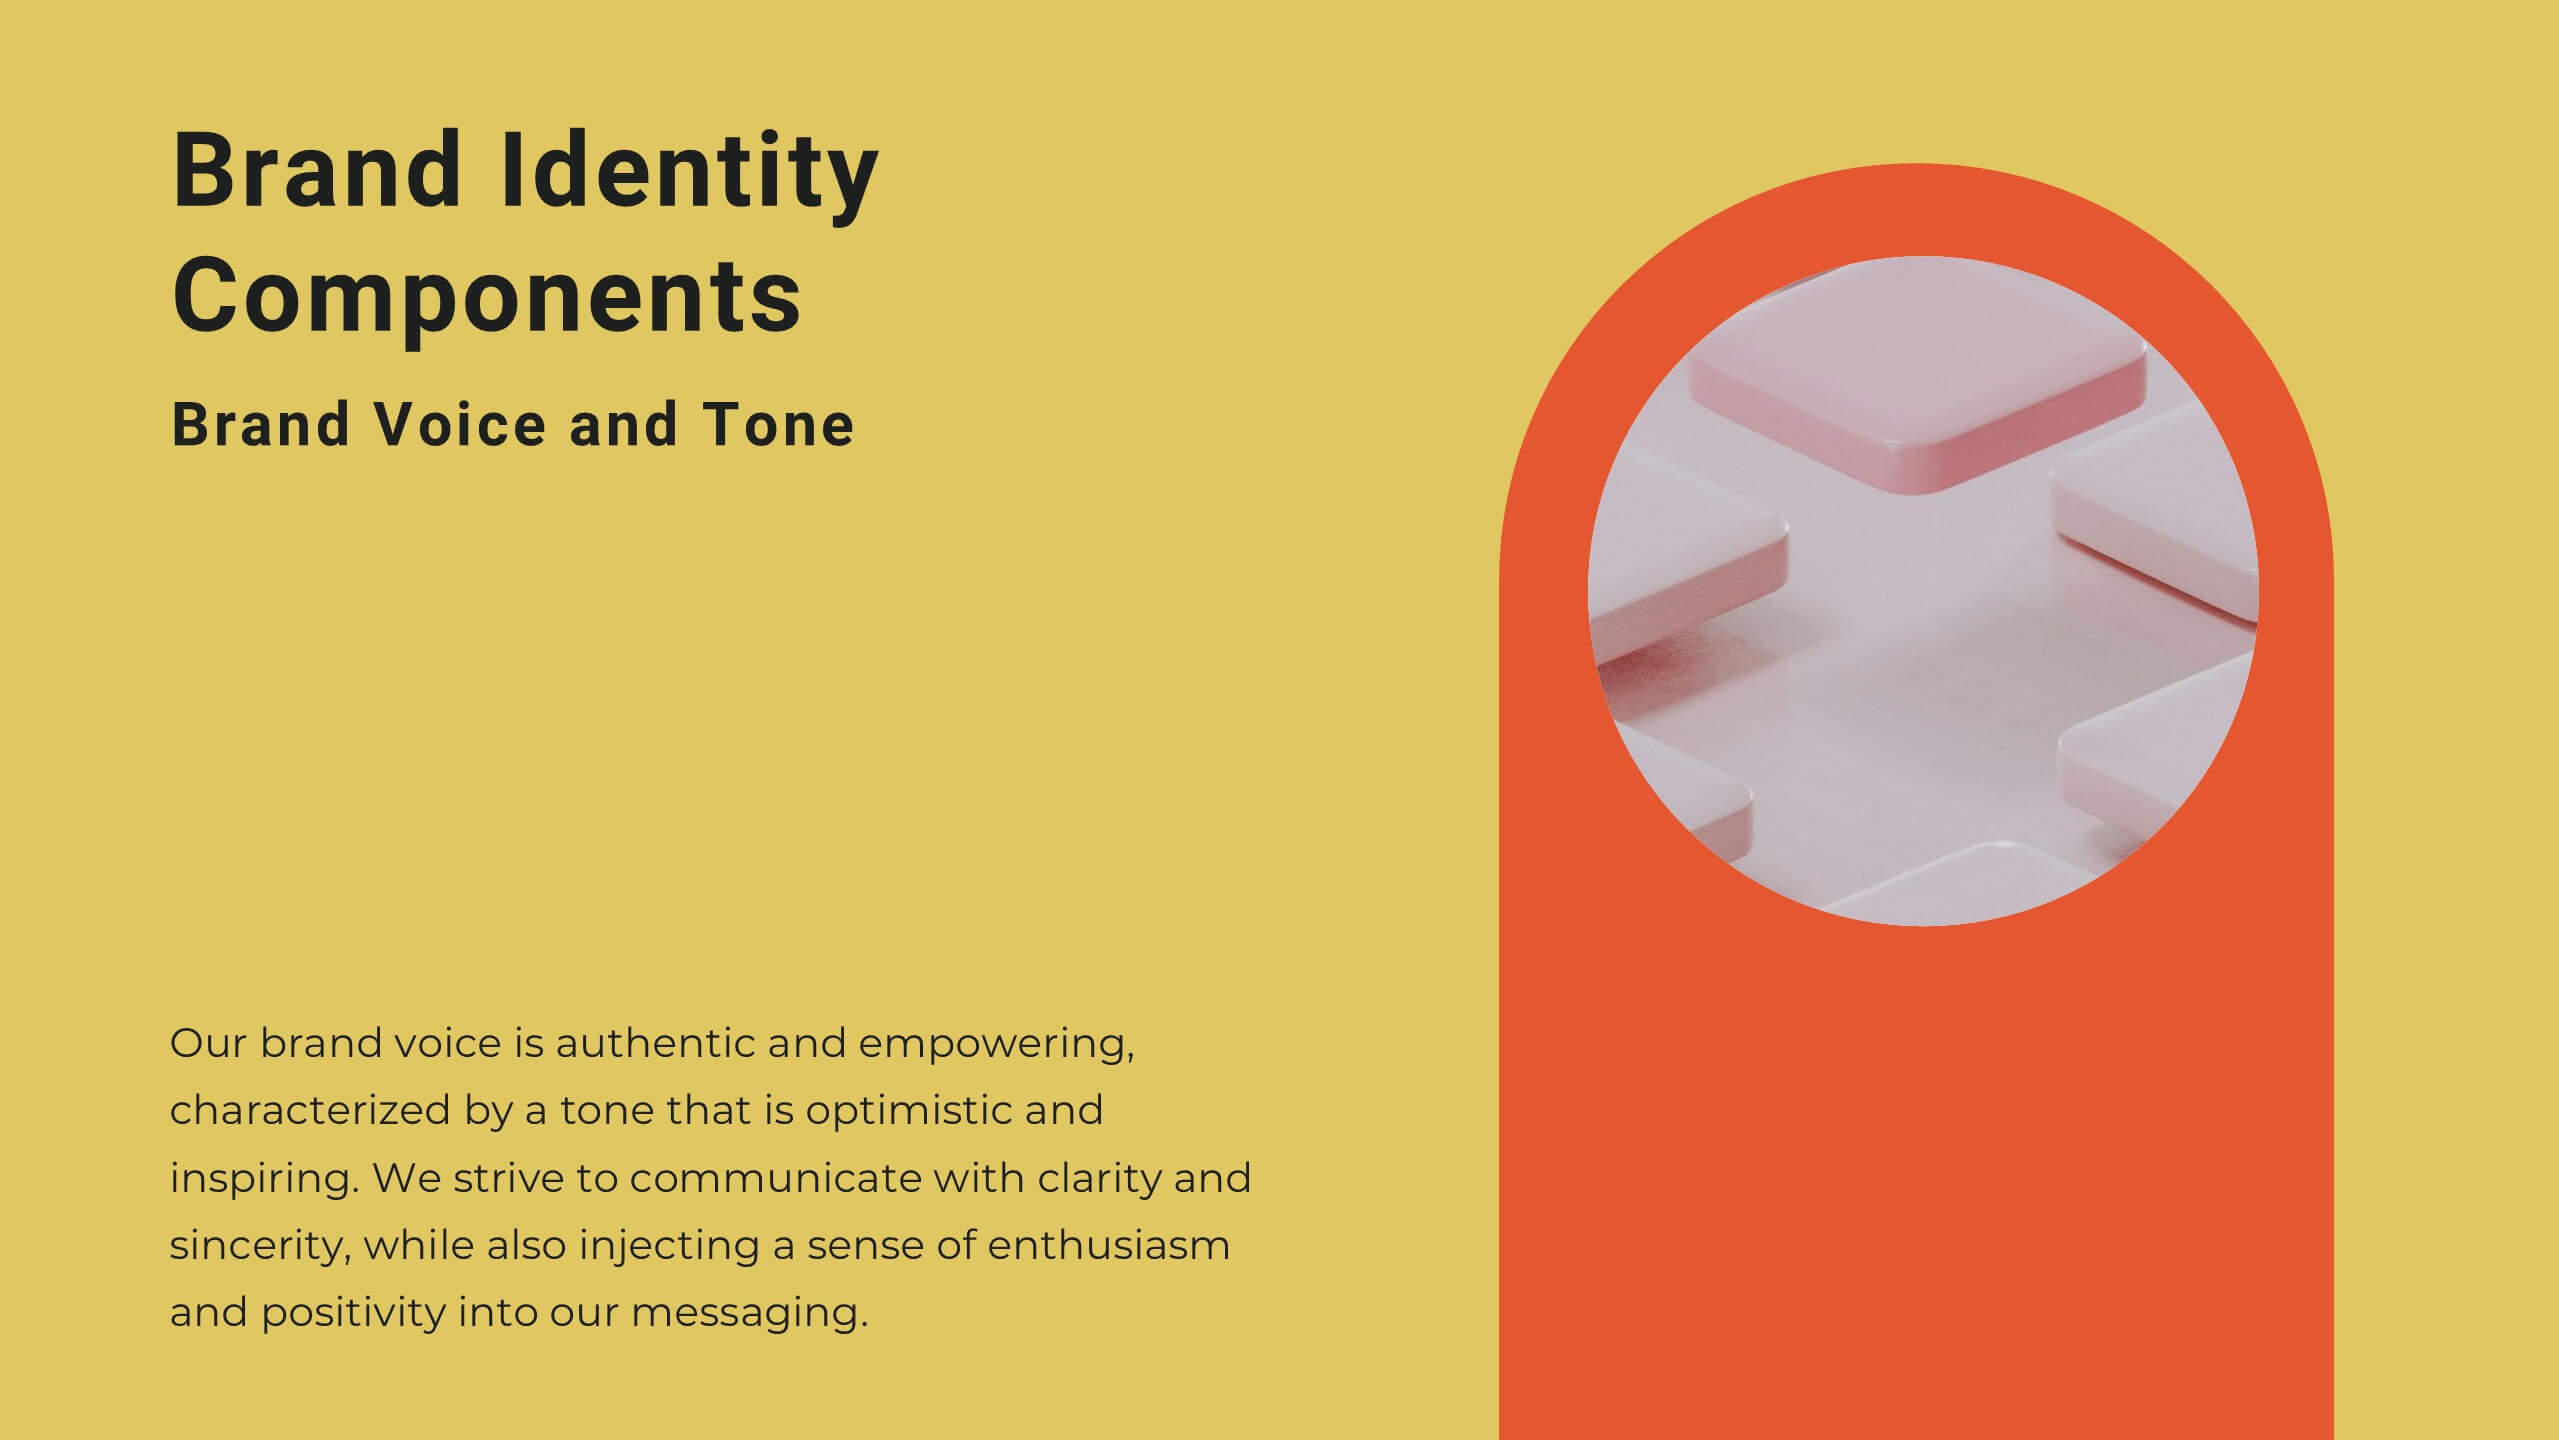
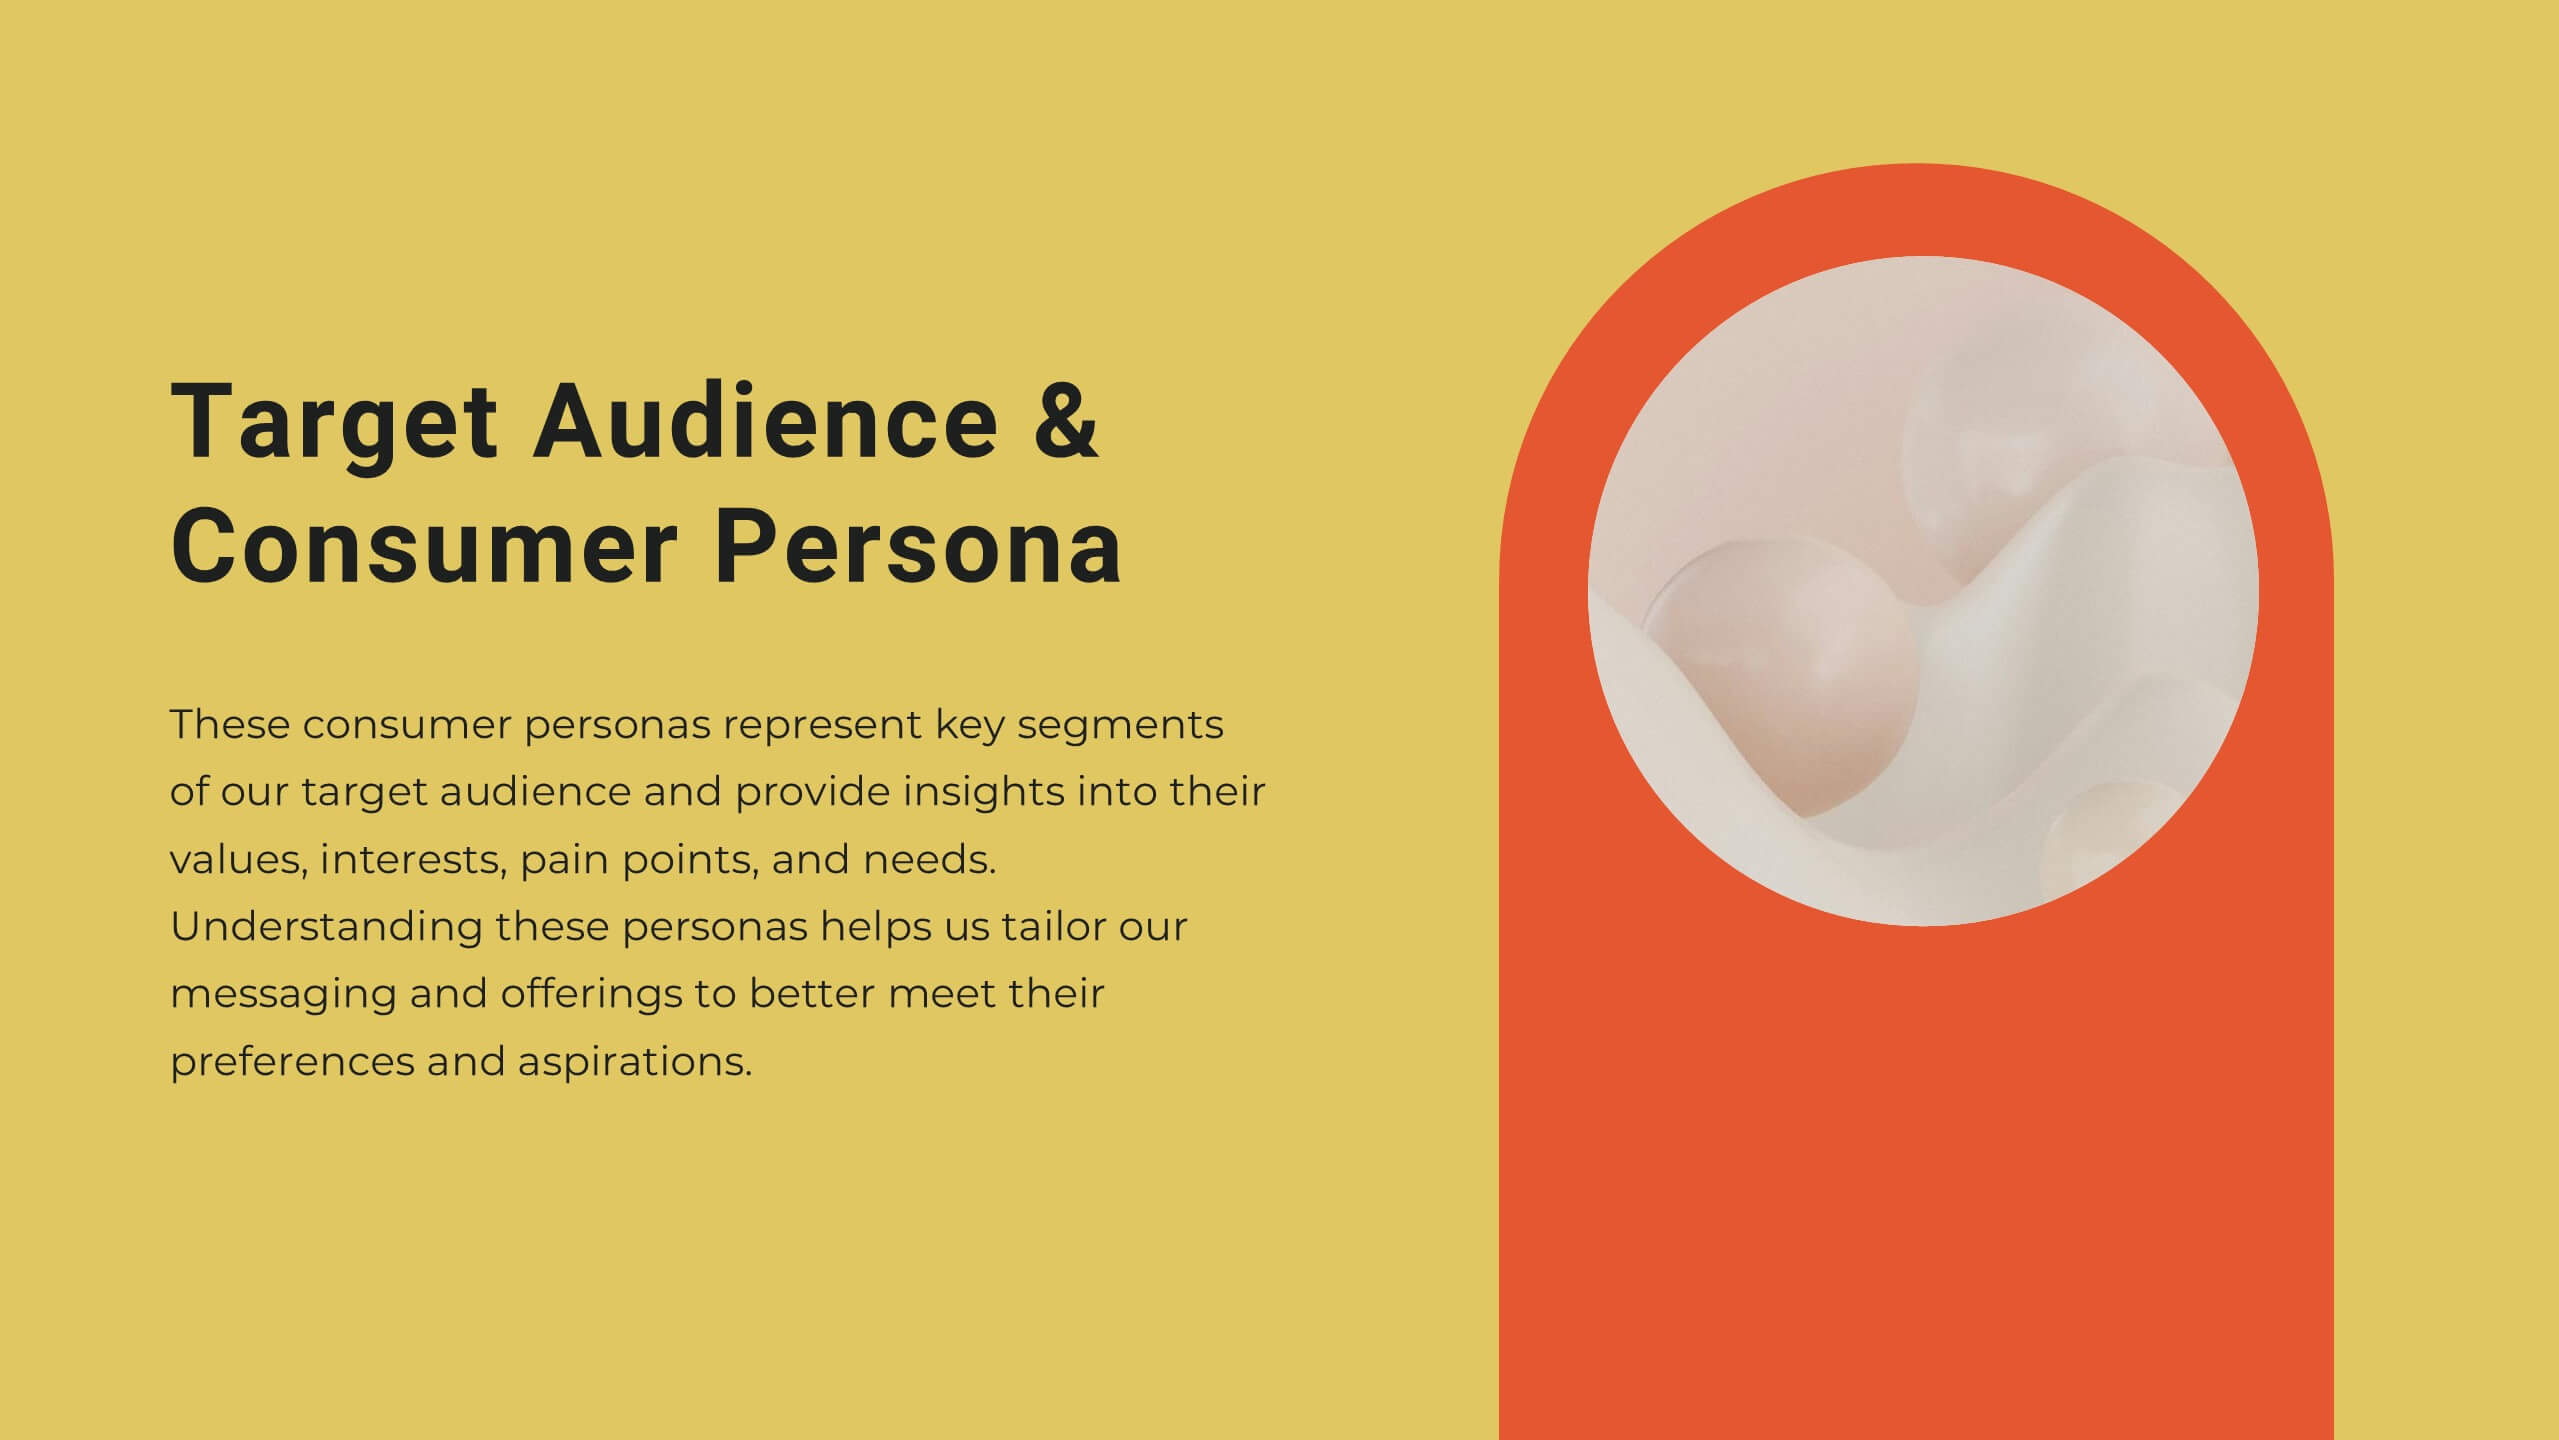
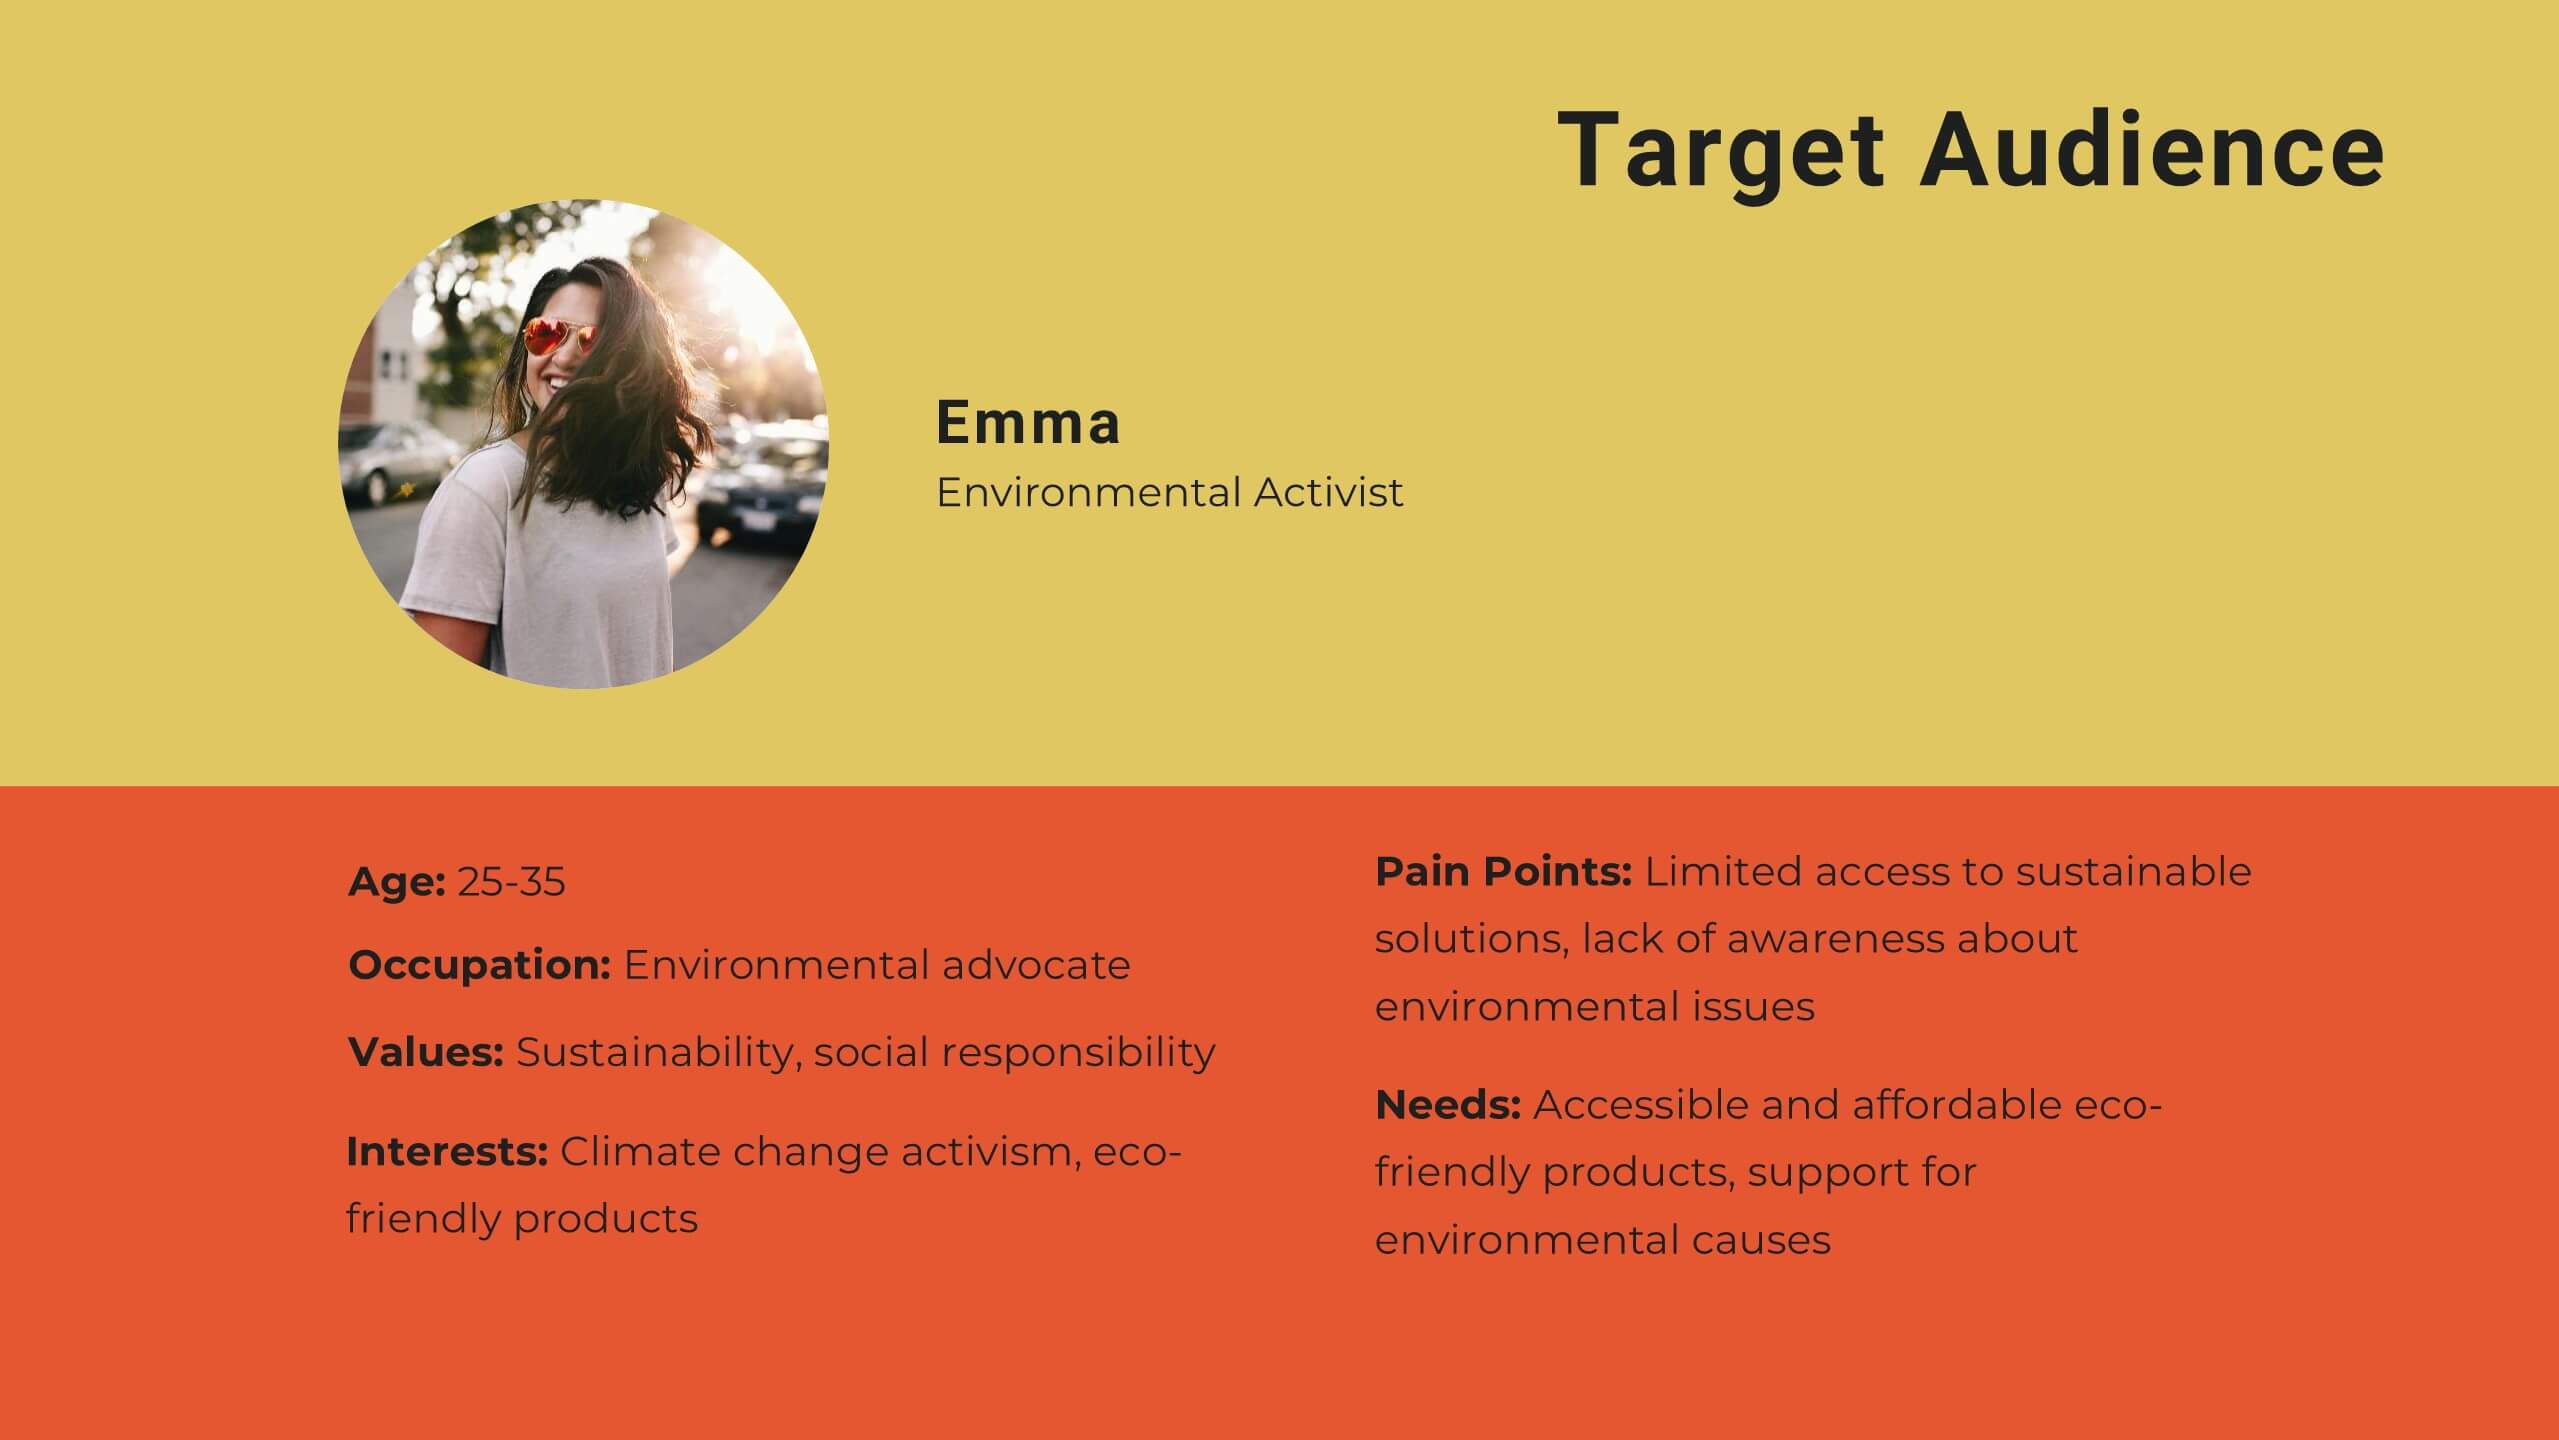
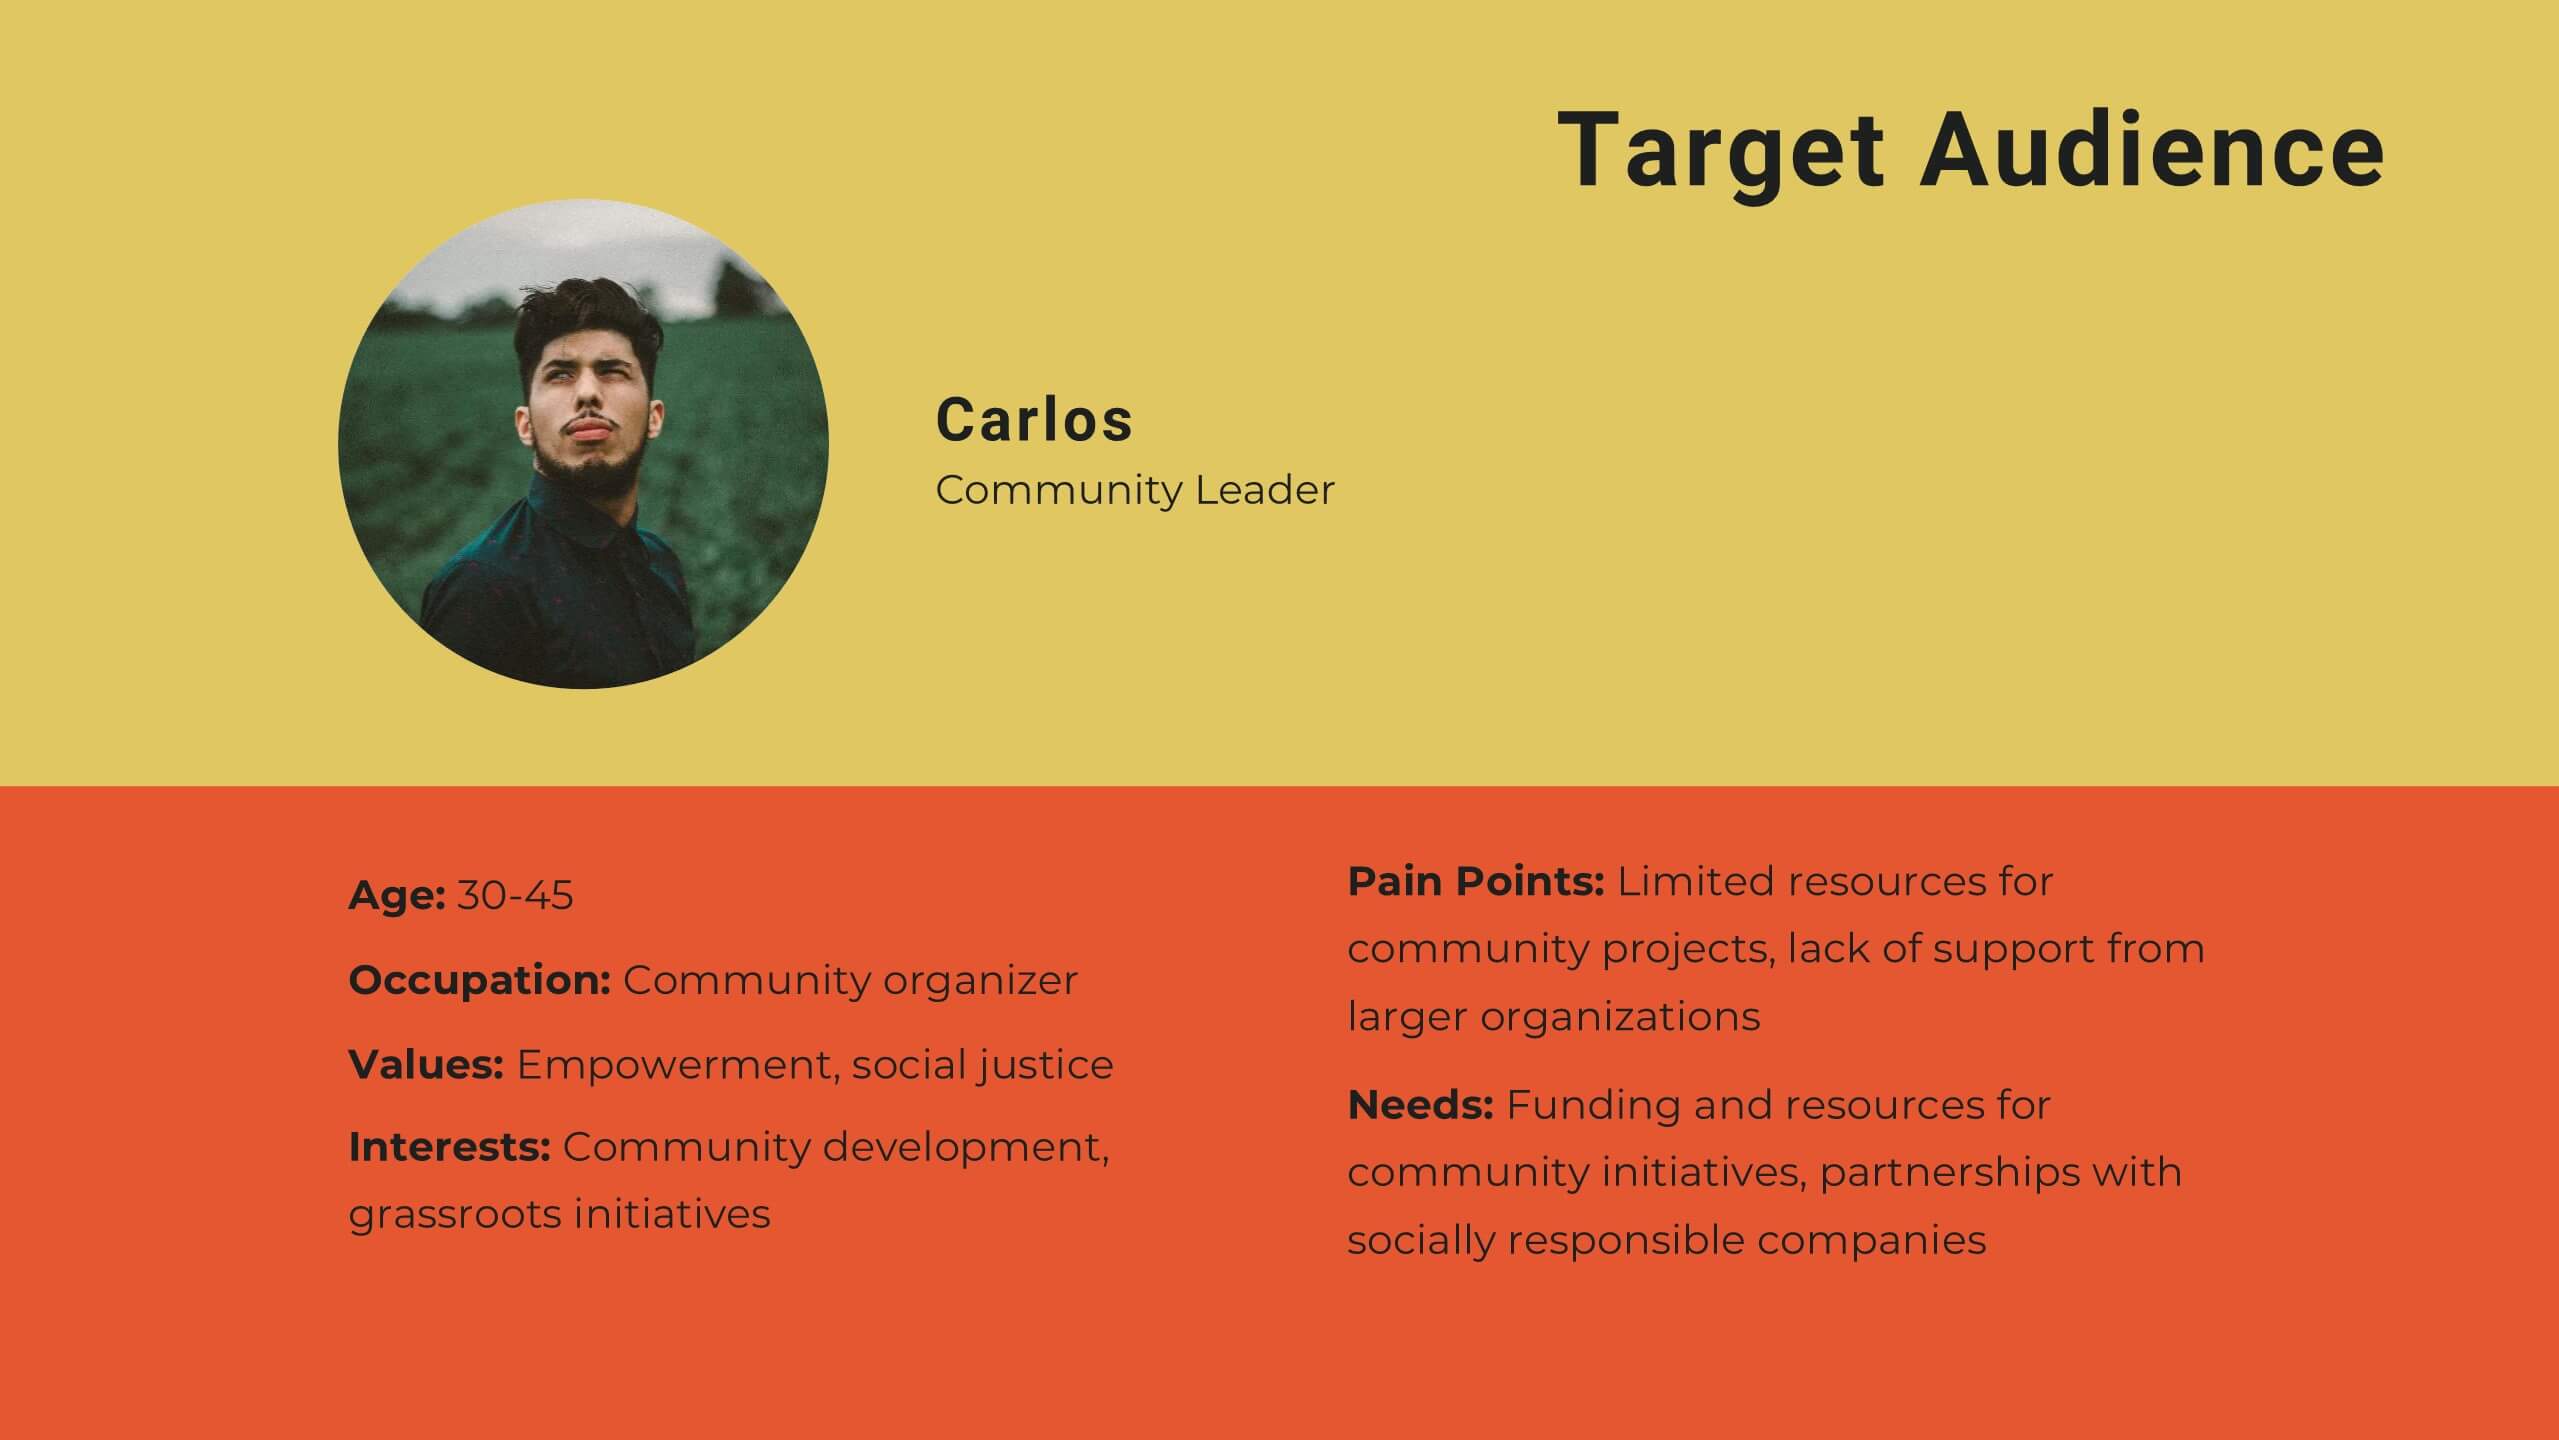
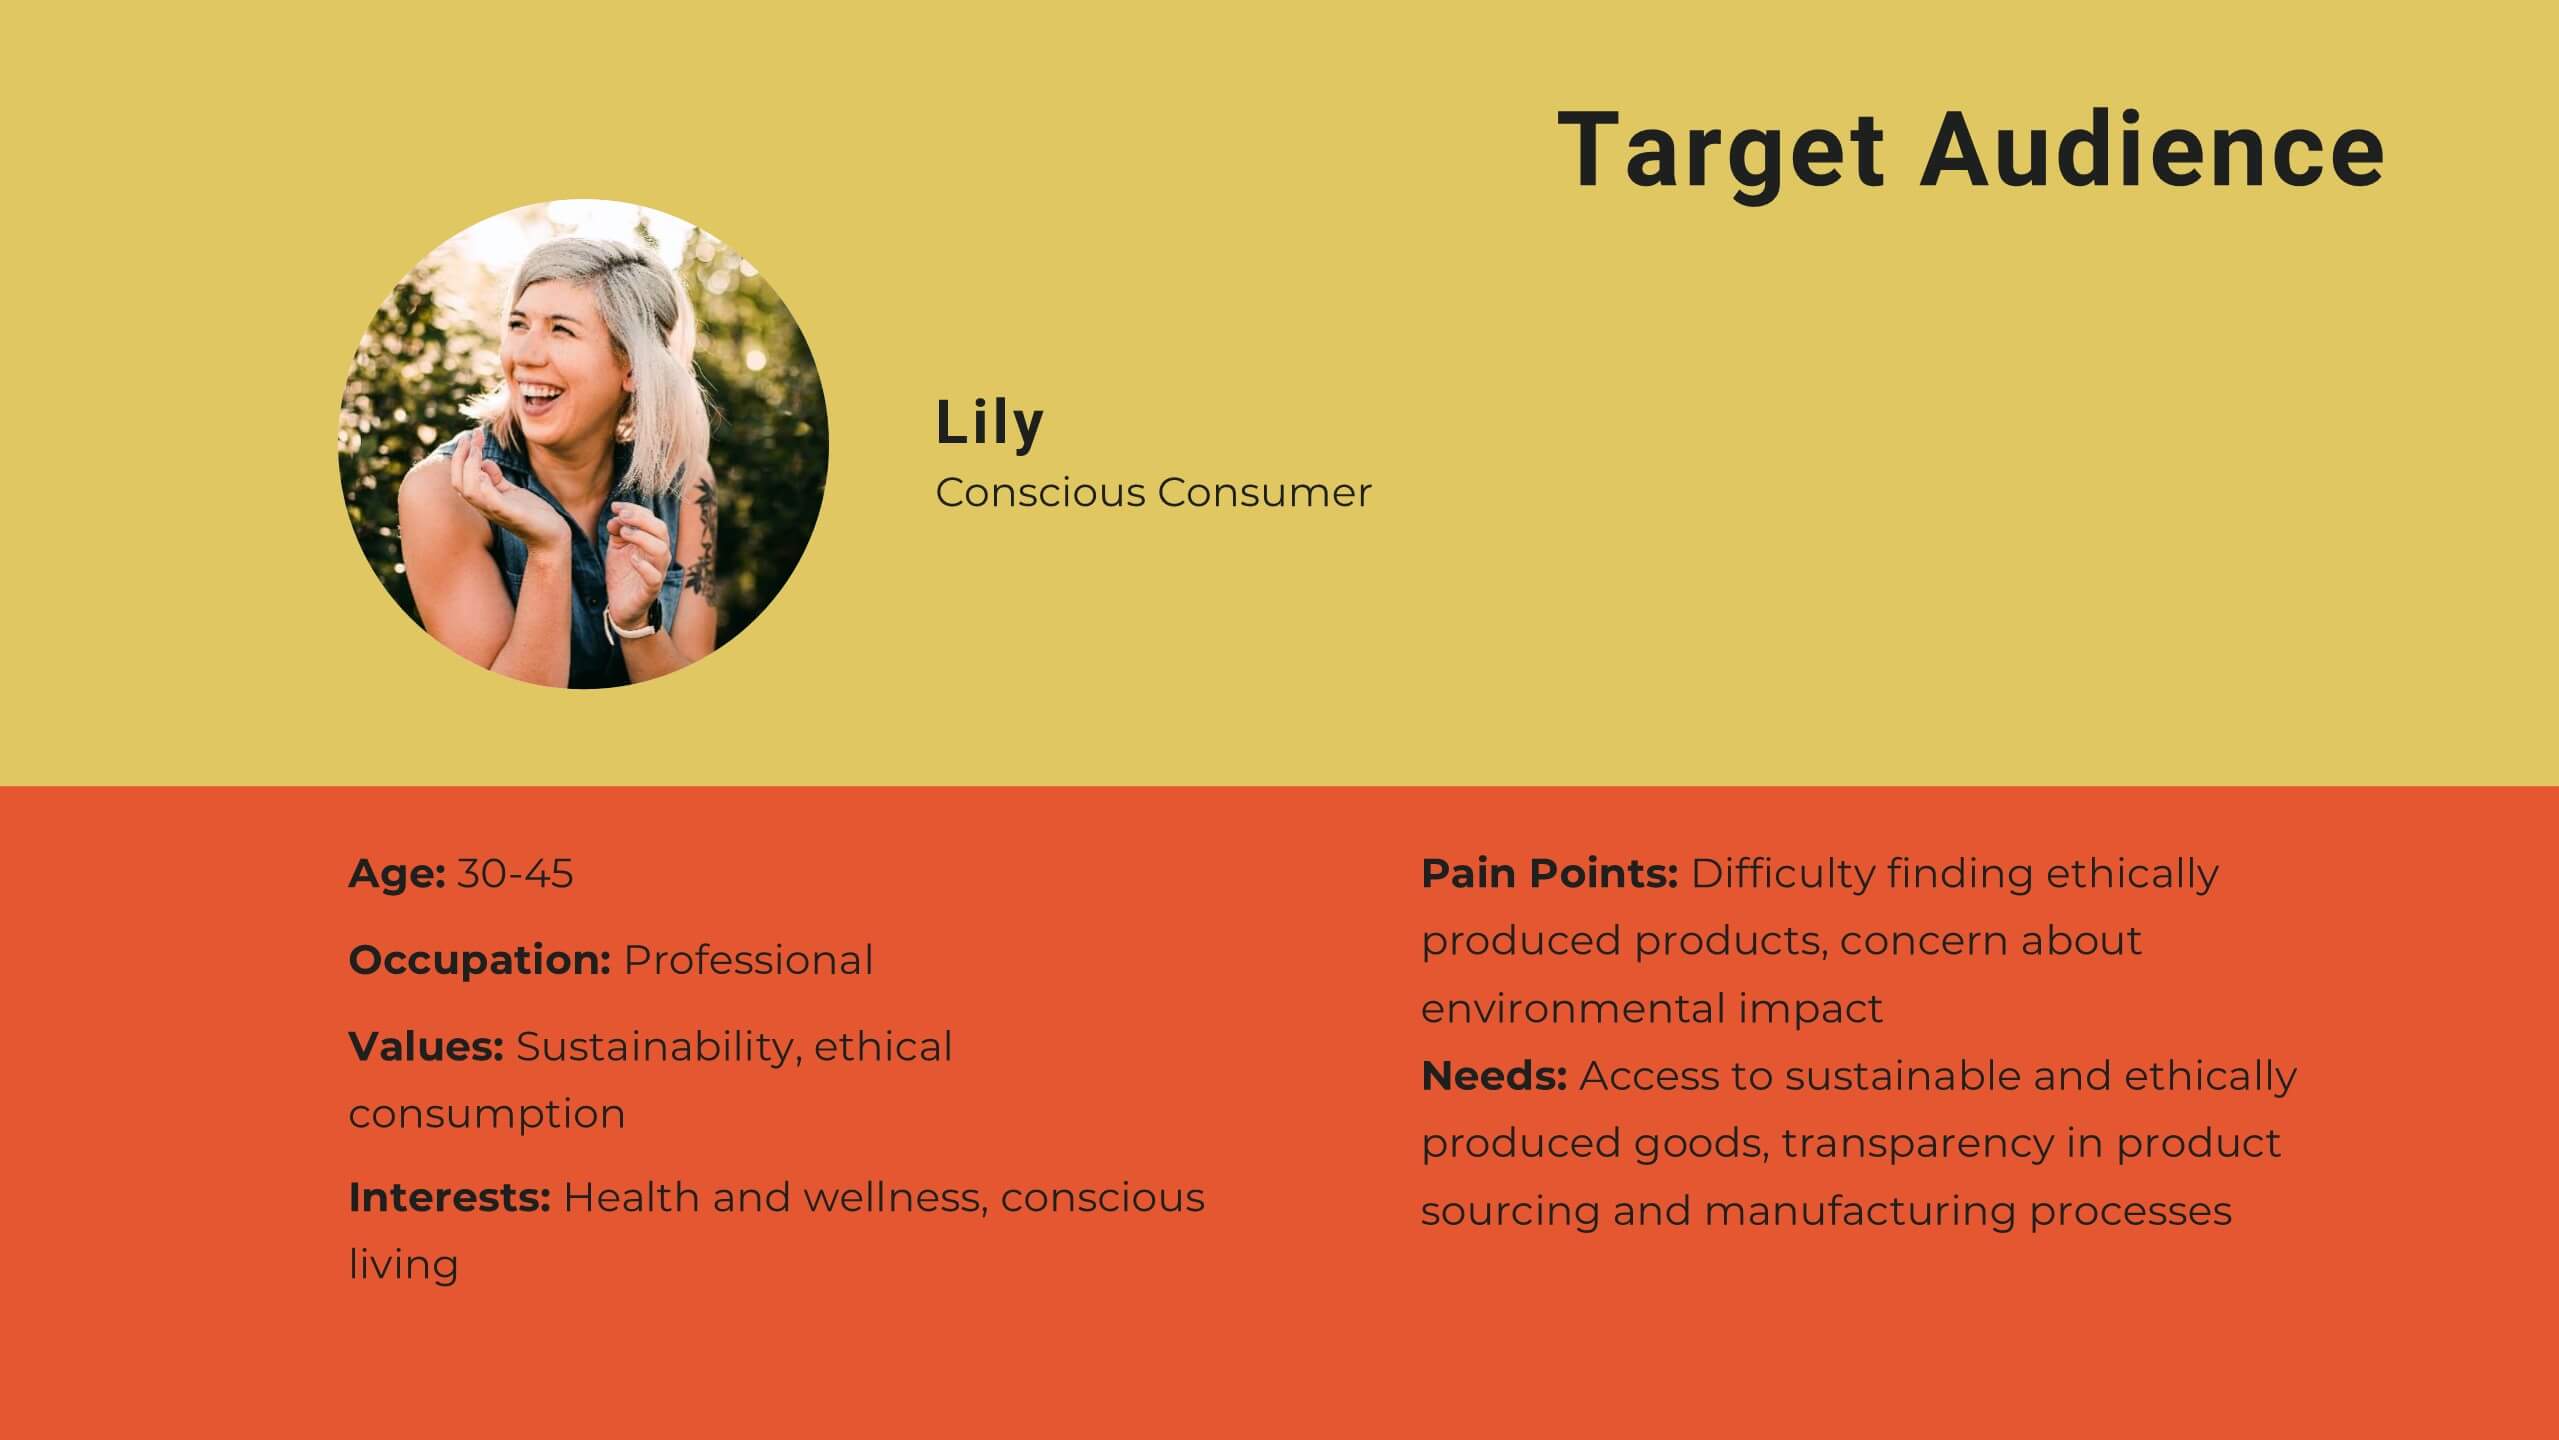
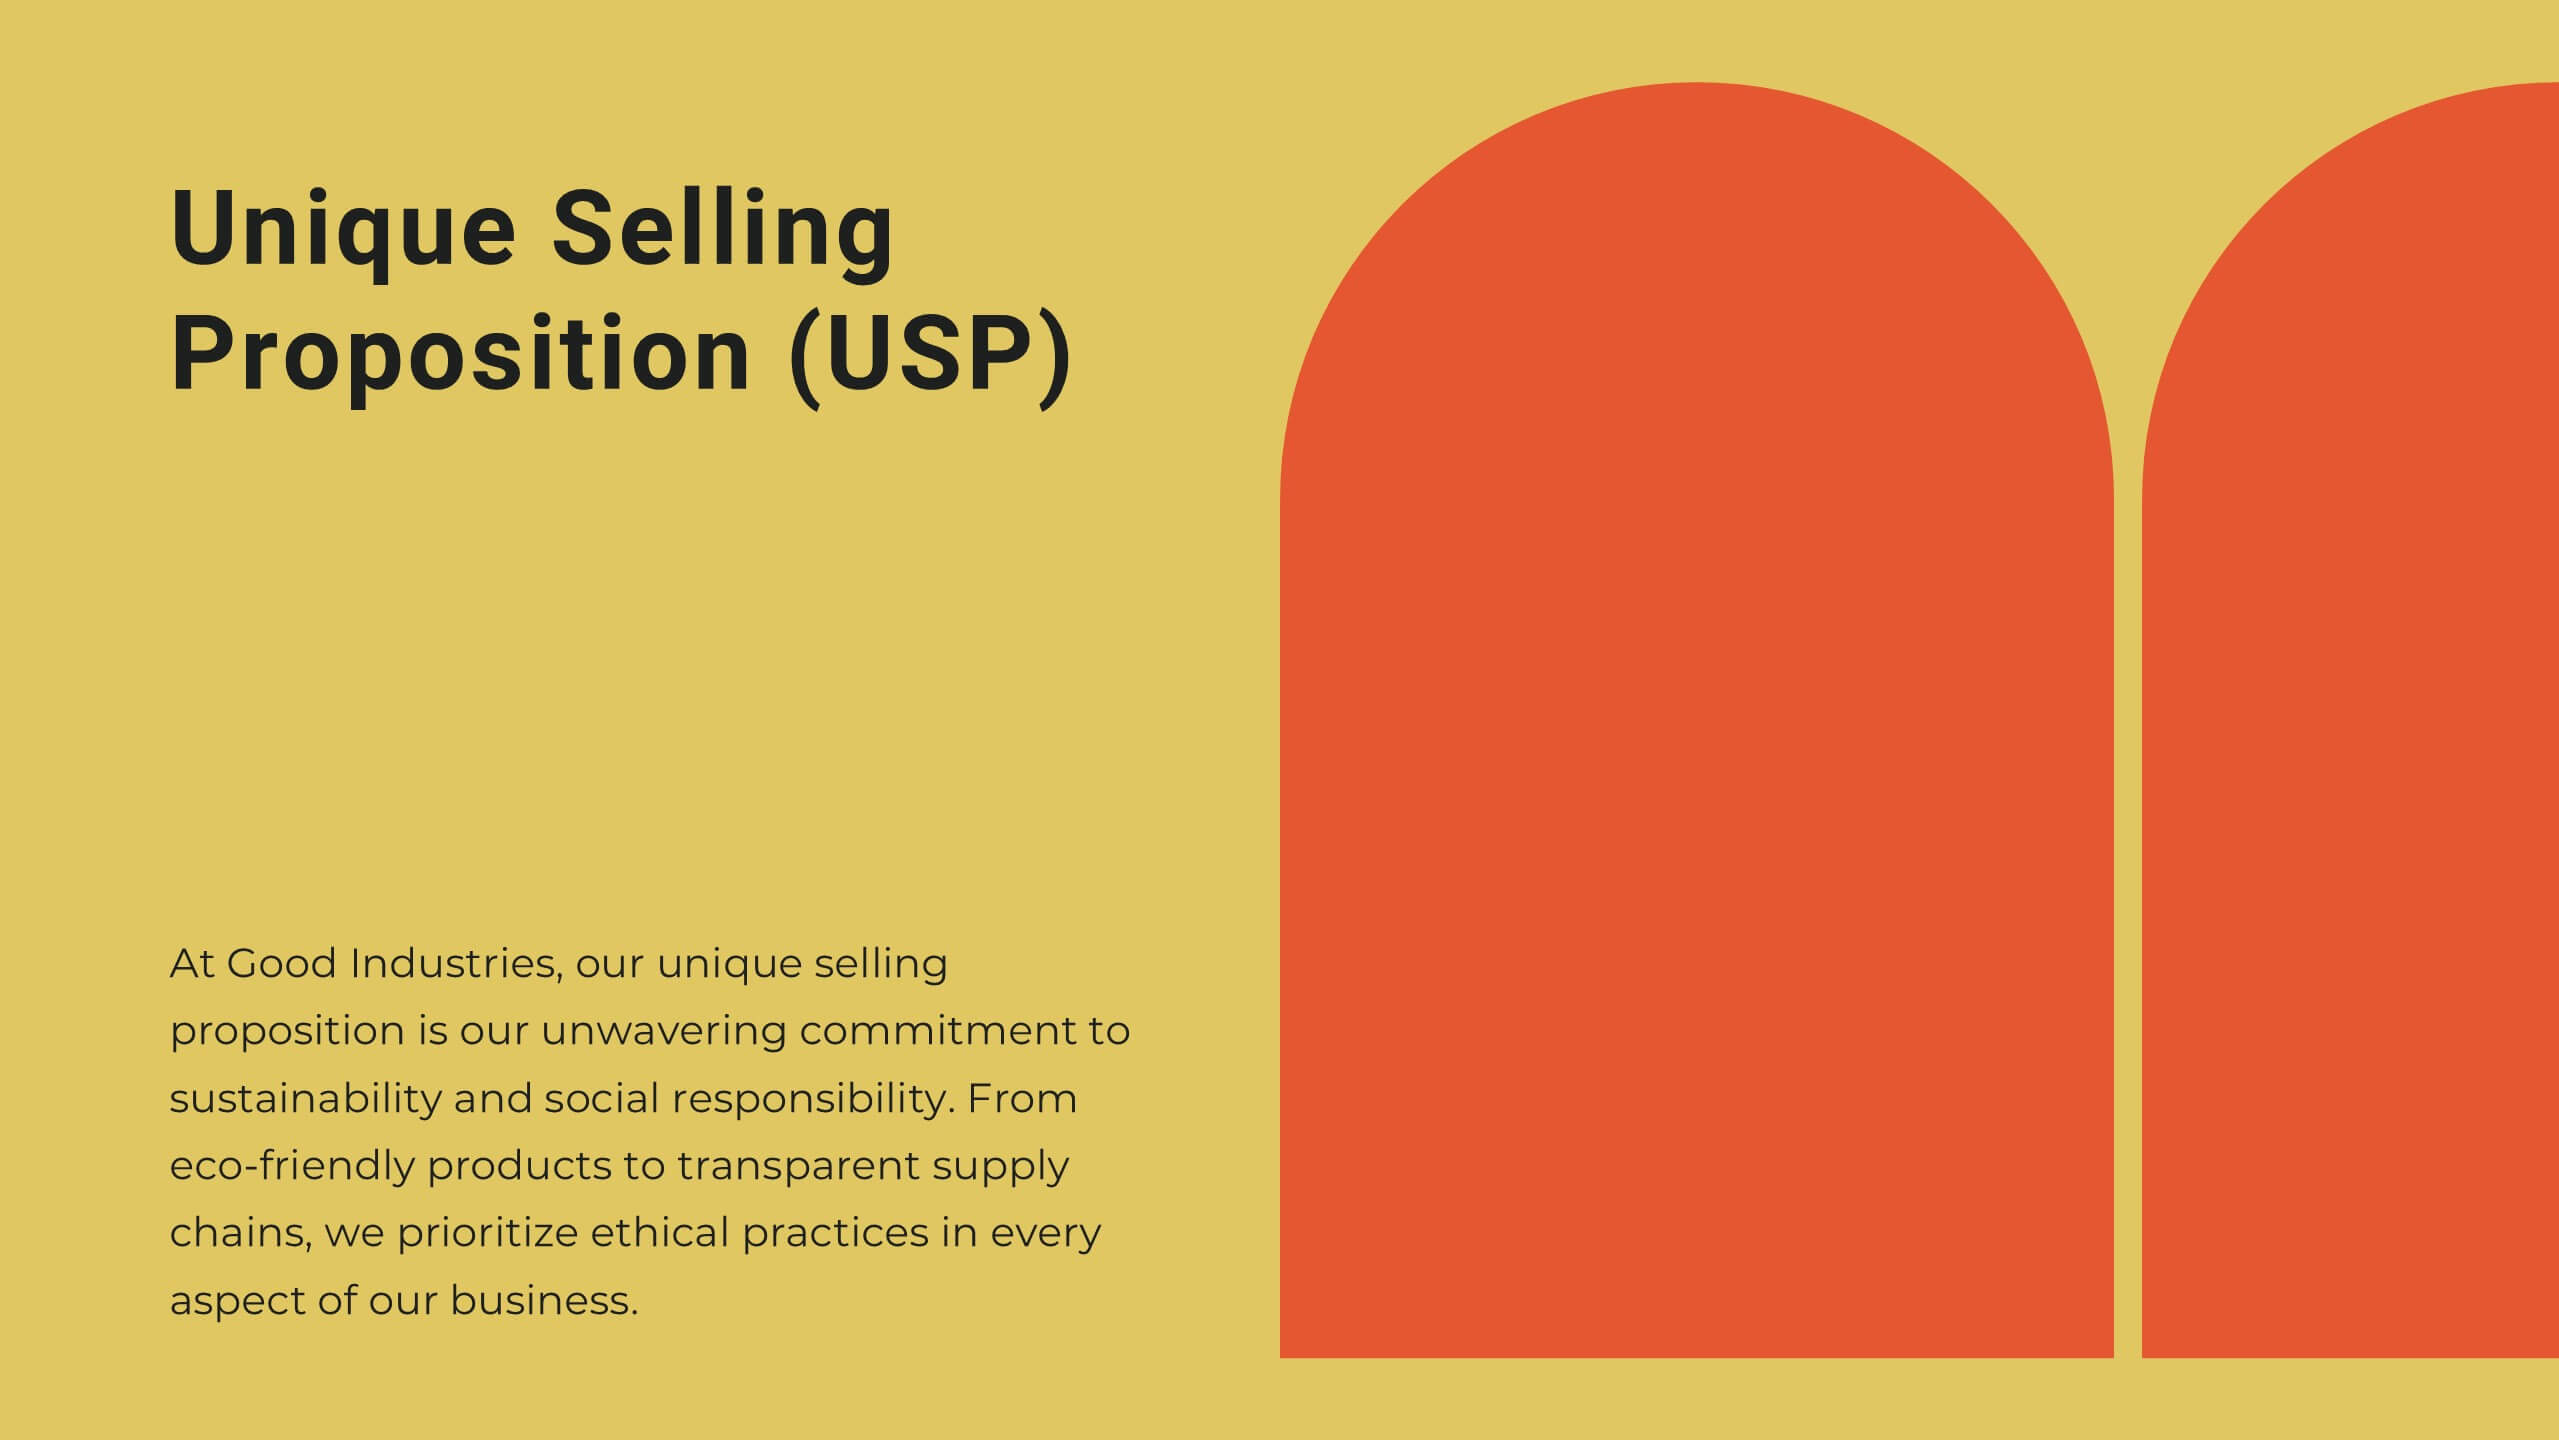
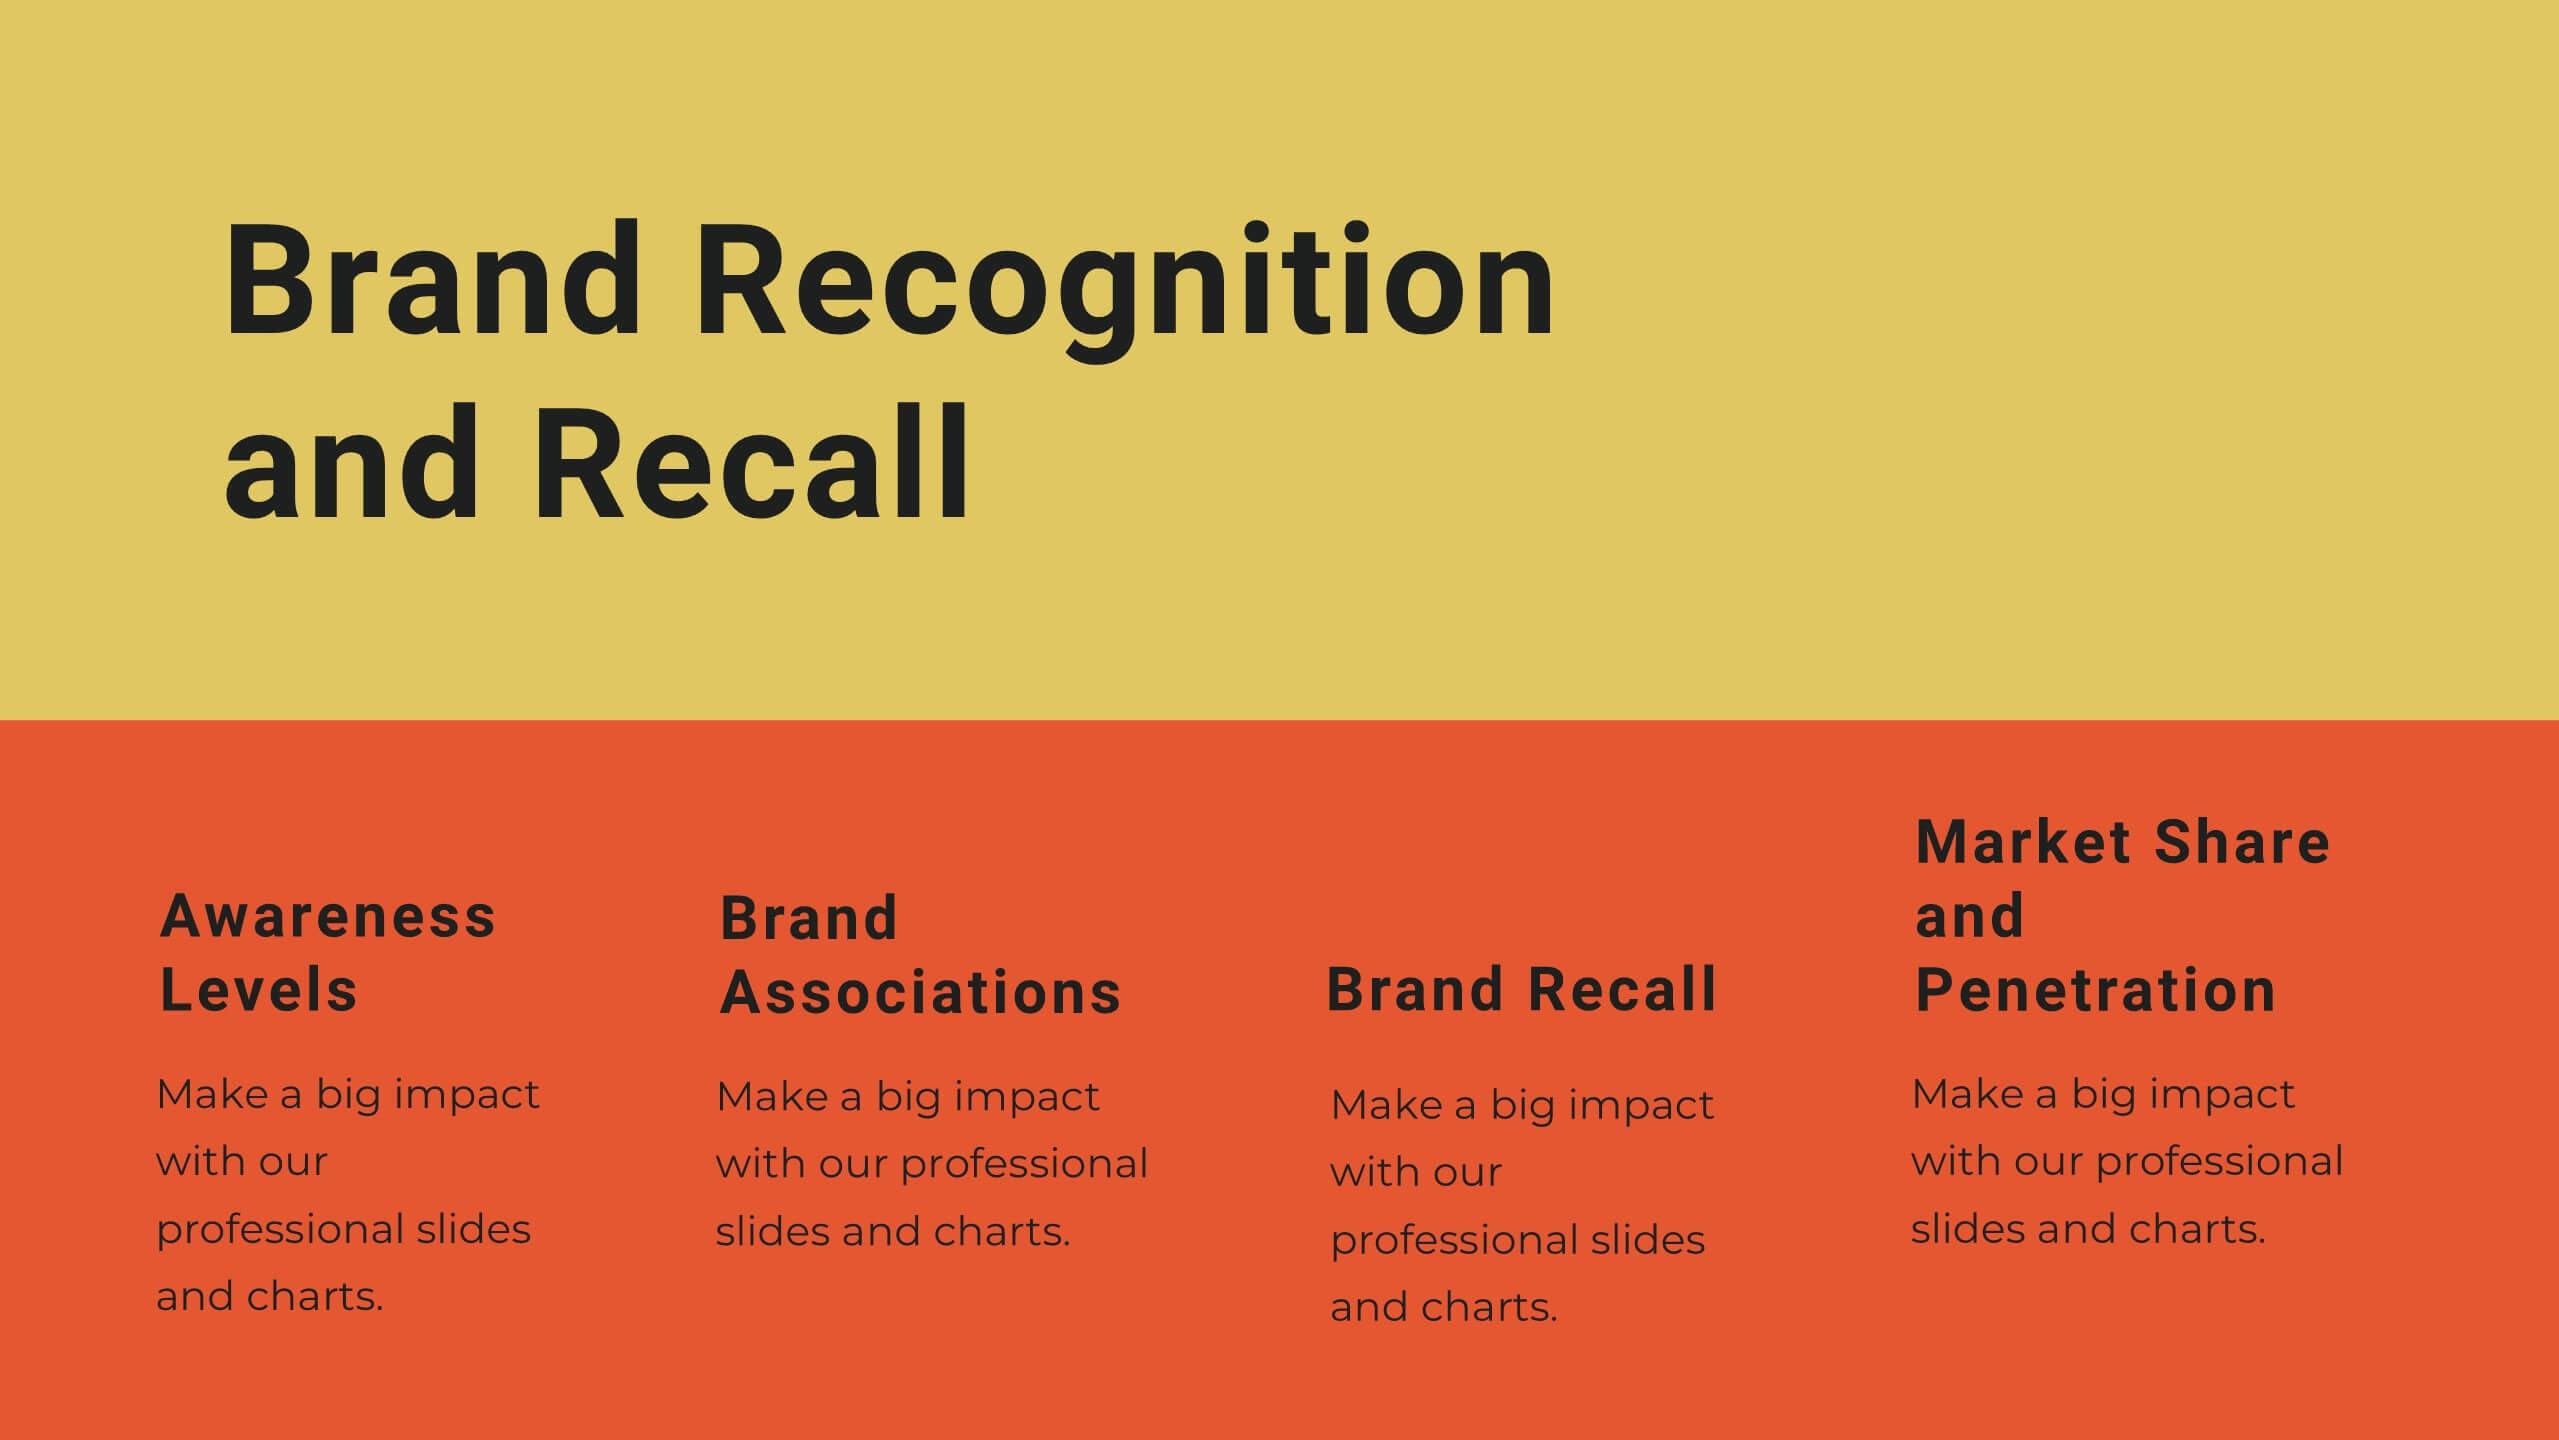
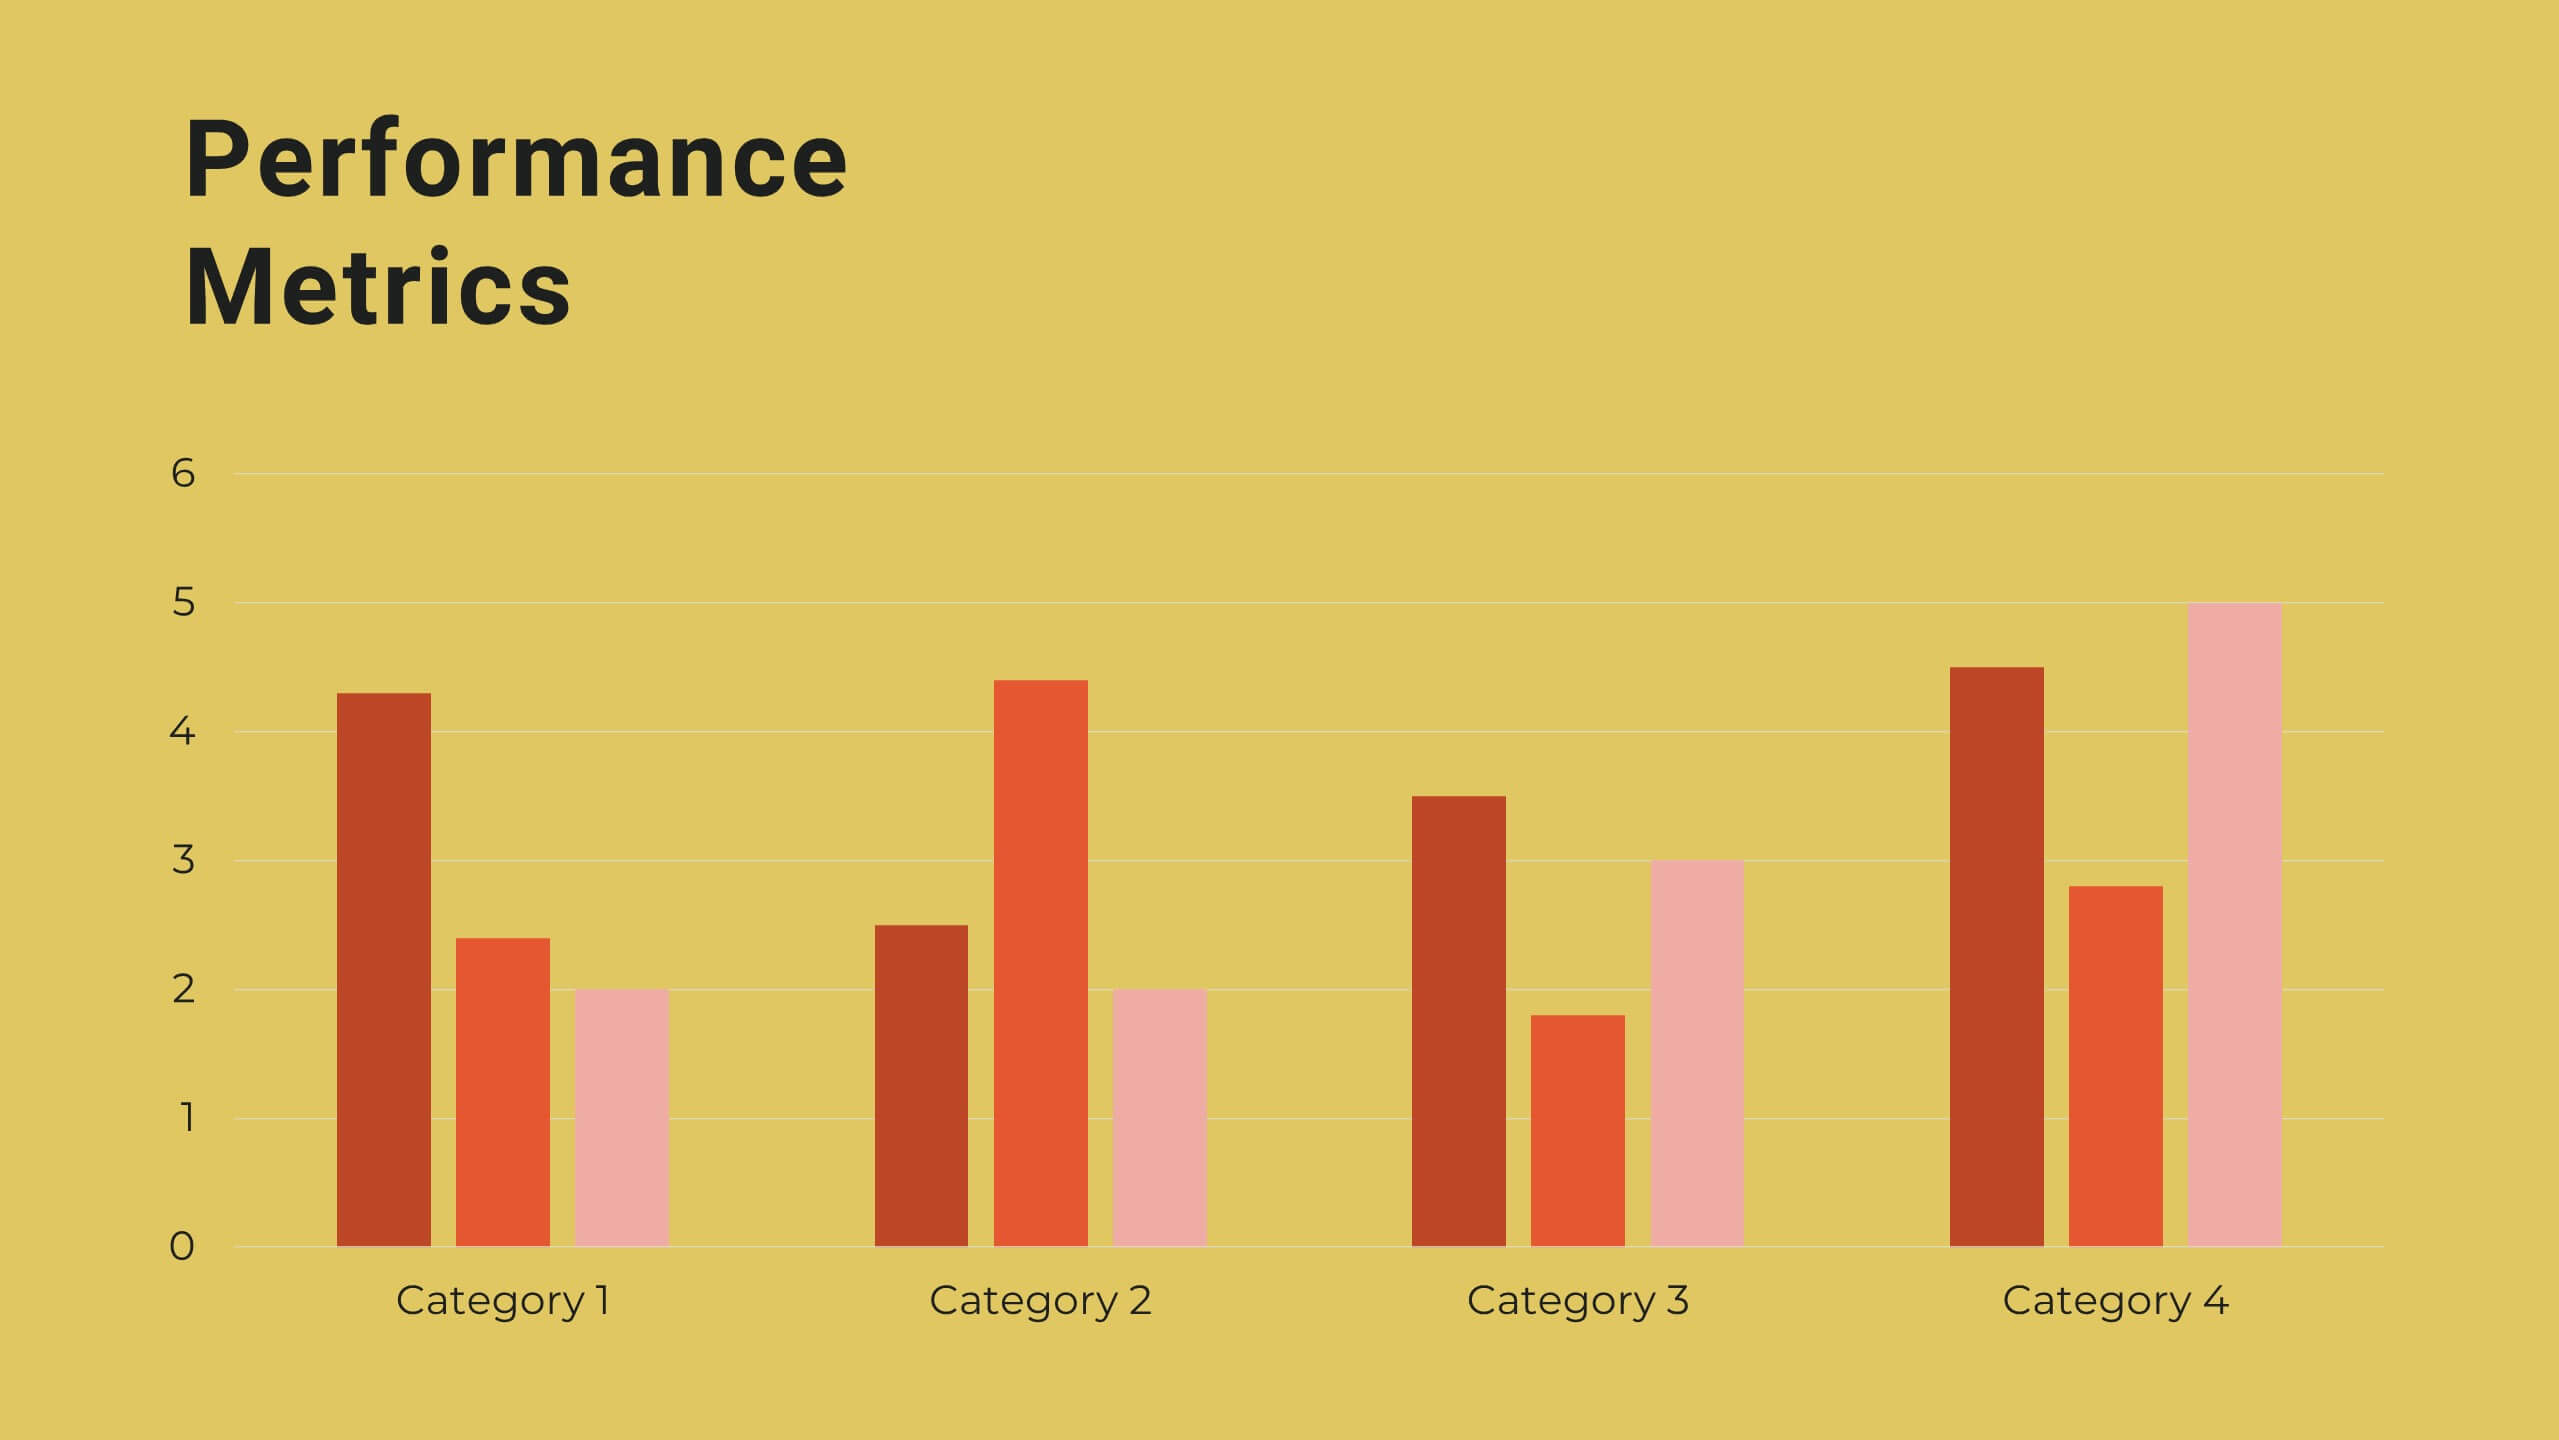
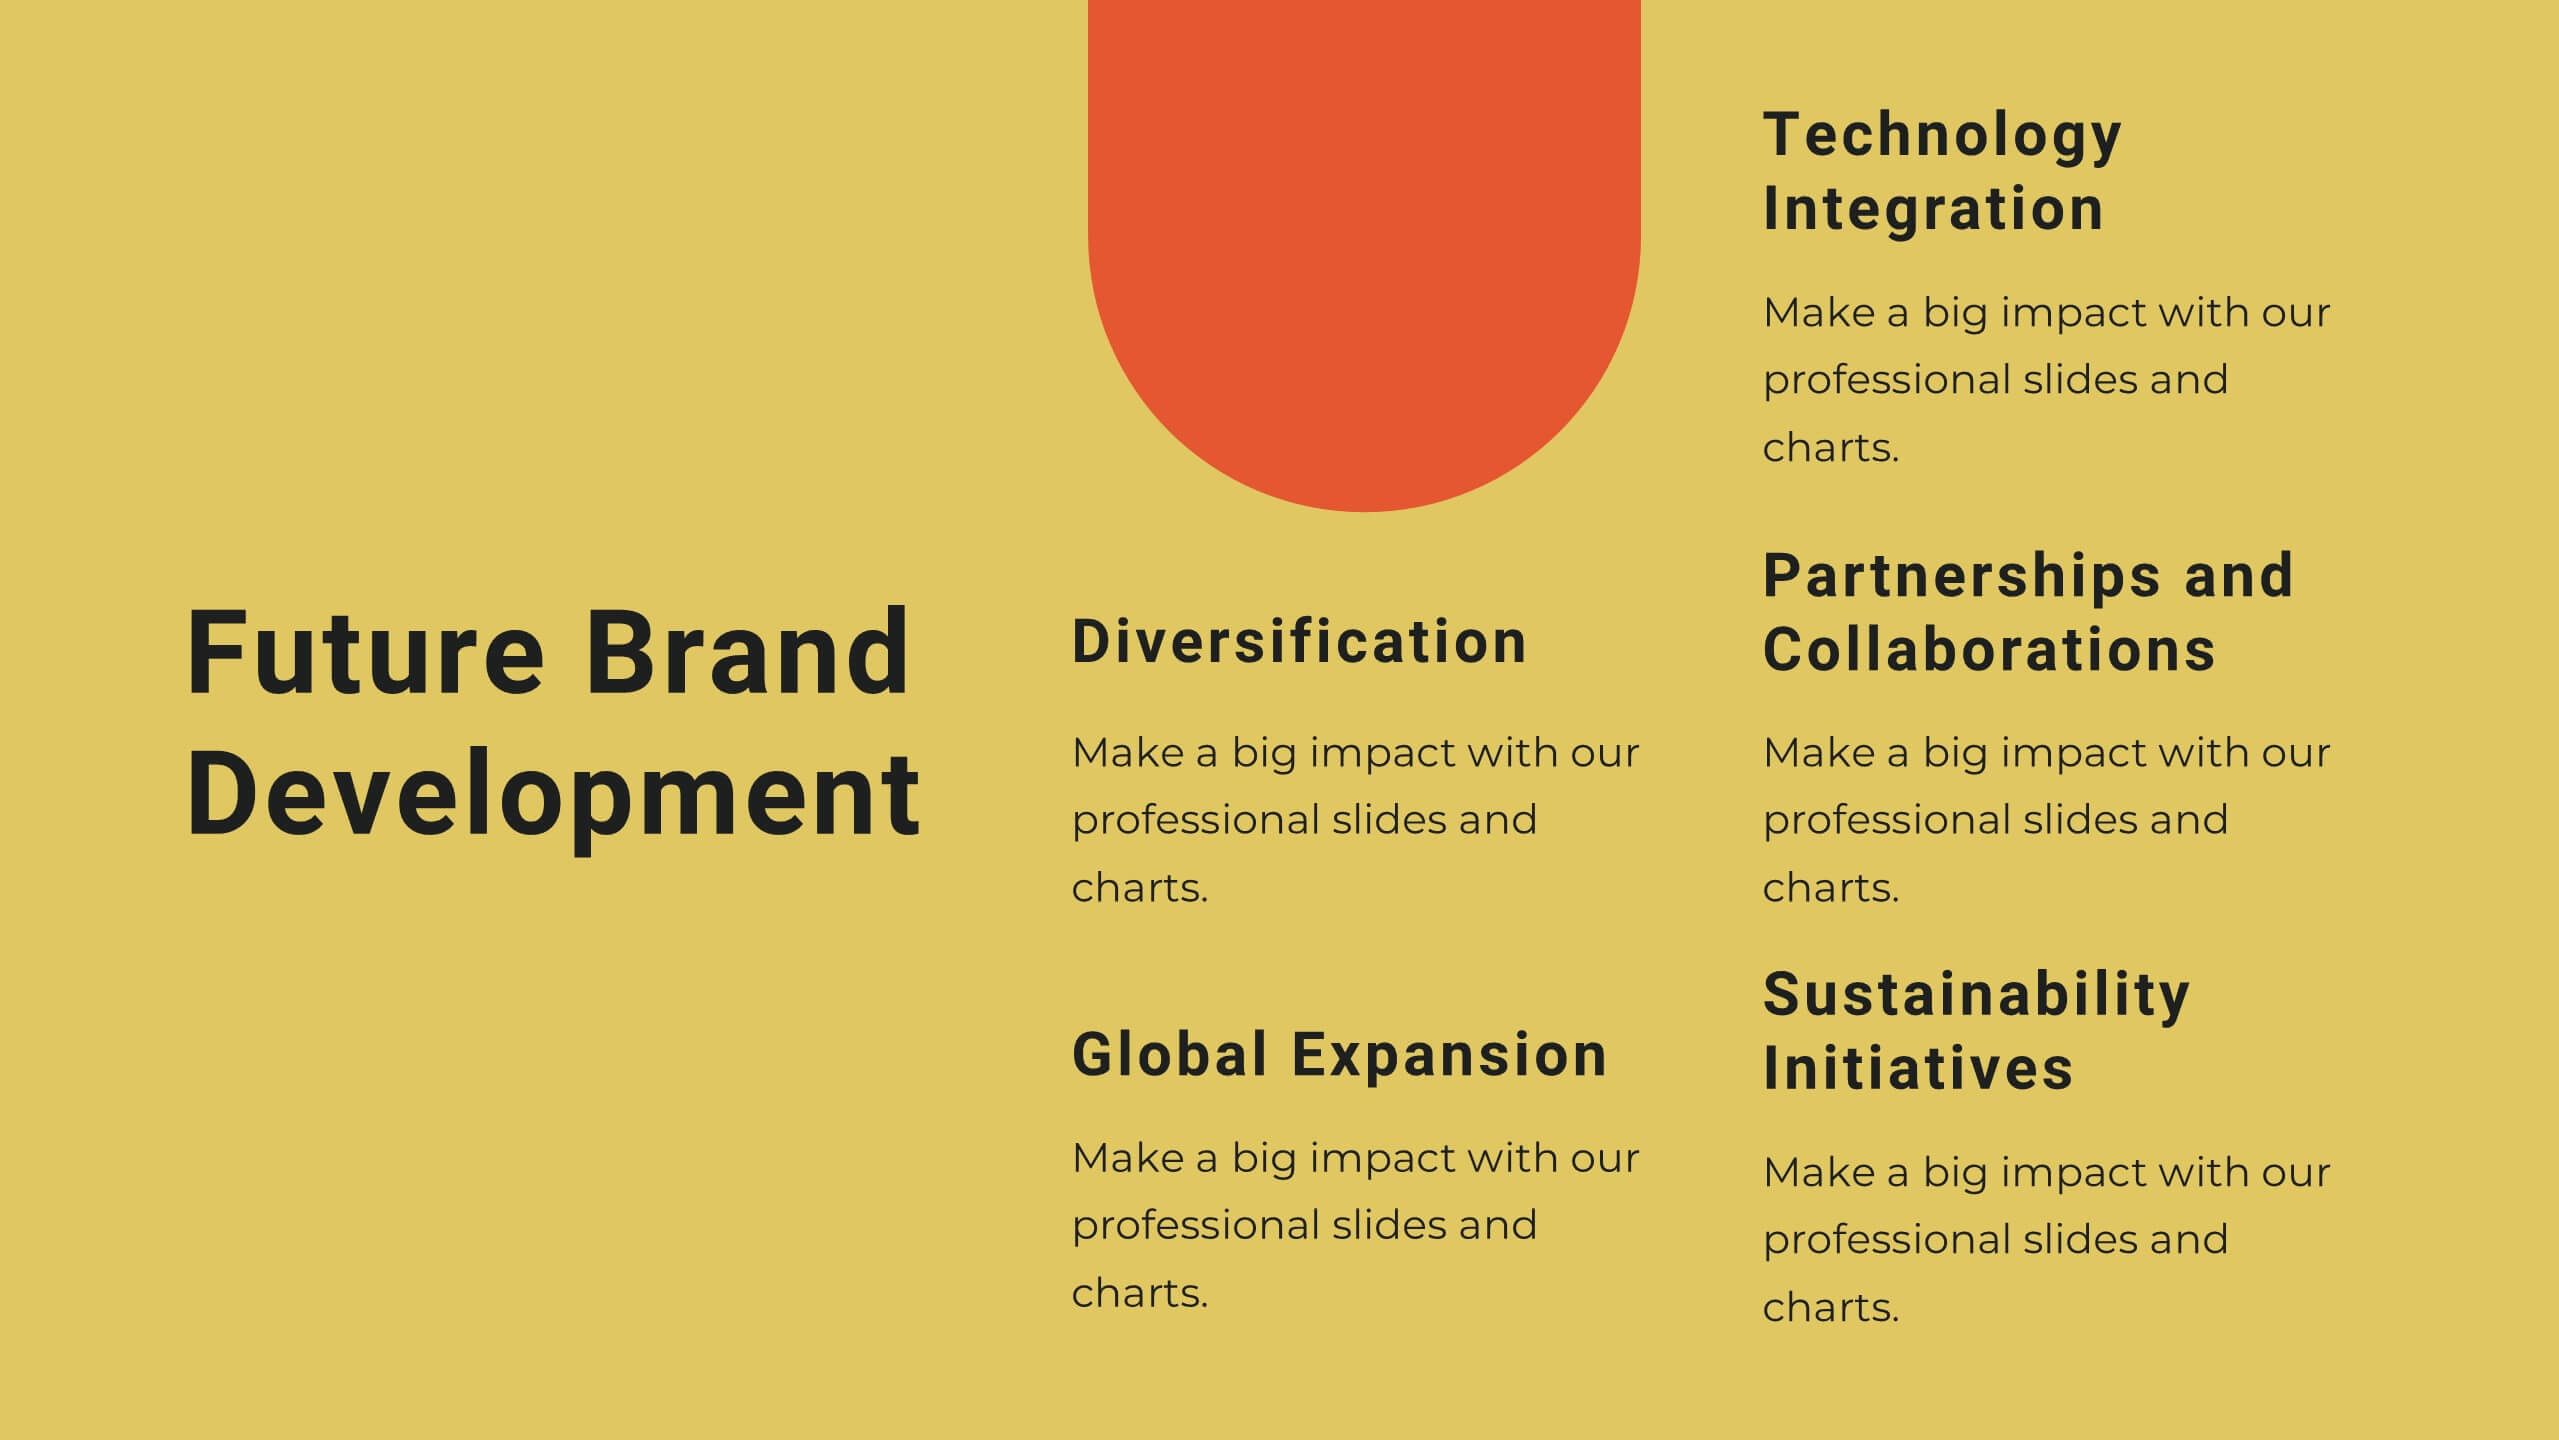
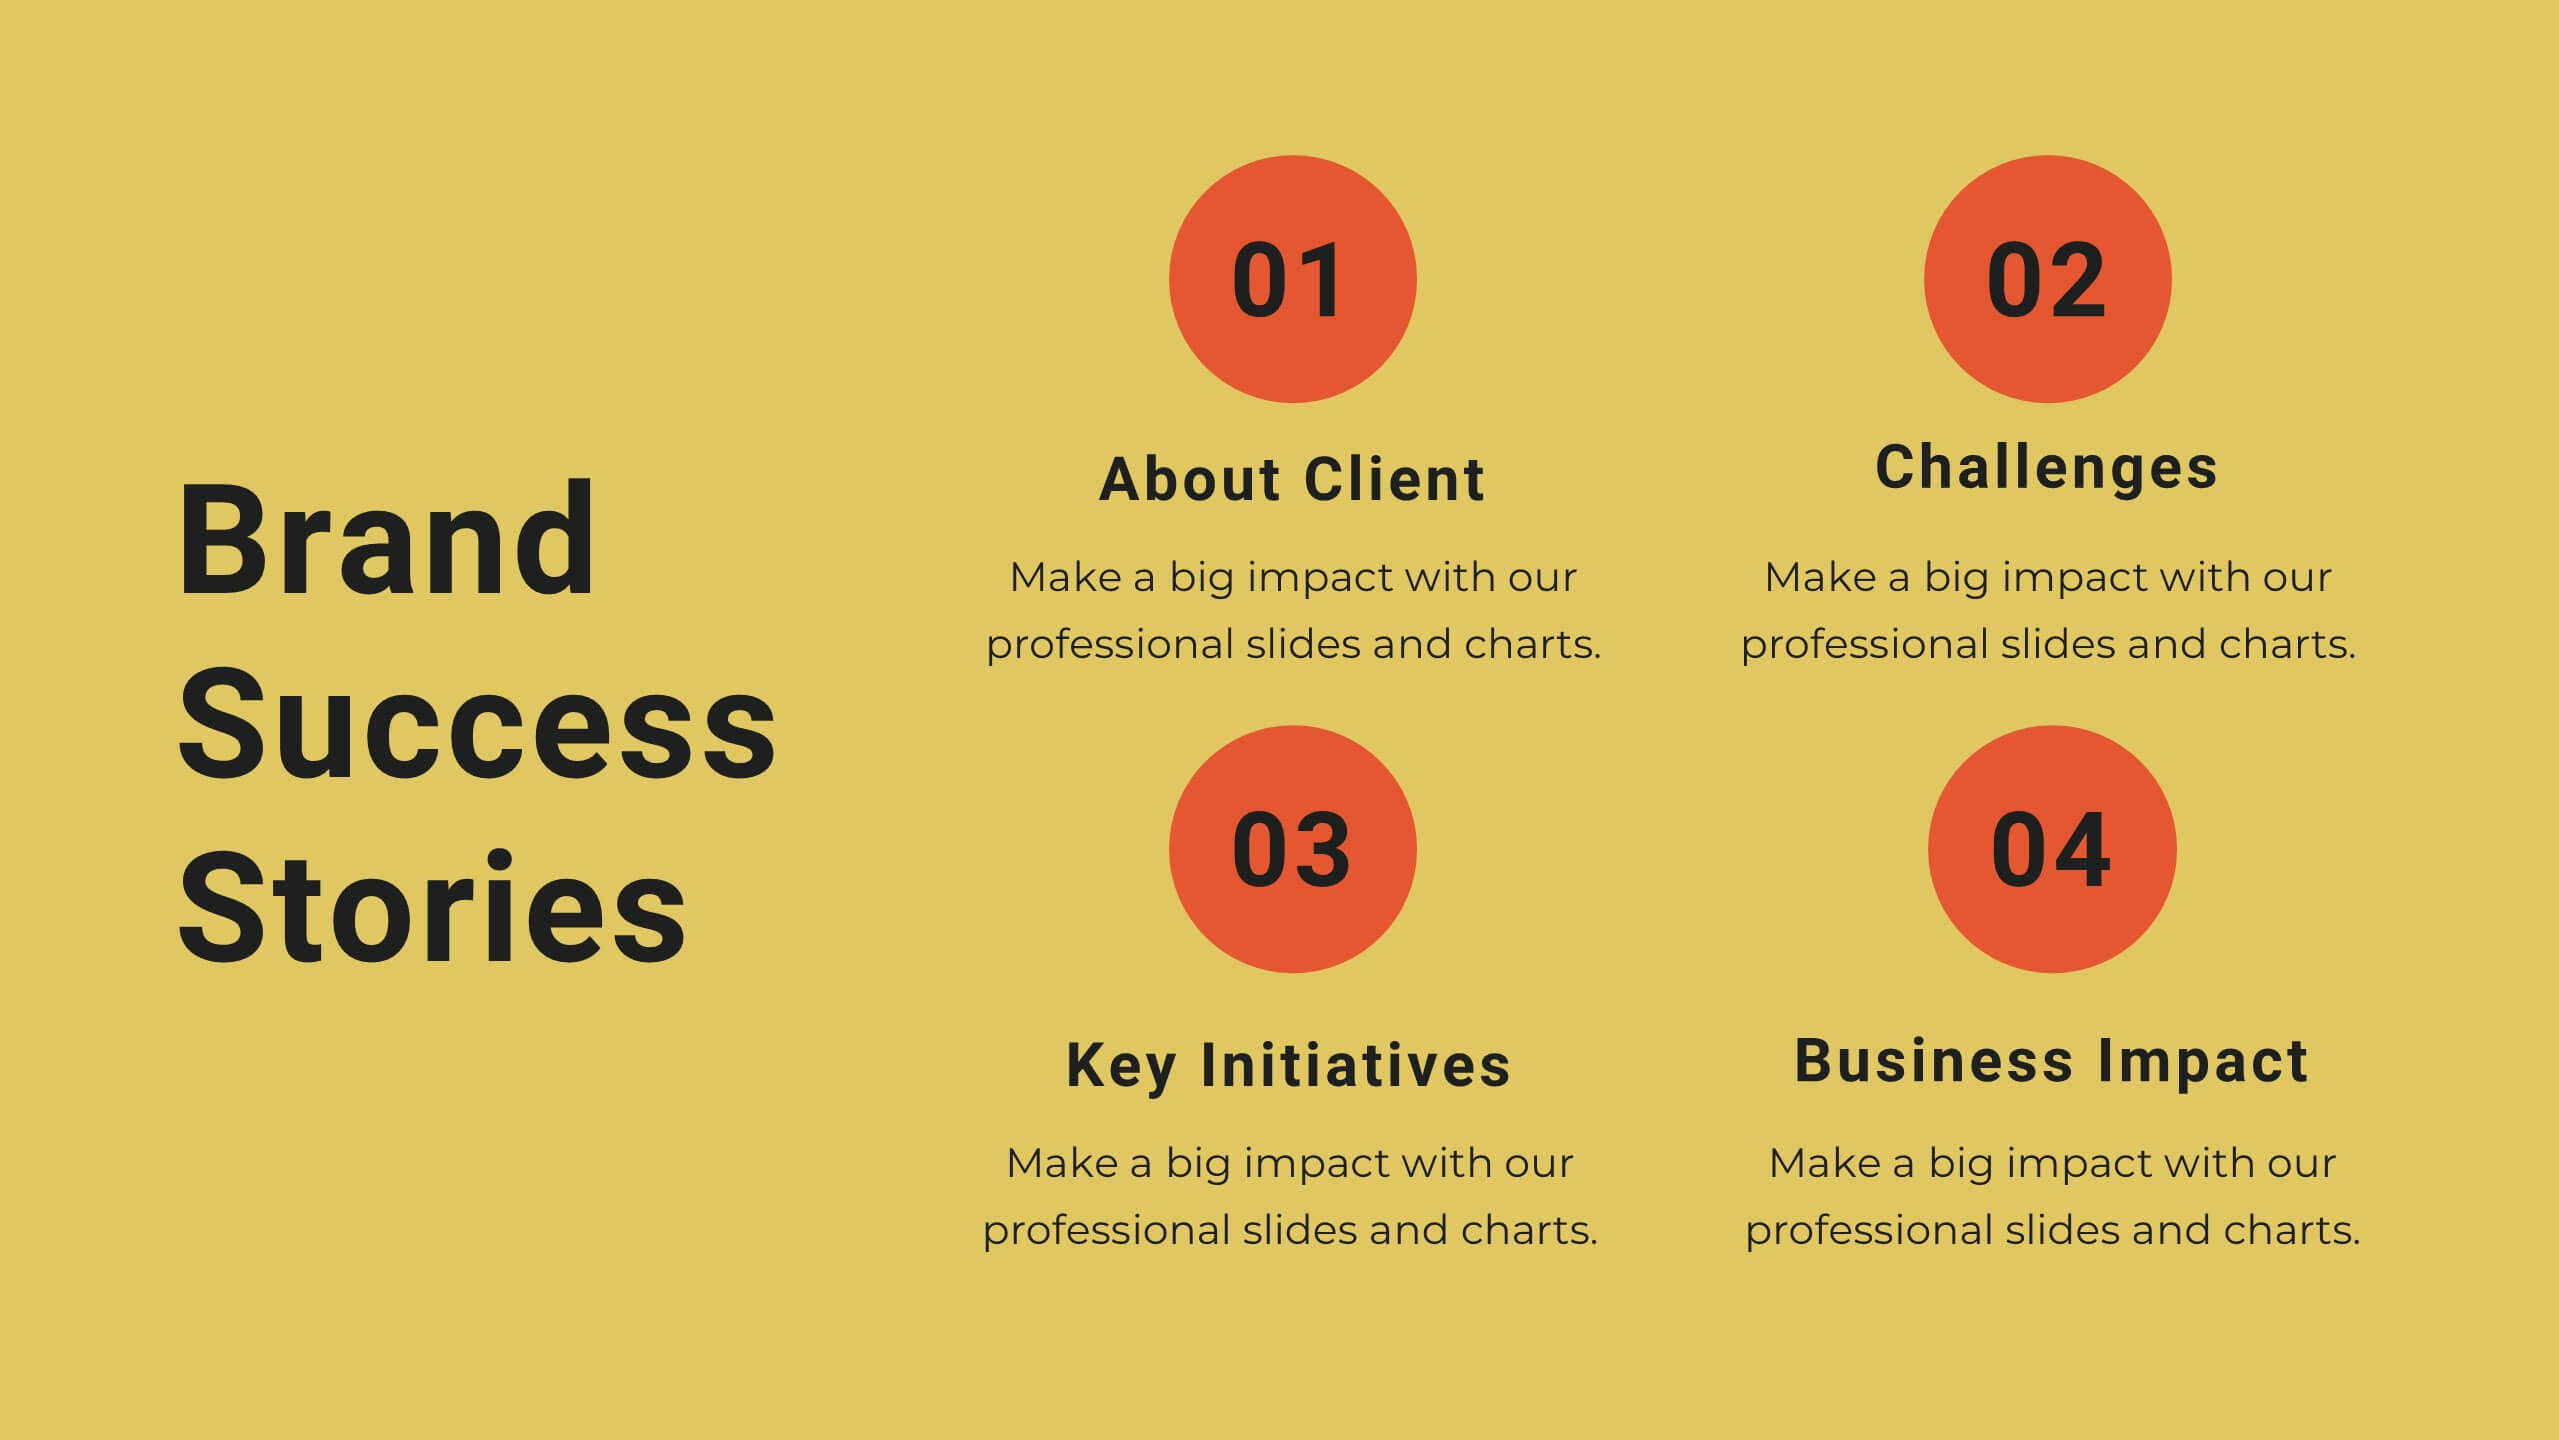
Yttrium Brand Strategy Report Presentation
Present your brand strategy with confidence using this vibrant, structured template! Covering brand identity, values, audience personas, and positioning, this template is perfect for crafting a compelling brand narrative. Fully customizable, it’s designed for seamless use in PowerPoint, Keynote, and Google Slides, making it an ideal tool for branding presentations.


3 diapositivas
Training & Development Modules Presentation
Present your program structure with the Training & Development Modules Presentation. This slide design features a 3D cube layout that clearly illustrates three learning modules, each with space for a title, icon, and description. Ideal for onboarding, employee growth, or educational programs. Fully editable in Canva, PowerPoint, Keynote, and Google Slides.