


Características


¿Tienes alguna pregunta?
Recomendar


6 diapositivas
Break-Even Point Financial Analysis
Simplify financial planning with this modern break-even analysis diagram. Ideal for startups, project managers, and finance teams, this circular layout visually tracks six key financial stages. Use it to illustrate cost structures, revenue goals, and profitability timelines. Fully editable in PowerPoint, Keynote, and Google Slides.


5 diapositivas
E-Learning and Digital Education Trends Presentation
Stay ahead in the digital learning space with the E-Learning and Digital Education Trends Presentation template. Designed for educators, trainers, and e-learning professionals, this modern and insightful layout highlights key trends, innovative tools, and strategies in online education. With fully customizable elements, you can tailor the slides to your audience’s needs. Compatible with PowerPoint, Keynote, and Google Slides for a seamless presentation experience.


6 diapositivas
Customer Support Team Infographic
The set of slides presented is meticulously designed to encapsulate the essence of customer support team operations, highlighting various key aspects such as teamwork, communication channels, customer interaction points, and support strategies. Each slide utilizes a clean and professional design, integrating soft color palettes and structured layouts to clearly convey complex information in an accessible way. These slides are particularly useful for customer support teams looking to present or revamp their strategy, showcasing how they handle customer queries and feedback across different platforms. The visual elements such as graphs, hierarchical diagrams, and process flows are strategically used to illustrate the team’s structure, response processes, and efficiency metrics, making it easier for stakeholders to grasp the effectiveness of customer support initiatives. Such a collection is indispensable for training new team members, demonstrating the team's impact on customer satisfaction, and internal reviews to improve service delivery. By using these slides, teams can ensure a consistent understanding of goals, roles, and procedures, which is crucial for maintaining high standards of customer service and team alignment.


10 diapositivas
Corporate Sustainability Goals Planning
Drive environmental impact with clarity using the Corporate Sustainability Goals Planning Presentation. This clean, circular infographic helps communicate sustainability initiatives, eco-objectives, and long-term strategy with ease. Perfect for ESG reports, internal goal tracking, or stakeholder updates. Fully editable in PowerPoint, Keynote, and Google Slides.


10 diapositivas
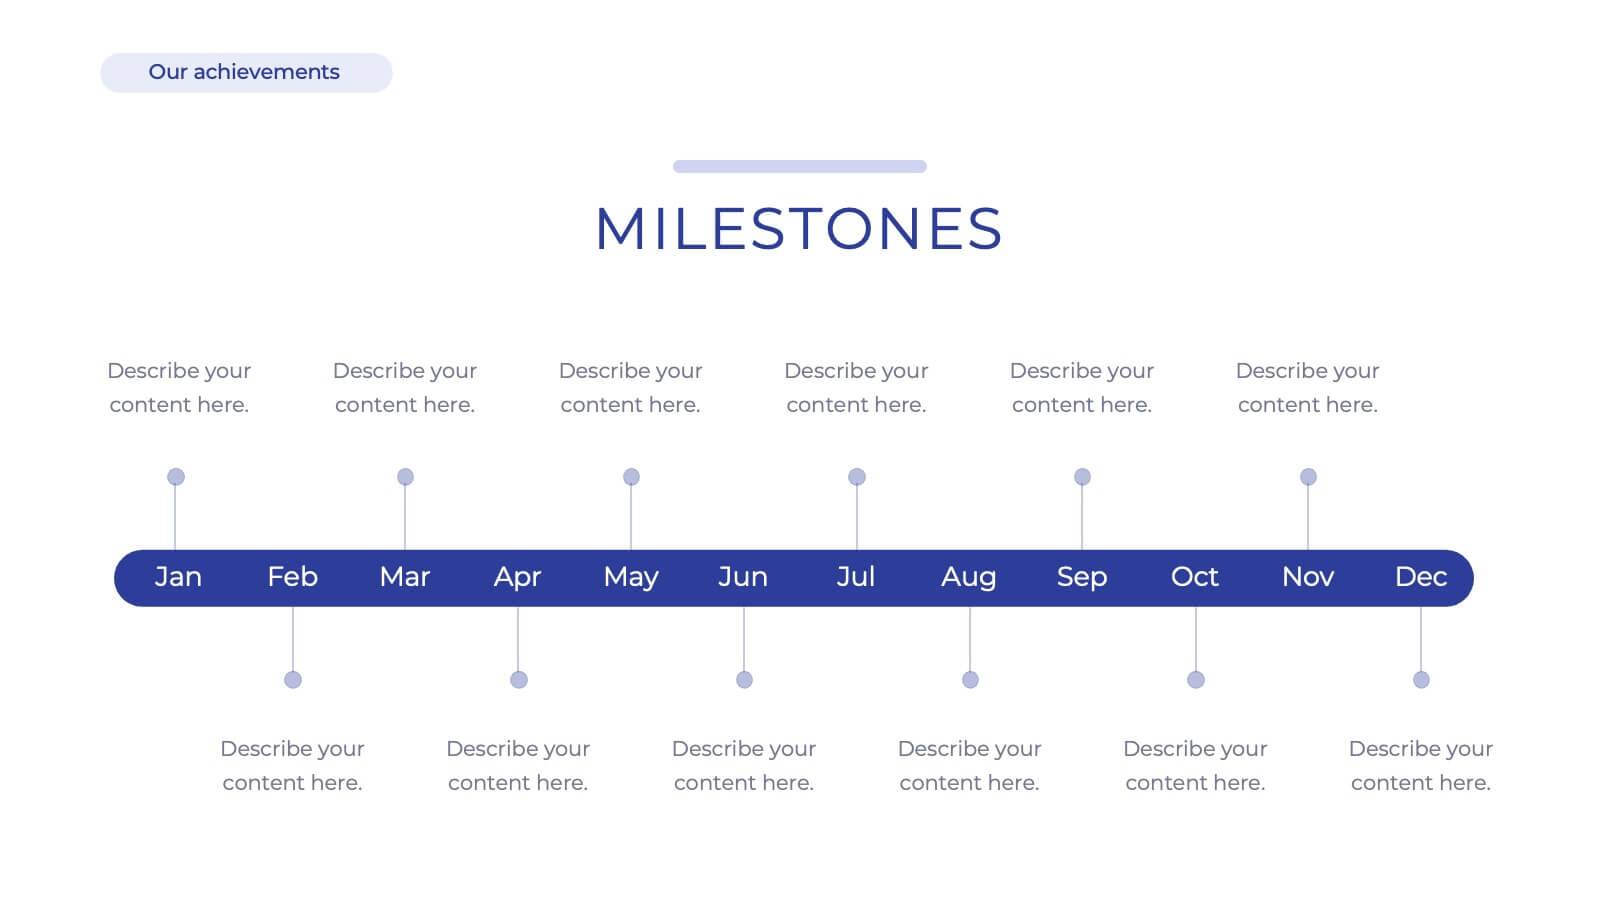
Growth Strategy in Four Steps Presentation
Achieve sustainable business expansion with the Growth Strategy in Four Steps presentation. This structured template guides teams through progressive development phases, using clear visuals to illustrate key milestones and percentage-based improvements. Ideal for entrepreneurs, marketers, and business strategists, this slide layout is fully customizable and compatible with PowerPoint, Keynote, and Google Slides for seamless integration into your workflow.


5 diapositivas
Target Audience Demographics
Present gender-based audience insights with this clean, dual-bar infographic slide. Ideal for showing comparative statistics between men and women across five demographic categories. Use this layout to support marketing analysis, campaign targeting, or consumer behavior reports. Editable in PowerPoint, Keynote, and Google Slides.


4 diapositivas
Current Project Health and Status Report Presentation
Track progress with clarity using the Current Project Health and Status Report presentation slide. Featuring a modern clipboard layout with checkboxes and project tools like a pencil, magnifier, and ruler, this slide is perfect for highlighting task completion, pending issues, and project milestones. Ideal for weekly updates, stakeholder reviews, or status dashboards. Fully editable in PowerPoint, Keynote, and Google Slides.


7 diapositivas
Process Flow Chart Infographic
Flowcharts are the best way to get your point across—and this one is no exception. This infographic chart shows the steps that you need to take in order to create a high-energy flow chart. You start with the basic foundation of your chart, then add information about the different parts of it, and finally bring it all together by adding details to each part of the chart. This a great way to organize information, and it makes it easy for your audience to see how things fit together. Compatible with Powerpoint, Keynote, and Google Slides. This templates is fully customizable: you can change colors and fonts as needed, or add your own images to make them unique.


4 diapositivas
Workflow Bottleneck Fishbone Analysis
Identify slowdowns and streamline performance with the Workflow Bottleneck Fishbone Analysis Presentation. This diagram features a horizontally aligned fishbone structure with segmented semicircles, ideal for pinpointing process inefficiencies across stages. Fully customizable in PowerPoint, Keynote, and Google Slides for professional workflow diagnostics.


22 diapositivas
Dakota Corporate Strategy Agenda Presentation
Maximize your strategic sessions with this dynamic corporate strategy agenda presentation template. This template is designed to streamline your business discussions, featuring sections for everything from speaker introductions to session overviews and networking breaks. It’s ideal for conferences, workshops, or any corporate gatherings where a clear, structured schedule is essential. Compatible with major platforms like PowerPoint, Google Slides, and Keynote, it ensures you can organize and execute your agenda efficiently, fostering effective communication and collaboration across your team.


6 diapositivas
Efficient Workflow Management
Highlight process optimization, task delegation, or team productivity strategies using this linear gear-style workflow design. Perfect for operations leaders, project managers, or consultants presenting step-by-step plans. Fully customizable in PowerPoint, Keynote, and Google Slides—edit icons, text, and colors to fit your message.


26 diapositivas
Modern Company Culture Playbook Presentation
A culture playbook is a document or guide that outlines the values, beliefs, behaviors, and norms that define the organizational culture of a company or team. This presentation template is designed to help businesses create and communicate their unique company culture to employees and potential recruits. With a modern and professional design, this presentation provides a comprehensive overview of your company's values, mission, and beliefs, fostering a positive and inclusive work environment. Illustrate your company's vision for the future and its role in shaping a better world, encouraging employees to be part of a meaningful journey.


20 diapositivas
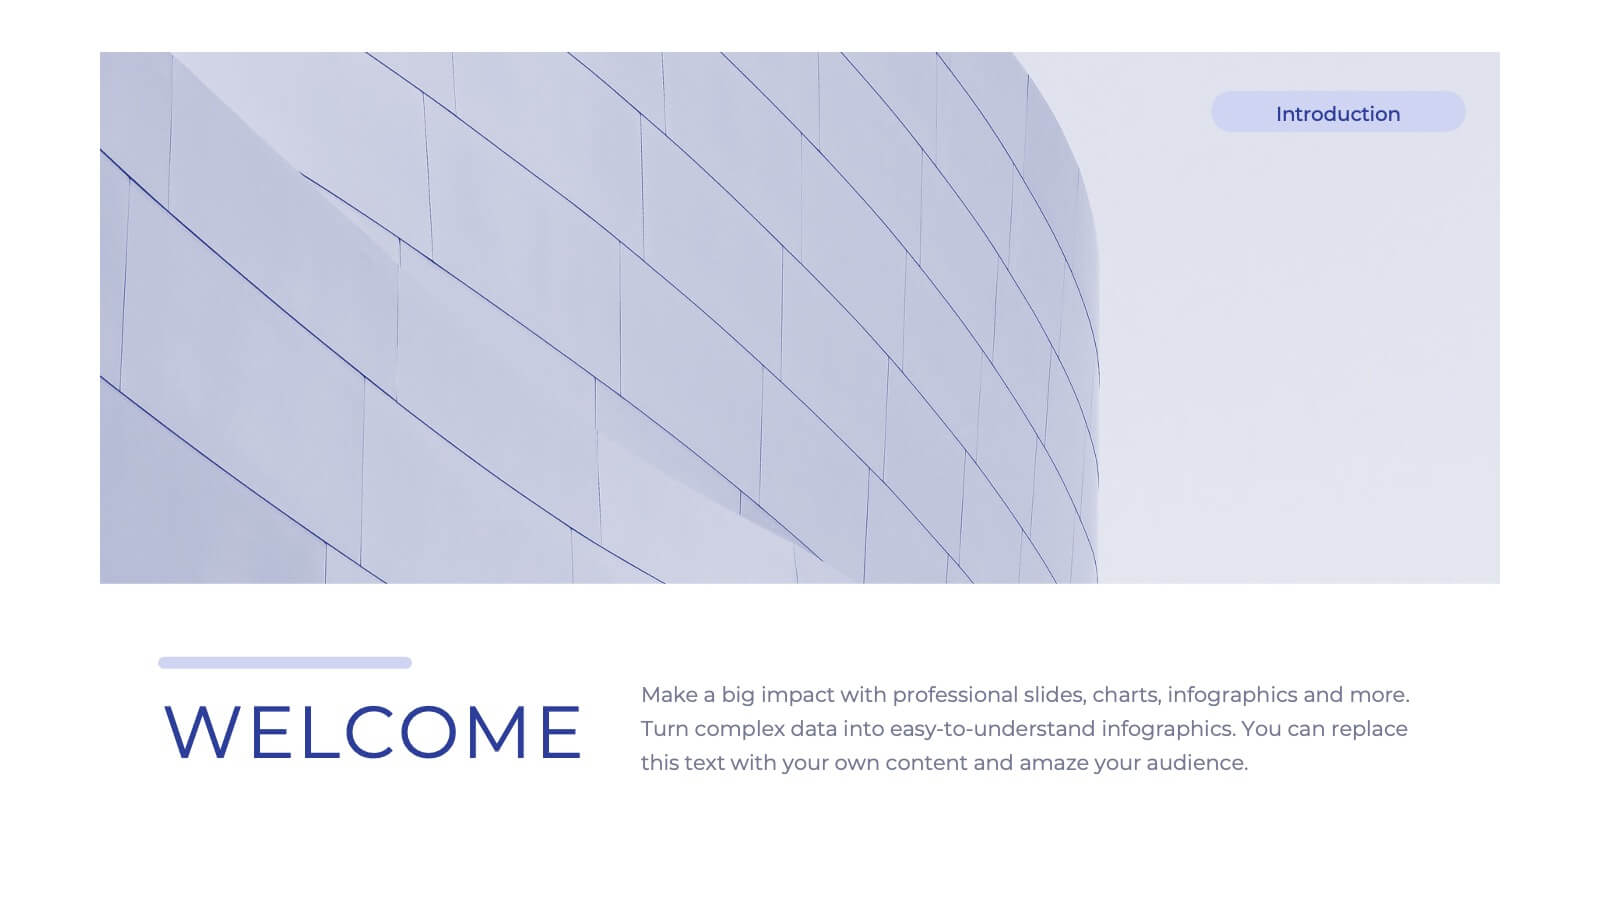
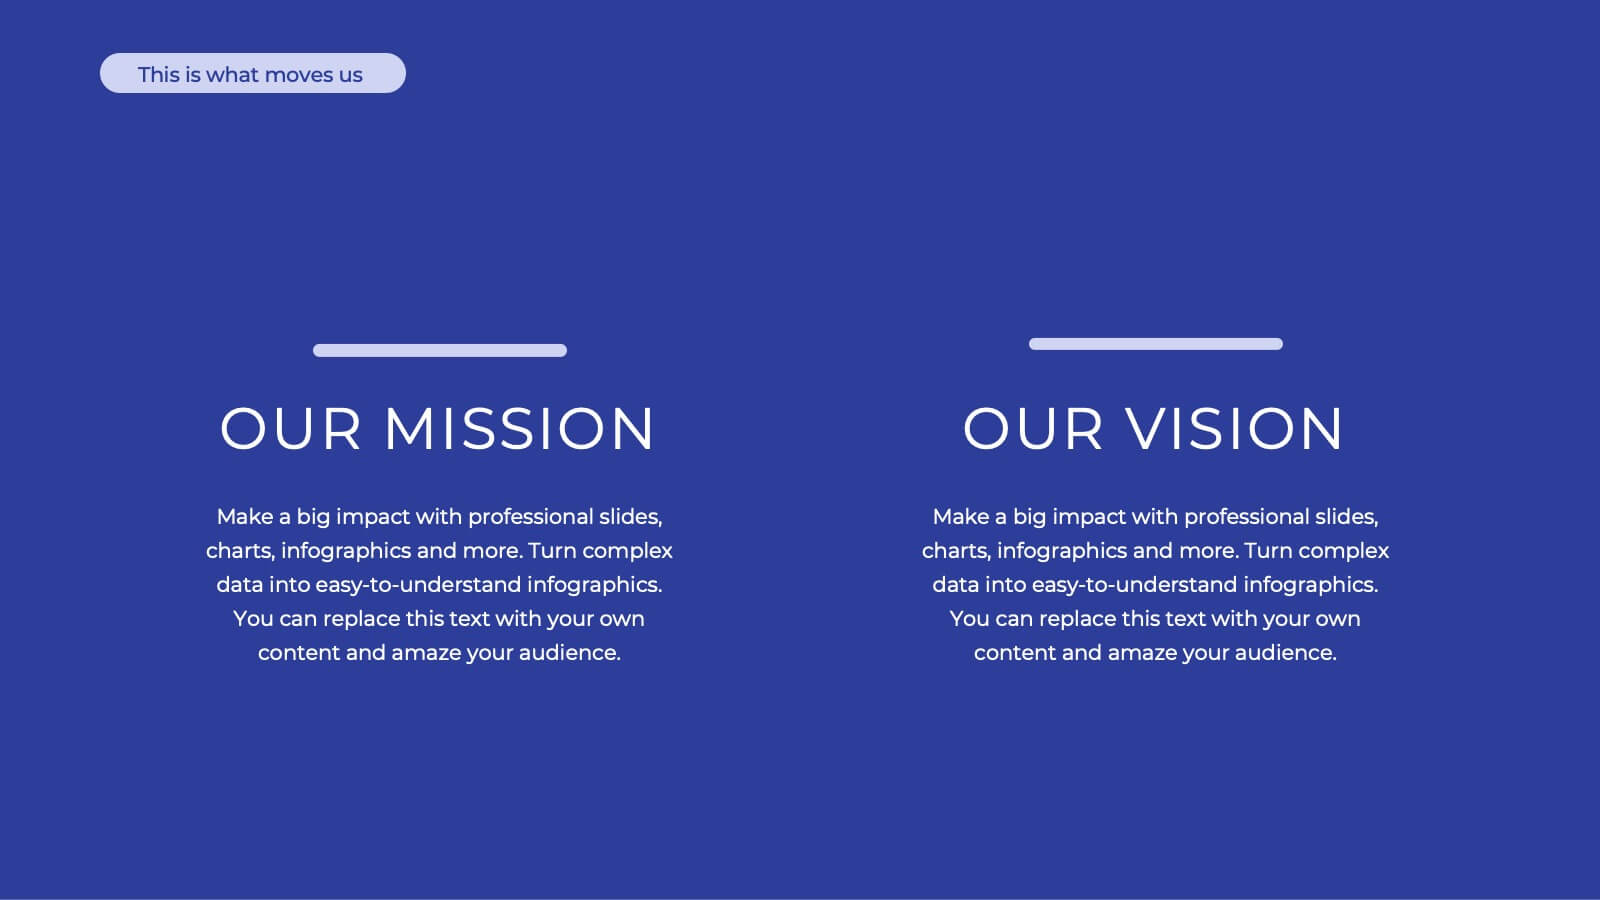
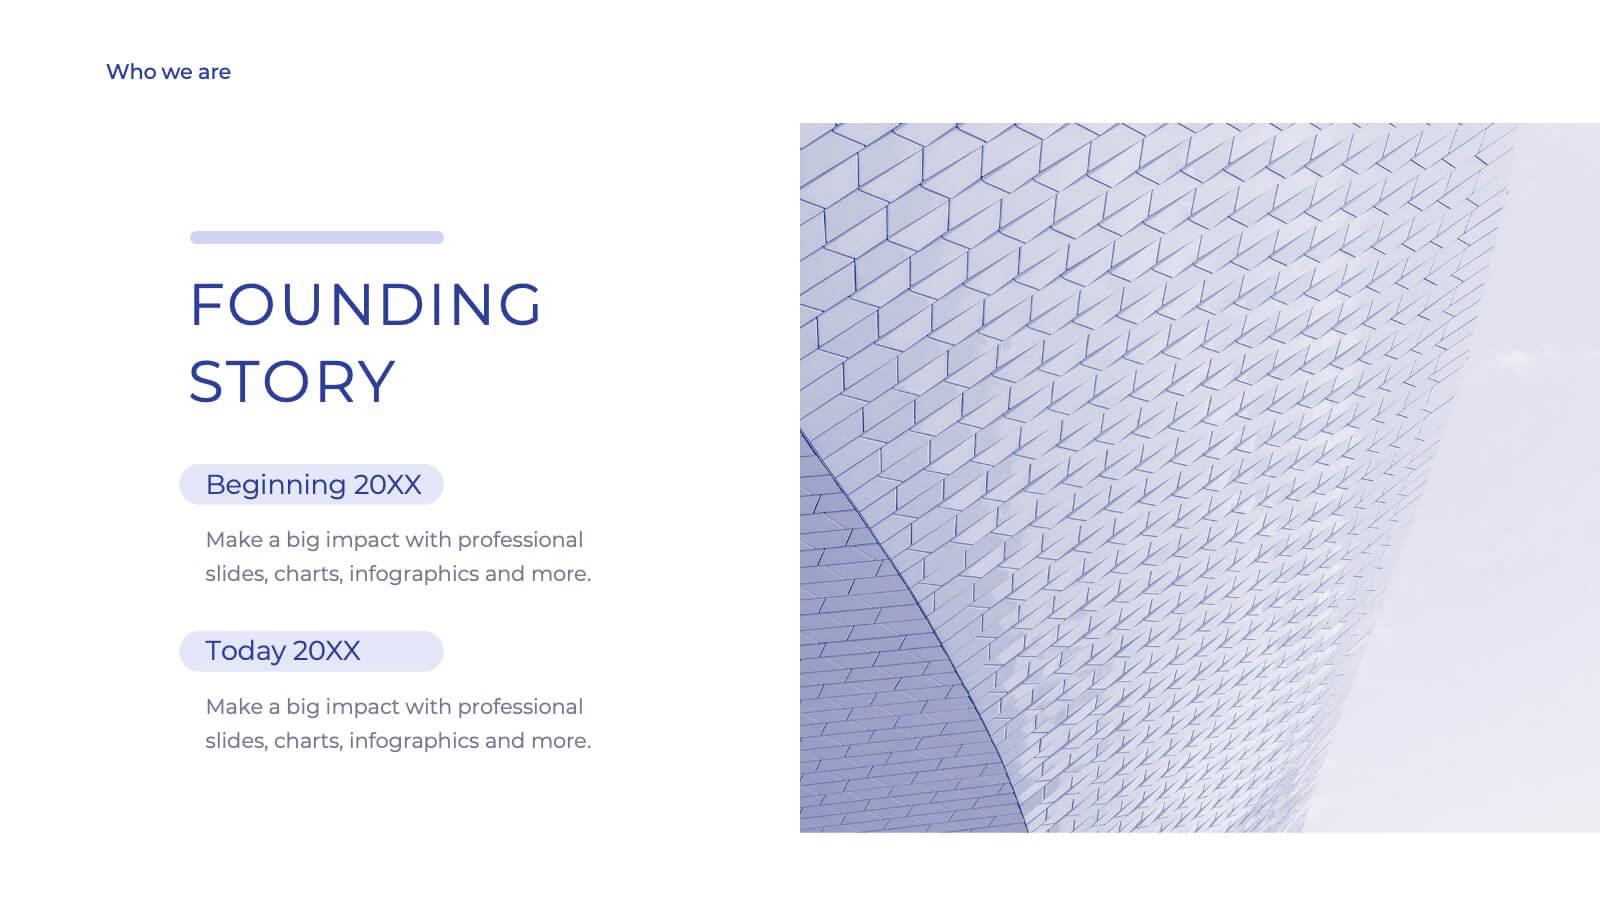
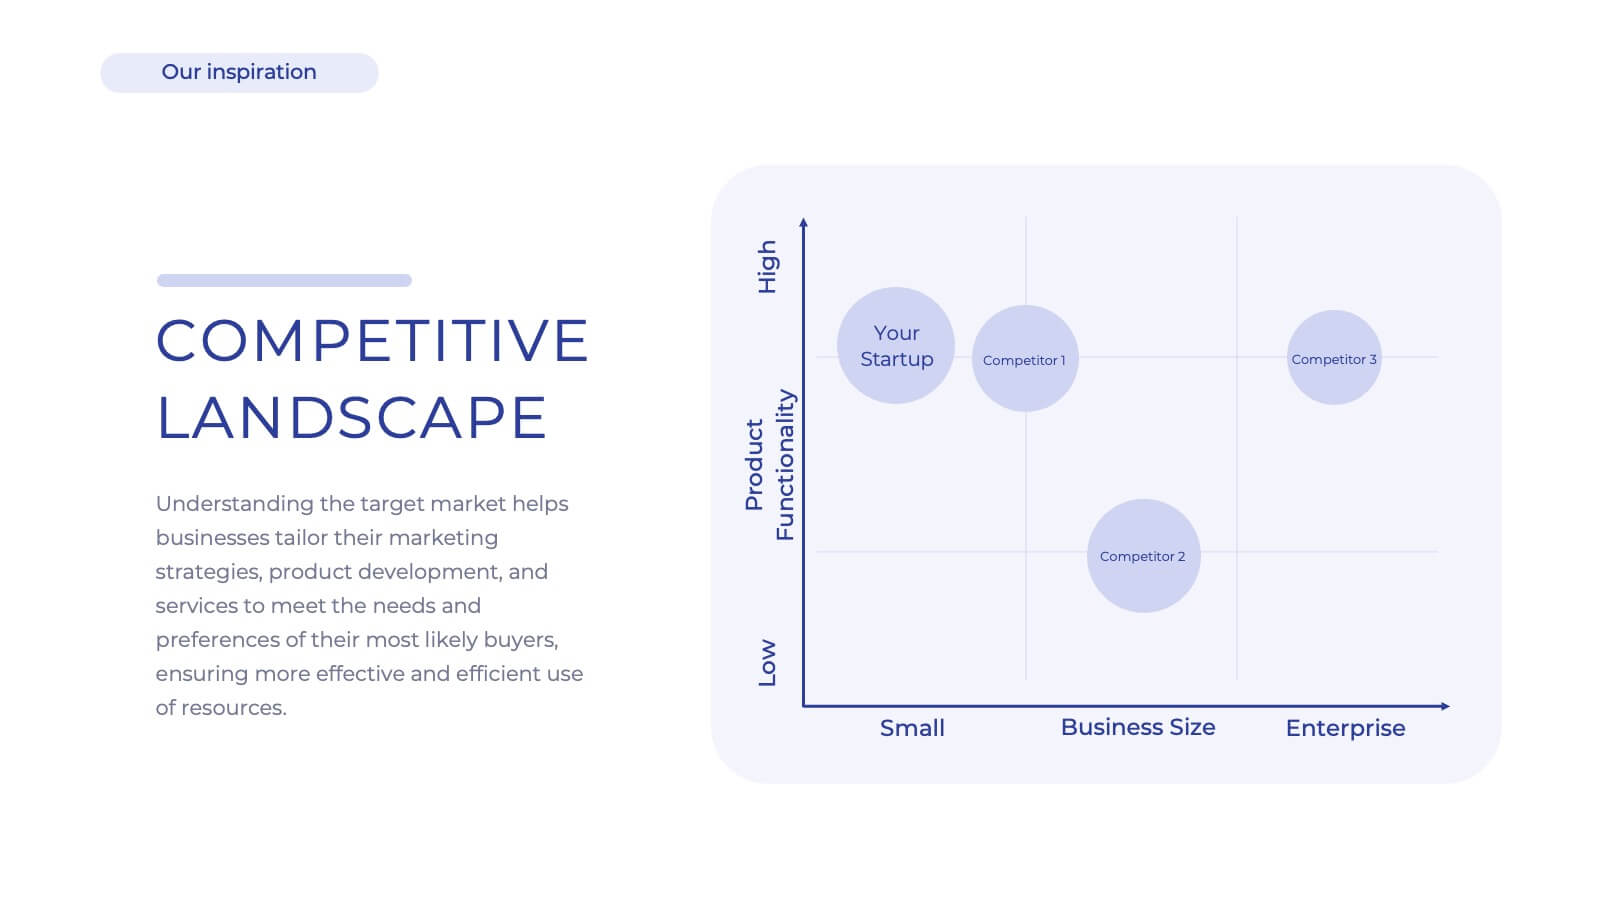
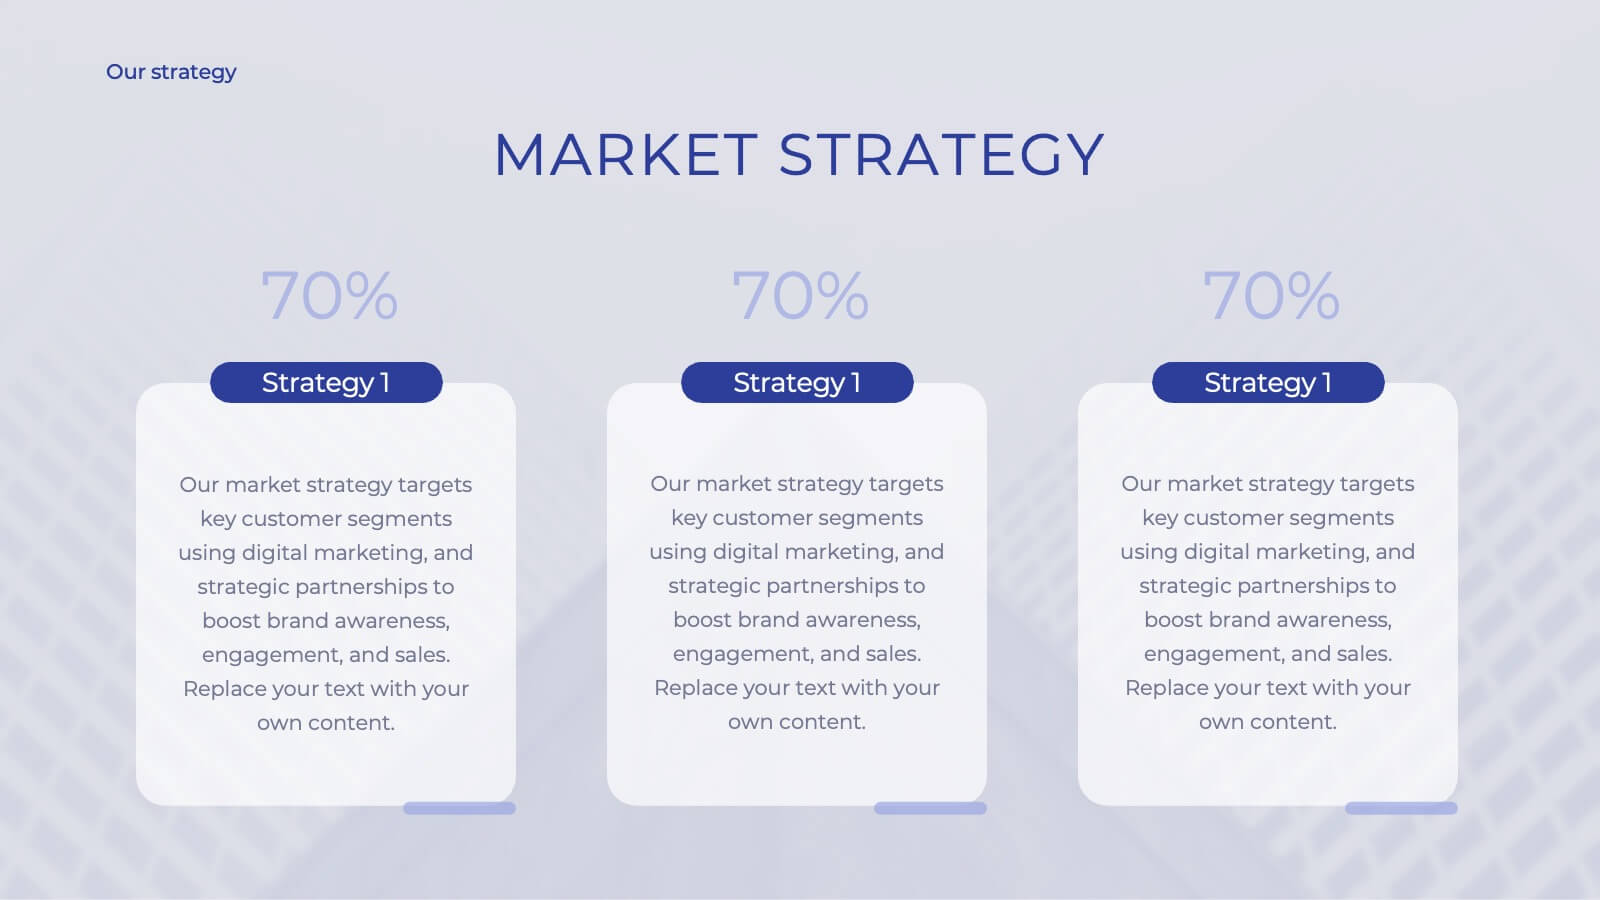
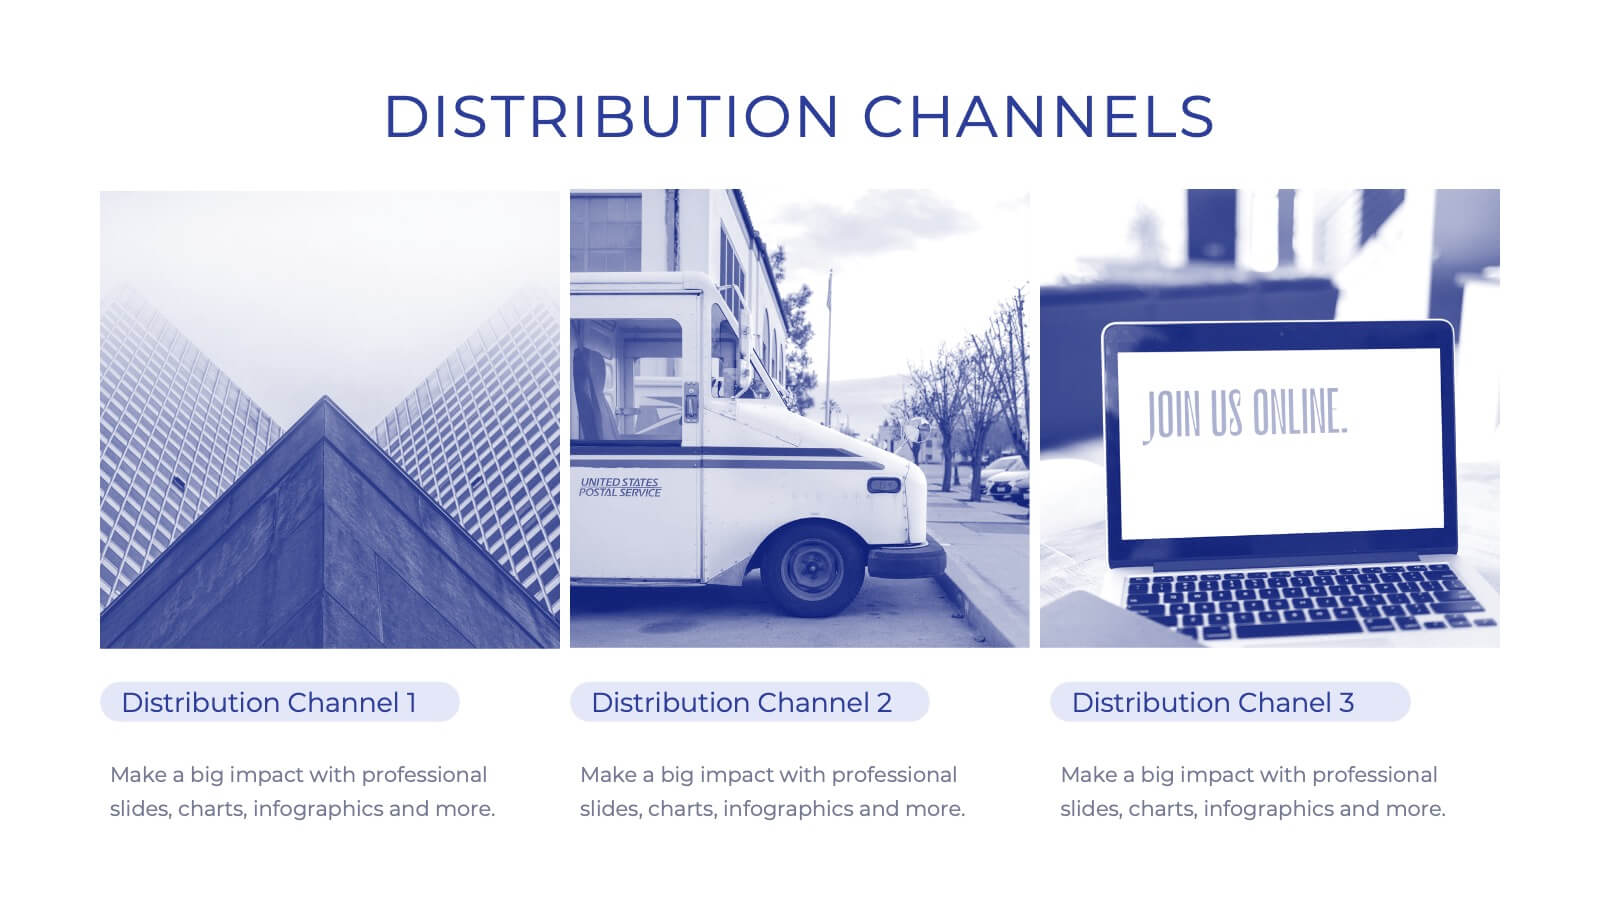
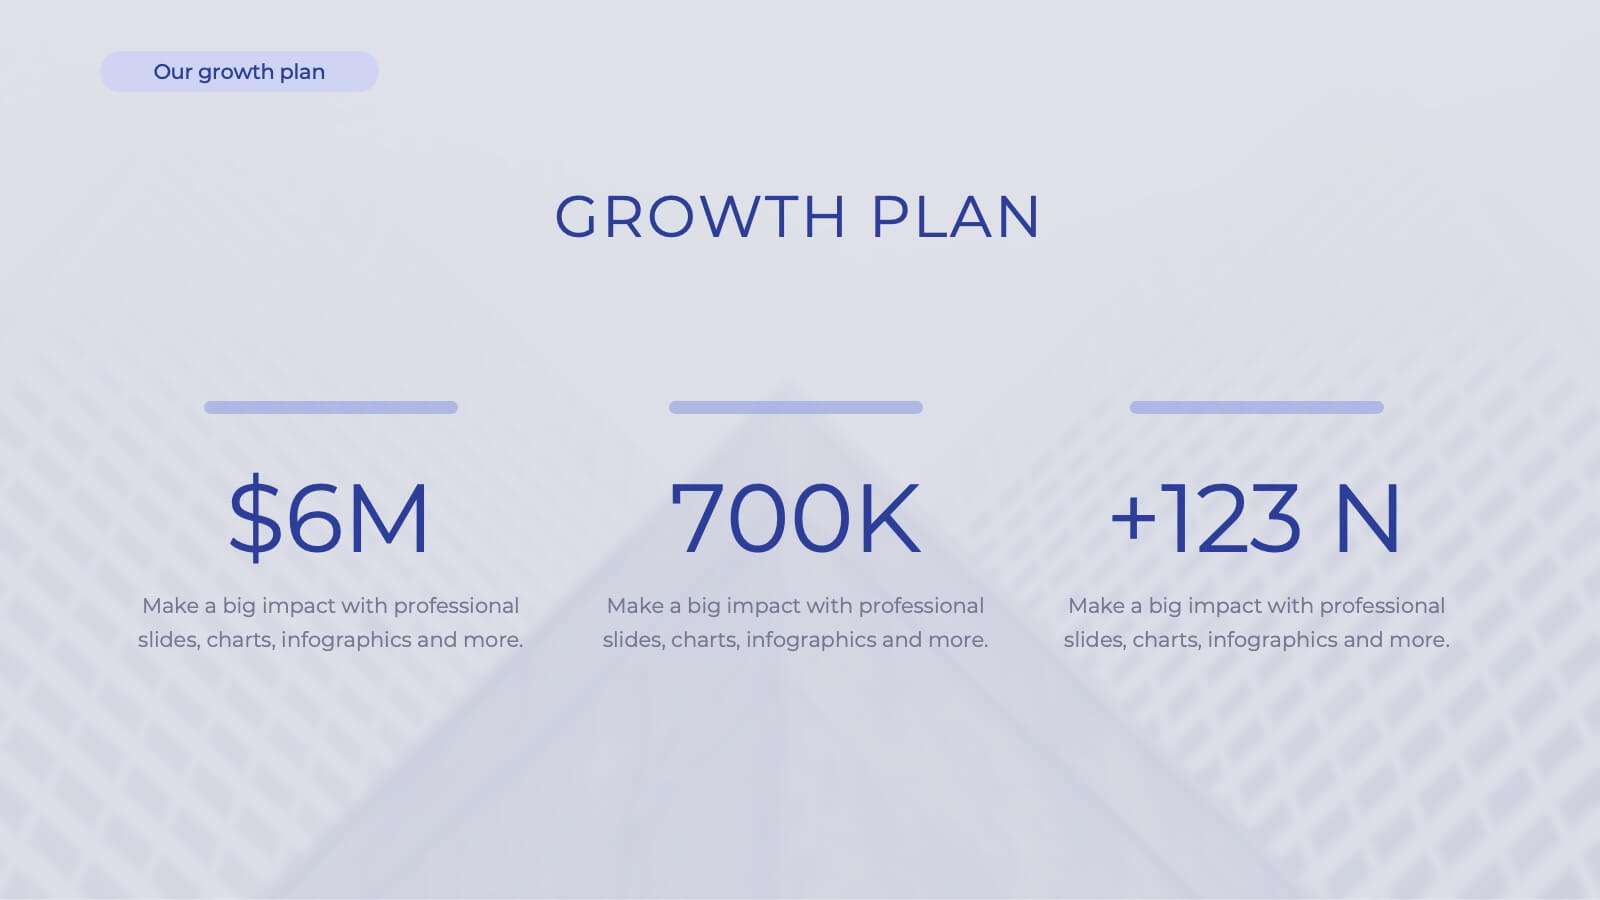
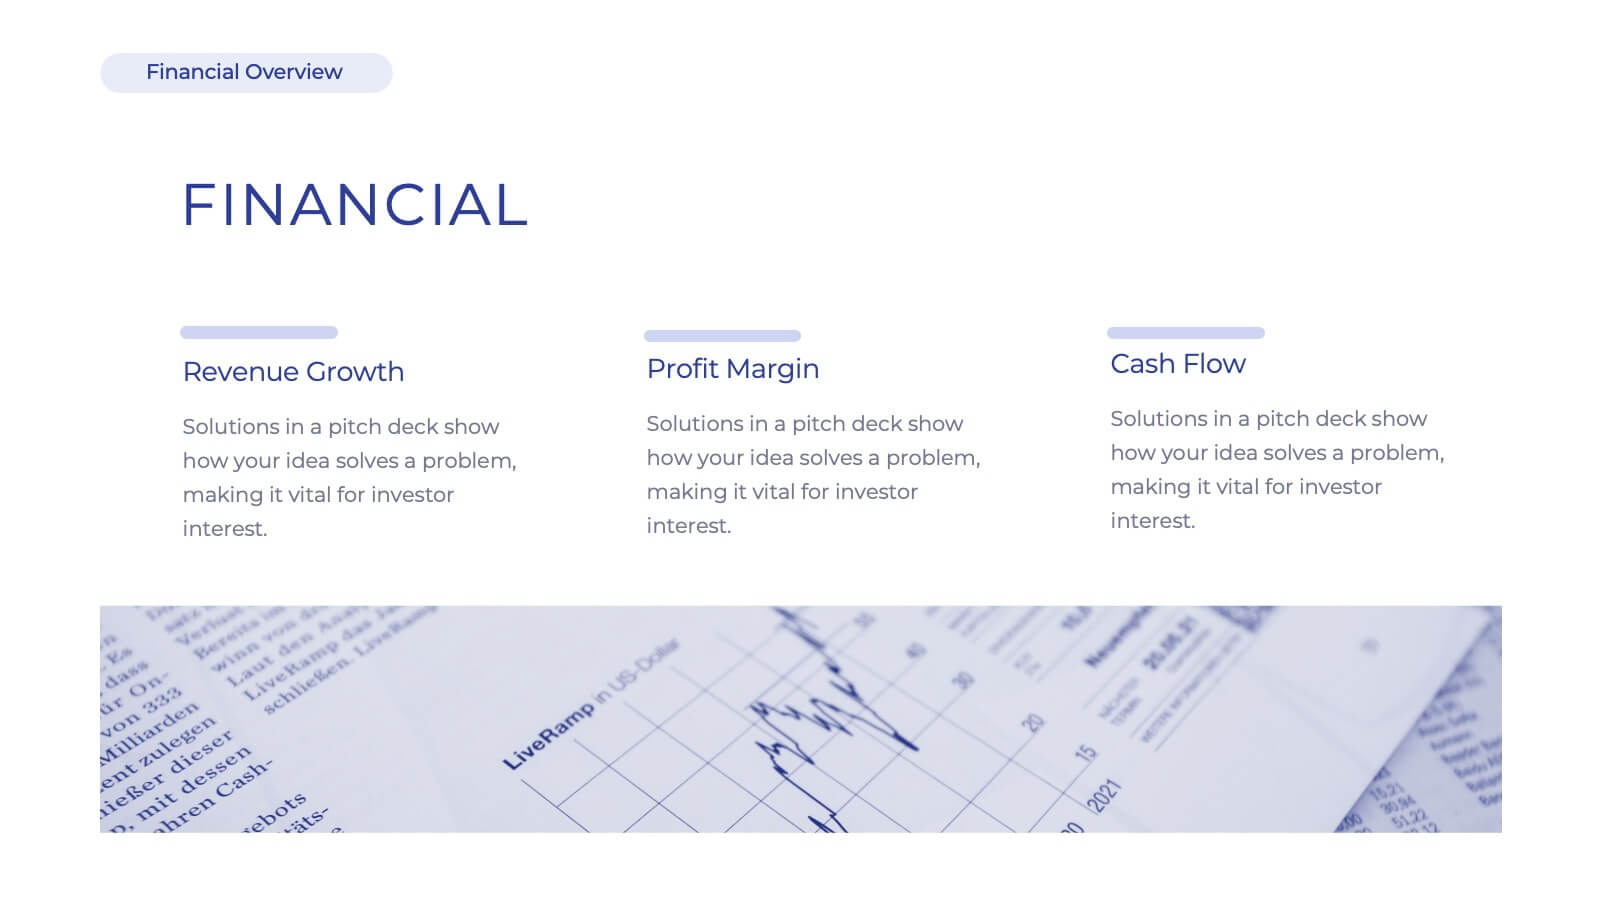
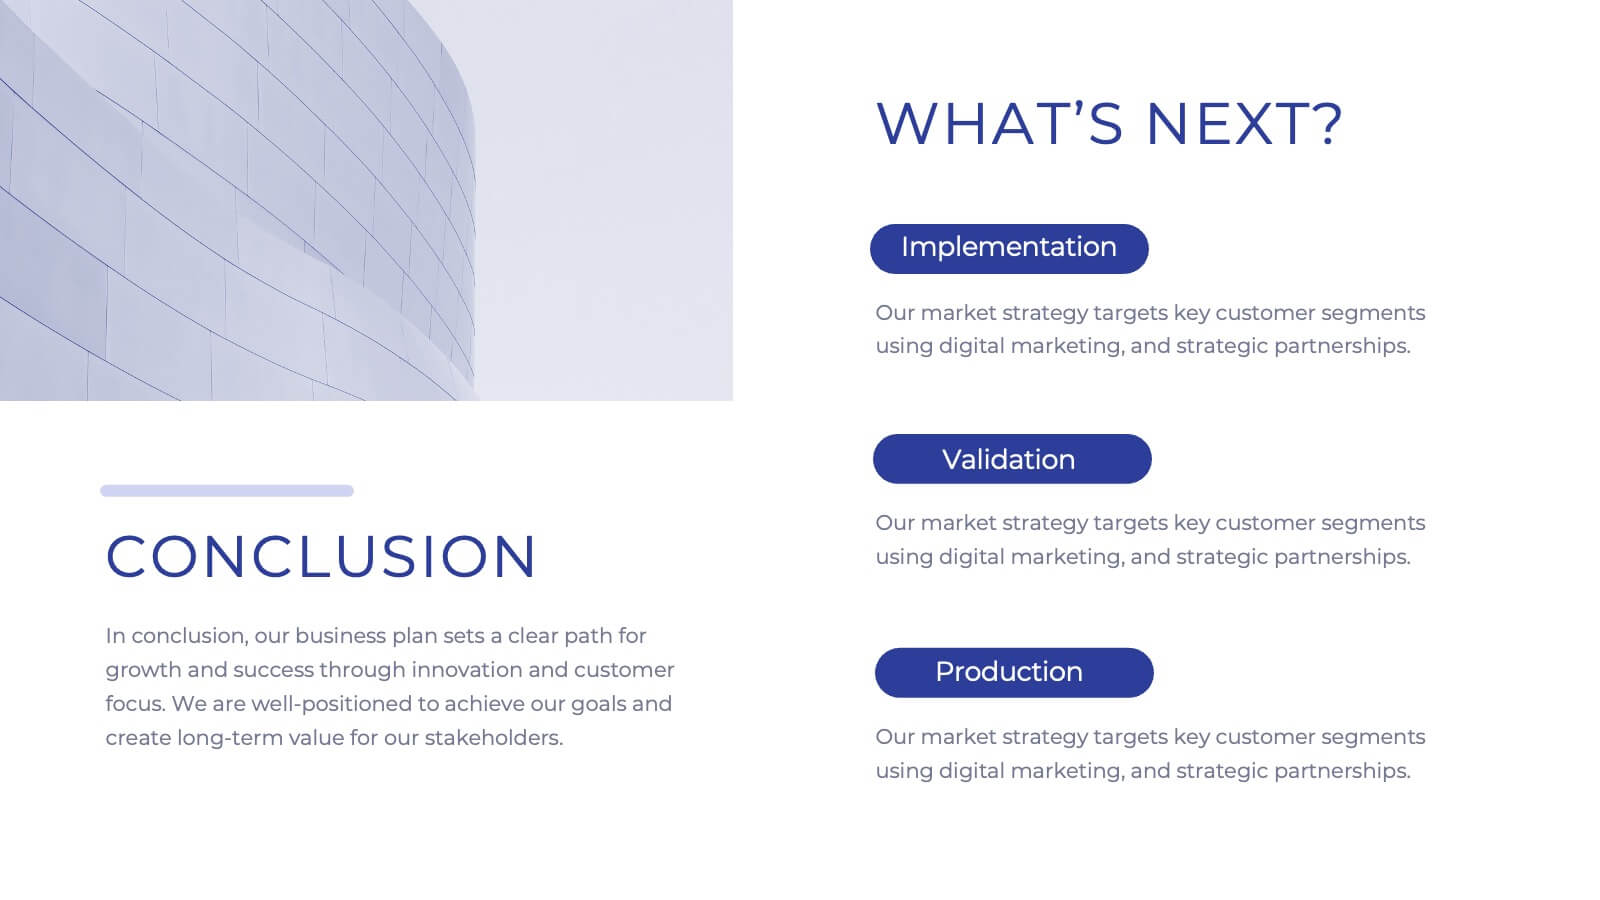
Iconic Startup Business Plan Presentation
Introducing our comprehensive corporate business plan template! Perfect for showcasing your company’s mission, vision, and services. Highlight your market strategy, competitive landscape, and growth plan in a professional design. Ideal for executives and entrepreneurs. Compatible with PowerPoint, Keynote, and Google Slides.


6 diapositivas
Customer Journey Mapping with Buyer Persona Presentation
Clearly visualize the customer experience across all touchpoints with this structured journey mapping slide. Featuring a central buyer persona graphic and six customizable steps with icons, this layout helps you break down each stage of the customer path. Perfect for UX strategy, customer service insights, and product development. Fully editable and compatible with PowerPoint, Keynote, and Google Slides.


7 diapositivas
College Statistics Infographic Presentation
A College Statistics Infographic is a visual representation of key data and statistics related to a college. This template can provide a quick and easy-to-understand overview of various aspects of the institution, such as enrollment figures, graduation rates, student demographics, and academic performance metrics. Featured are icons, illustrations, diagrams, and other design elements to enhance the visual appeal of this infographic and make it more engaging for your viewers. This template can be a useful tool for students, teachers, and others interested in learning more about a college.


4 diapositivas
Buyer Persona and Market Segmentation Presentation
Visualize ideal customer types with this engaging buyer persona template. Showcase personality traits, goals, brand affinities, and bios in a stylish format with tropical-inspired accents. Ideal for market segmentation, branding, and campaign alignment. Fully editable in PowerPoint, Keynote, and Google Slides to match your marketing strategy and presentation tone.


6 diapositivas
Multi-Layer Diagram Presentation
Illustrate Complex Processes with Ease using this Multi-Layer Diagram Presentation template. Designed for business strategies, IT architectures, data structures, and organizational hierarchies, this layered diagram helps break down multi-step processes in a clear and structured way. Fully customizable and available for PowerPoint, Keynote, and Google Slides, this template ensures your message is both impactful and visually appealing.