


Características


¿Tienes alguna pregunta?
Recomendar


8 diapositivas
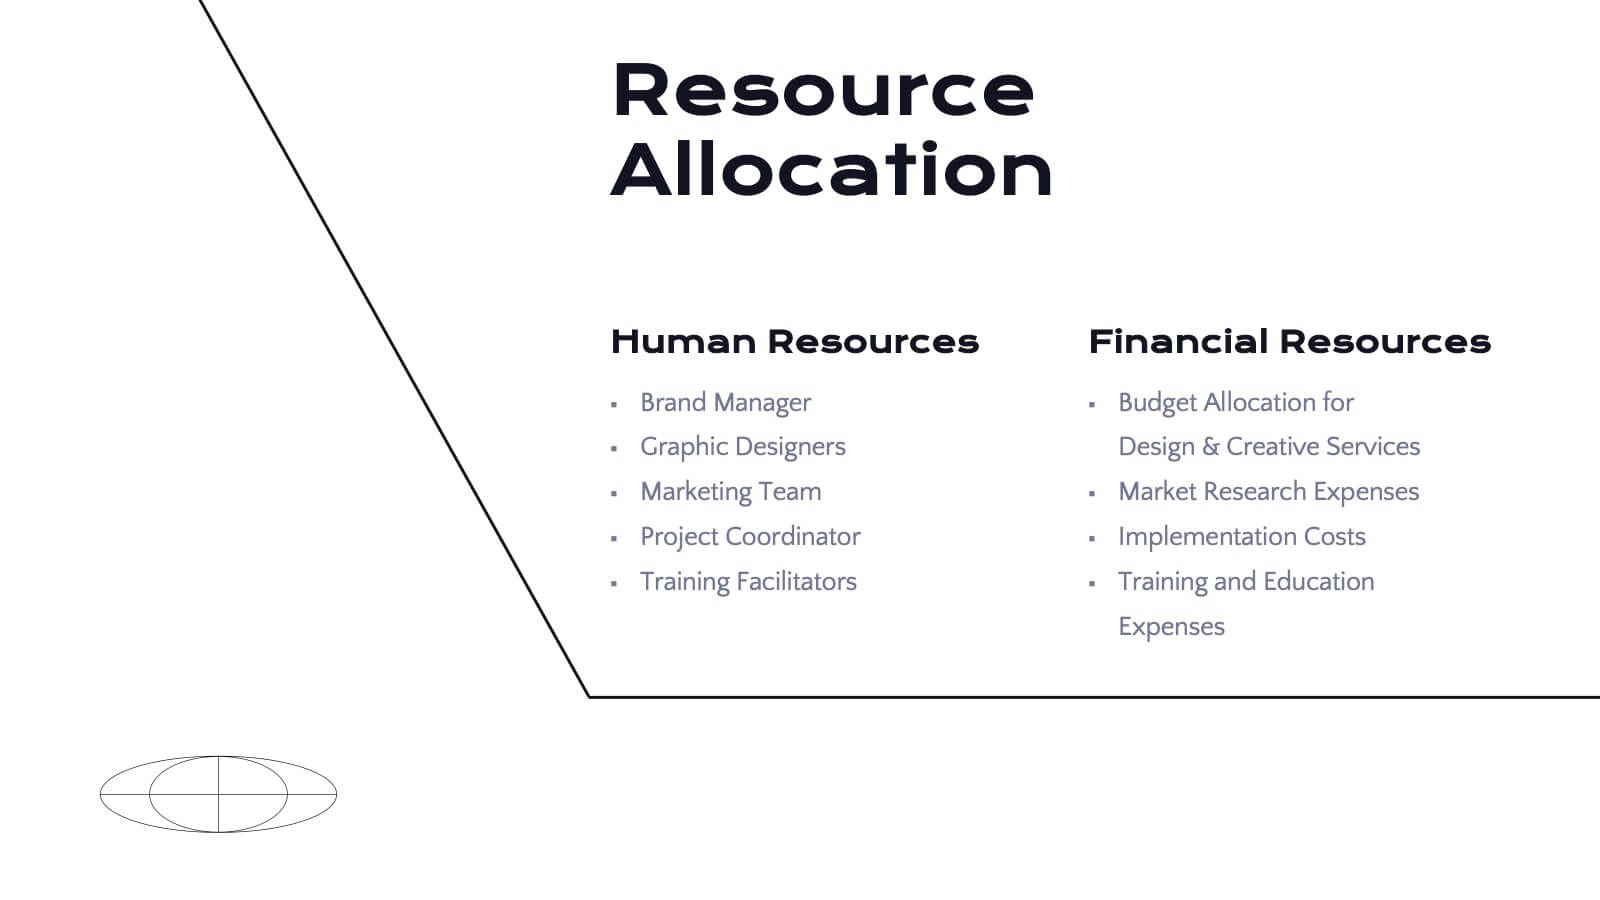
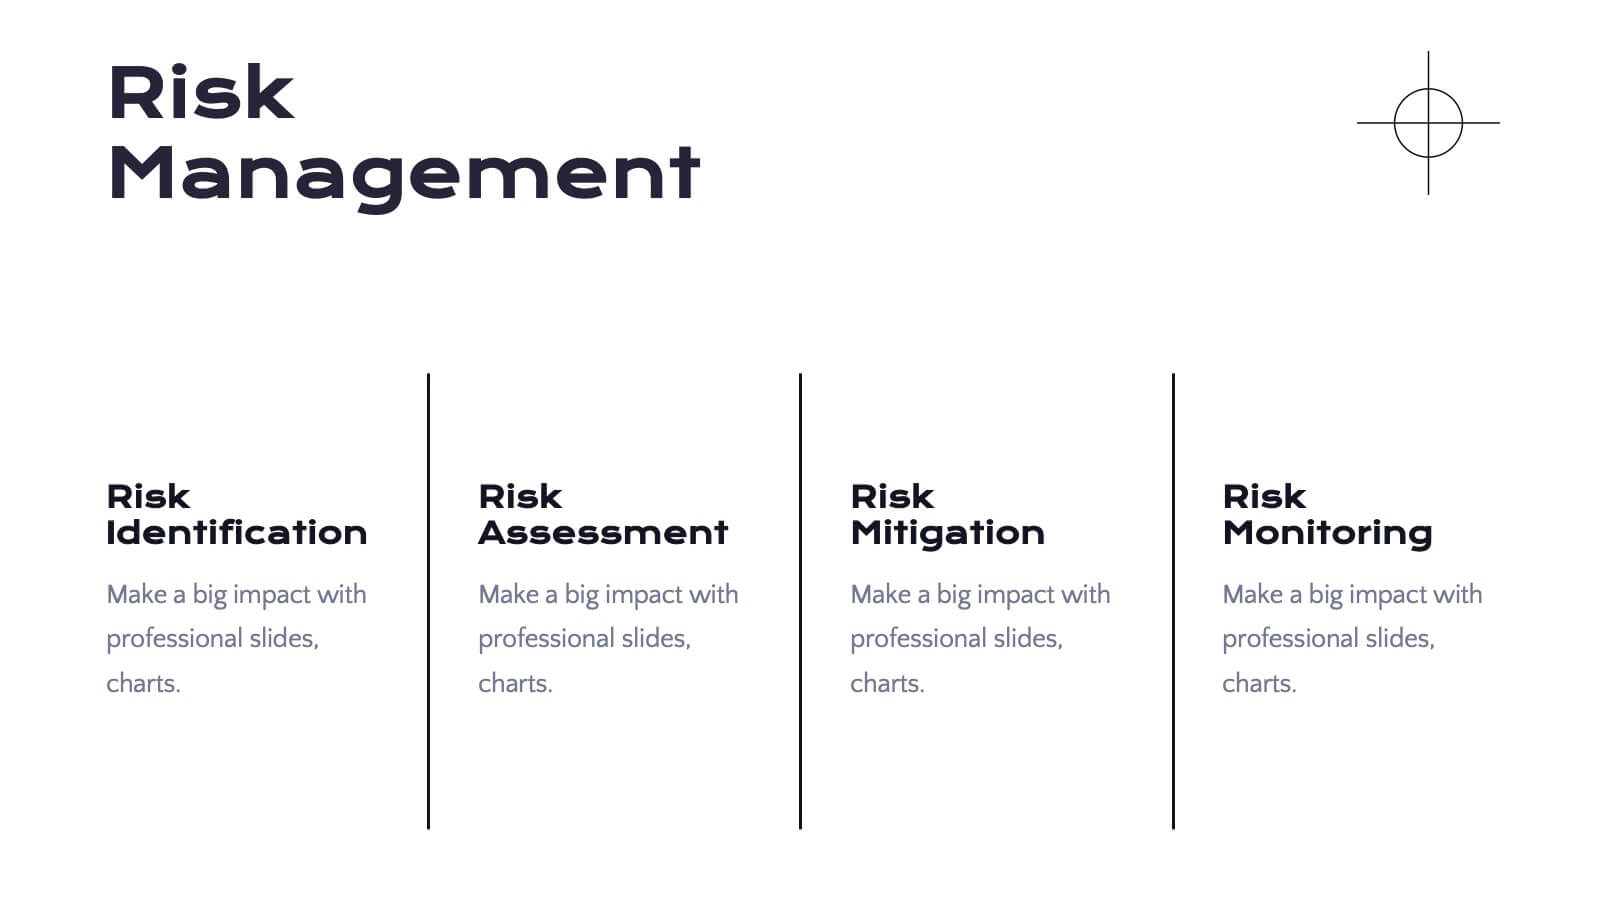
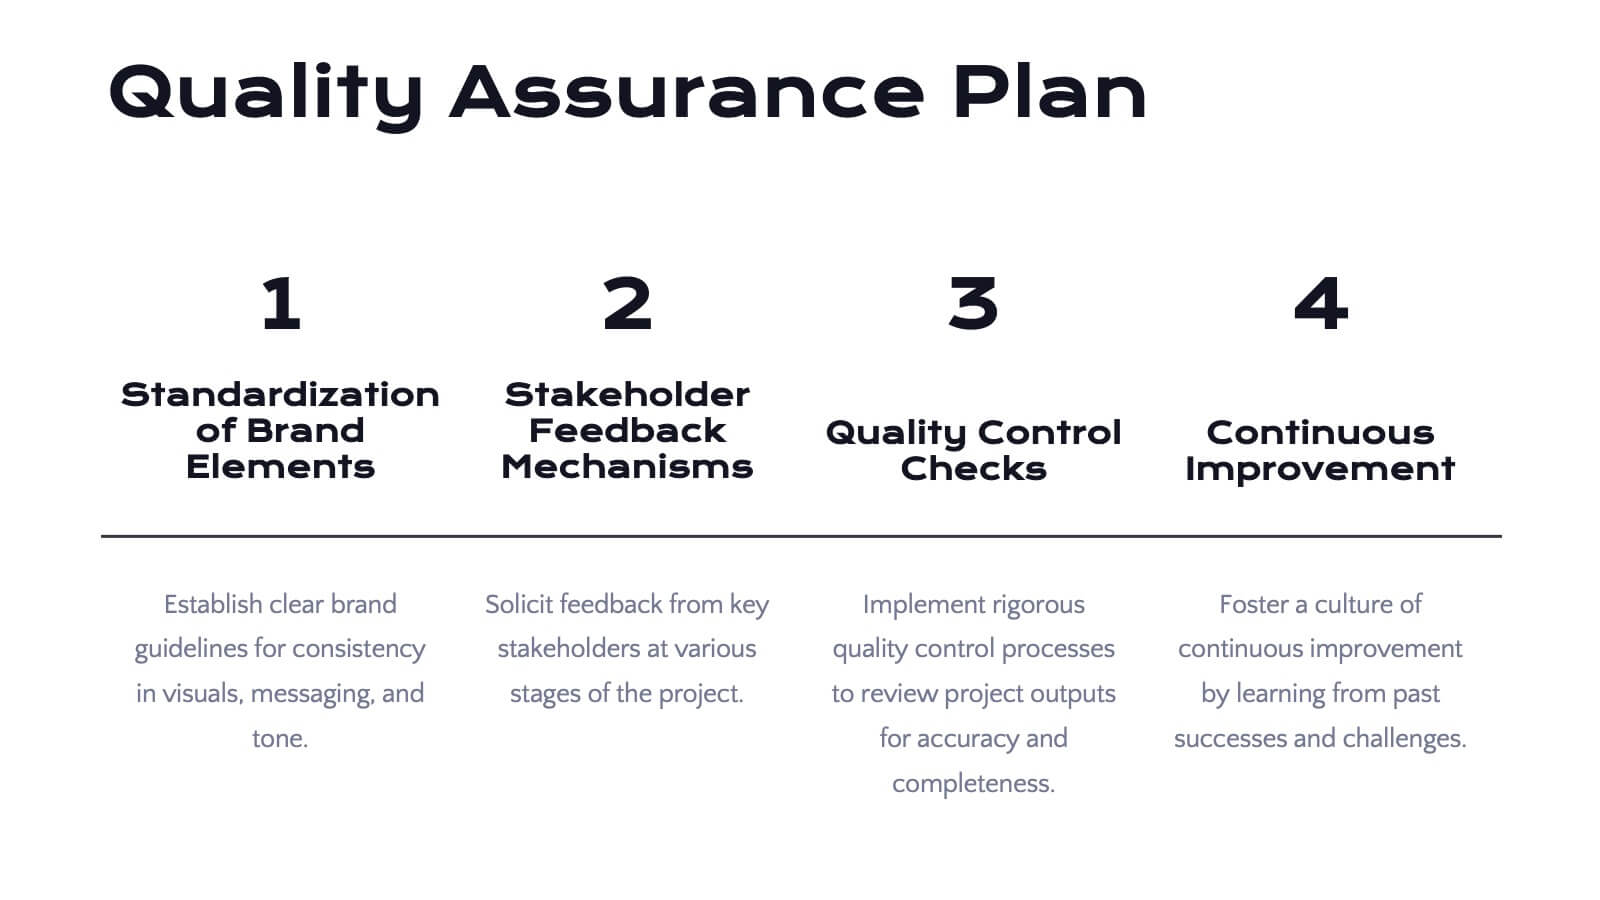
Corporate Risk Assessment and Planning Presentation
Navigate business uncertainties with the Corporate Risk Assessment and Planning template, offering a vivid and structured layout designed for professionals to meticulously detail and analyze potential risks in various business scenarios. It uses hexagonal and circular elements to emphasize the interconnectedness of various risk factors, supporting clear visualization and effective strategic planning. This template is compatible with PowerPoint, Keynote, and Google Slides, making it a versatile tool for comprehensive risk management presentations.


2 diapositivas
Creative Gratitude Slide
Wrap up your presentation with impact using this clean, modern “Thank You” slide. Featuring space for a photo, contact details, and playful design elements, it's perfect for leaving a lasting impression. Ideal for business proposals, pitch decks, and educational slide decks. Fully editable in PowerPoint, Keynote, and Google Slides.


5 diapositivas
Scrum Methodology for Project Management Presentation
Visualize your team’s process with this Scrum Methodology for Project Management Template. Featuring dynamic arrow and gear illustrations, this slide helps convey product development cycles, sprint planning, reviews, and retrospectives in a clean, engaging format. Fully editable and ready for PowerPoint, Keynote, and Google Slides.


8 diapositivas
Sustainable Operation & Ethical Practice Presentation
Illustrate your ethical initiatives and operational sustainability with this water drop flow diagram. Ideal for outlining four key actions or principles, it features a faucet visual and icon-based content drops. Fully customizable in PowerPoint, Keynote, and Google Slides—perfect for ESG reporting, CSR updates, and eco-conscious business presentations.
21 diapositivas
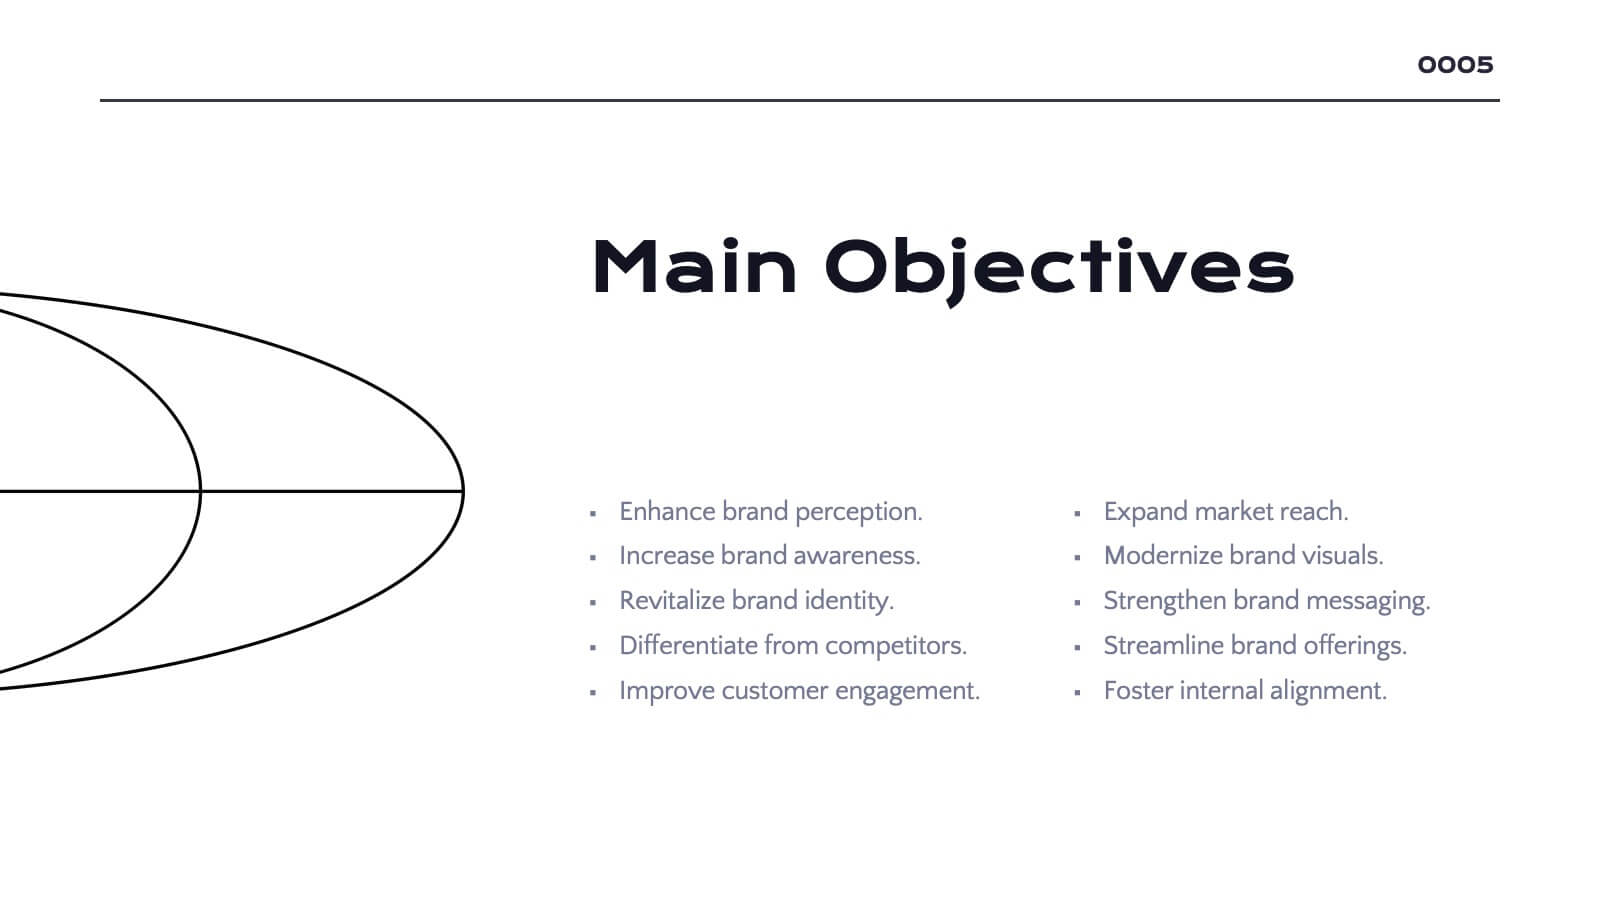
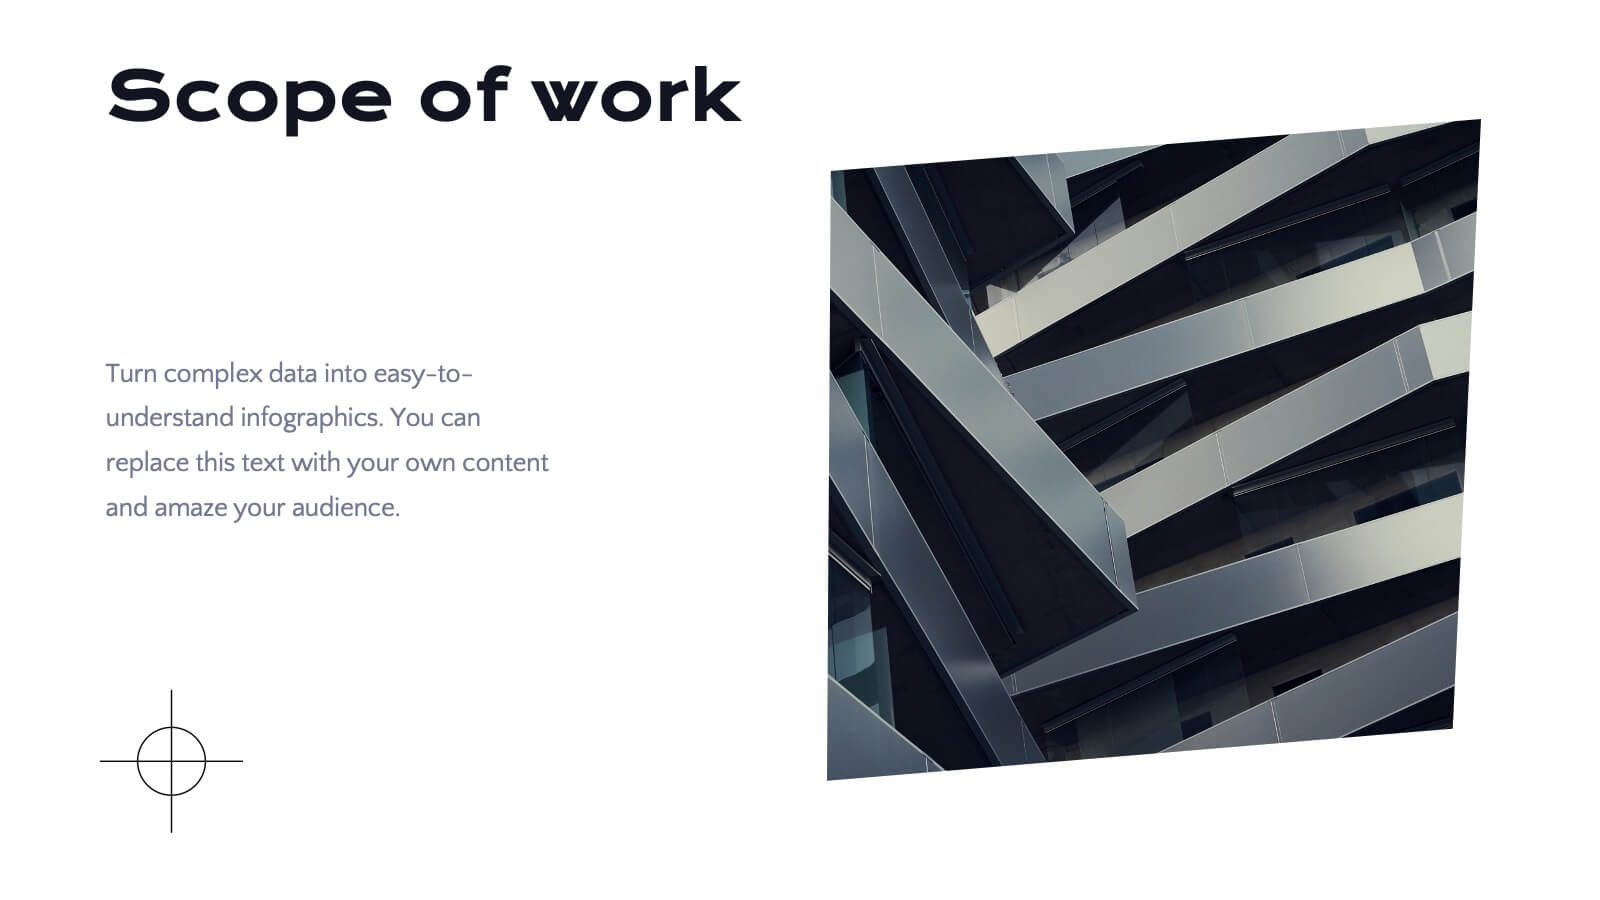
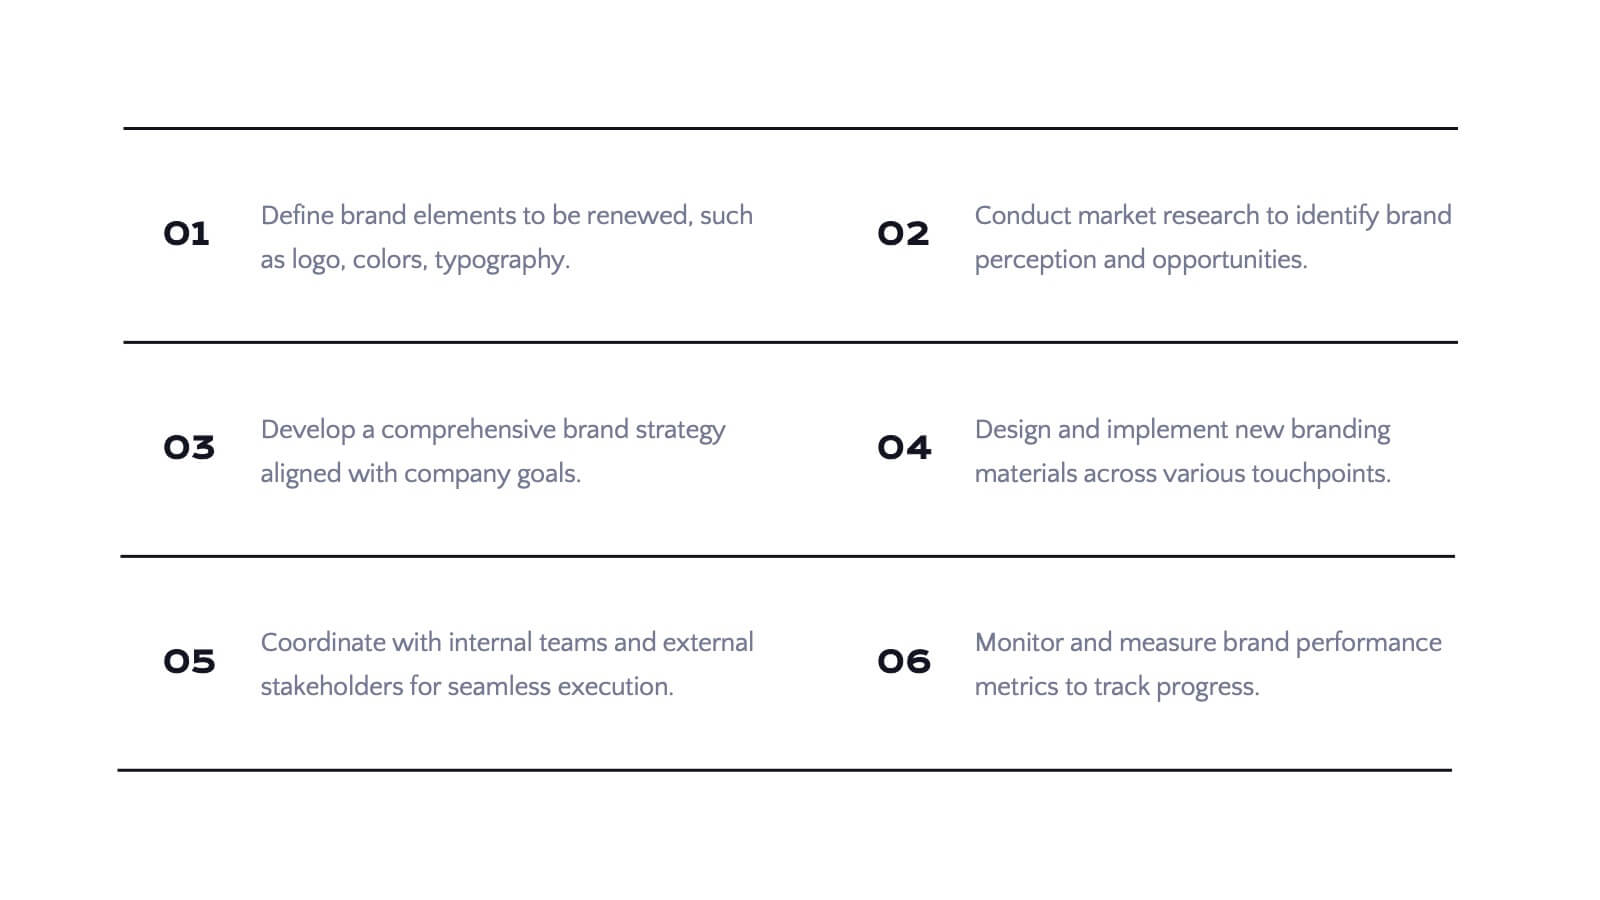
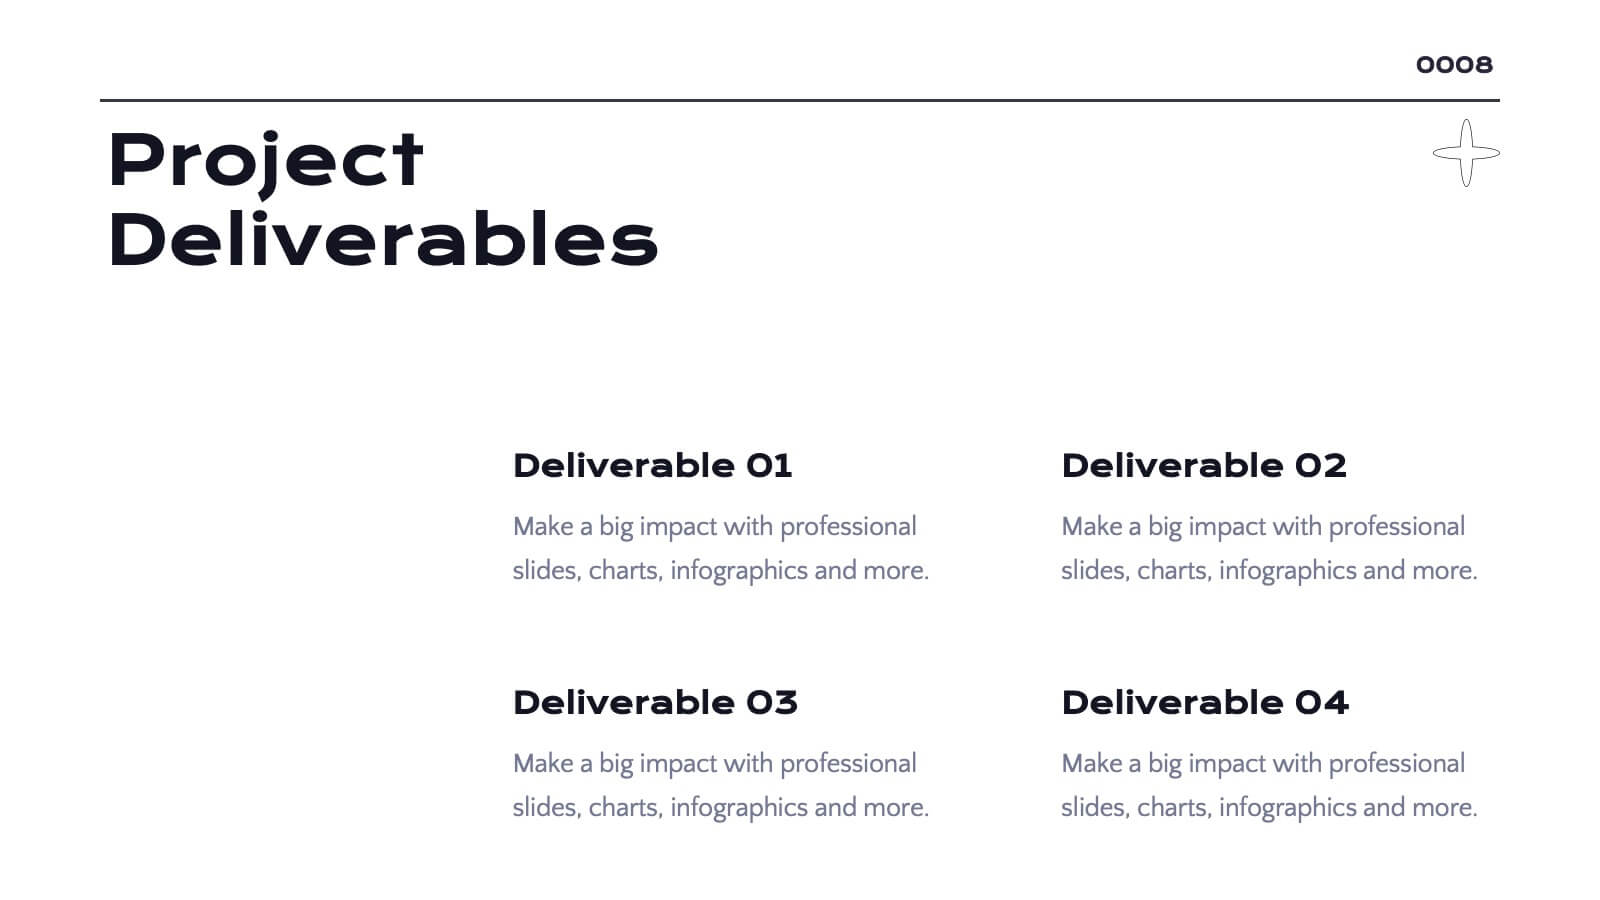
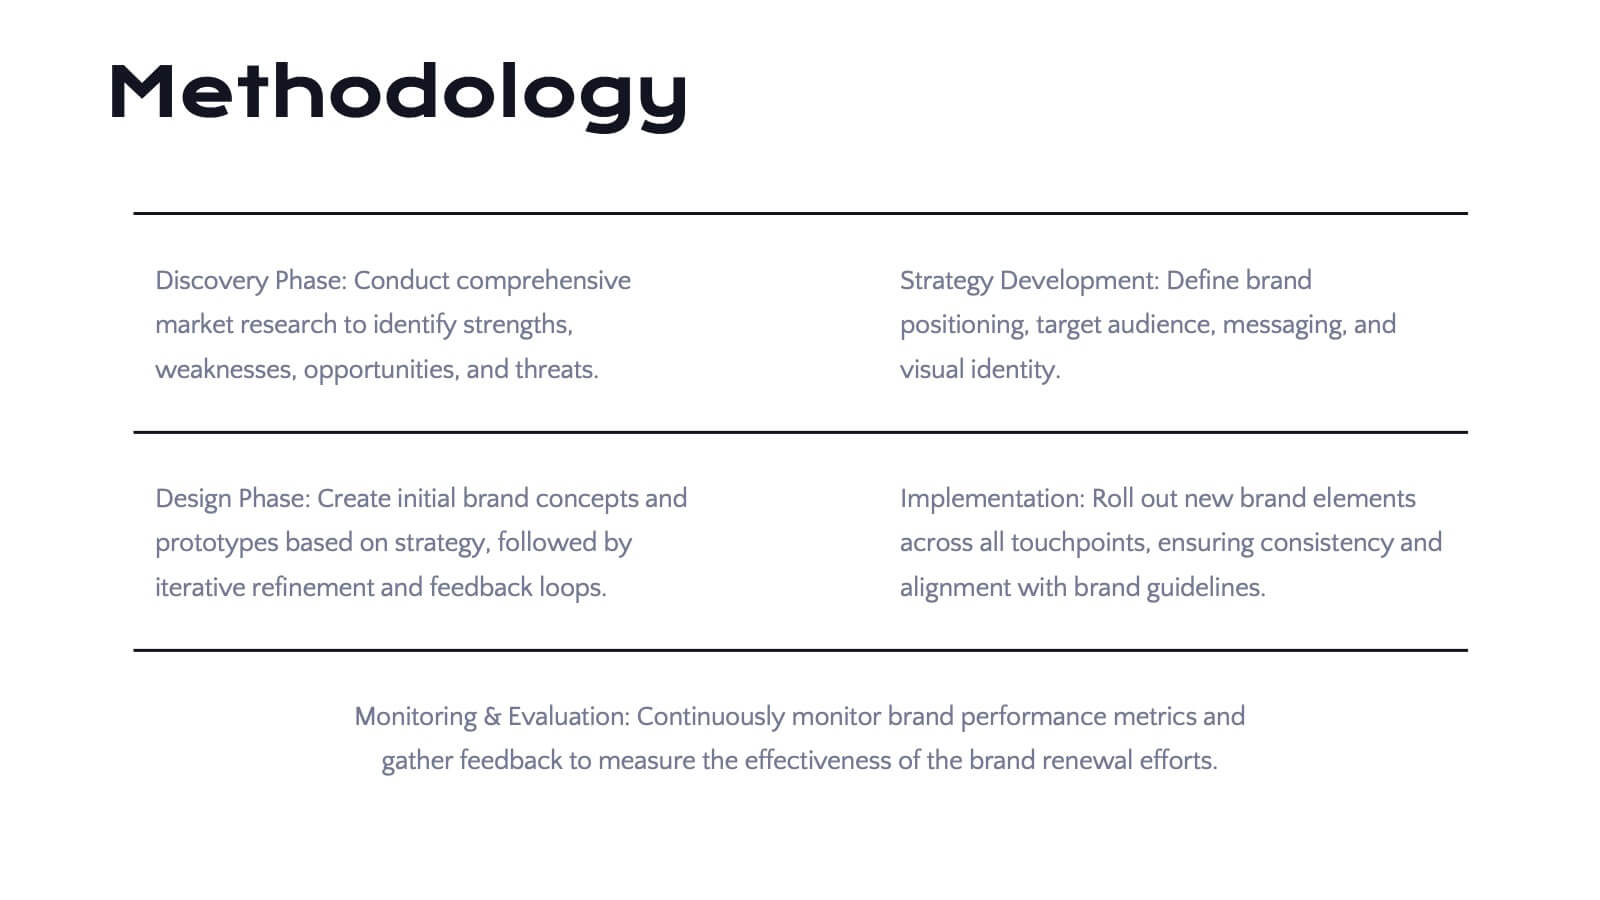
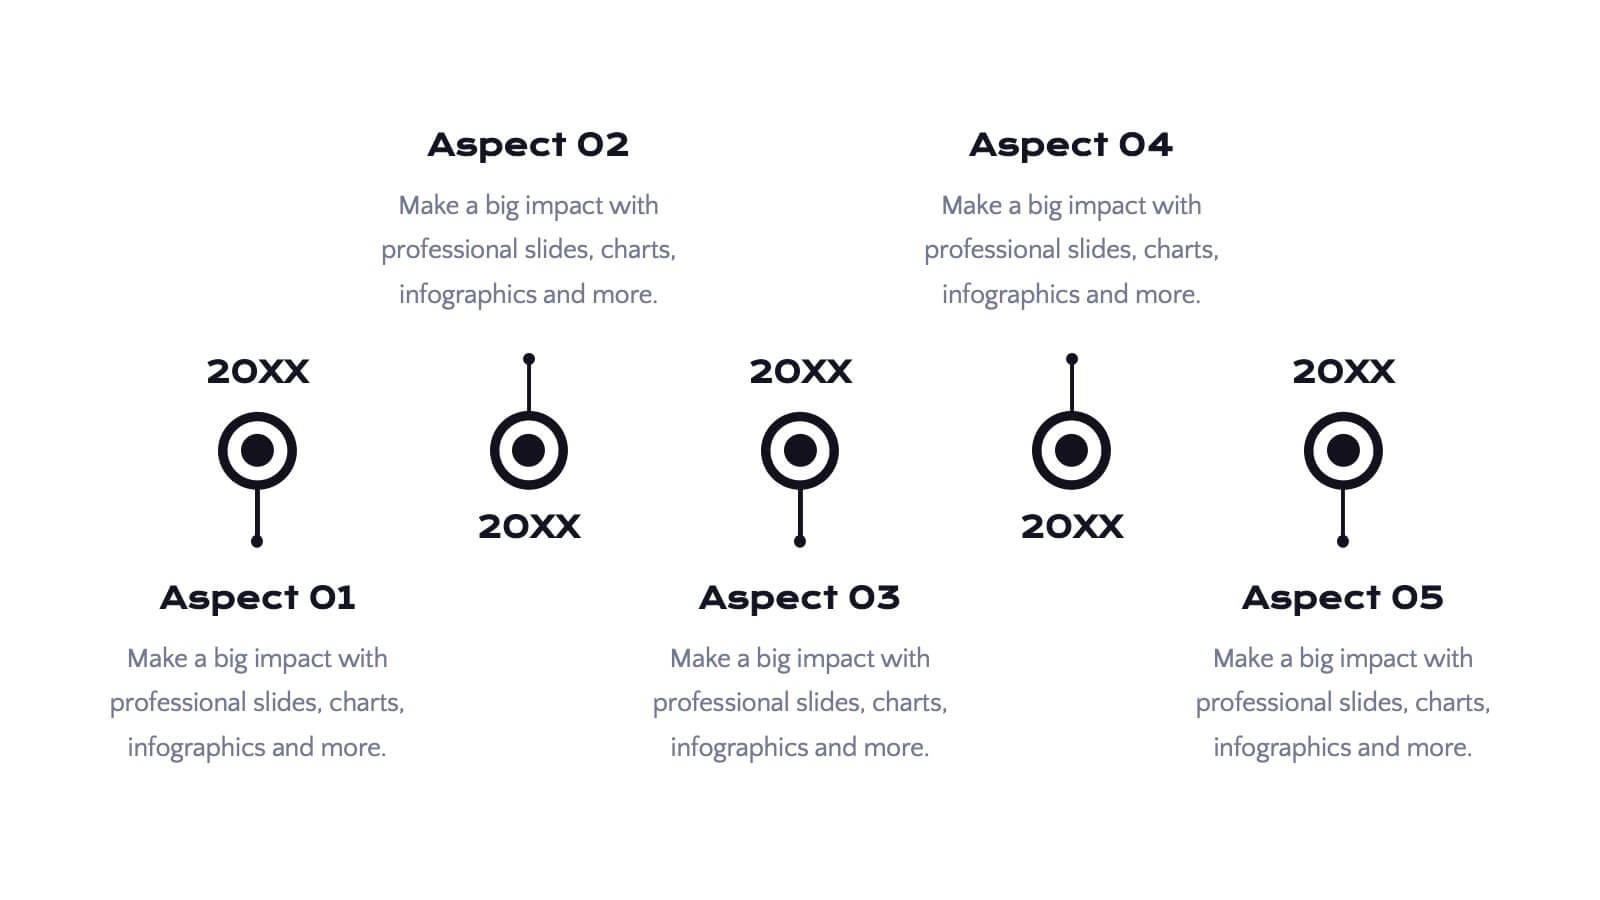
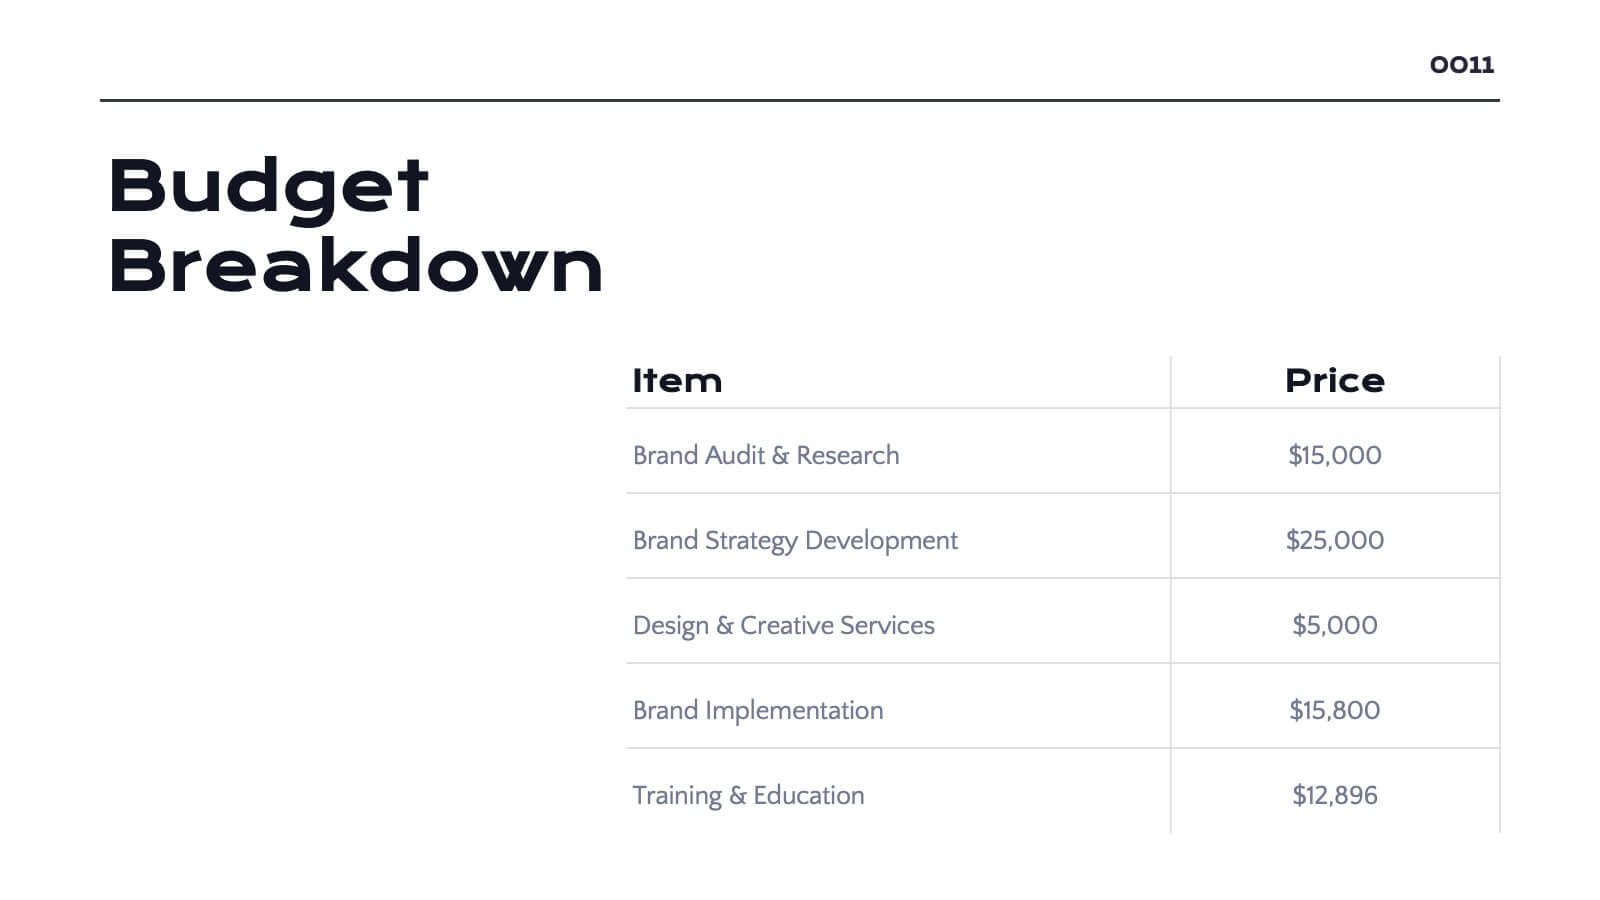
Radiance Detailed Project Execution Plan Presentation
Elevate your project execution presentations with this sleek template, covering everything from objectives to timelines and budget breakdowns. It's perfect for aligning your team and stakeholders. Compatible with PowerPoint, Keynote, and Google Slides, it ensures professionalism and clarity in showcasing your project plans.


6 diapositivas
Wellness Program and Health Strategy Presentation
Bring your strategy to life with this clean and creative visual! This presentation template uses a six-part flower design to help you showcase your wellness goals, health strategies, or program pillars with clarity and balance. It’s fully editable and works perfectly in PowerPoint, Keynote, and Google Slides for flexible customization.


5 diapositivas
Business Workflow Process Presentation
Optimize your operations with the Business Workflow Process template, designed to visually map out tasks and streamline workflows. Perfect for project managers and teams, this template enhances clarity and collaboration. Fully customizable and compatible with PowerPoint, Keynote, and Google Slides, making professional workflow presentations seamless and efficient.


7 diapositivas
Solution Infographics Presentation Template
Featuring our solution Infographic template, We have a solution for your presentation problems. Give your next presentation the edge with this template, that allows you to present the perfect solutions to your audience. All the content is completely customizable and the built-in icons can be replaced with your own text and illustrations. Choose from the various themes available, and make it fit your needs. This template contains all the elements needed to make your infographic presentation pop! graphs, photos and a minimal style makes this design perfect for any kind of project.


21 diapositivas
Galactic Strategic Planning Report Presentation
Launch your strategic vision into the stars with this captivating Galactic-themed presentation template! Ideal for presenting a strategic planning report, it allows you to outline goals, action plans, and performance metrics with a sleek, cosmic design that captures attention. Compatible with PowerPoint, Keynote, and Google Slides for easy, seamless customization.


6 diapositivas
Time Management Skills Infographic
Time Management refers to the process of planning and organizing your time effectively to accomplish tasks, achieve goals, and maximize productivity. This infographic template aims to help individuals improve their time management abilities. It provides practical tips, techniques, and strategies to effectively manage time and increase productivity. This template provides practical guidance on setting goals, prioritizing tasks, managing distractions, and optimizing productivity. This infographic will help your audience develop effective time management skills and make the most of their valuable time.


22 diapositivas
Leviathan Sales Pitch Deck Presentation
This sales pitch deck template is designed to captivate your audience with a sleek, modern design. It features key slides like problem statement, solution, business model, and financials, ensuring a comprehensive presentation. Compatible with PowerPoint, Keynote, and Google Slides, it's perfect for showcasing your business's unique value proposition and growth strategy.


6 diapositivas
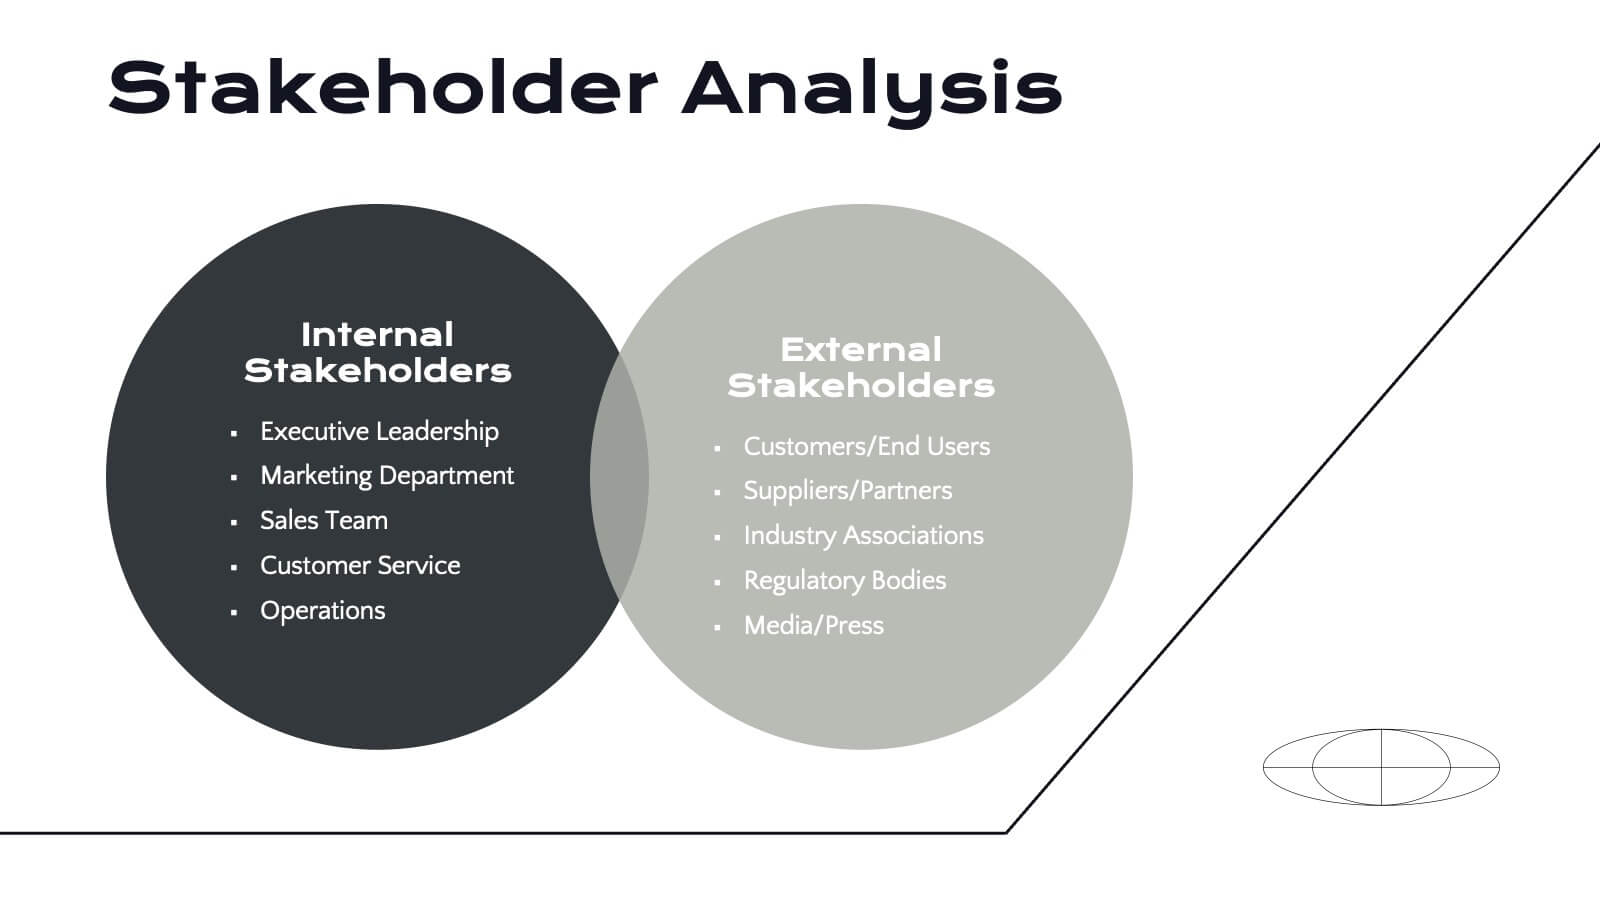
Stakeholder Analysis Chart Infographic
Stakeholder analysis is a process used by organizations to identify and assess the interests, concerns, expectations, and potential impact of various individuals, groups, or entities that have a stake in a particular project, decision, or initiative. The goal of this infographic is to better understand the perspectives and needs of different stakeholders and to use this information to inform decision-making and project planning. This template summarizes the importance of stakeholder analysis in project management or organizational decision-making. This compatible with Powerpoint, Keynote, and Google Slides.


6 diapositivas
Problem-Solving with Design Thinking Presentation
Master complex challenges with the Problem-Solving with Design Thinking presentation. This structured layout helps visualize ideas, collaboration, and strategic solutions through an intuitive, professional design. Ideal for workshops, business innovation, and strategic planning. Fully customizable and compatible with PowerPoint, Keynote, and Google Slides for a seamless experience.


26 diapositivas
Understanding Cryptocurrency Presentation
Step into the future of finance with this engaging presentation on cryptocurrency. Covering key topics like blockchain technology, digital wallets, market trends, and security best practices, this template helps simplify complex concepts for any audience. Fully customizable and compatible with PowerPoint, Keynote, and Google Slides for a seamless and informative presentation experience.


3 diapositivas
Corporate Law and Regulation Guide Presentation
Clarify legal structures with the Corporate Law and Regulation Guide Presentation. This visually balanced design uses legal scale and book icons to symbolize authority, compliance, and fairness. Perfect for illustrating legal frameworks, policy breakdowns, or governance models. Fully editable for PowerPoint, Keynote, and Google Slides.


21 diapositivas
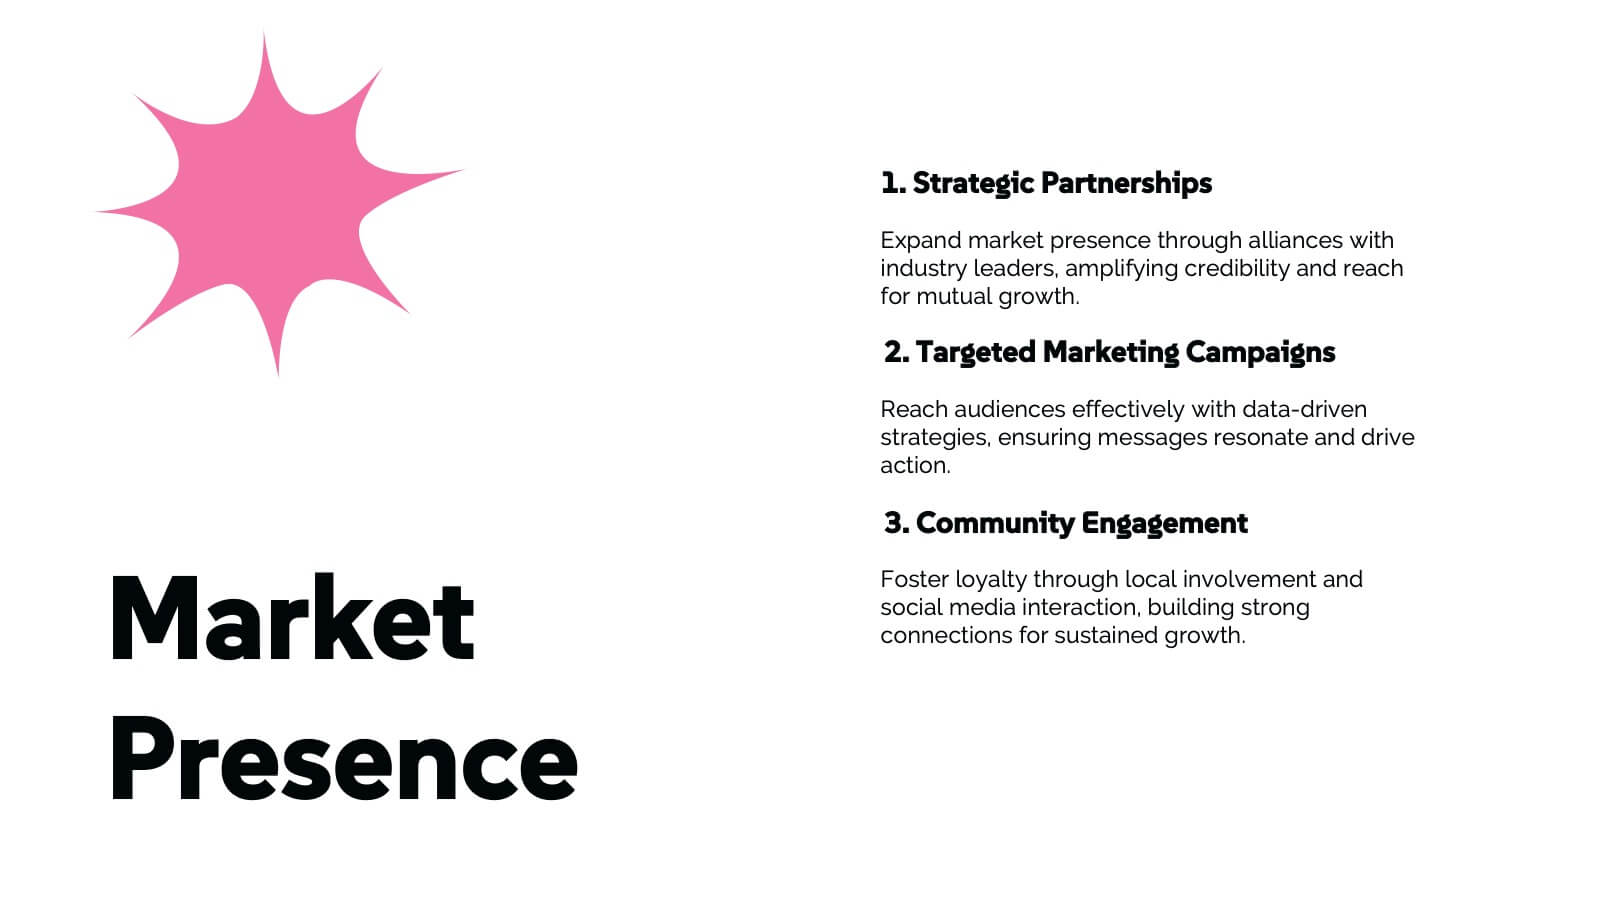
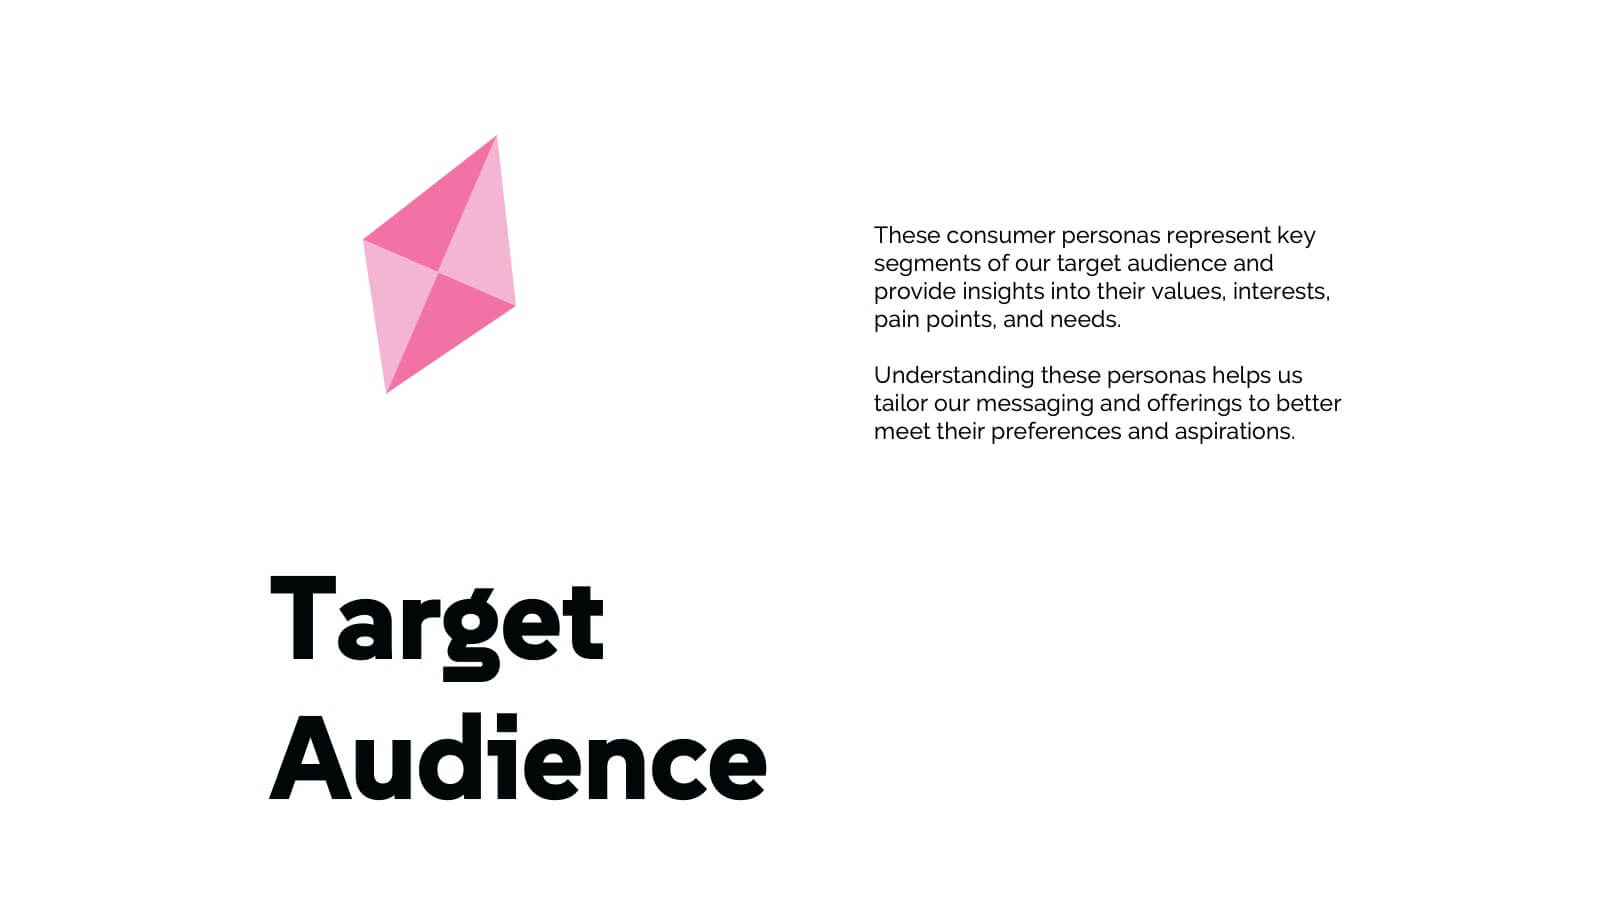
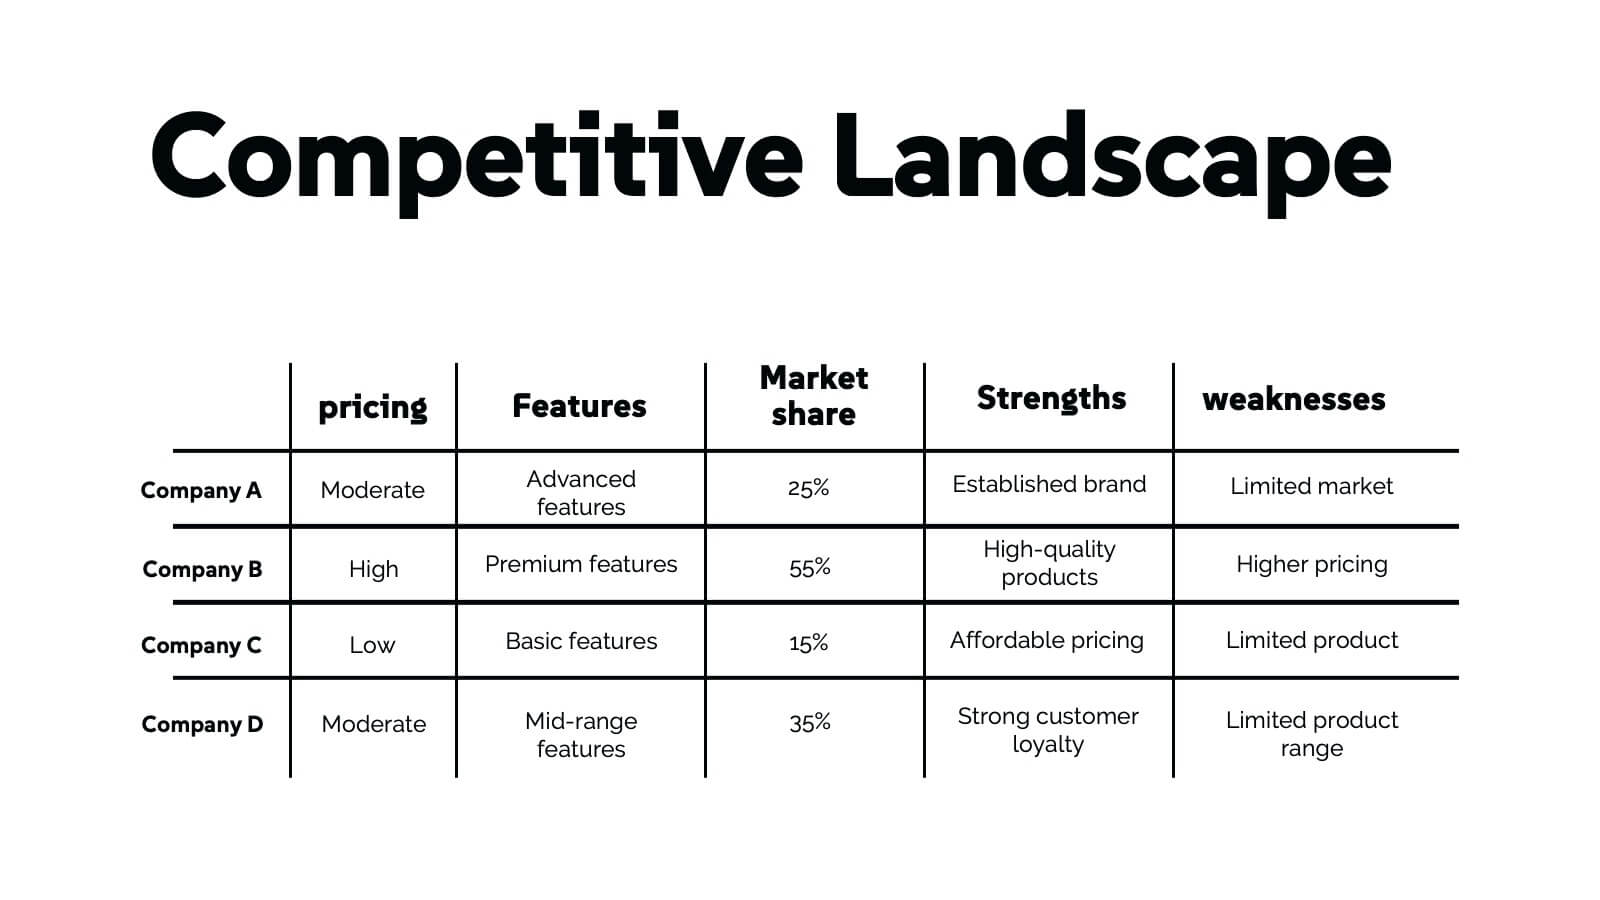
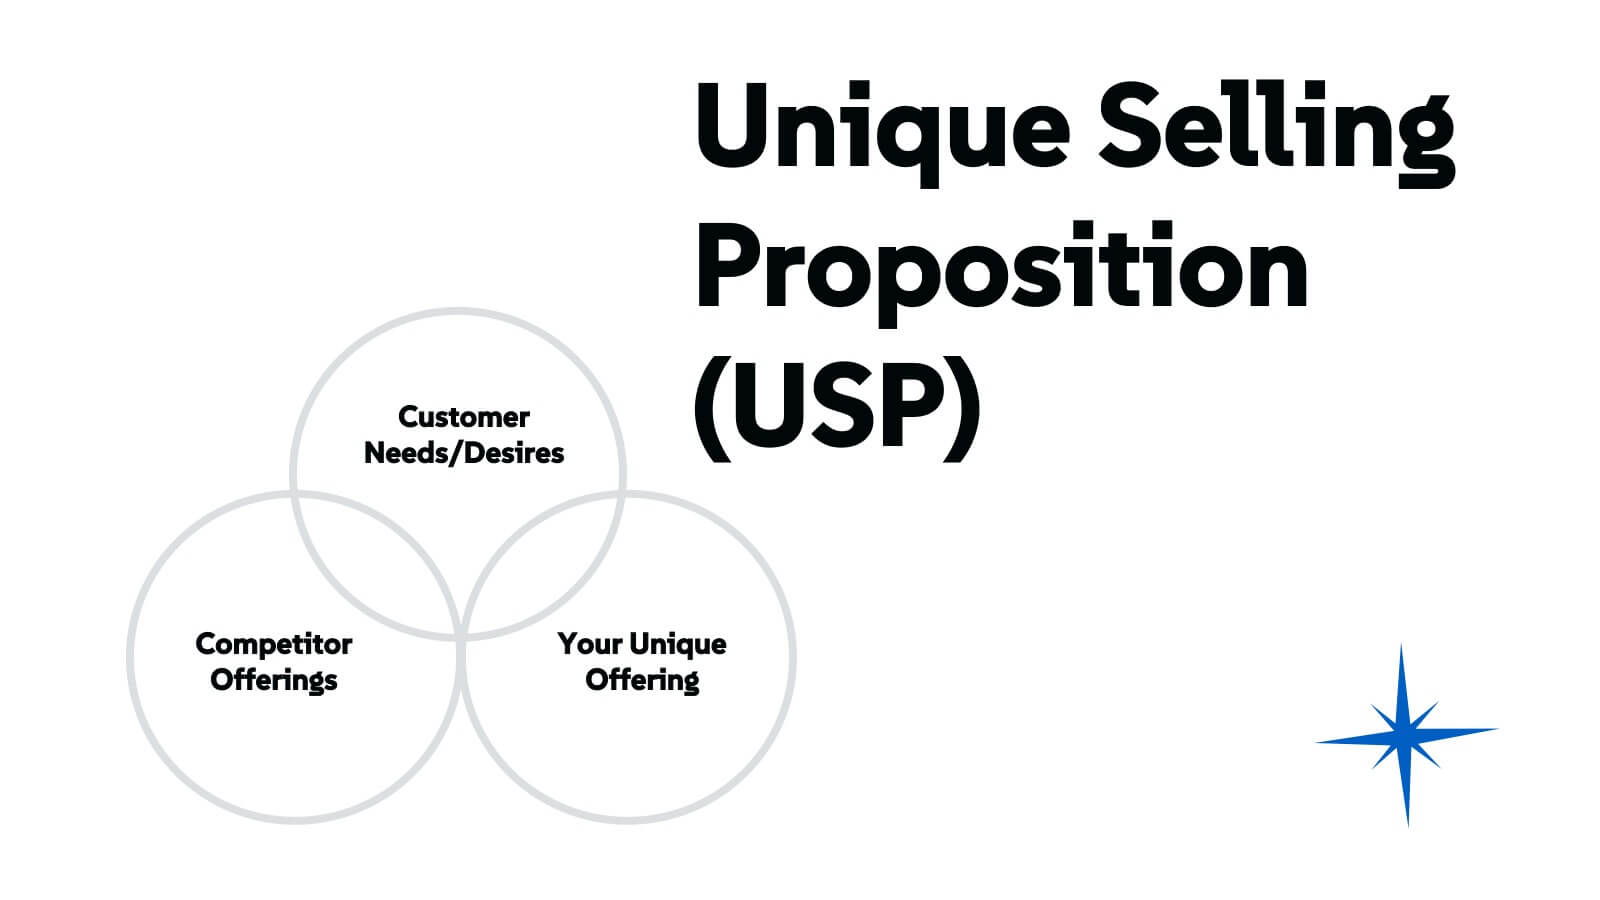
Chimera Marketing Campaign Presentation
Create a visually engaging digital marketing presentation with this modern template! Covering essential topics like company history, market presence, target audience, and competitive landscape, this template helps you showcase your marketing strategies effectively. Fully customizable, it works seamlessly with PowerPoint, Keynote, and Google Slides for professional presentations every time.


21 diapositivas
Ruby Startup Funding Proposal Presentation
Get ready to pitch your startup in style with this vibrant and engaging presentation template! Perfect for showcasing your startup’s founding story, business model, market analysis, and financial overview, this template ensures you’ll impress potential investors. Fully customizable and compatible with PowerPoint, Keynote, and Google Slides, it’s ideal for securing funding and support.