


Características


¿Tienes alguna pregunta?
Recomendar


21 diapositivas
Carmenta Project Management Plan Presentation
Organize your projects with clarity using this comprehensive project management plan template. It includes slides for objectives, timelines, risk management, budget breakdowns, and team introductions. Ideal for efficient project presentations, it’s compatible with PowerPoint, Keynote, and Google Slides, offering a structured approach to showcase every project detail.


7 diapositivas
Iceberg Infographic Presentation Template
An Iceberg infographic is a powerful and eye-catching way to display information, it is a method for presenting complex information. This template is designed to be fully customizable and include all the elements you need to make an impact on your audience. The Iceberg can be used to visualize any concept that has a direct impact on your performance, from sales to customer retention, from how organizations are staffed to identifying the key players within teams. Use this template to create a detailed iceberg diagram of your business, its customers, and the things that impact them.


5 diapositivas
Pet Health Clinic Workflow Presentation
Guide your audience through each stage of care with the Pet Health Clinic Workflow presentation. This engaging slide features a horizontal visual of a dog segmented into four workflow stages, making it ideal for explaining clinical procedures, pet treatment plans, or wellness programs. Each section includes editable text areas for customizable labels and descriptions. Perfect for veterinary clinics, pet hospitals, and animal health professionals. Fully compatible with PowerPoint, Keynote, and Google Slides.


10 diapositivas
Key Strategies for Business Success Presentation
Achieve your goals with the Key Strategies for Business Success Presentation template. This structured and visually compelling slide deck is designed to outline essential business strategies, success factors, and growth plans. Featuring a clean and professional layout, this template is perfect for entrepreneurs, corporate teams, and business consultants. Fully customizable and available for PowerPoint, Keynote, and Google Slides, making it easy to tailor for your specific needs.


10 diapositivas
Creative Thinking and Innovation
Inspire fresh perspectives and spark ideas with this Creative Thinking and Innovation presentation. Designed around a dynamic lightbulb concept, it features five clearly numbered stages for visualizing brainstorming, concept development, and strategic creativity. Perfect for workshops, ideation sessions, or innovation planning. Fully editable in PowerPoint, Keynote, and Google Slides.


5 diapositivas
Planning and Delivery in Five Phases Presentation
Guide your audience through each step of your execution plan using the Planning and Delivery in Five Phases Presentation. This clean, drop-pin style layout highlights five essential milestones for structured delivery and progress tracking. Each phase is color-coded for easy reference. Fully editable in PowerPoint, Keynote, Google Slides, and Canva.


4 diapositivas
AI Trends and Use Cases Presentation
Step into the future with a clean, modern layout that makes complex technology easy to grasp and exciting to explore. This presentation helps you break down emerging innovations, real-world applications, and industry opportunities using clear visuals and structured sections. Fully customizable and compatible with PowerPoint, Keynote, and Google Slides.


7 diapositivas
Organizational Change with 7S Framework Presentation
Visualize organizational transformation with the Organizational Change with 7S Framework Presentation. This slide highlights each element of the McKinsey 7S model—Structure, Strategy, Systems, Shared Values, Skills, Style, and Staff—along an S-shaped flow. Ideal for consulting, internal alignment, and strategic planning discussions. Fully editable in Canva, PowerPoint, Keynote, and Google Slides.


26 diapositivas
Market Growth Tactics Presentation
Chart a path to success with our Market Growth Tactics presentation template, designed for seamless use in PowerPoint, Keynote, and Google Slides. This template is a vital asset for business strategists, marketing professionals, and consultants who aim to drive growth and capture market share. Our Market Growth Tactics template lays out a strategic framework for identifying and leveraging growth opportunities. It provides a comprehensive array of slides to showcase market analysis, competitive landscape, growth strategies, and execution plans. With customizable elements, you can tailor your presentation to reflect specific market insights and growth targets relevant to your audience. The template is crafted to facilitate clear communication of complex growth strategies, breaking them down into actionable steps with the aid of charts, graphs, and infographics. This helps to convey your message effectively, ensuring that your audience can visualize the growth journey and understand the tactics involved. Elevate your market growth presentations and become an authoritative voice in your industry with our SEO-optimized template, designed to engage, inform, and inspire action towards market expansion.


5 diapositivas
Eco-Friendly Practices Implementation Presentation
Brighten your message with a clean, circular design that maps out every green initiative step-by-step. This visual template illustrates key eco-conscious actions, helping you present sustainable practices with ease. Perfect for environmental reports, team strategies, or policy pitches. Fully compatible with PowerPoint, Keynote, and Google Slides for flexible editing.


4 diapositivas
Financial Budget Forecasting Presentation
Predict and manage your financial future with our 'Financial Budget Forecasting' template, perfect for visualizing quarterly budget allocations and expectations. This versatile tool aids in creating clear, concise, and visually engaging financial presentations, and is compatible with PowerPoint, Keynote, and Google Slides, making it a must-have for finance professionals and budget planners.


4 diapositivas
Educational Infographic Slide Presentation
Ignite curiosity from the very first slide with a clear, classroom-style visual that makes explanations feel simple and engaging. This presentation helps break down lessons, key concepts, or training points in a way audiences instantly understand. Clean layouts keep the focus on your message. Fully compatible with PowerPoint, Keynote, and Google Slides.


8 diapositivas
Building Planning and Architecture Strategy Presentation
Bring structure and vision to your development plans with the Building Planning and Architecture Strategy Presentation. This visual template showcases an illustrated construction scene paired with four key planning pillars—ideal for presenting design phases, zoning steps, or project milestones. Fully customizable in PowerPoint, Keynote, and Google Slides.


22 diapositivas
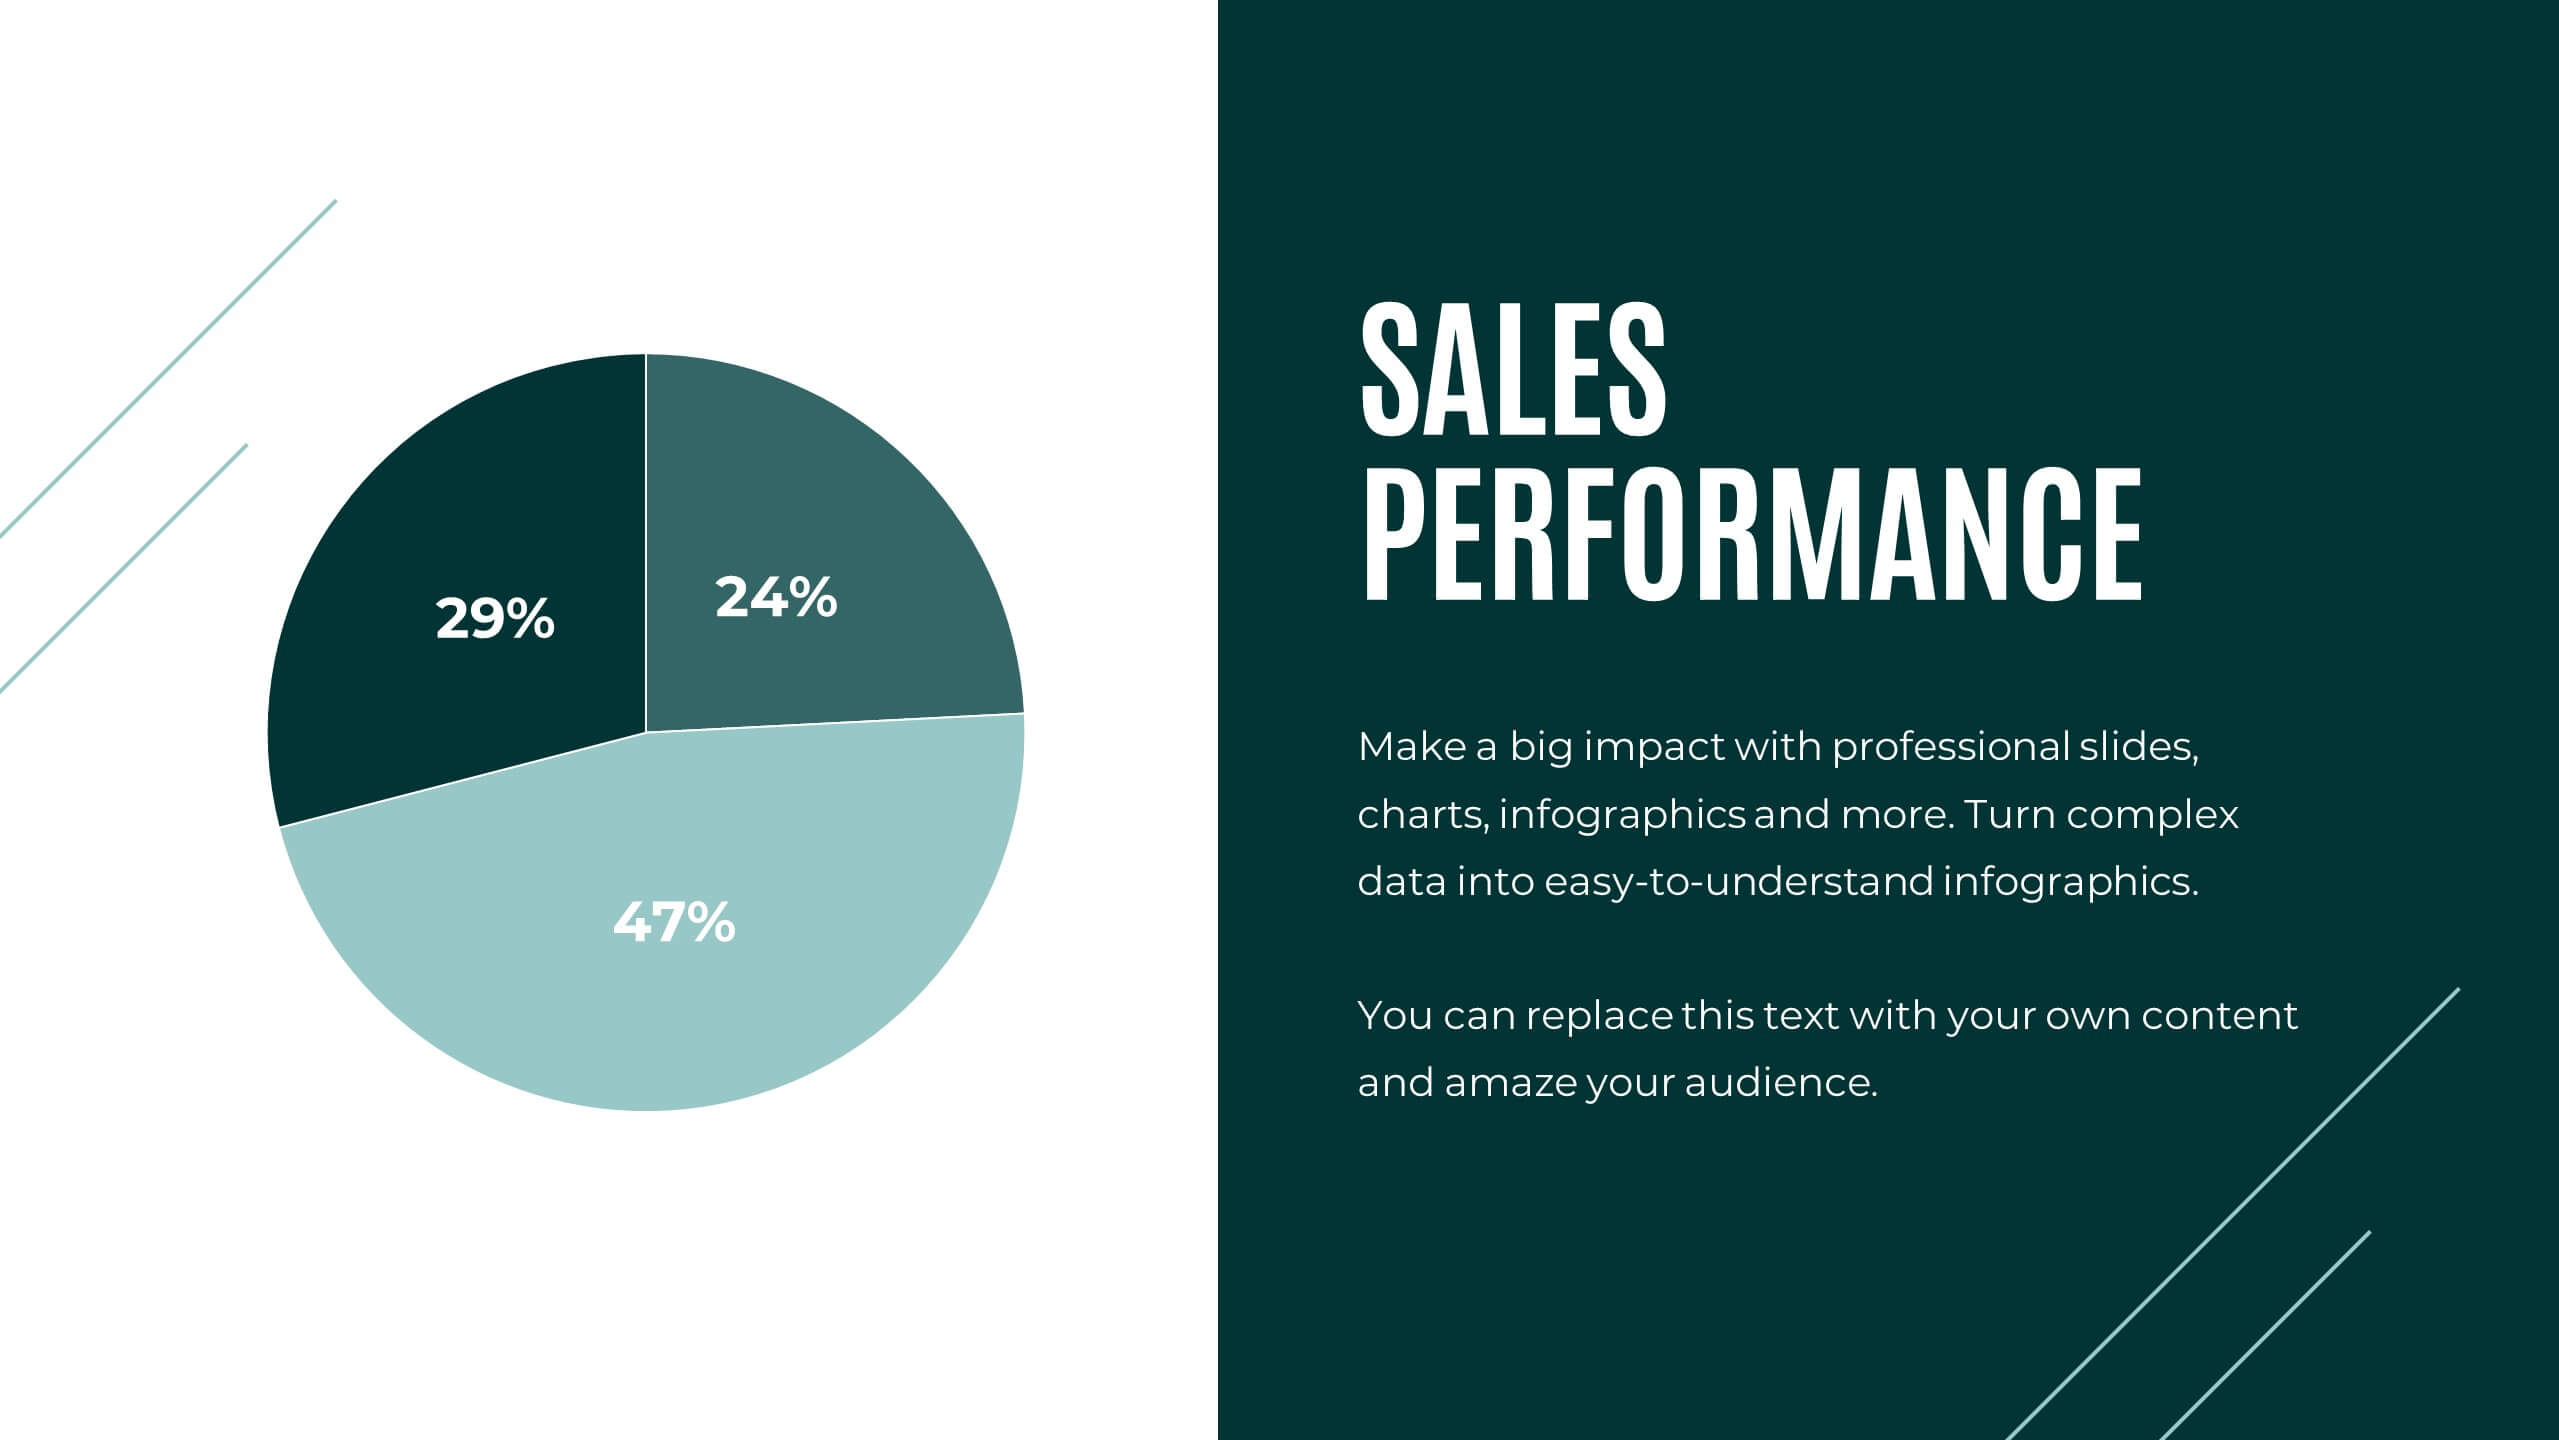
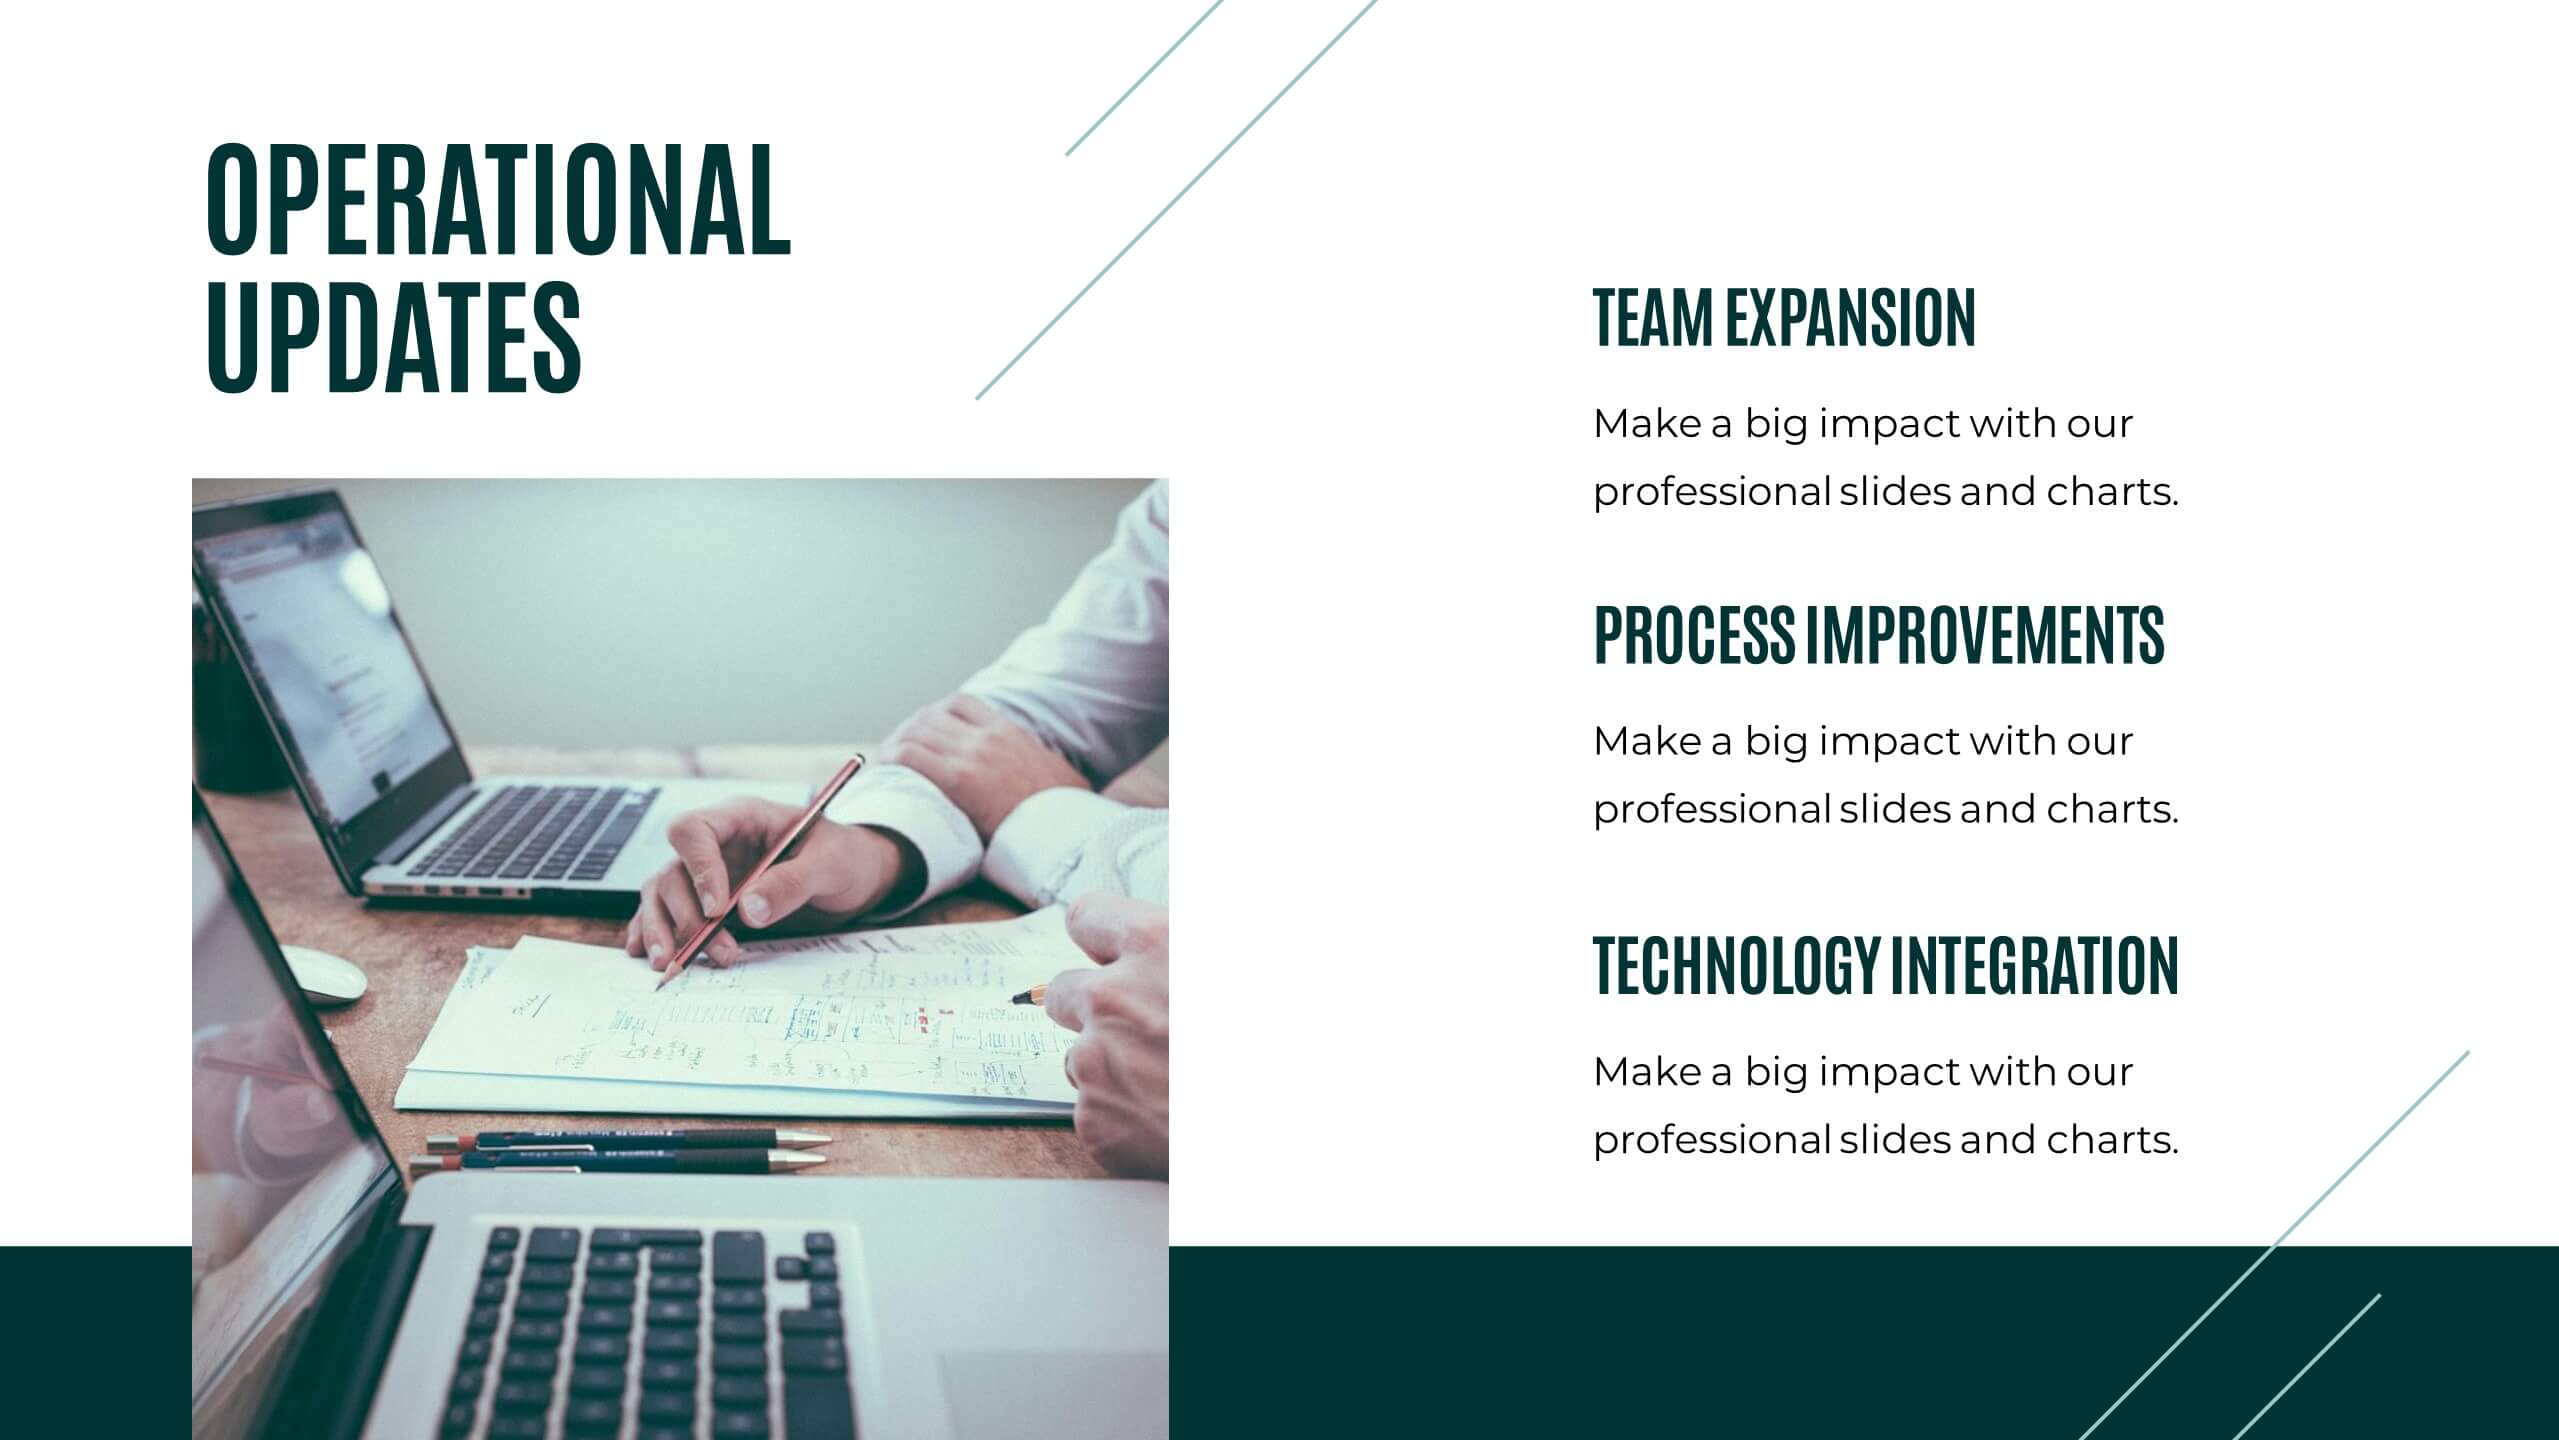
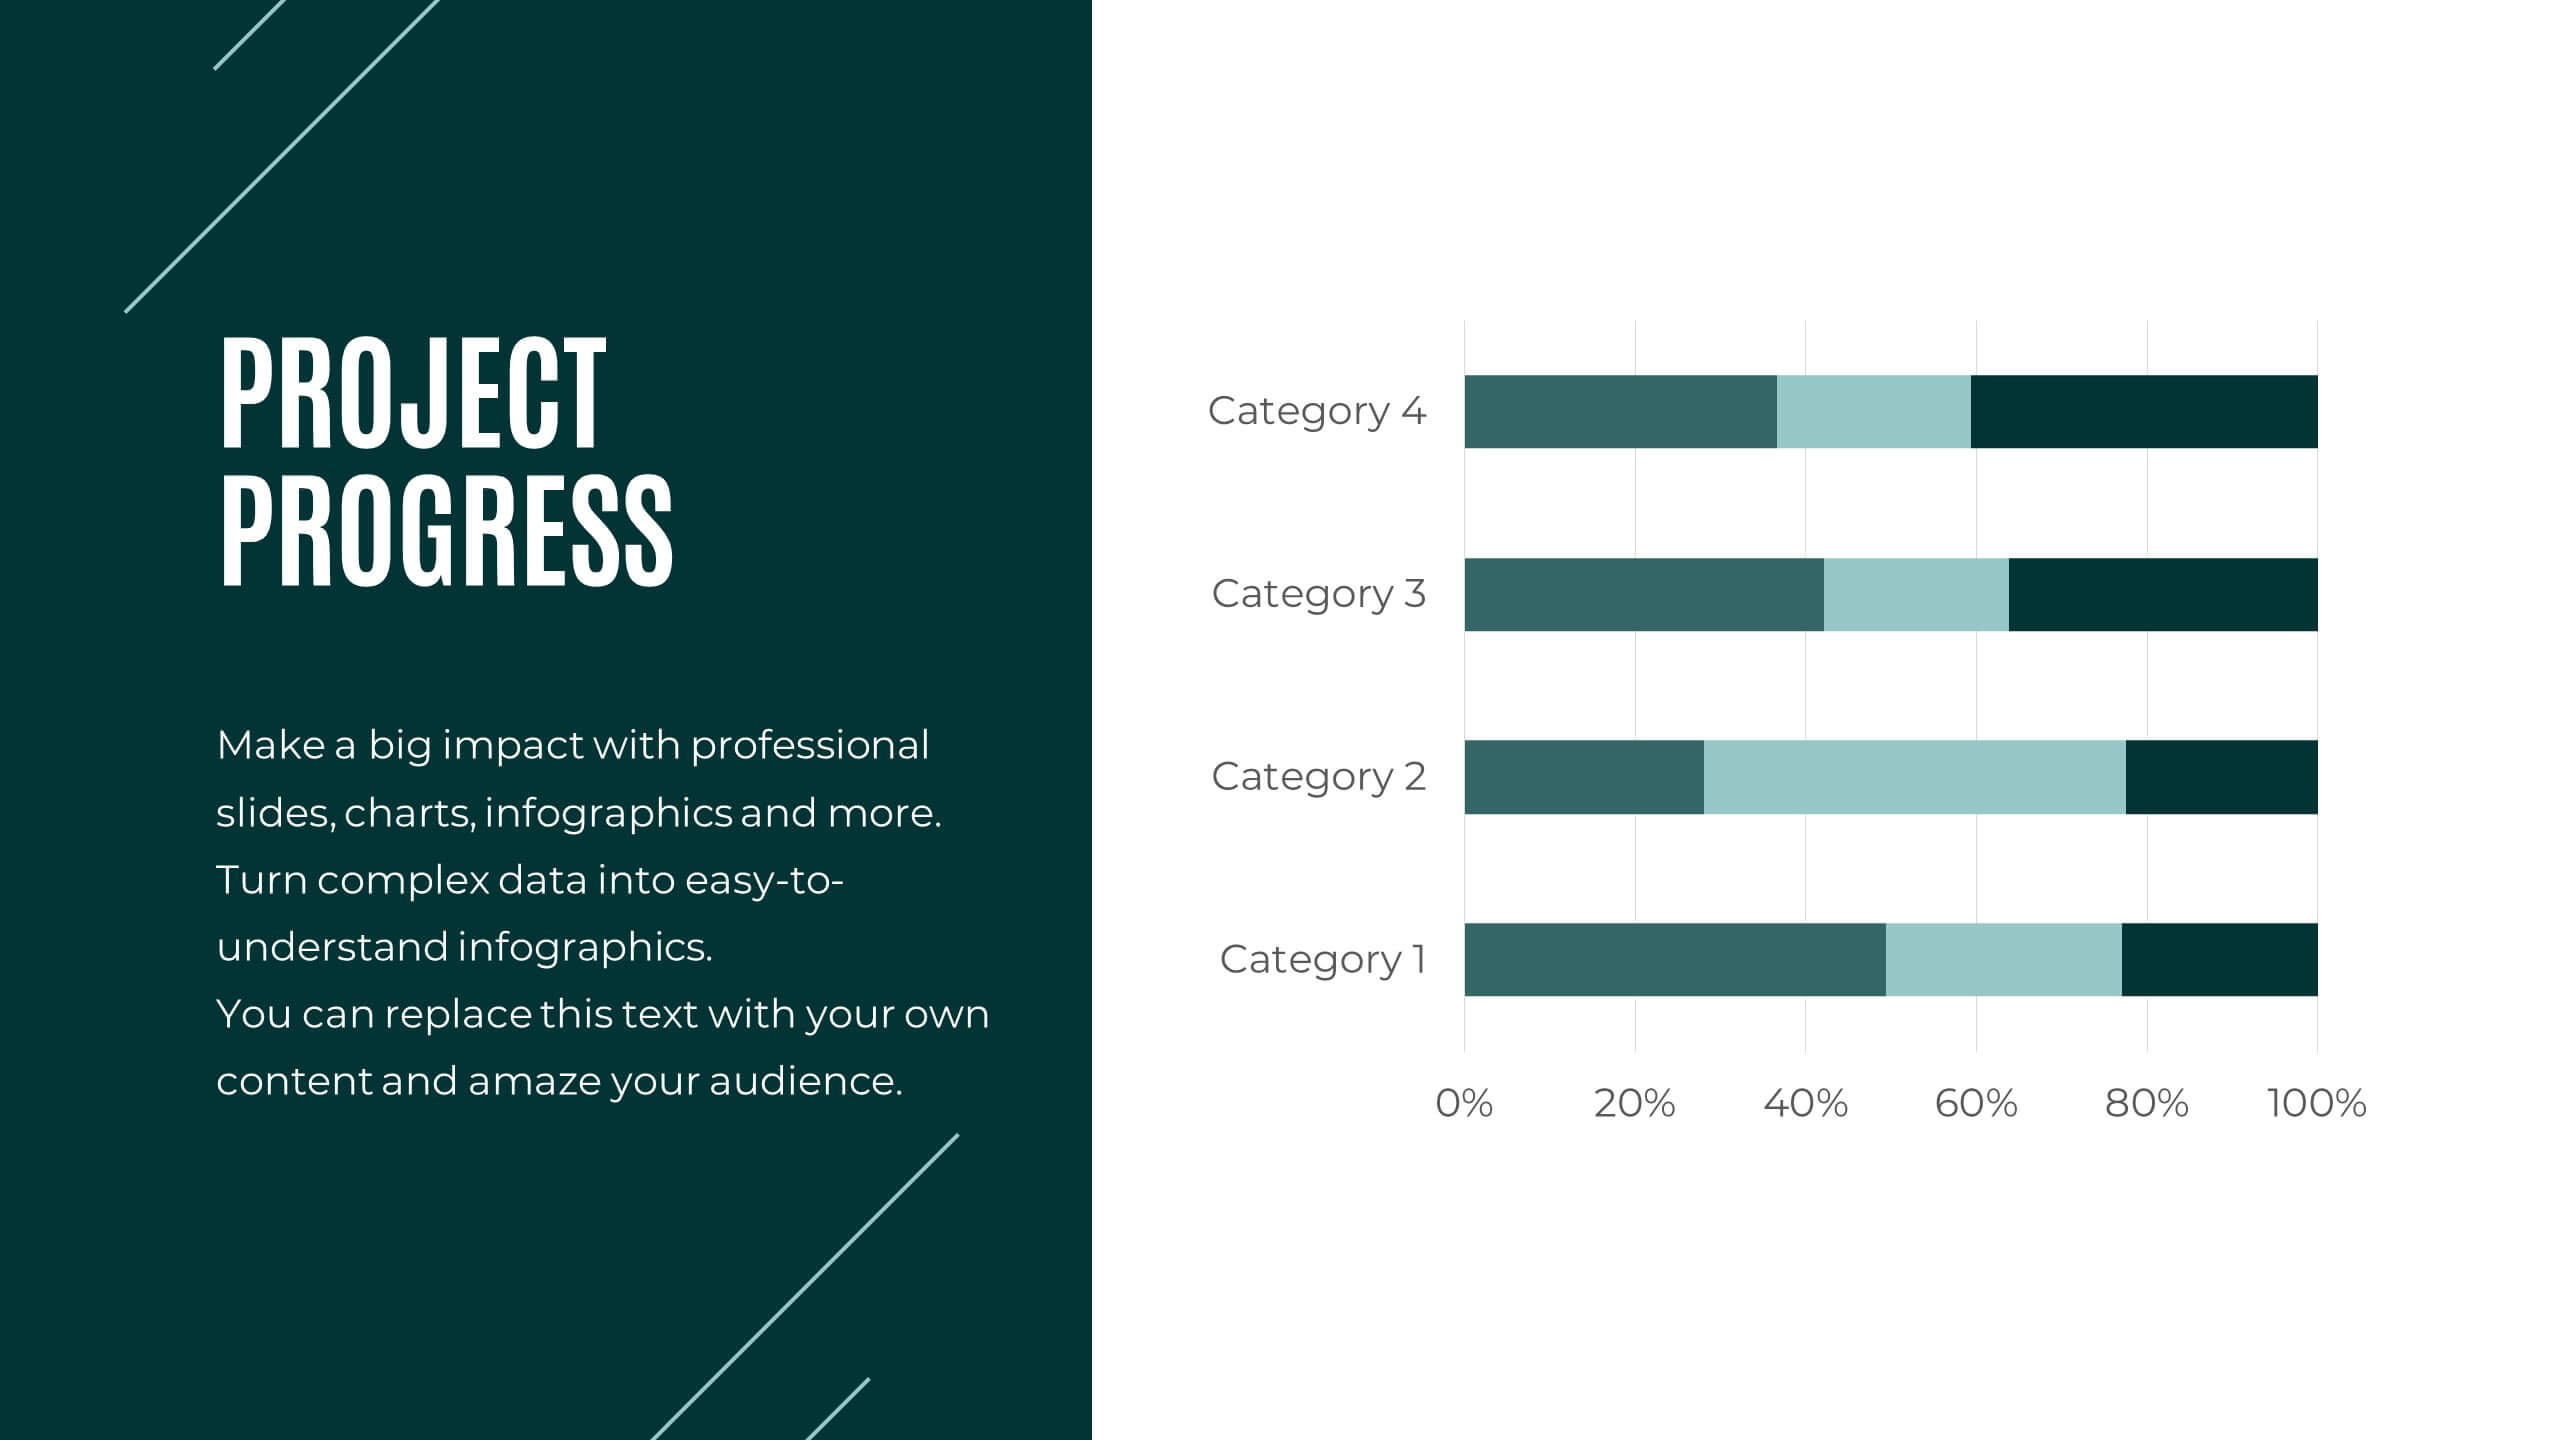
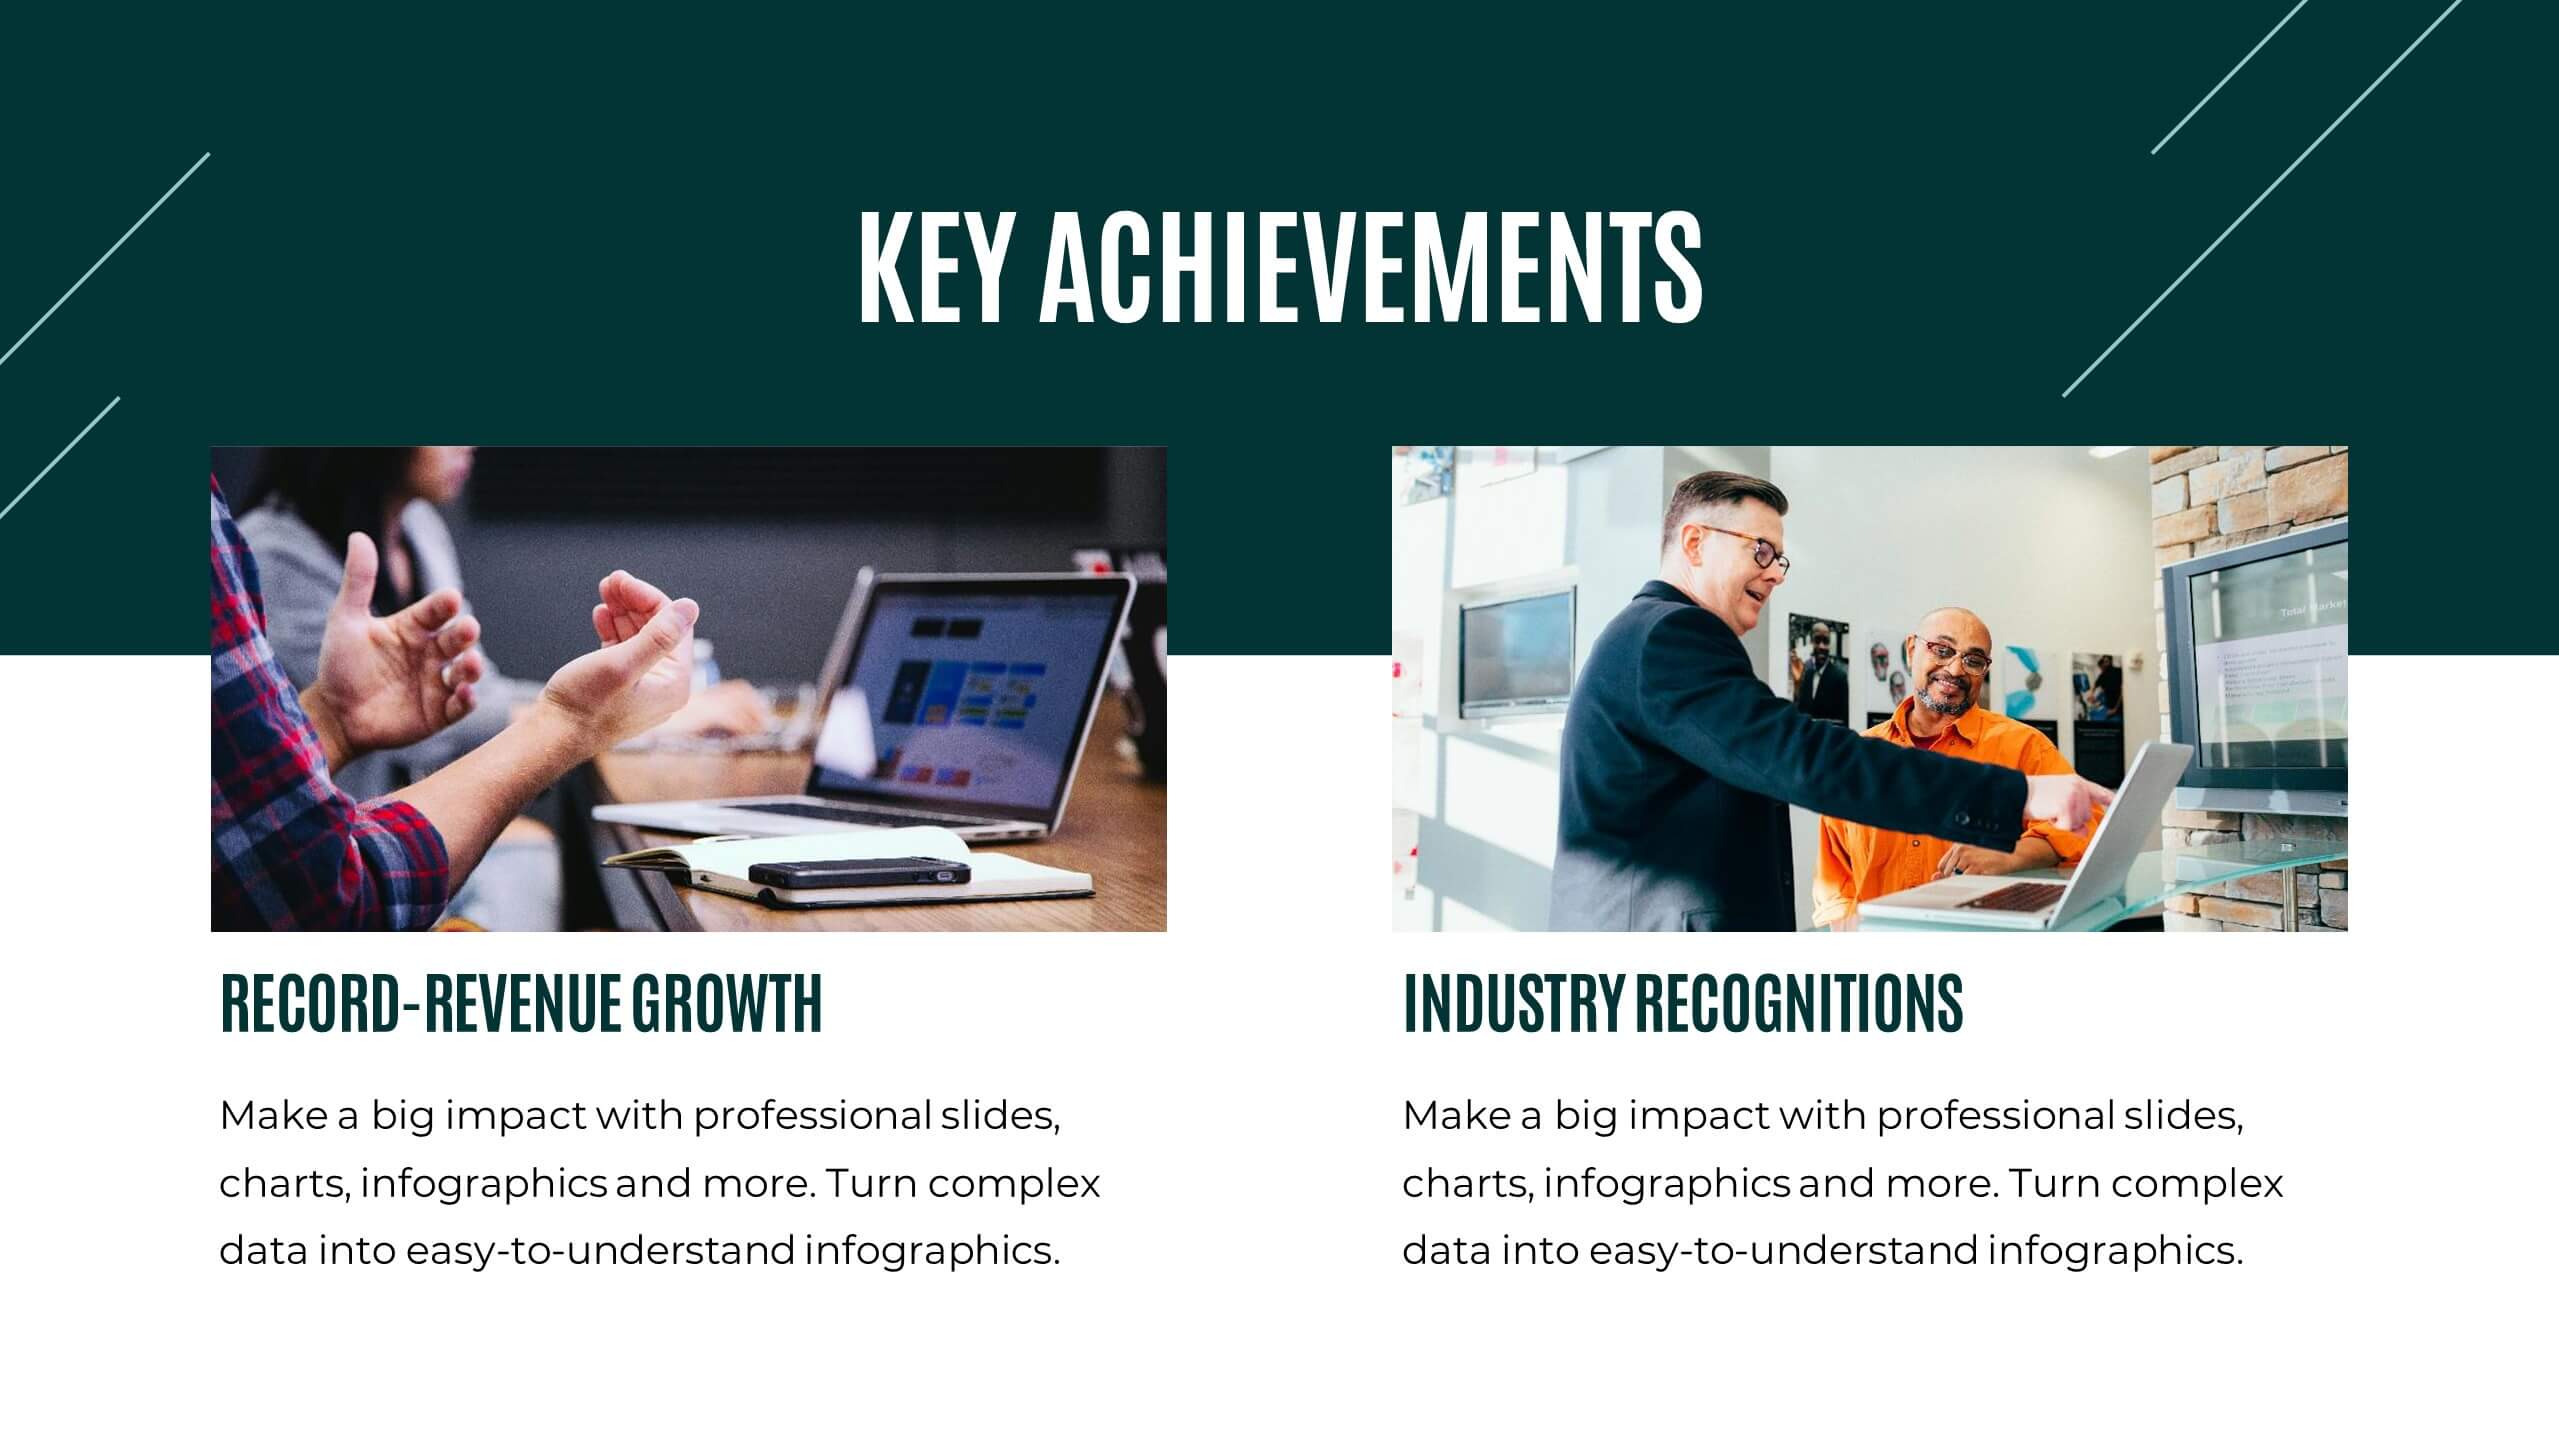
Prism Project Status Report Presentation
Deliver impactful updates with this comprehensive project status report template! Perfect for presenting key highlights, performance metrics, and strategic initiatives. Ideal for project managers aiming to keep stakeholders informed and aligned. Compatible with PowerPoint, Keynote, and Google Slides, this template ensures your reports are clear, professional, and engaging. Keep projects on track!


5 diapositivas
Manufacturing in the US Infographics
Delve into the industrial heartbeat of America with the manufacturing in the US infographics. Rendered in patriotic hues of red, blue, and white, this vertical, creative, and informative template is a powerhouse of insight, perfect for industry analysts, educational purposes, or corporate presentations aiming to explore the intricacies of U.S. manufacturing. The infographic doesn’t just present data; it tells the story of American industry, with engaging graphics, intuitive icons, and dedicated spaces for real imagery that bring facts to life. This tool is invaluable for anyone needing to communicate the vast scope of U.S. manufacturing prowess effectively and compellingly.


7 diapositivas
Europe Map Infographic Presentation Template
Europe is a continent located in the northern part of the globe and surrounded by water on three sides. It is bordered by the Atlantic Ocean to the west, the Arctic Ocean to the north, and the Mediterranean Sea to the south. Europe is divided into roughly forty four countries and dependent territories, each one with its own unique identity, cuisine and culture. This European map template is a vector map of an outline of Europe, with color-coded and labeled countries and a legend. This map template can be used for presentations, reports and blogs about tourism it's a simple and clean style map.


6 diapositivas
Business Value Chain Strategy
Turn your strategy into a winning move with this interactive spin on business value chains. This engaging diagram template helps break down key activities and visualize how each stage adds value—perfect for process optimization or stakeholder presentations. Fully compatible with PowerPoint, Keynote, and Google Slides.