


Características


¿Tienes alguna pregunta?
Recomendar


6 diapositivas
Governance Structure Overview Presentation
A clear, polished flow of ideas makes this slide instantly engaging, guiding viewers through each essential component with ease. This presentation explains how an organization structures oversight, responsibilities, and decision-making to ensure accountability and performance. Clean icons and balanced spacing keep everything easy to follow. Fully compatible with PowerPoint, Keynote, and Google Slides.


5 diapositivas
Sustainable Growth and Green Policy Presentation
Showcase your eco-initiatives with the Sustainable Growth and Green Policy Presentation. This unique leaf-shaped diagram highlights four key environmental pillars—ideal for presenting climate strategies, energy policies, or green development goals. With a sleek and modern design, it’s perfect for NGOs, government briefings, or corporate sustainability reports. Editable in Canva, PowerPoint, Keynote, and Google Slides.


10 diapositivas
Innovation in Science Presentation
Showcase cutting-edge ideas with this Innovation in Science Presentation Template. Featuring a sleek lightbulb graphic with colorful horizontal bars, it's ideal for outlining research stages, technological breakthroughs, or futuristic concepts. Great for scientists, educators, and innovation teams. Easily customizable in PowerPoint, Keynote, and Google Slides.


6 diapositivas
IT Architecture Enterprise Infographics
Gain insights into Enterprise IT Architecture with our customizable infographic template. This template is fully compatible with popular presentation software like PowerPoint, Keynote, and Google Slides, allowing you to easily customize it to illustrate and communicate various aspects of enterprise IT architecture. The Enterprise IT Architecture infographic template offers a visually engaging platform to explore and explain the architectural components, frameworks, and strategies used in large organizations. Whether you're an IT professional, business leader, or simply interested in enterprise technology, this template provides a user-friendly canvas to create informative presentations and educational materials. Enhance your knowledge of Enterprise IT Architecture with this SEO-optimized infographic template, thoughtfully designed for clarity and ease of use. Customize it to highlight key principles, architectural layers, integration strategies, and best practices, ensuring that your audience gains a comprehensive understanding of this critical field. Start crafting your personalized infographic today to delve into the world of Enterprise IT Architecture.


6 diapositivas
Cloud Engineering Infographics
Discover the world of Cloud Engineering with our customizable infographic template. This template is fully compatible with popular presentation software like PowerPoint, Keynote, and Google Slides, allowing you to easily customize it to illustrate and communicate various aspects of cloud engineering. The Cloud Engineering infographic template offers a visually engaging platform to explore and explain the principles, practices, and technologies related to cloud computing and engineering. Whether you're a cloud engineer, IT professional, business leader, or simply interested in cloud technology, this template provides a user-friendly canvas to create informative presentations and educational materials. Deepen your understanding of Cloud Engineering with this SEO-optimized infographic template, thoughtfully designed for clarity and ease of use. Customize it to highlight key concepts, cloud service models, deployment strategies, and the benefits of cloud engineering, ensuring that your audience gains valuable insights into this rapidly evolving field. Start crafting your personalized infographic today to delve into the world of Cloud Engineering.


8 diapositivas
Attention-Interest-Desire-Action Presentation
Enhance your marketing presentations with this Attention-Interest-Desire-Action (AIDA) Model Presentation template. Designed with a modern, structured pyramid layout, this template clearly illustrates the four key stages of consumer decision-making. Ideal for marketers, sales teams, and business strategists, it’s fully customizable and compatible with PowerPoint, Keynote, and Google Slides.


4 diapositivas
Oceania Region Editable Map Slide Presentation
Highlight your insights across Australia and the Pacific with a clean, modern map layout designed for clarity and engagement. Ideal for visualizing market regions, travel data, or geographic comparisons, this slide combines style with precision. Fully compatible with PowerPoint, Keynote, and Google Slides for effortless customization and presentation.


24 diapositivas
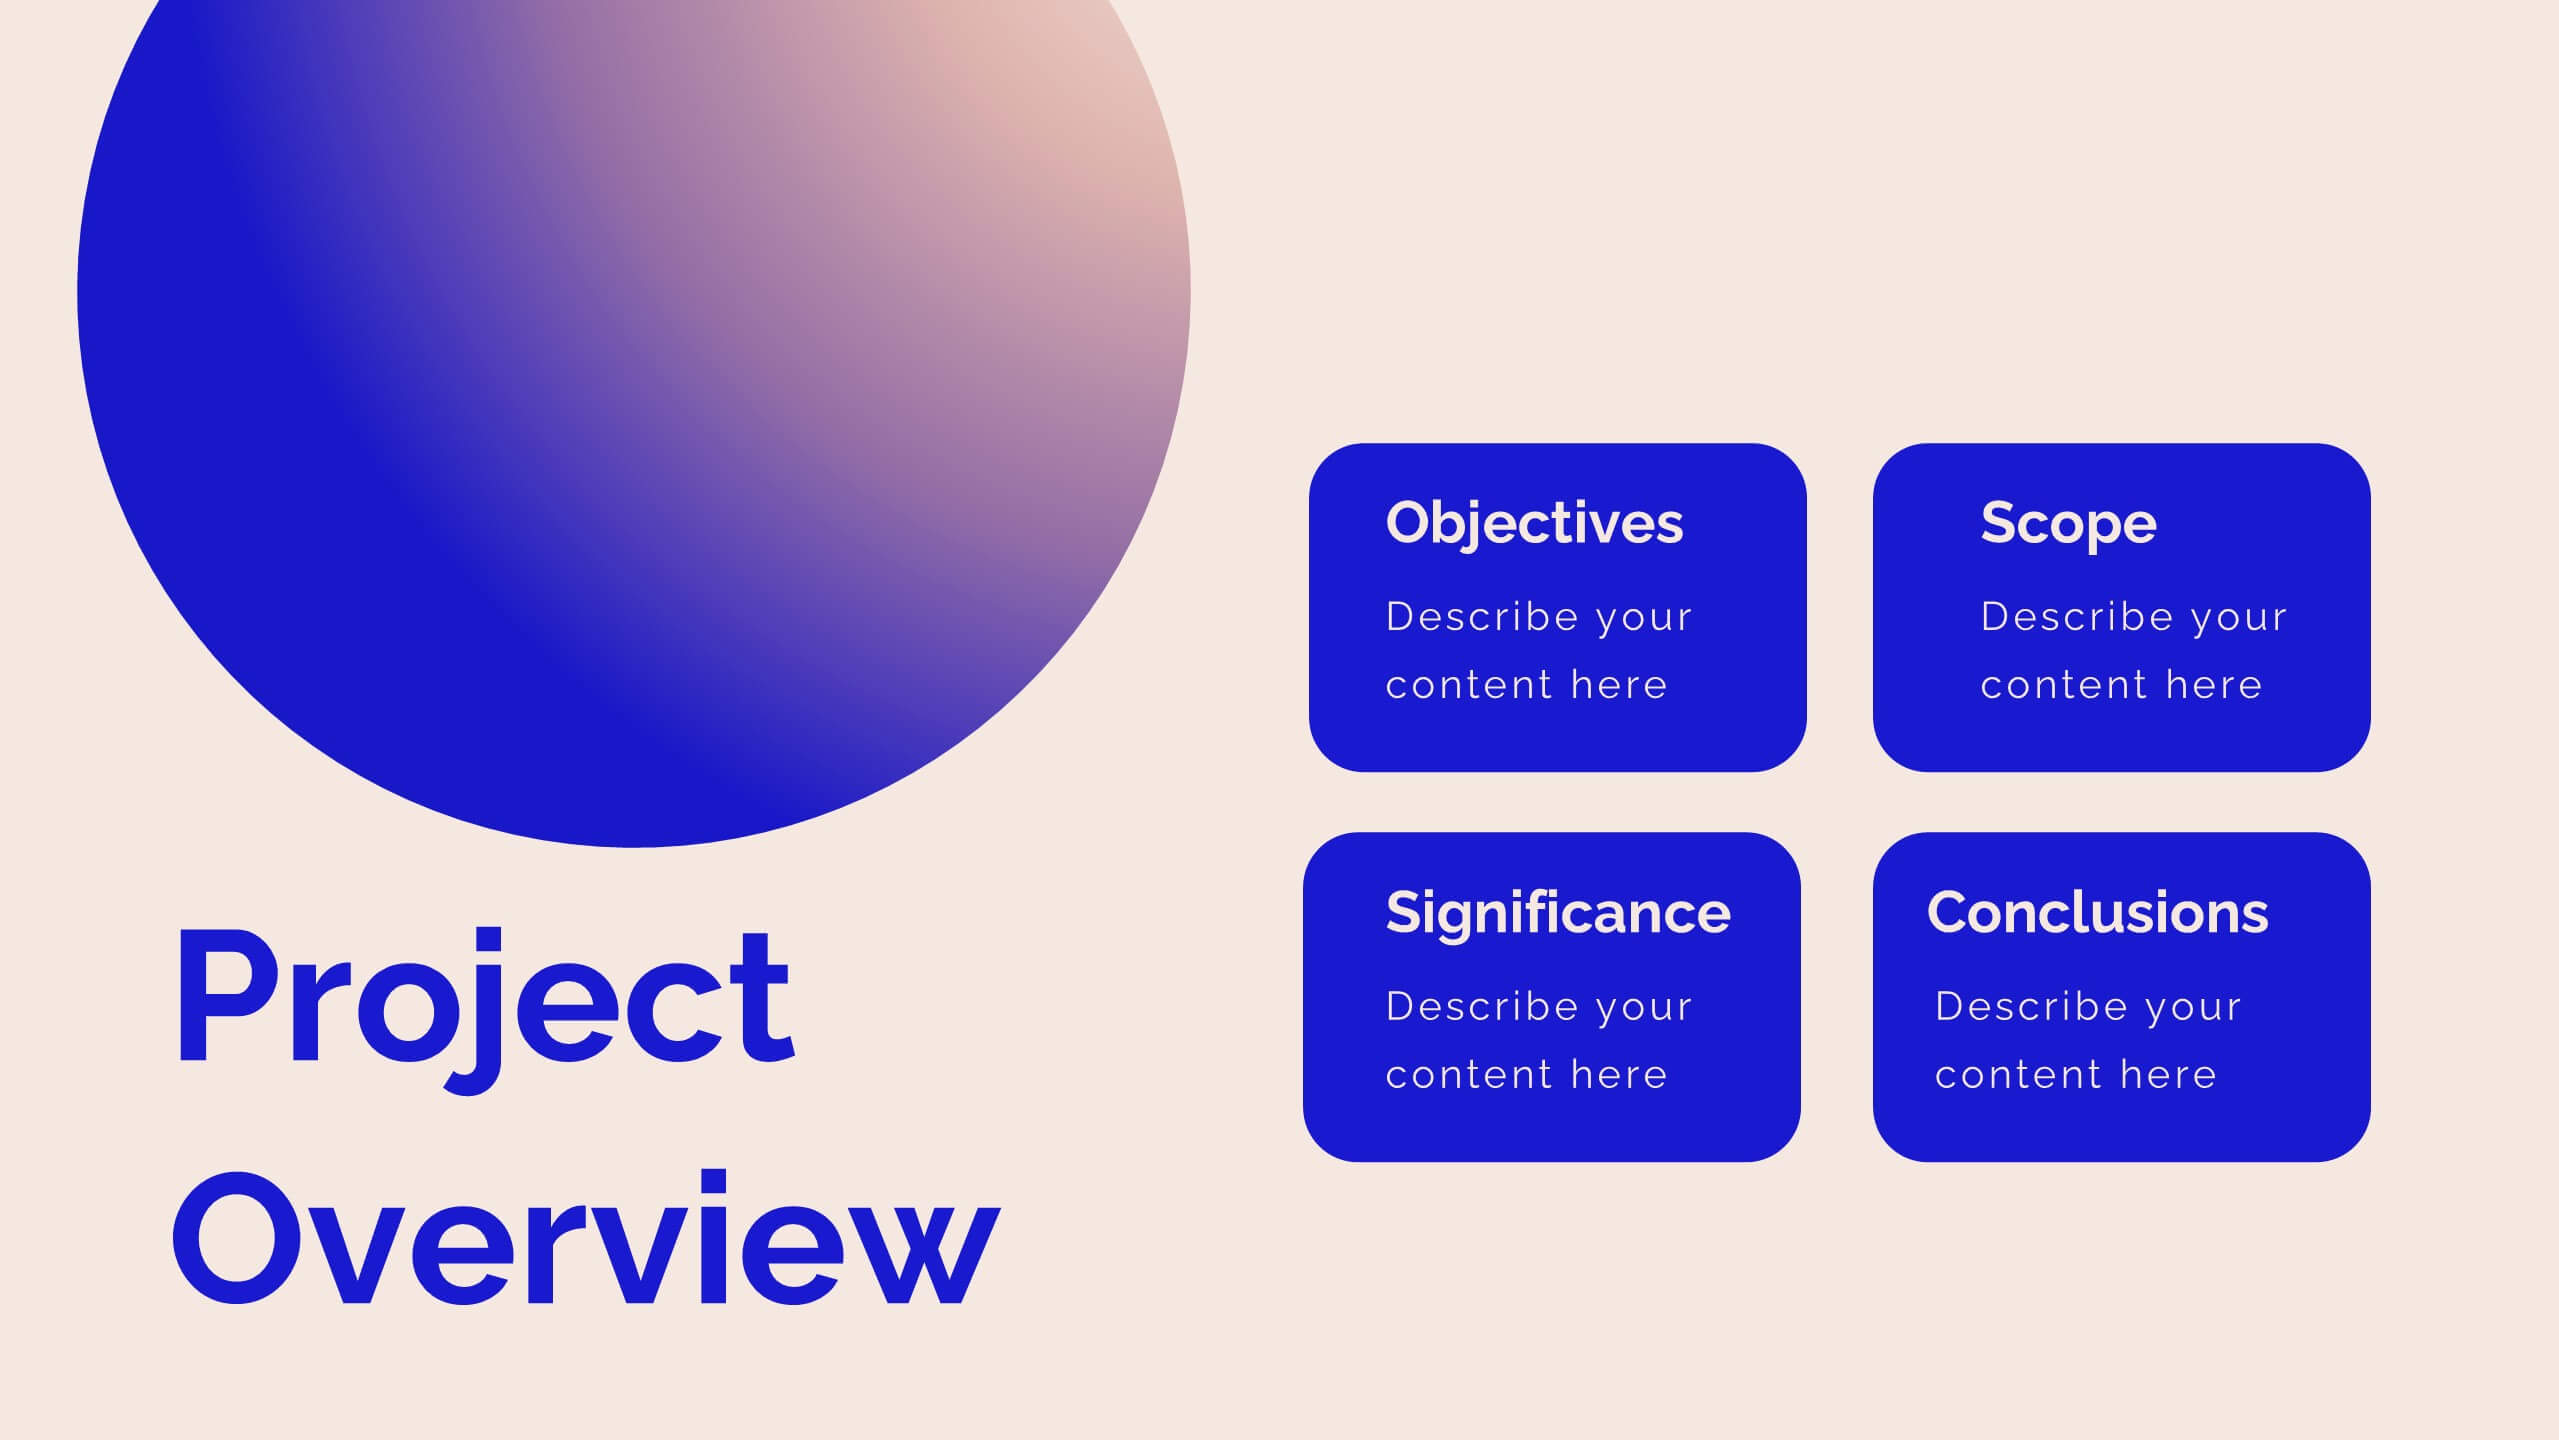
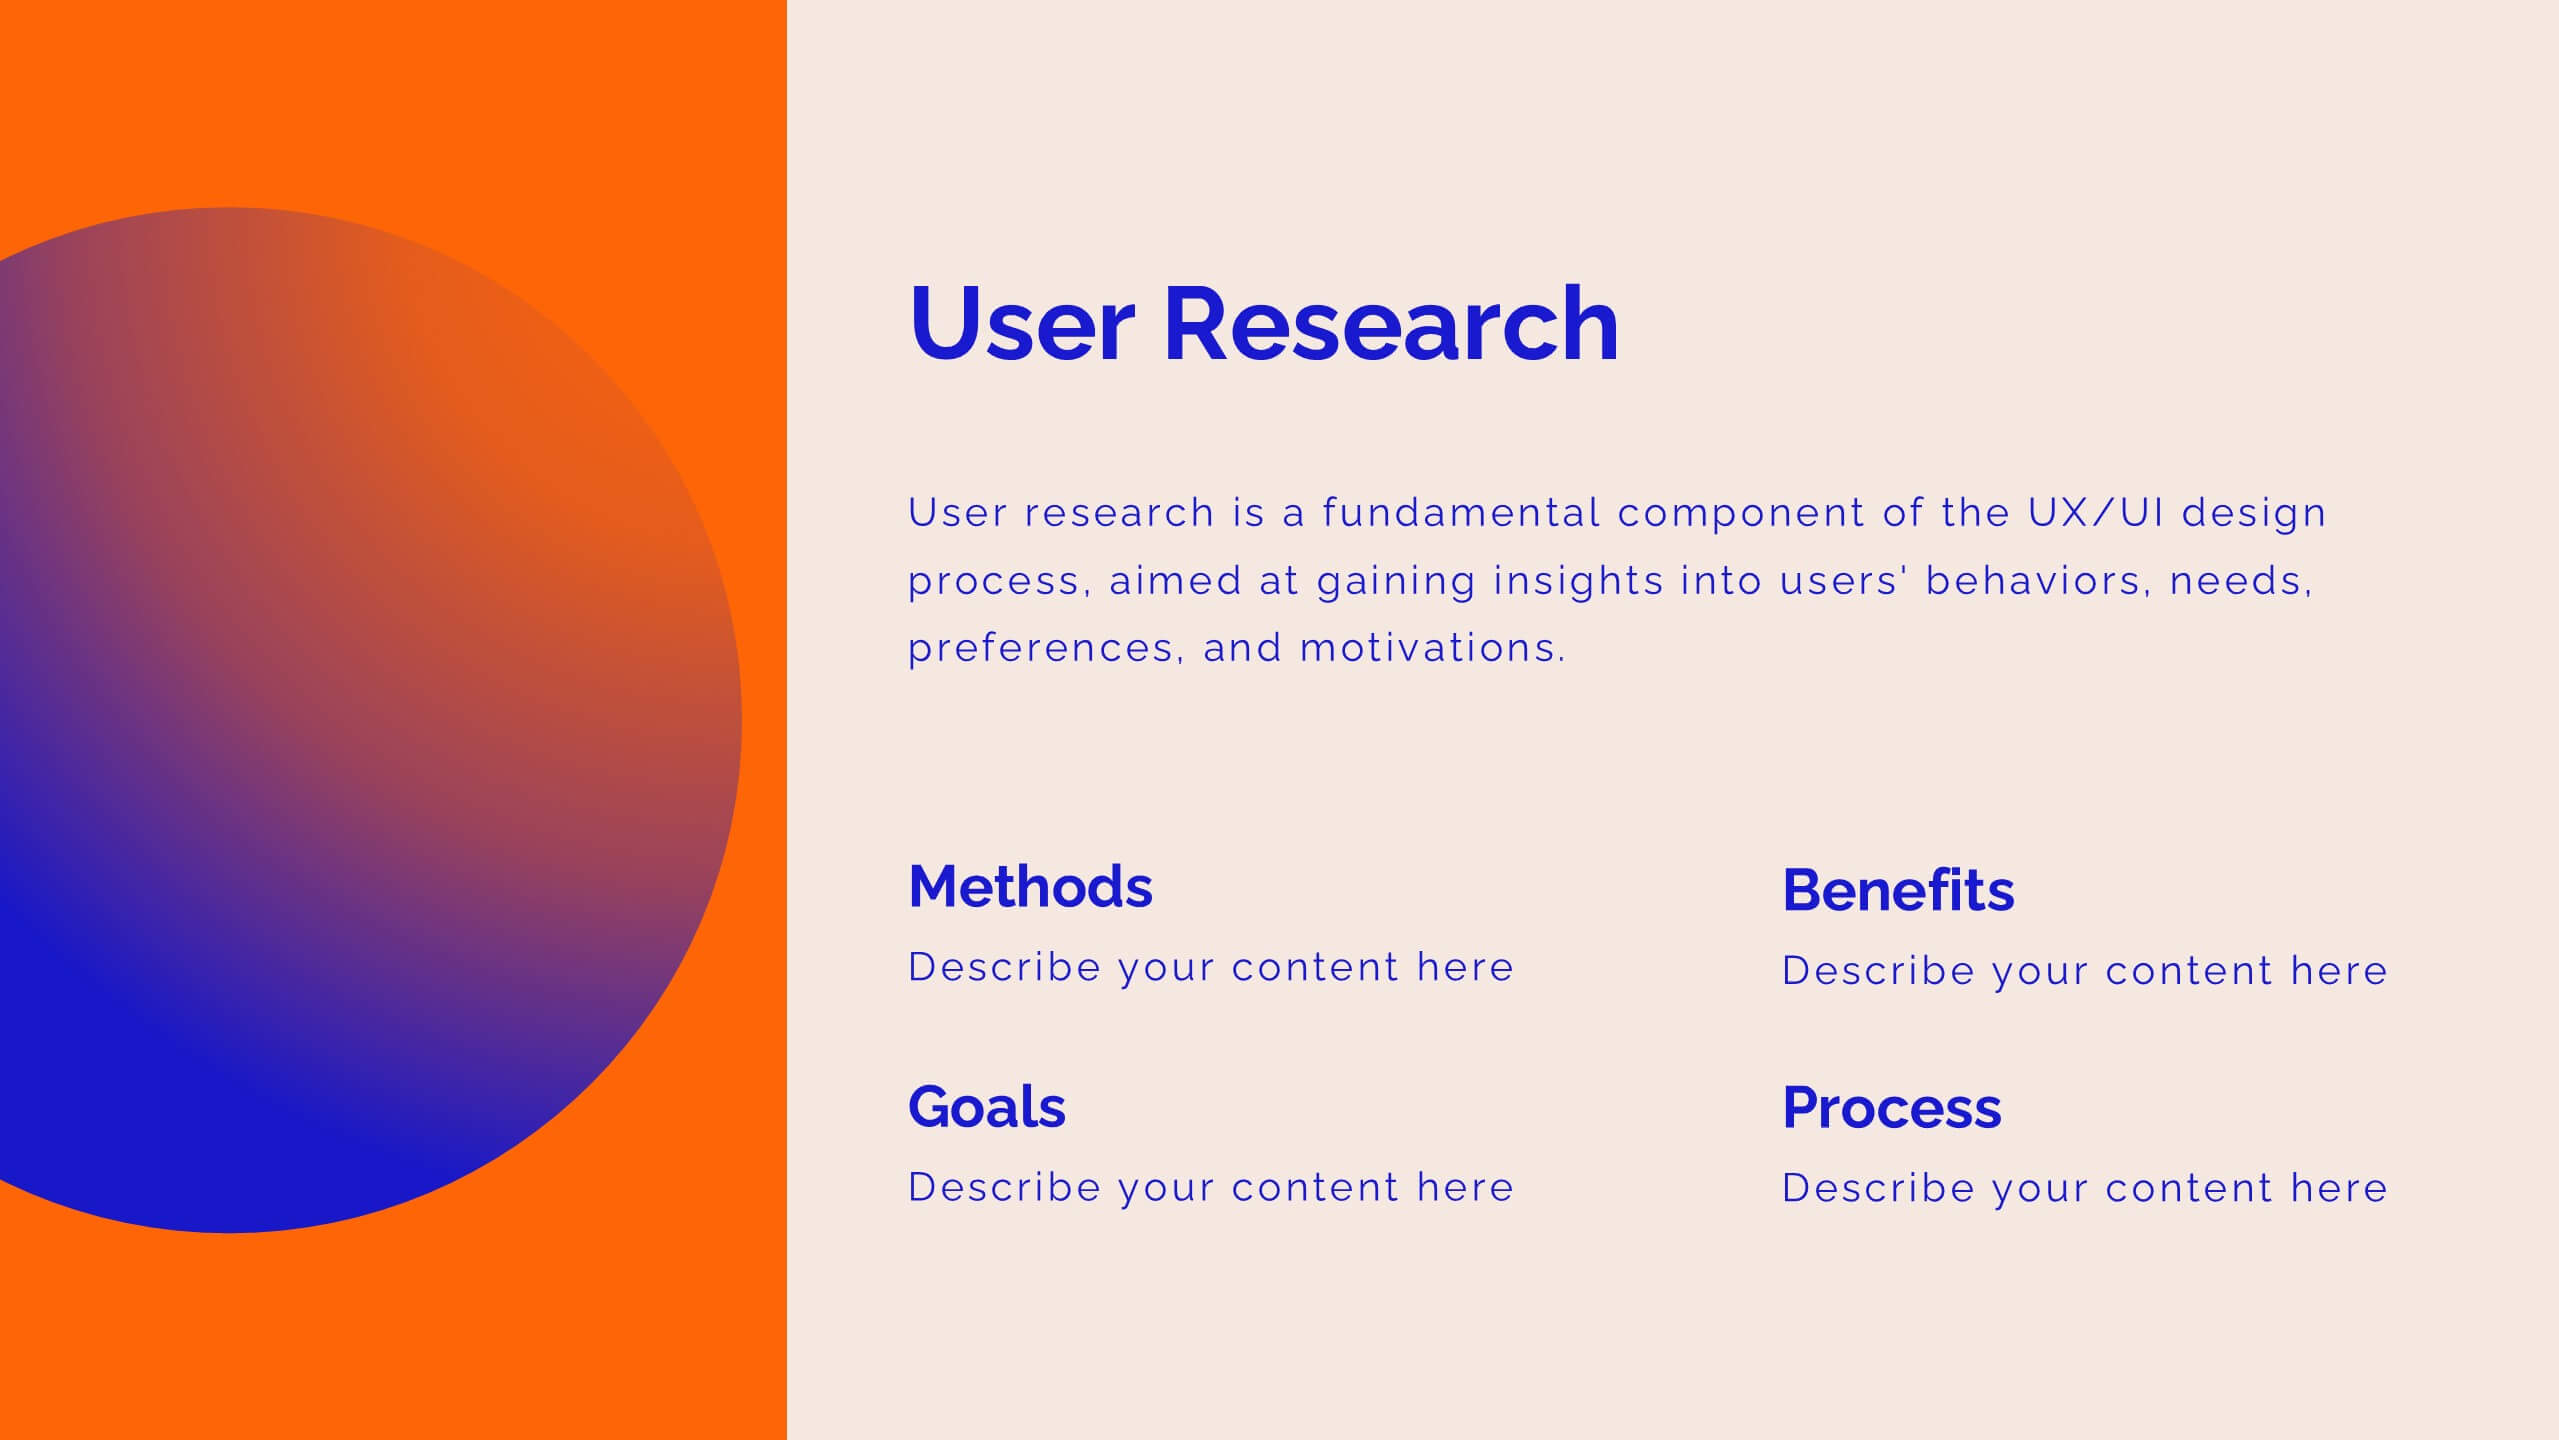
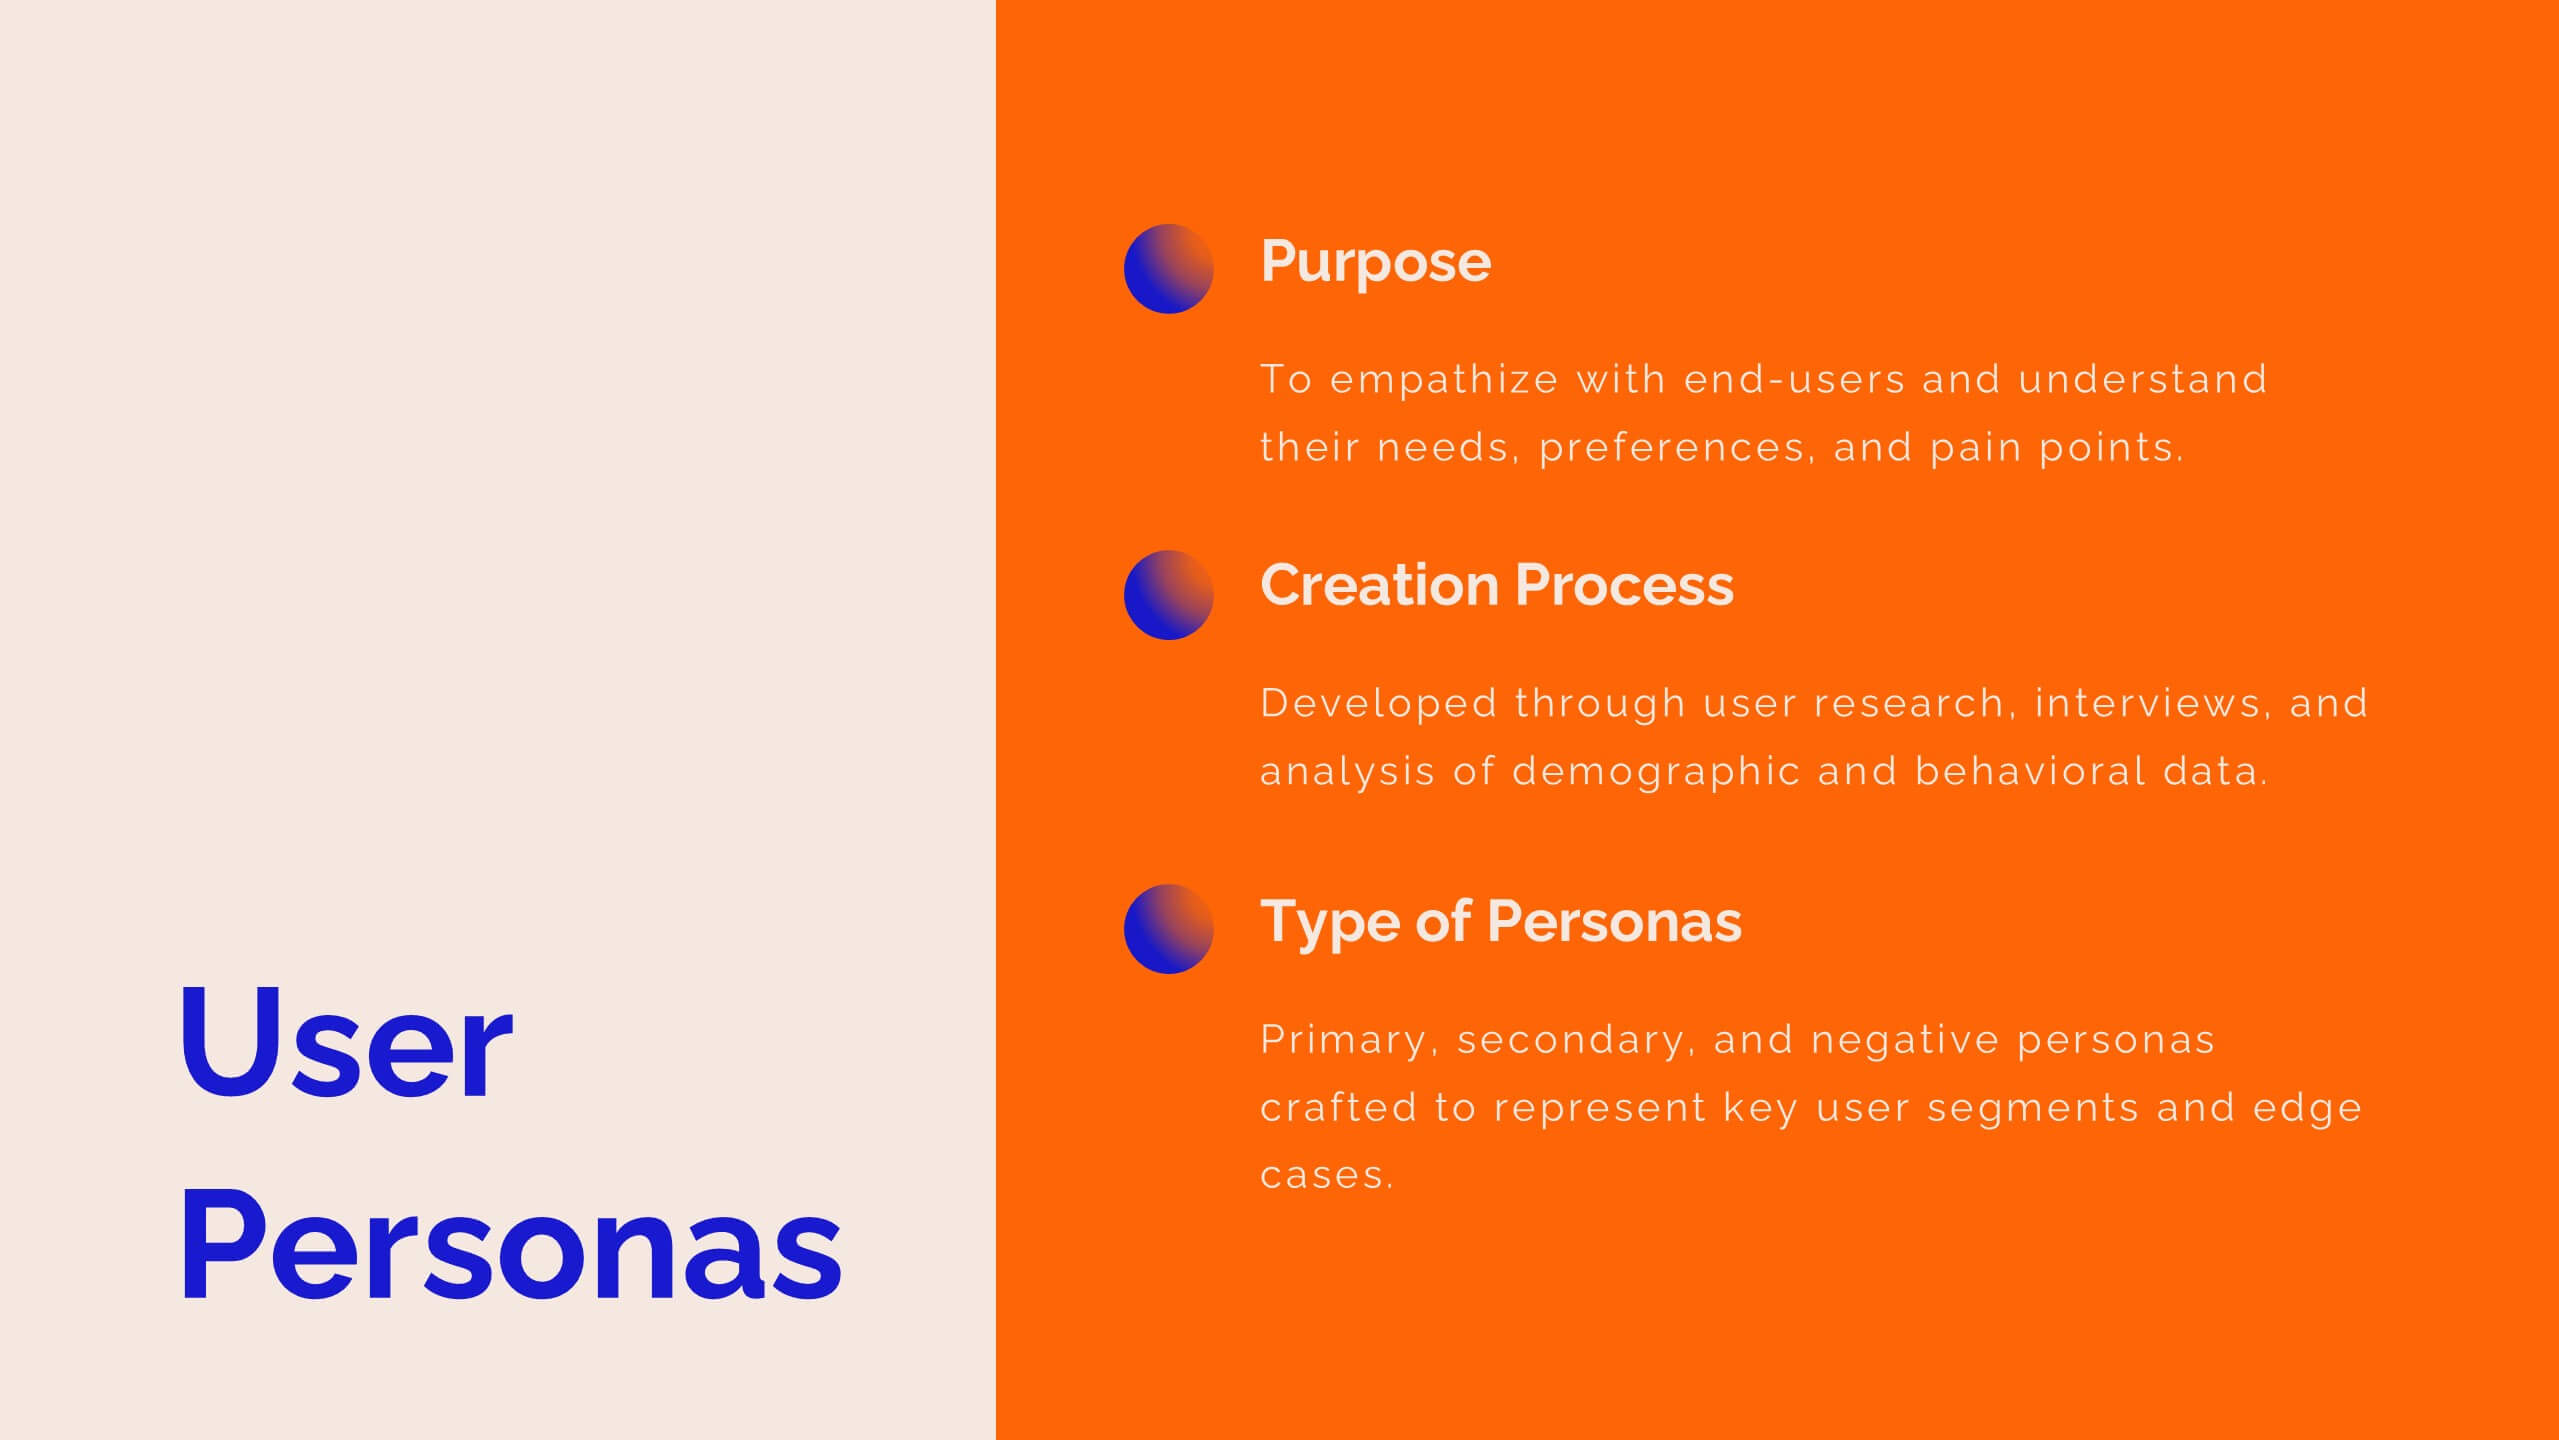
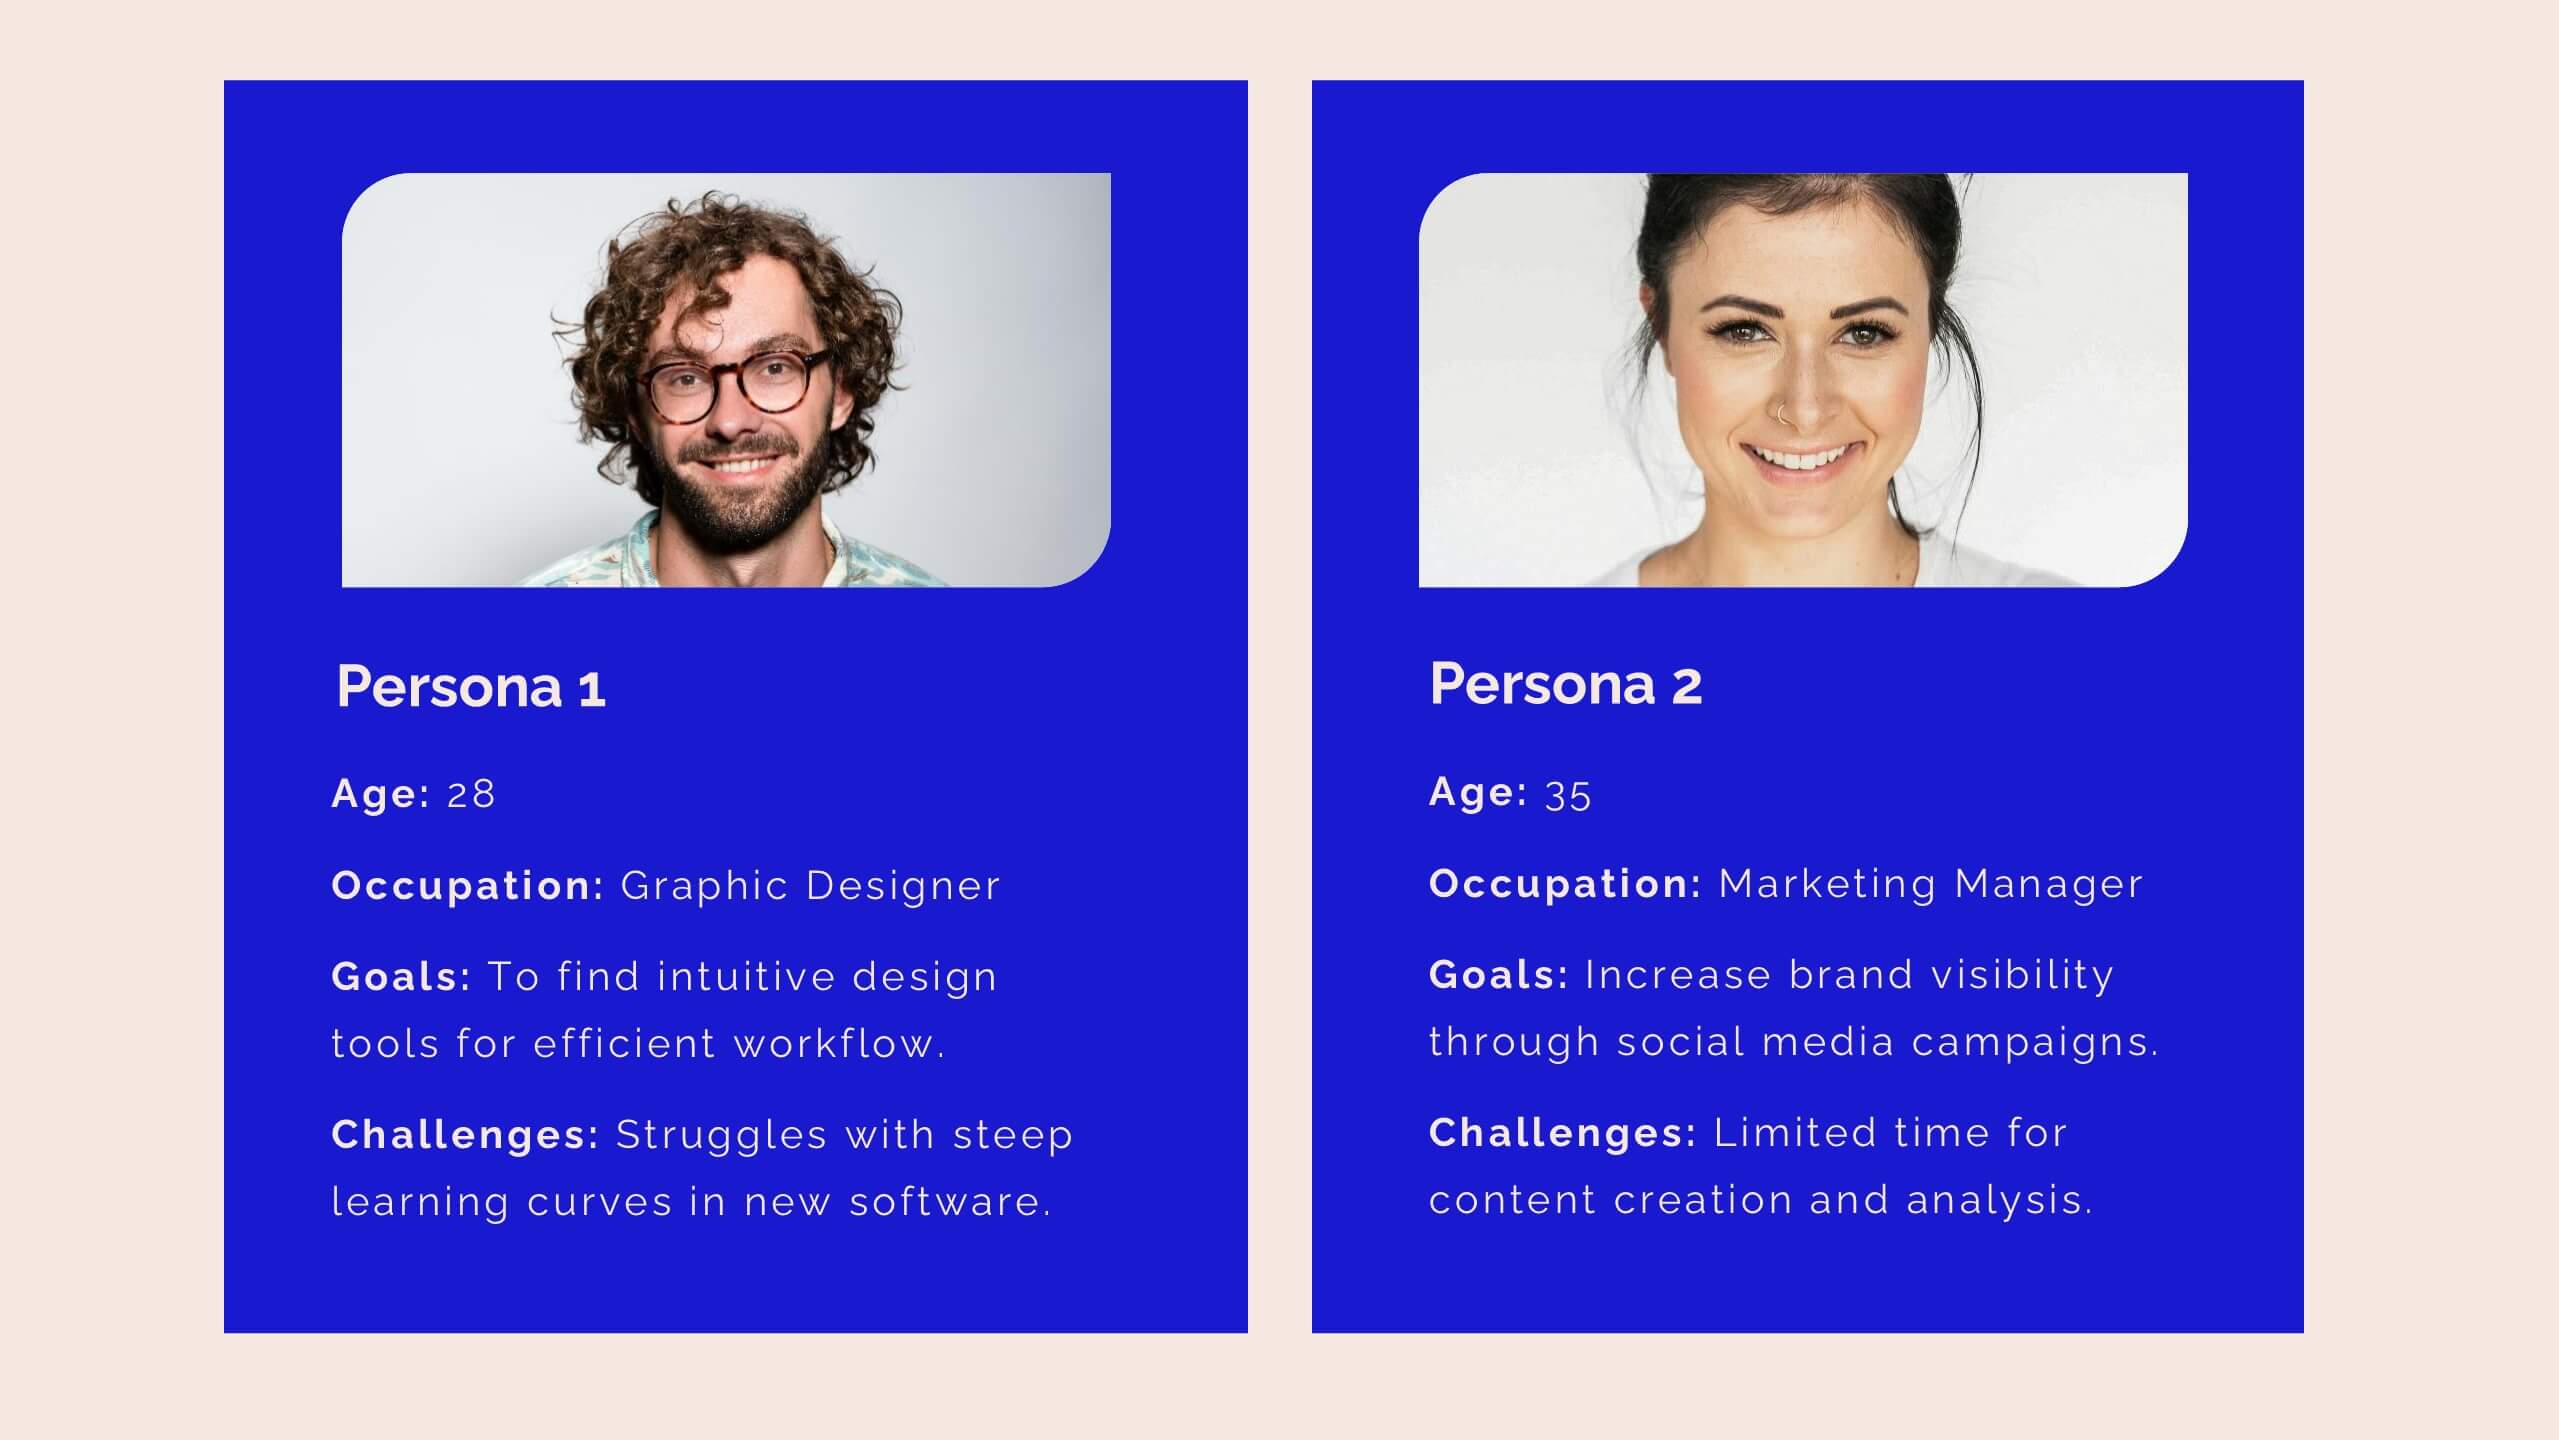
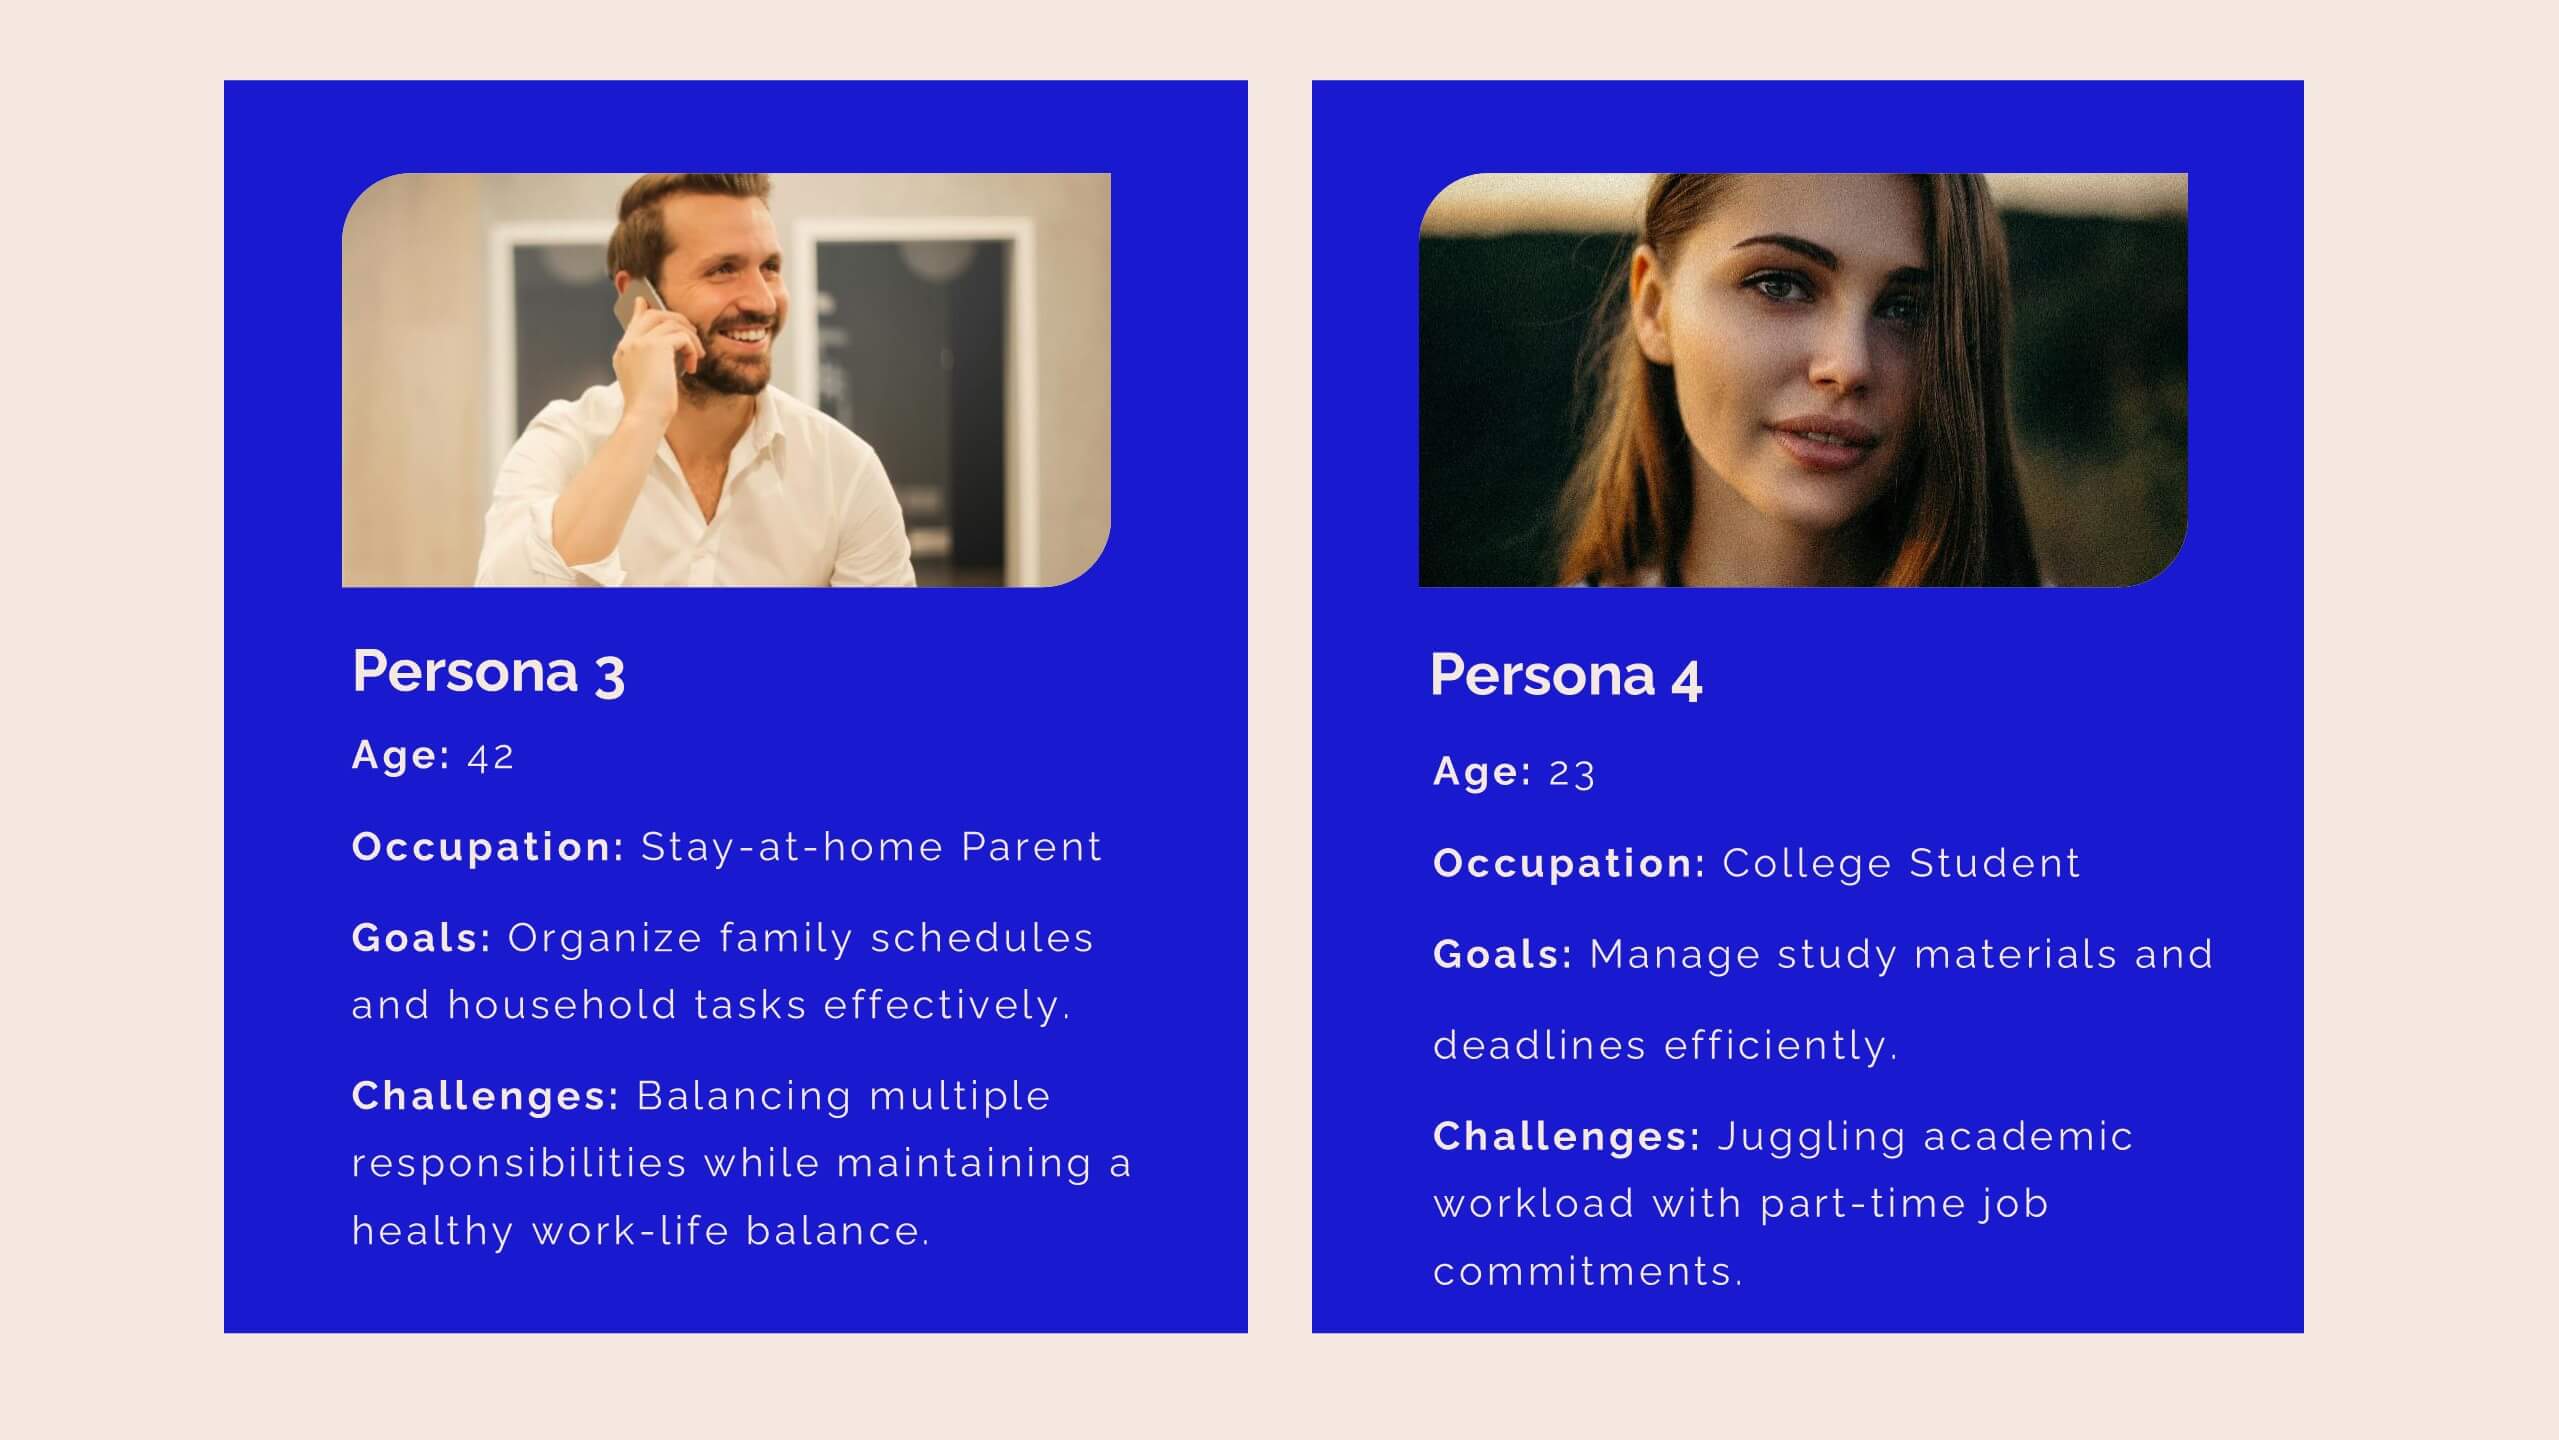
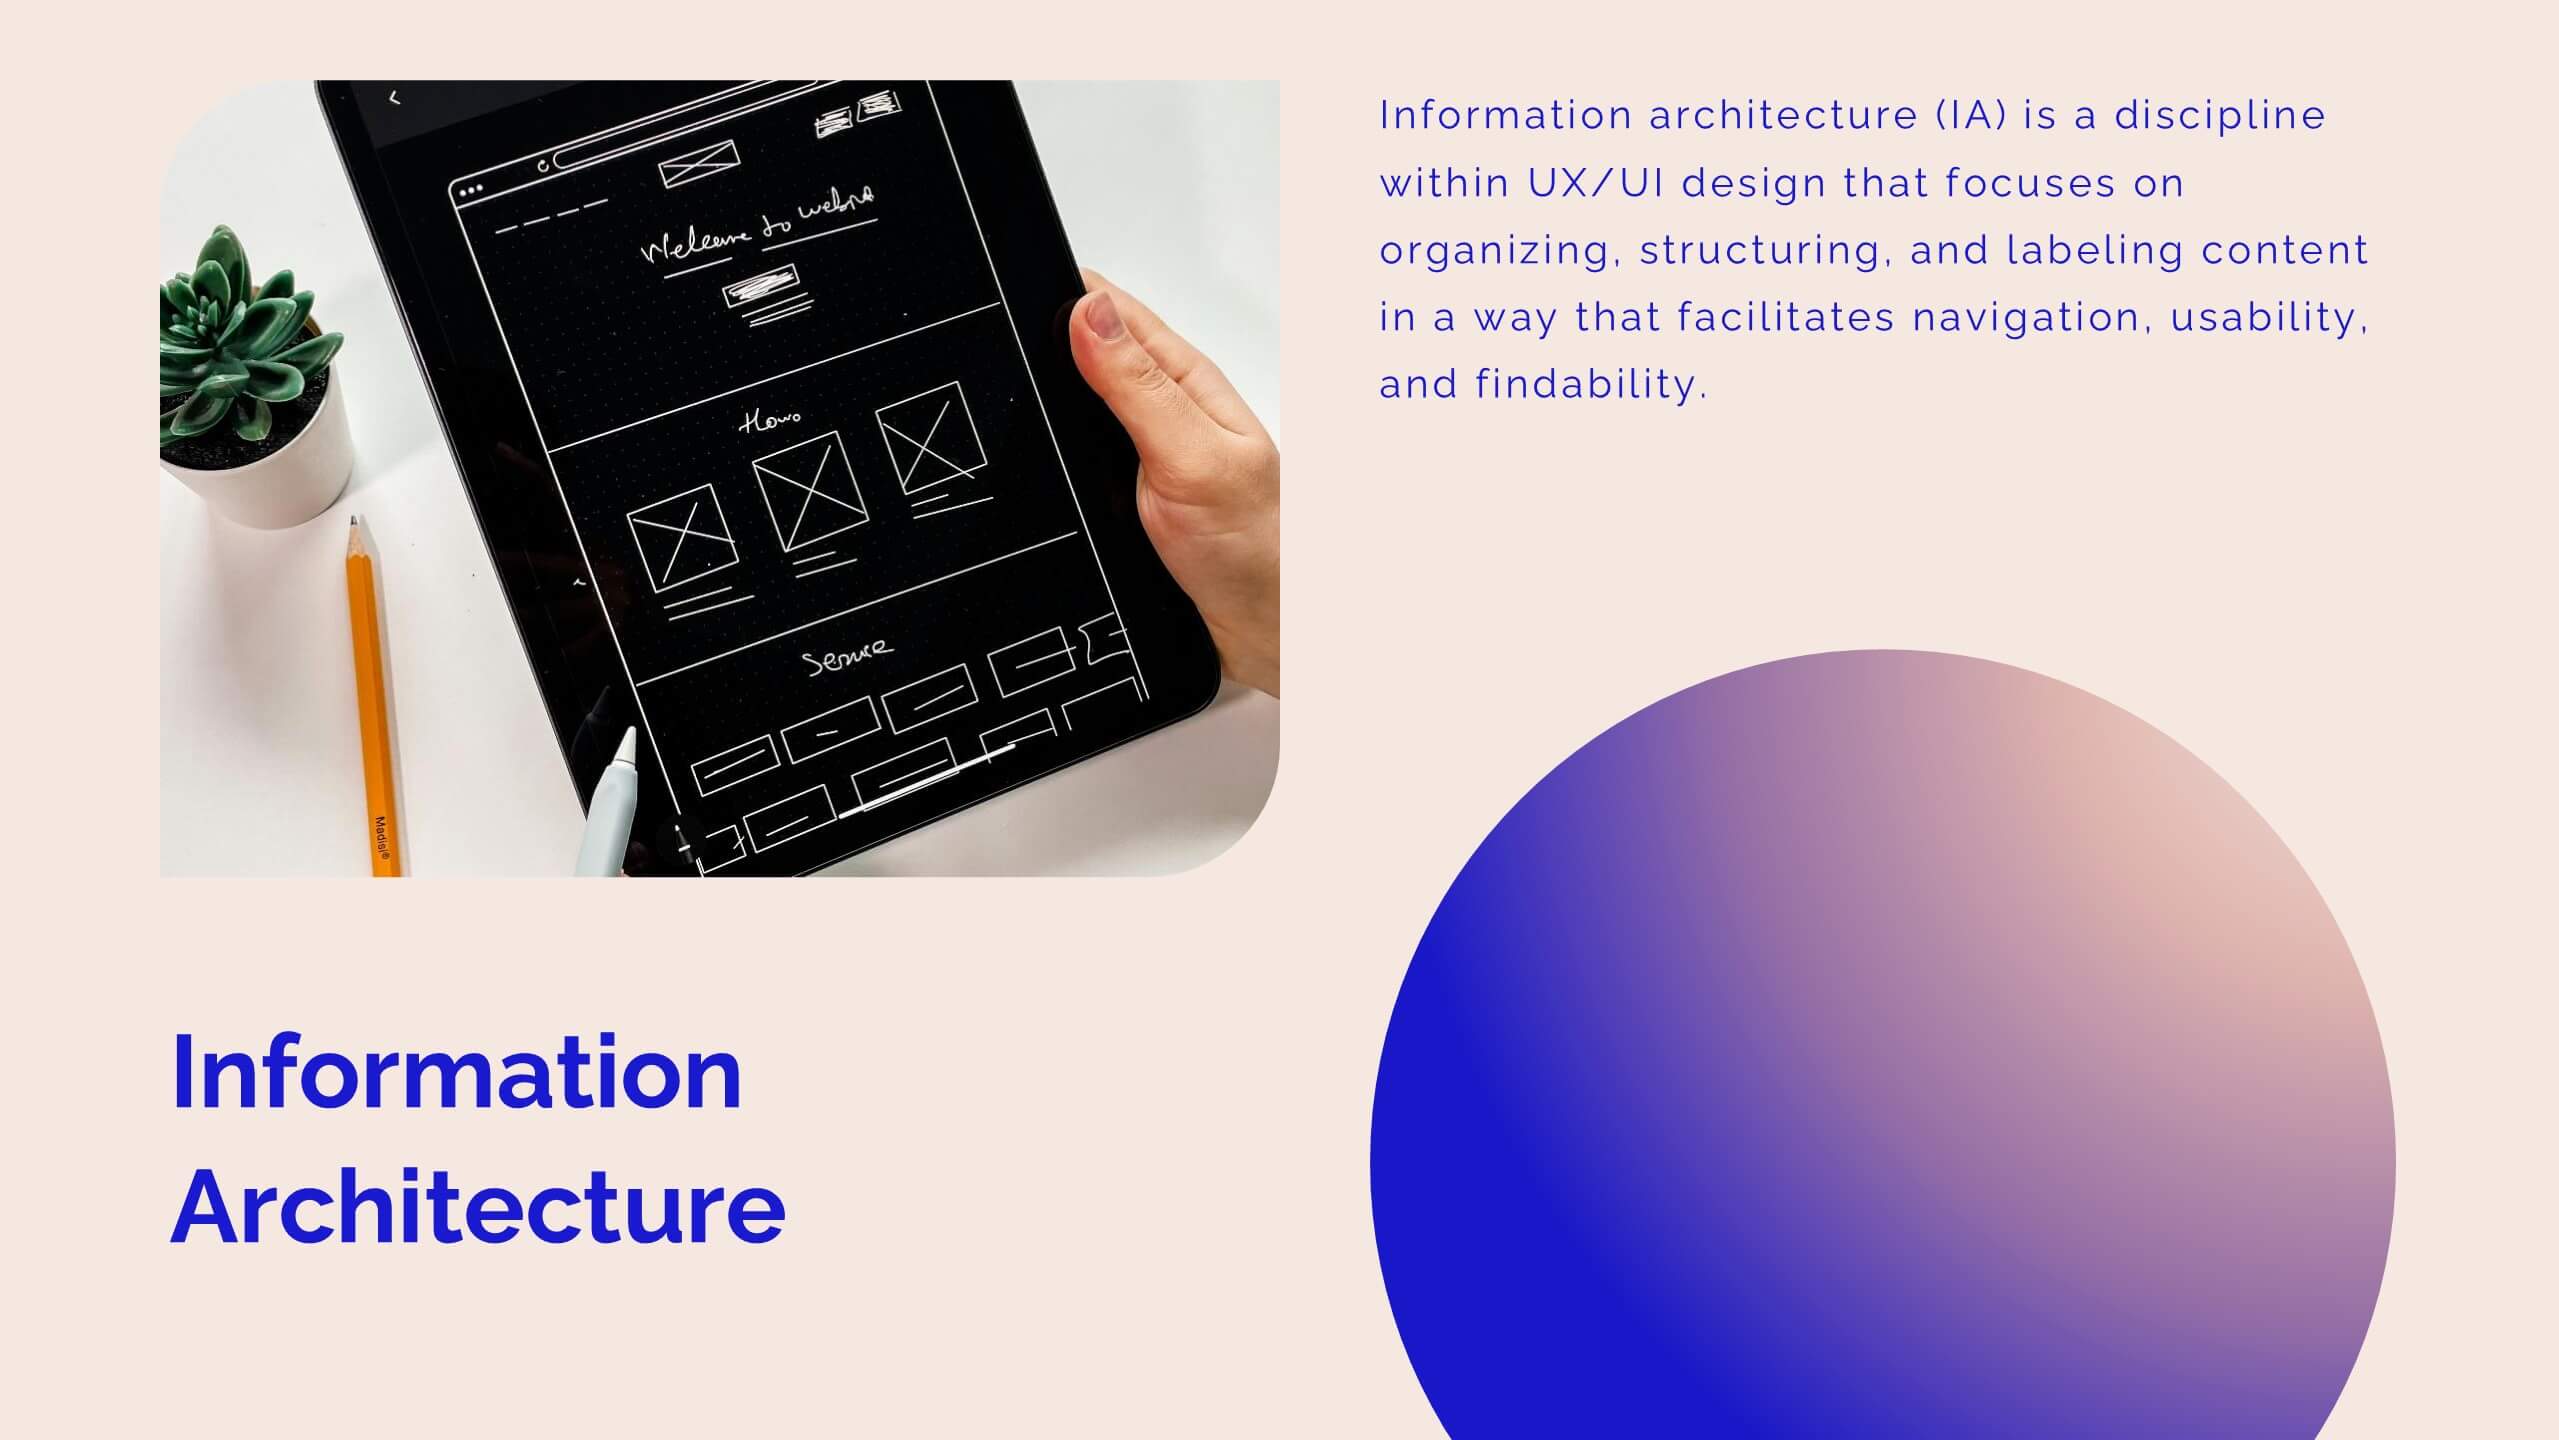
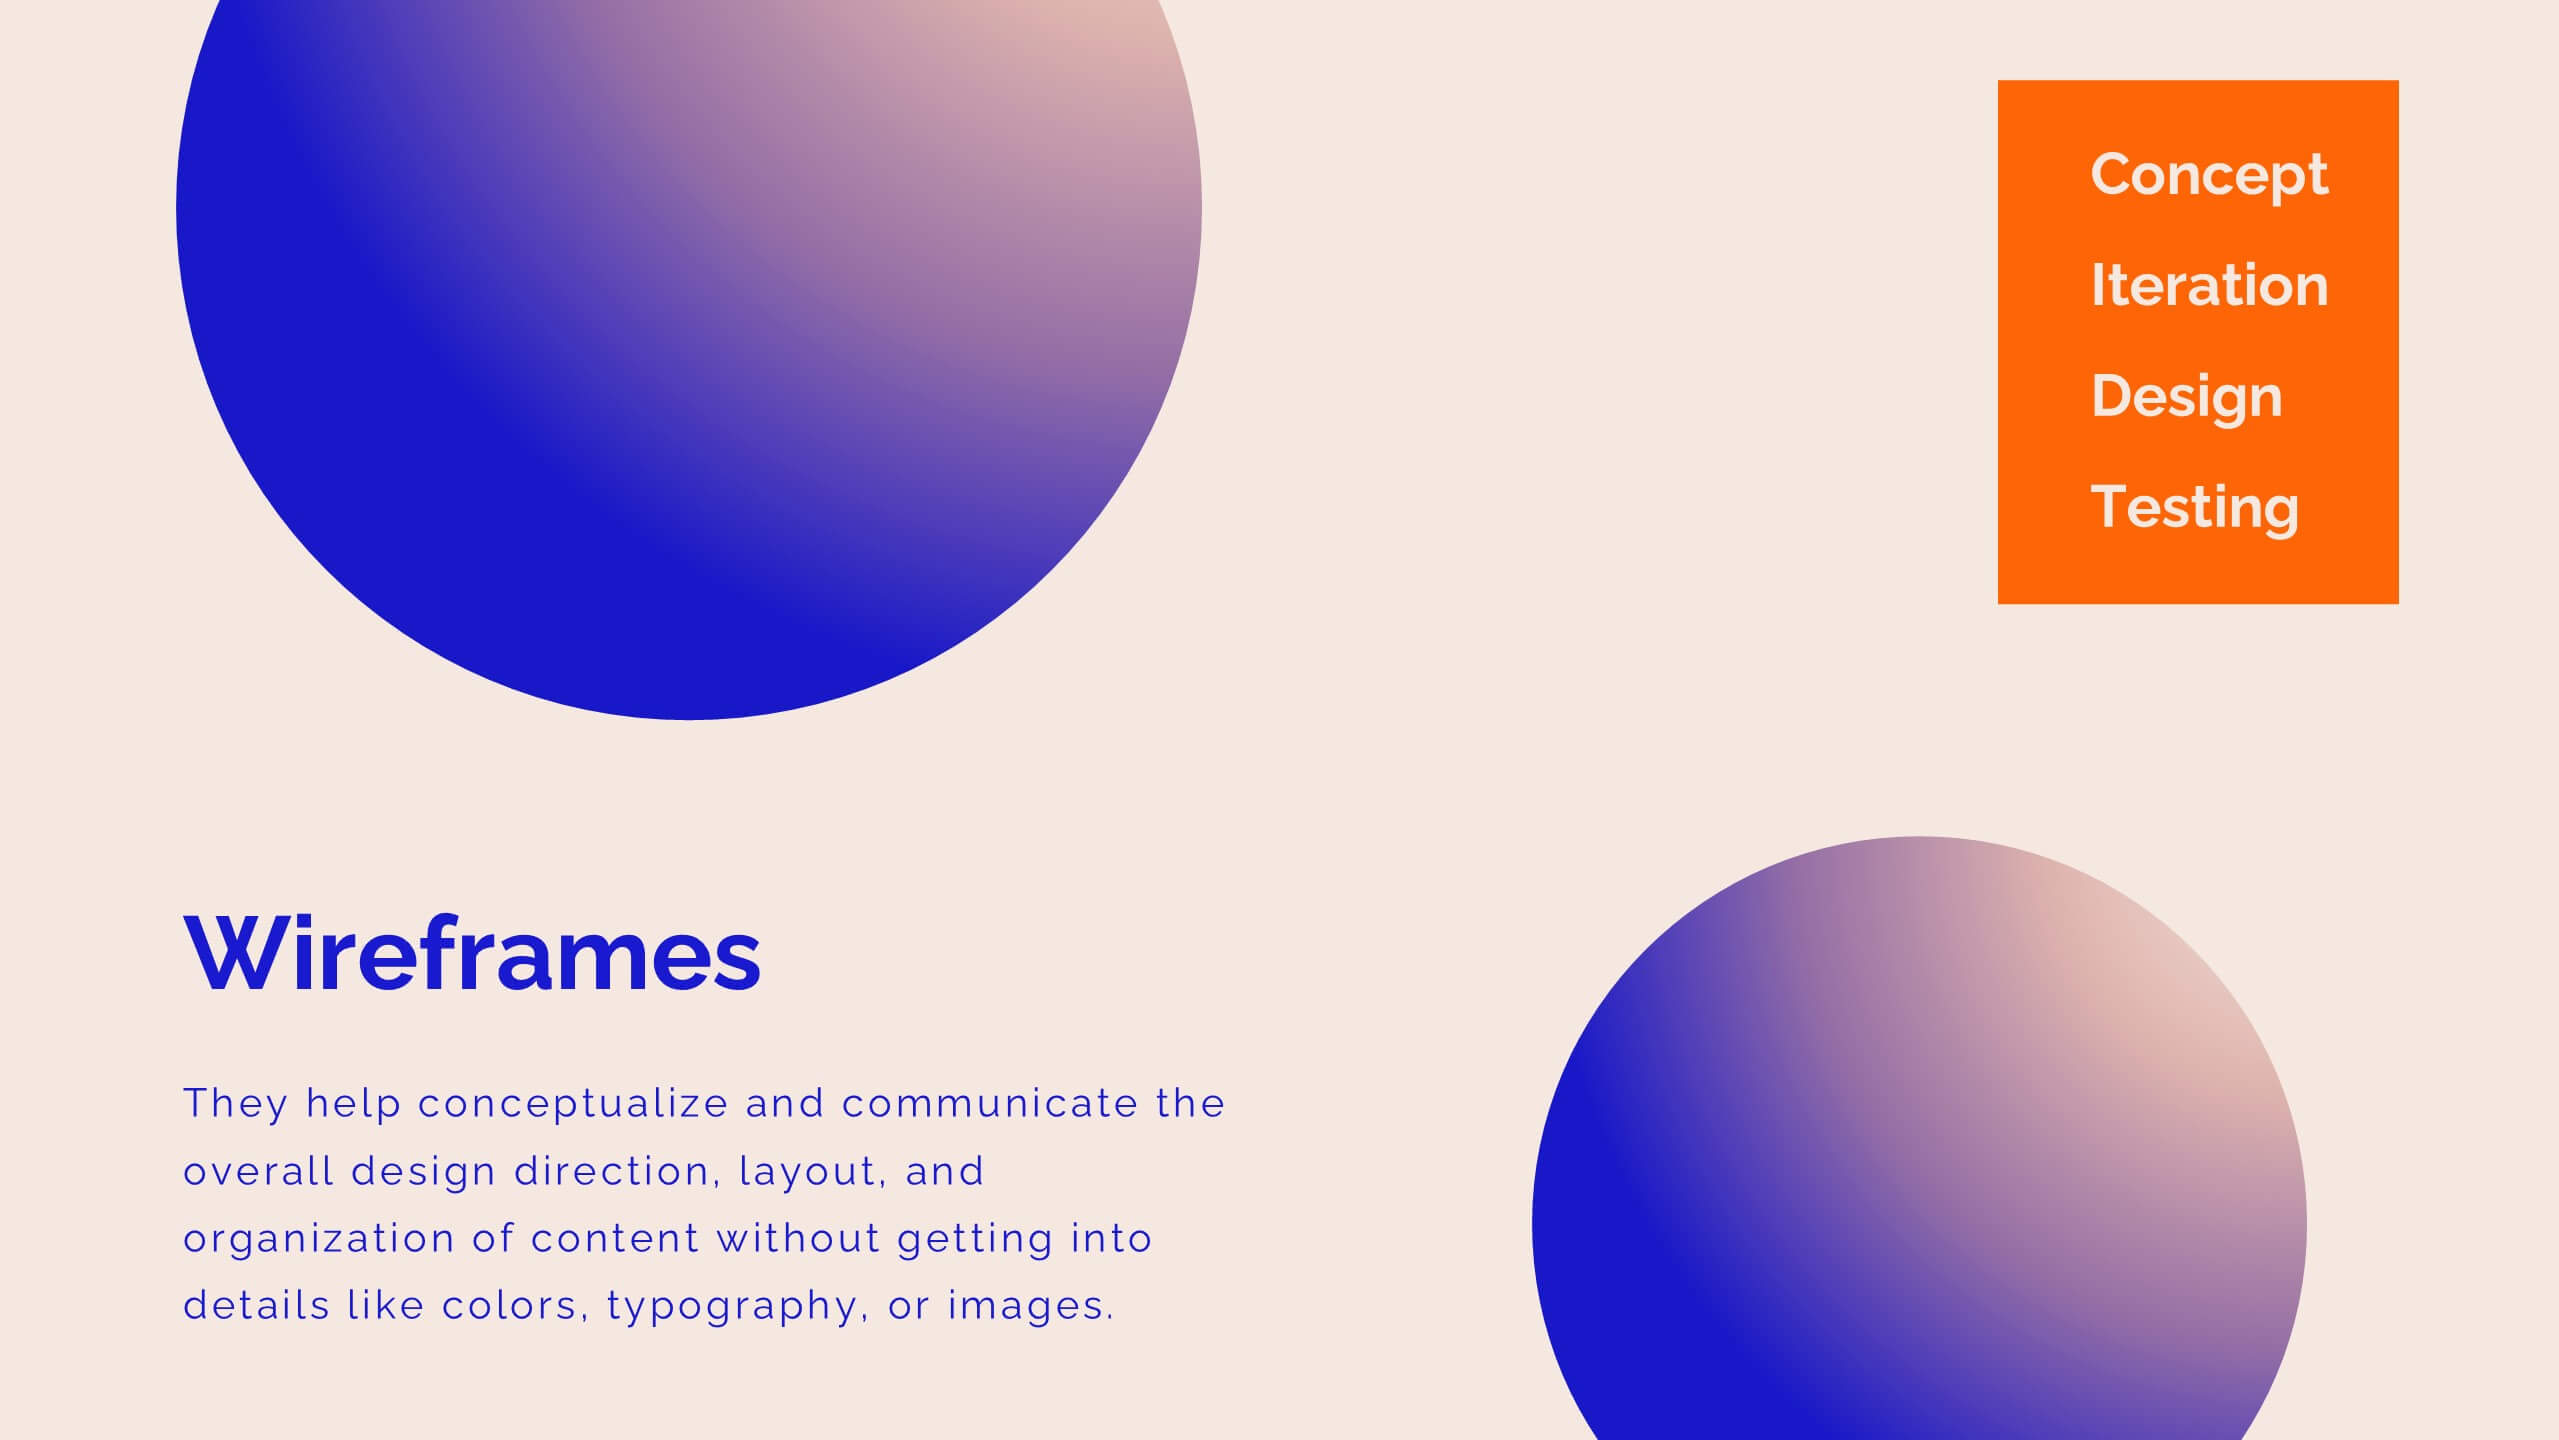
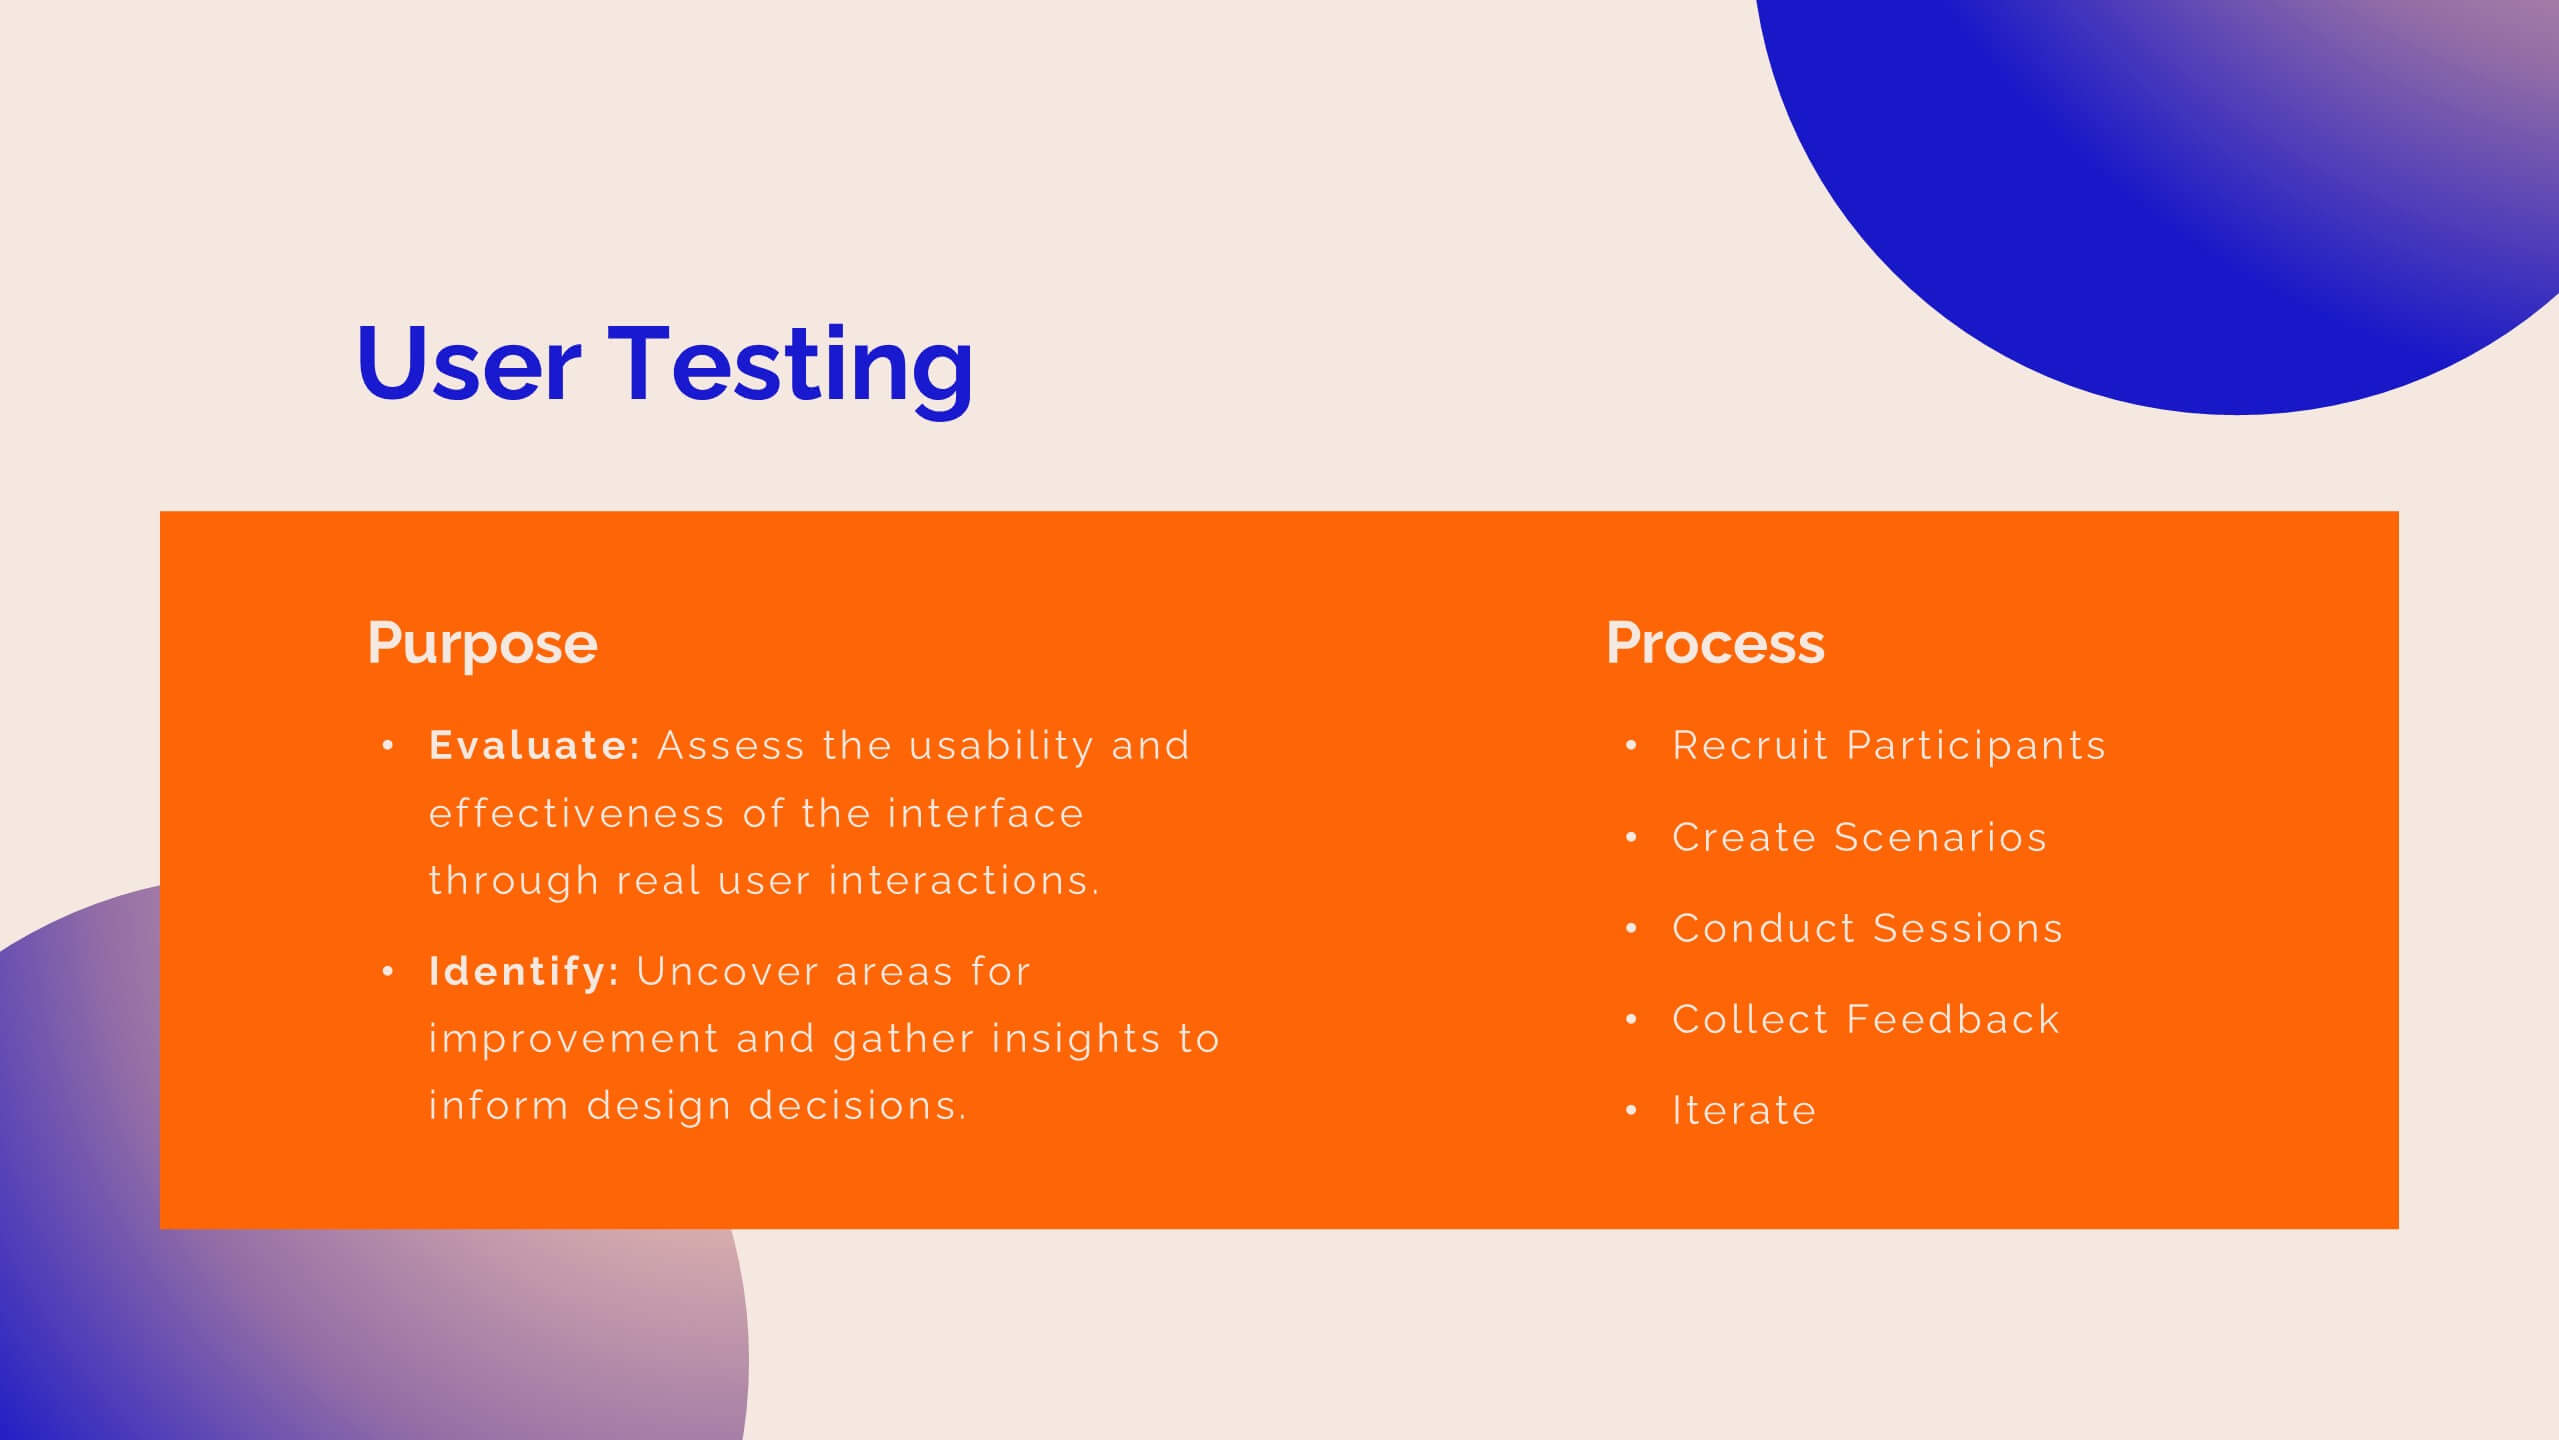
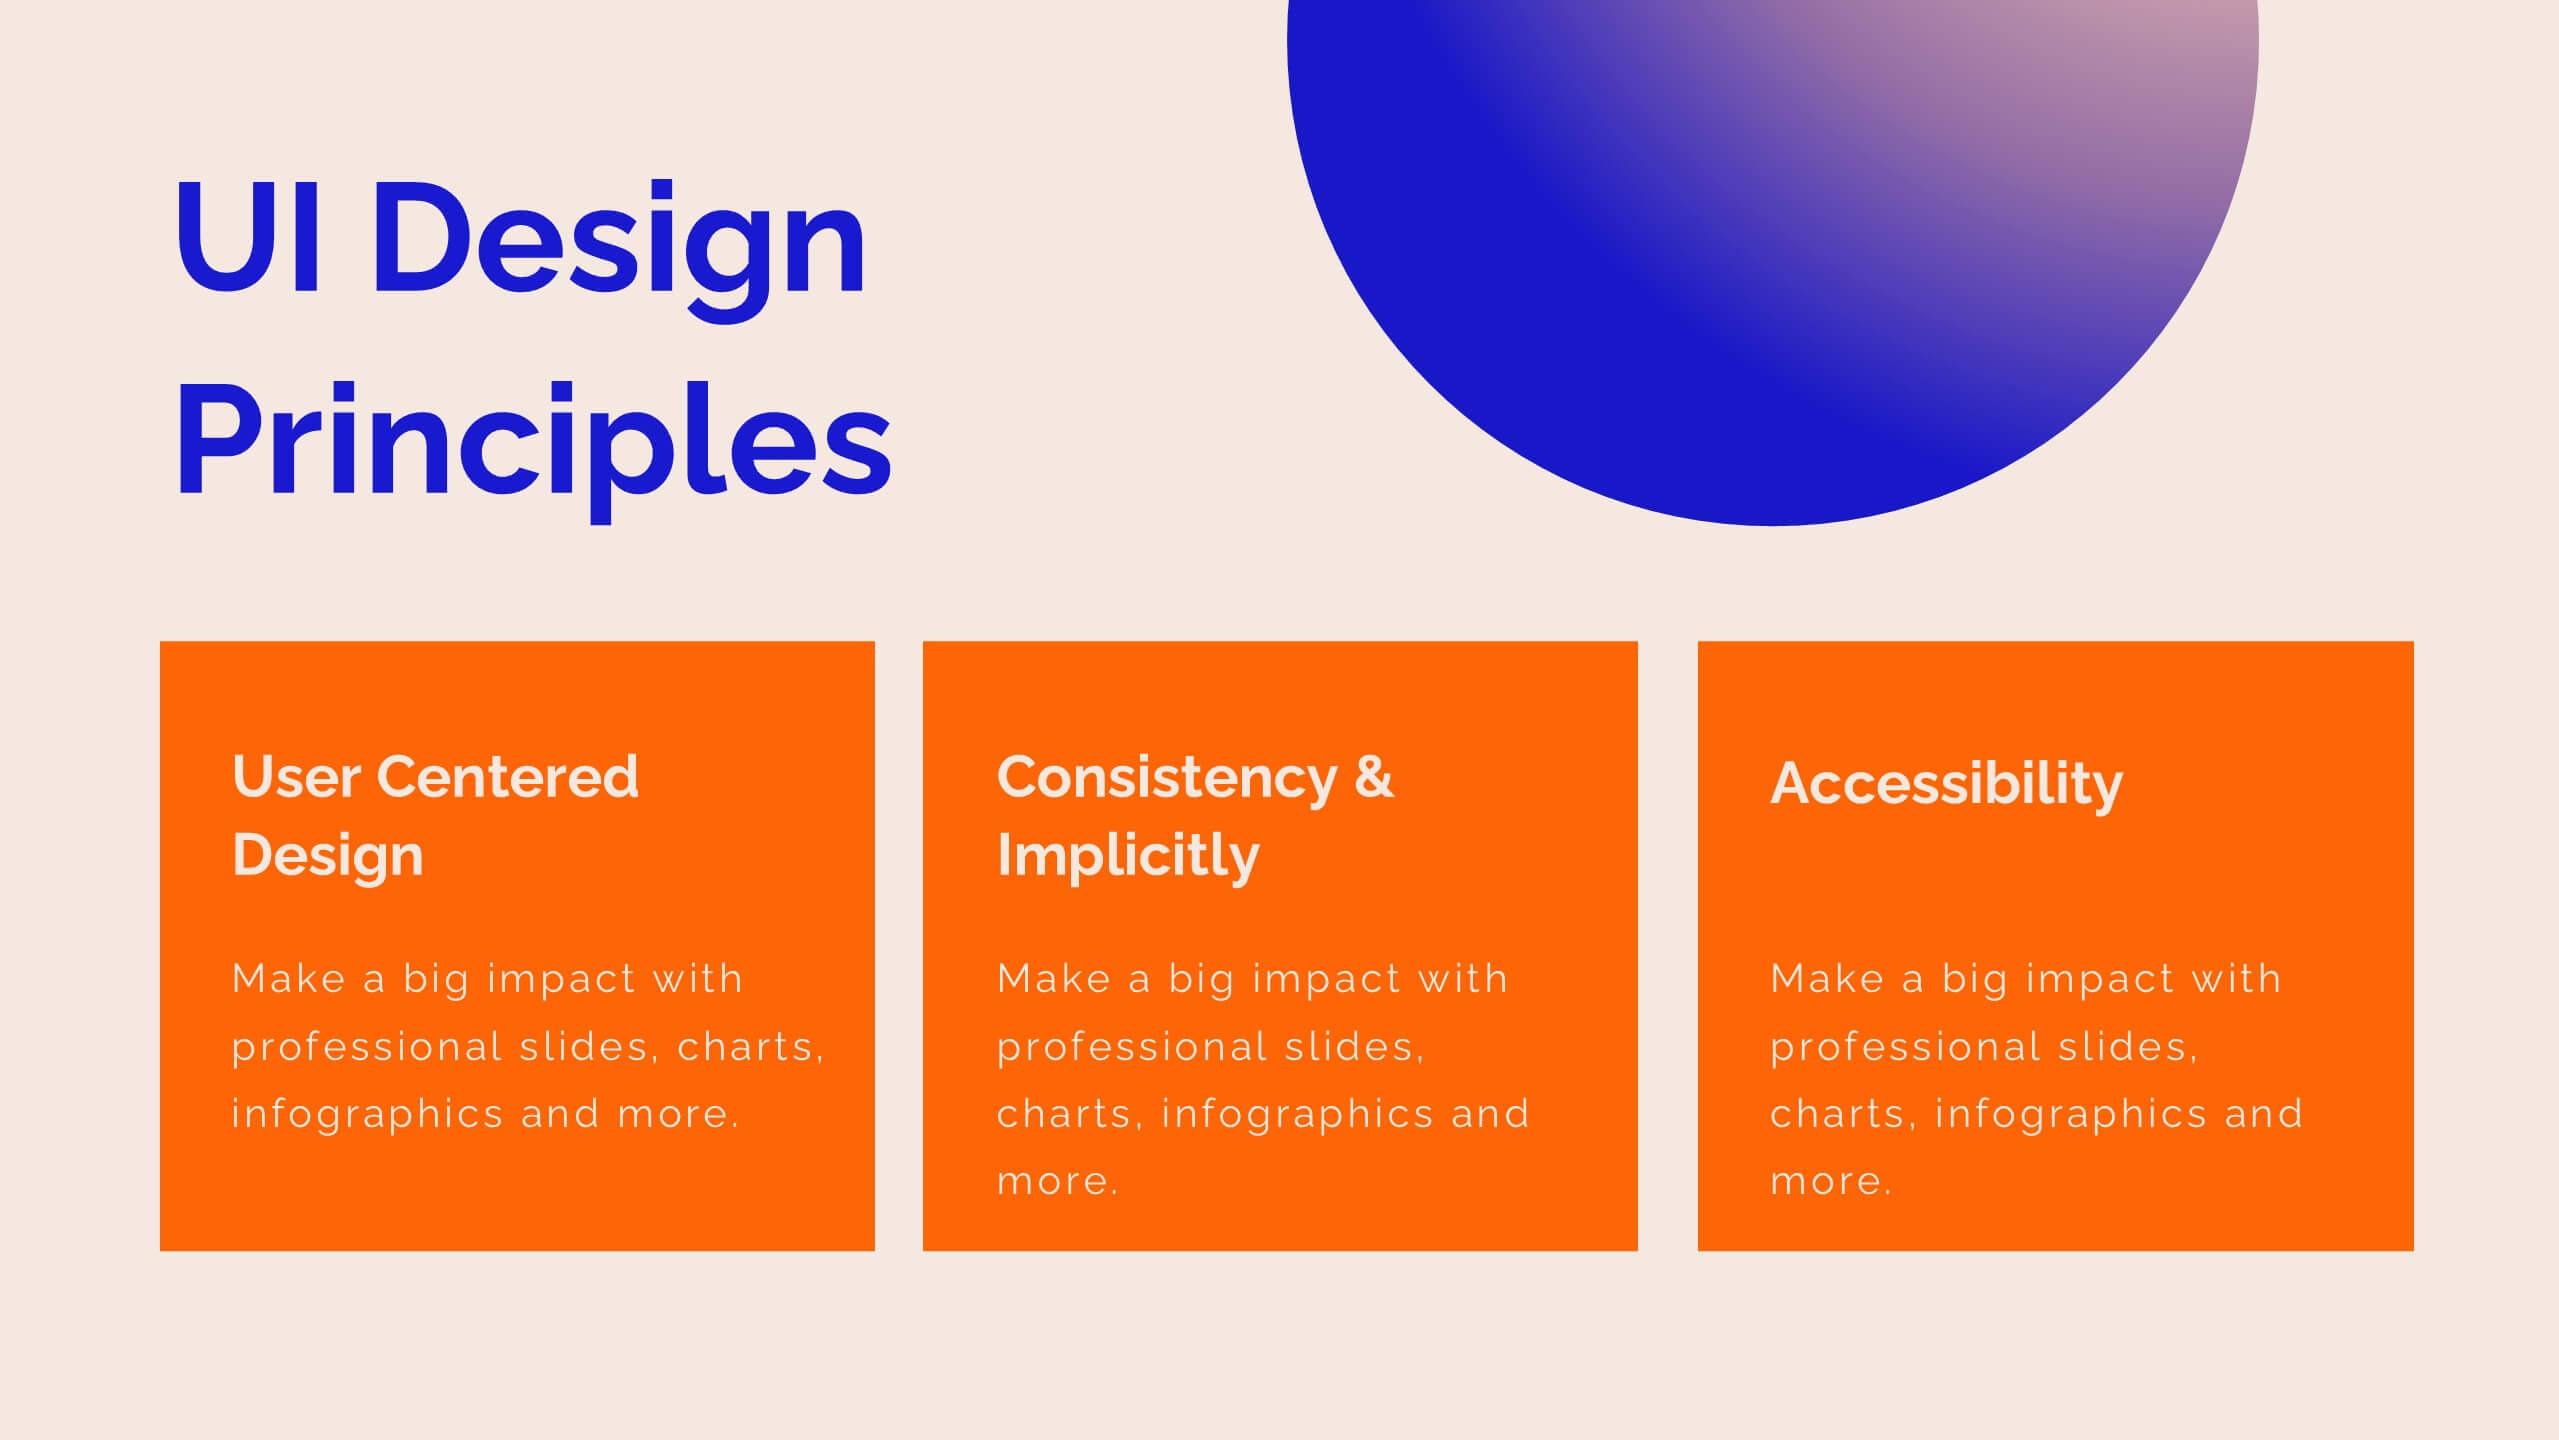
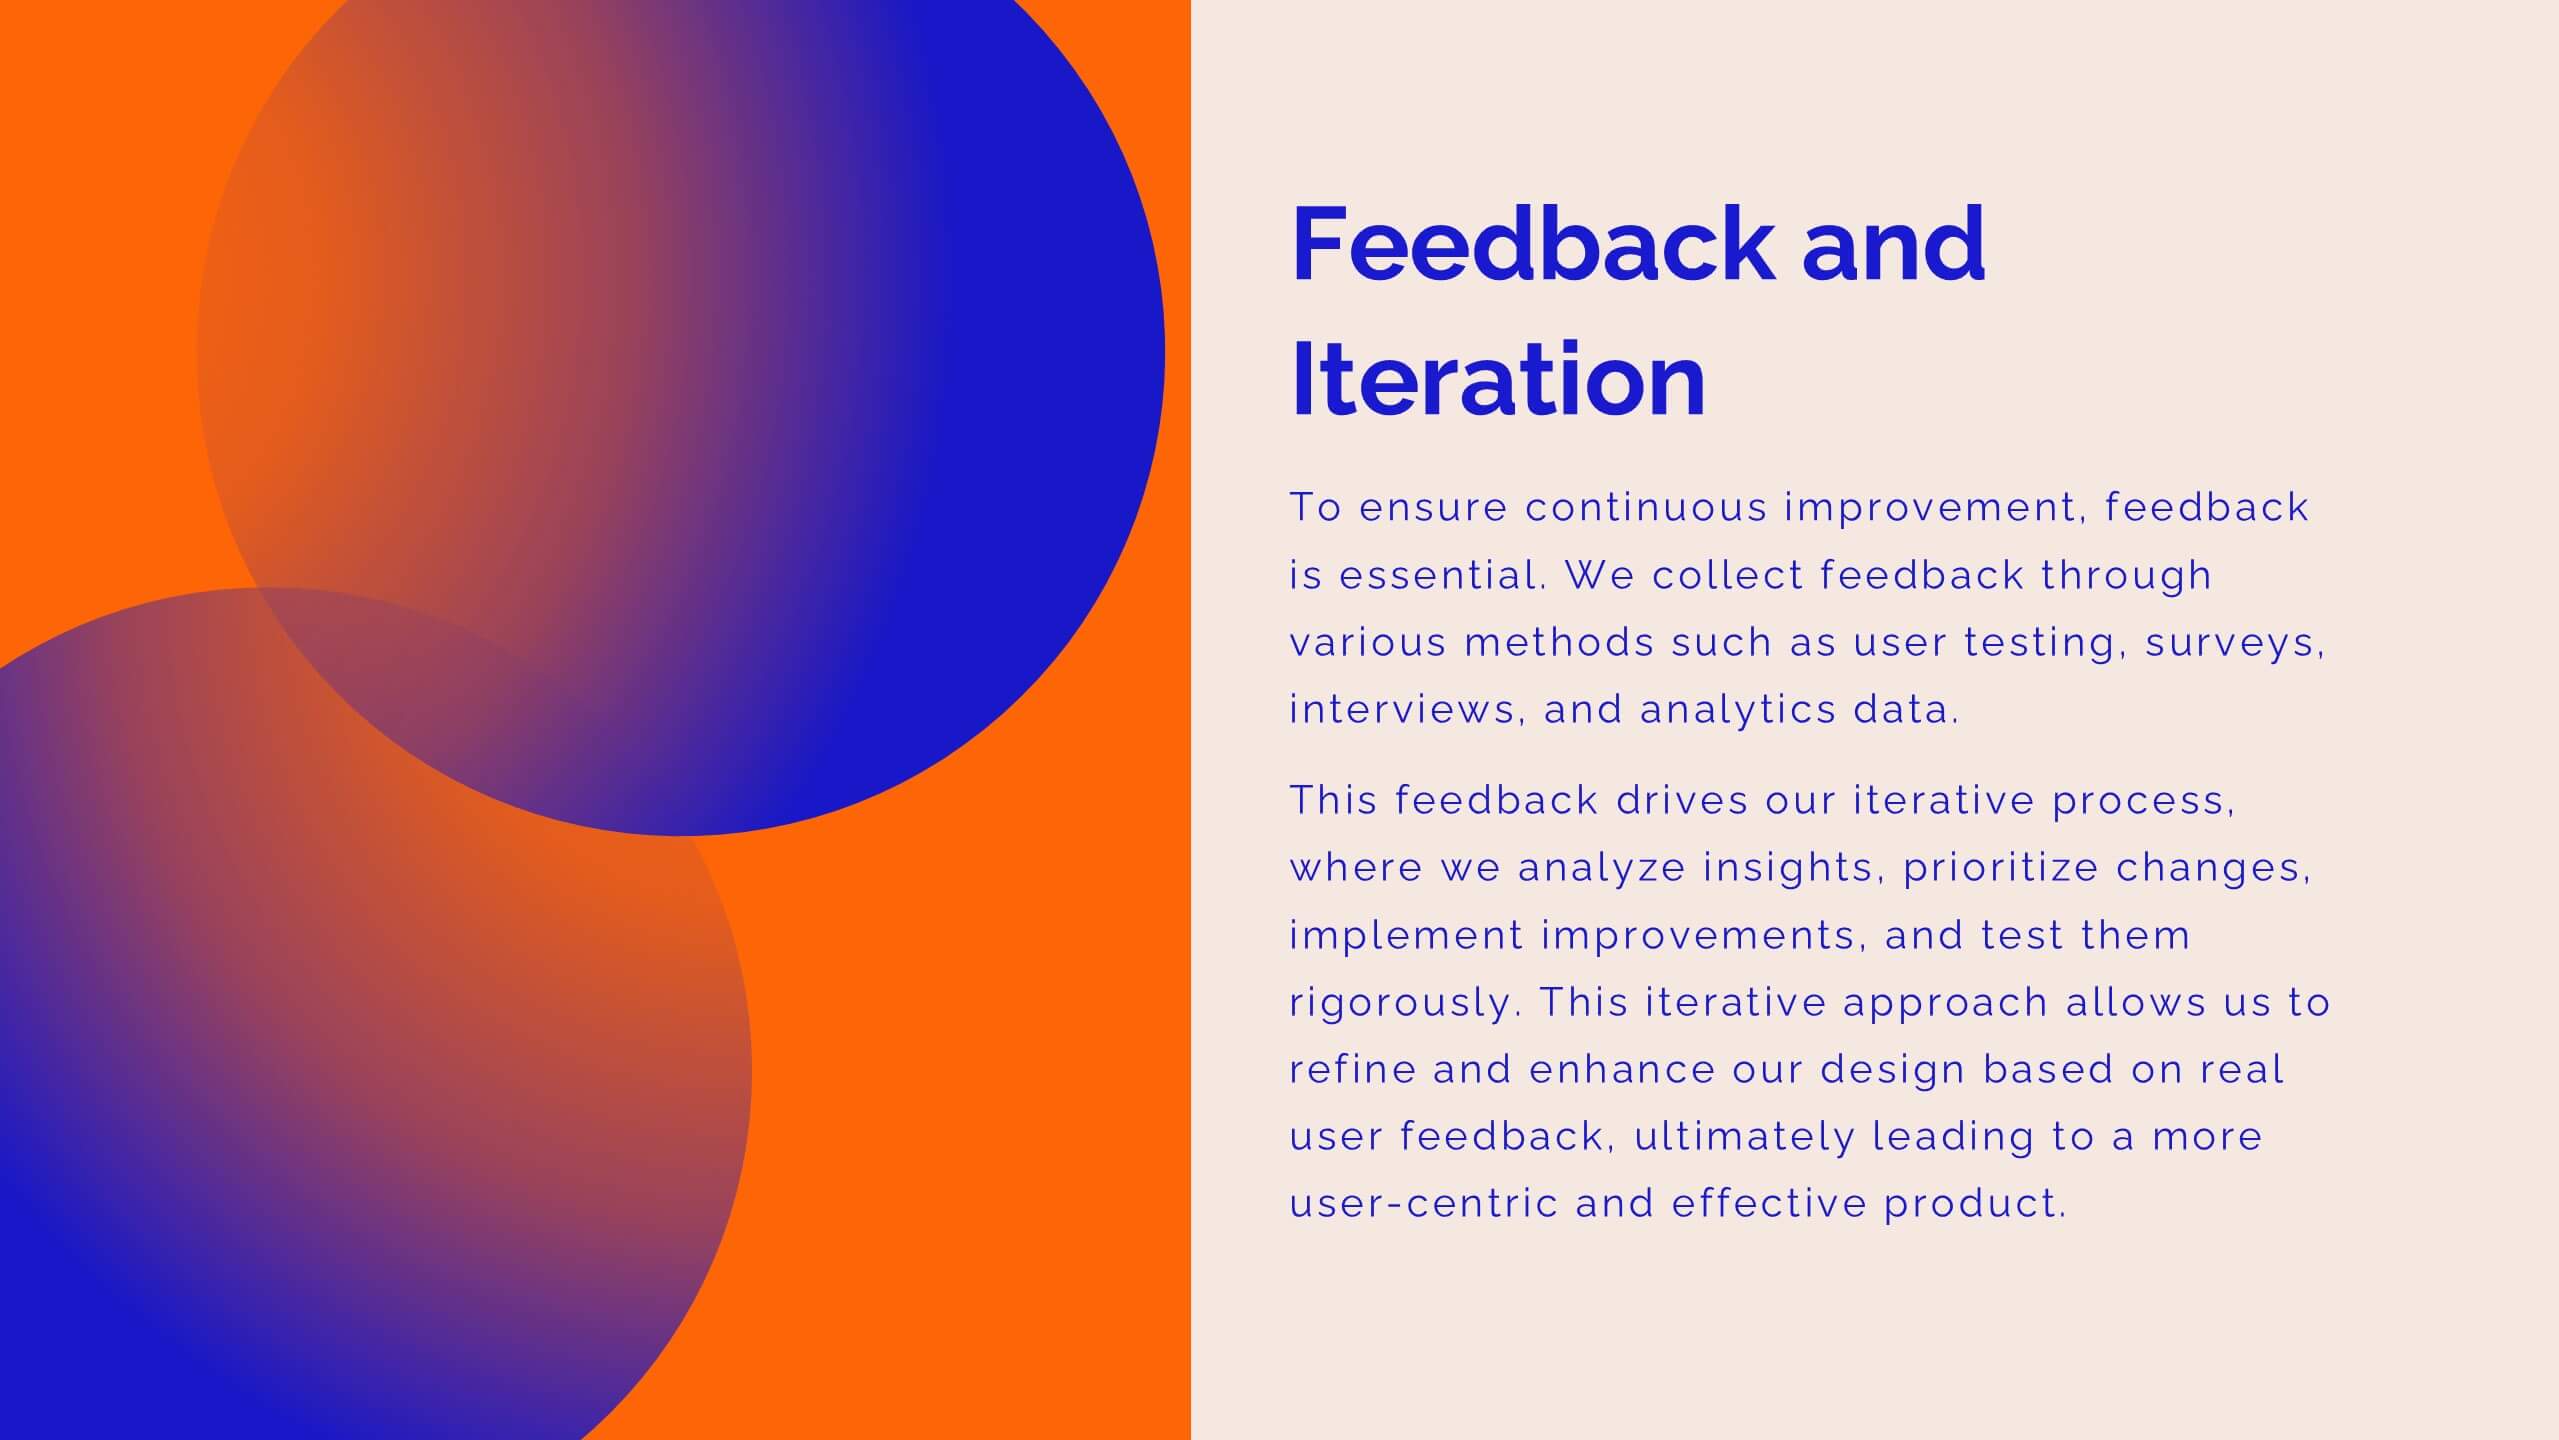
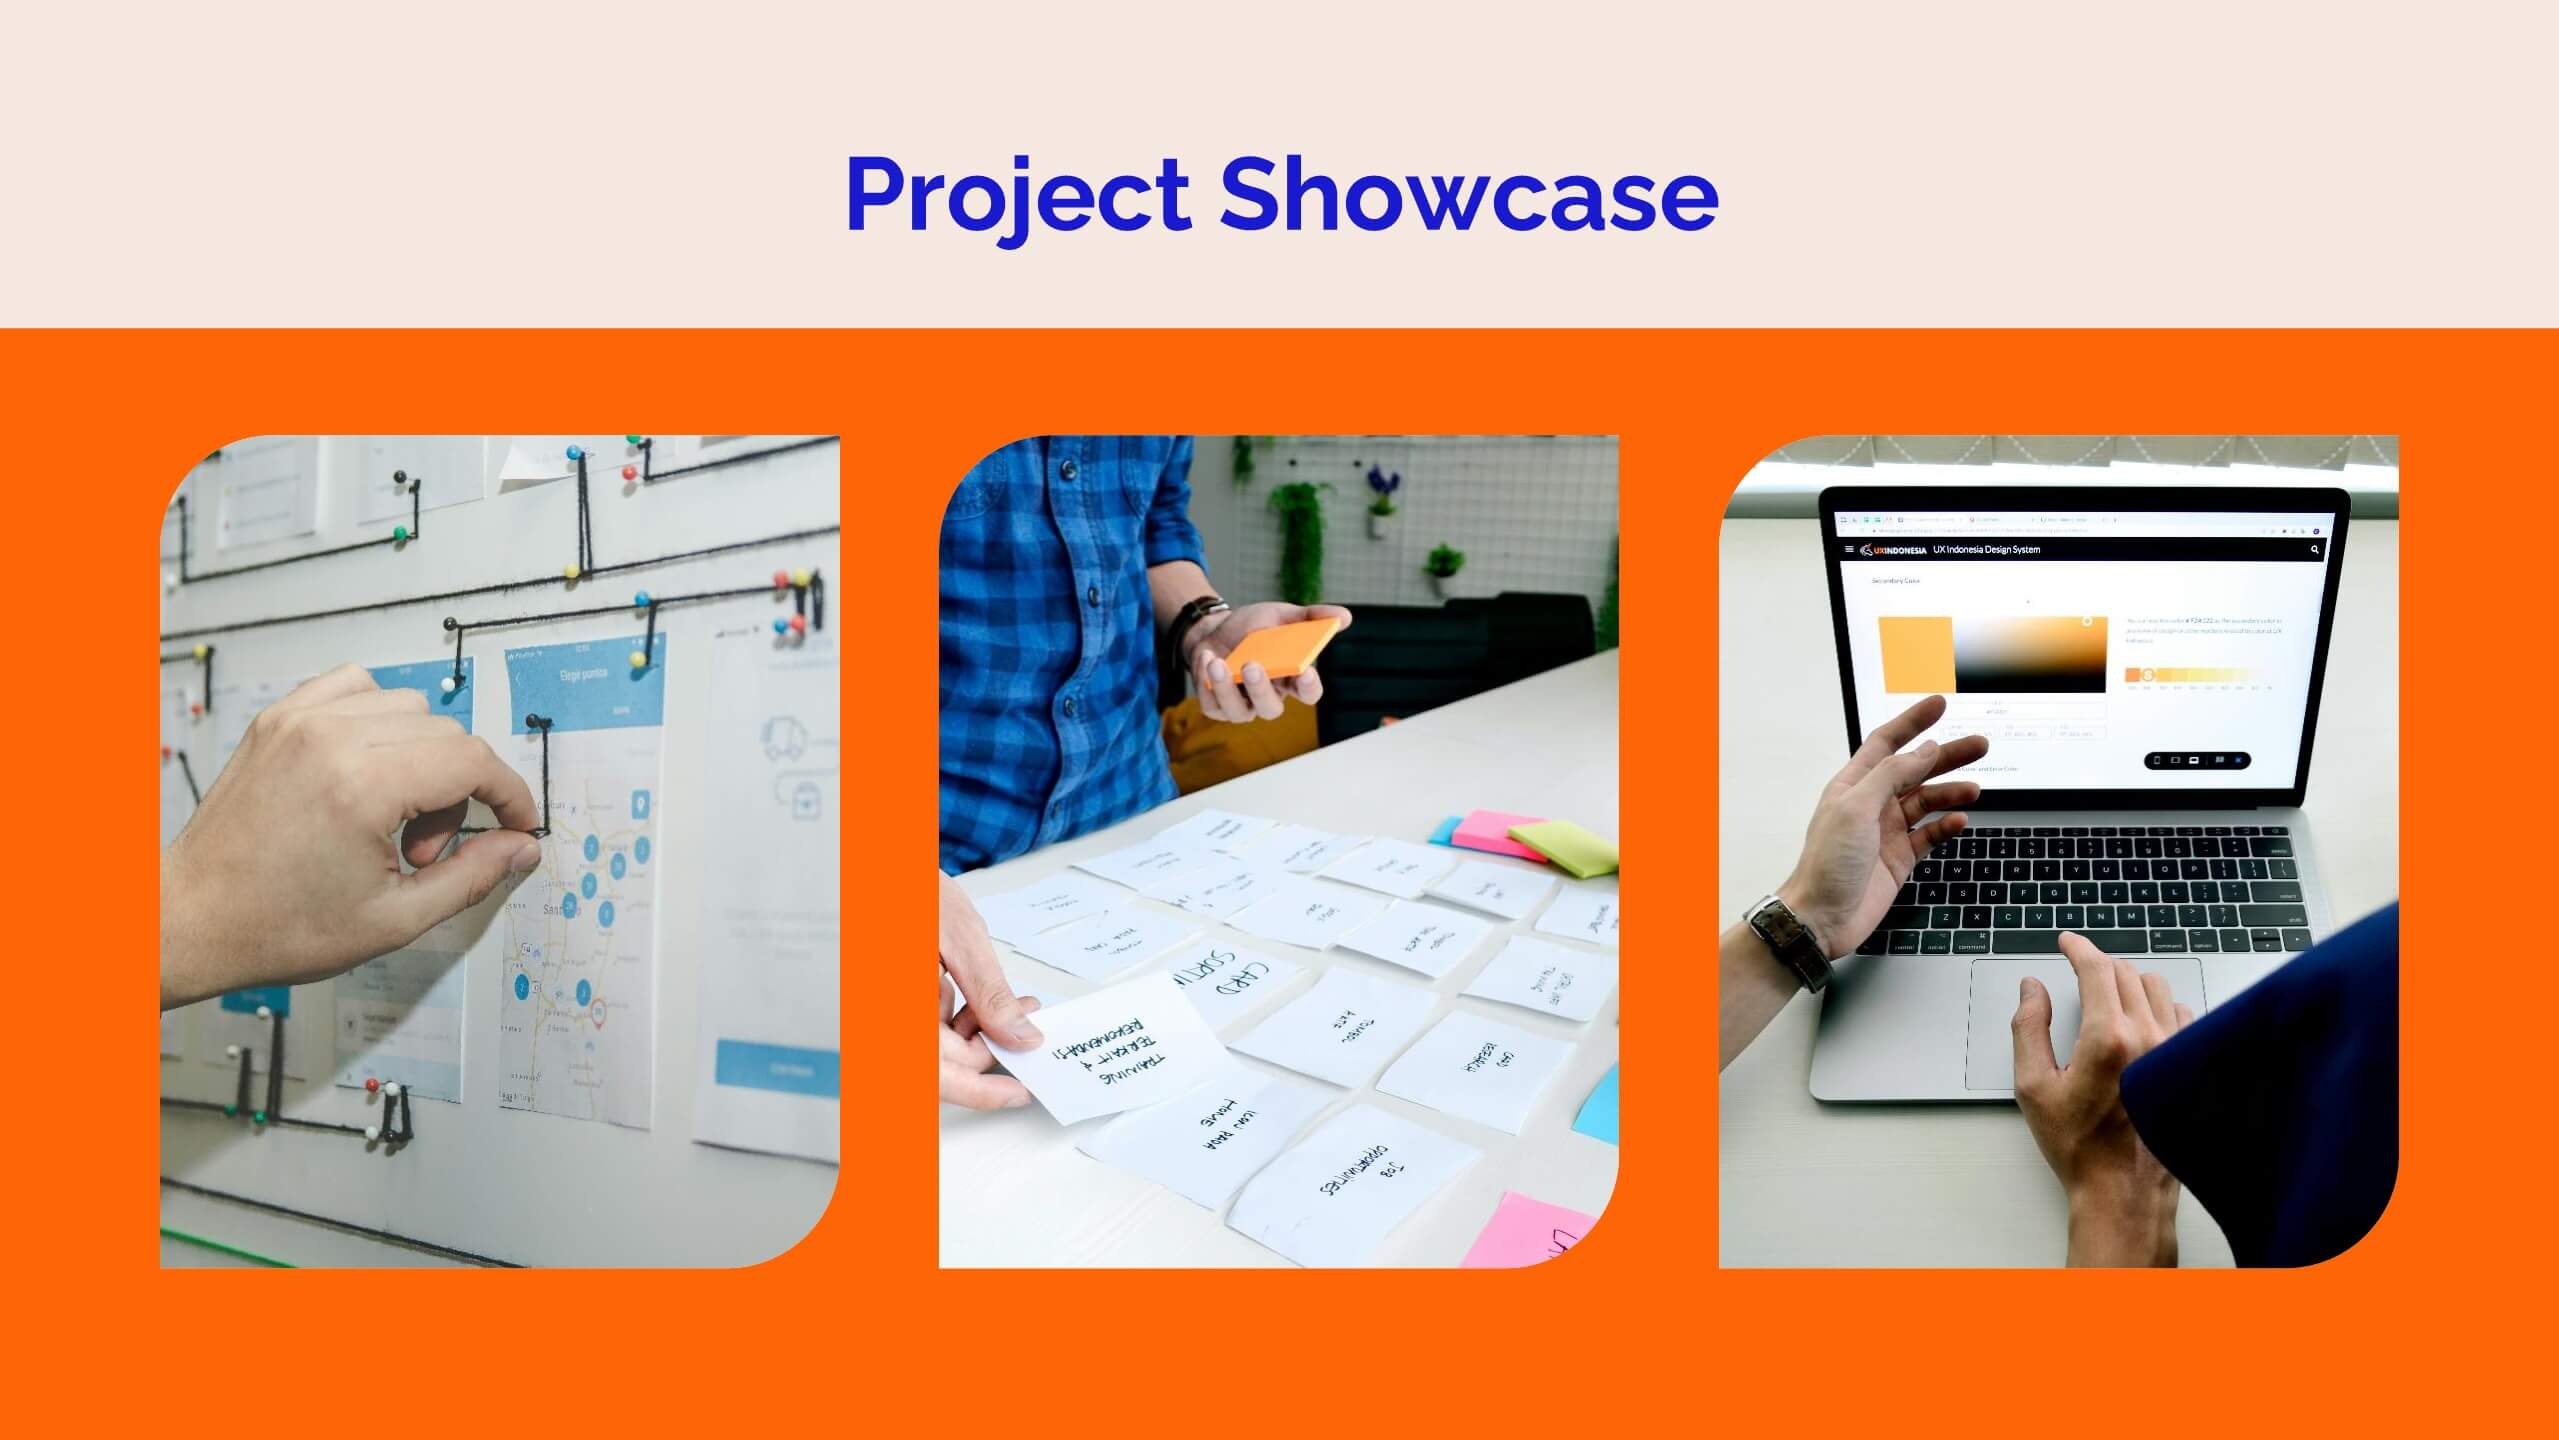
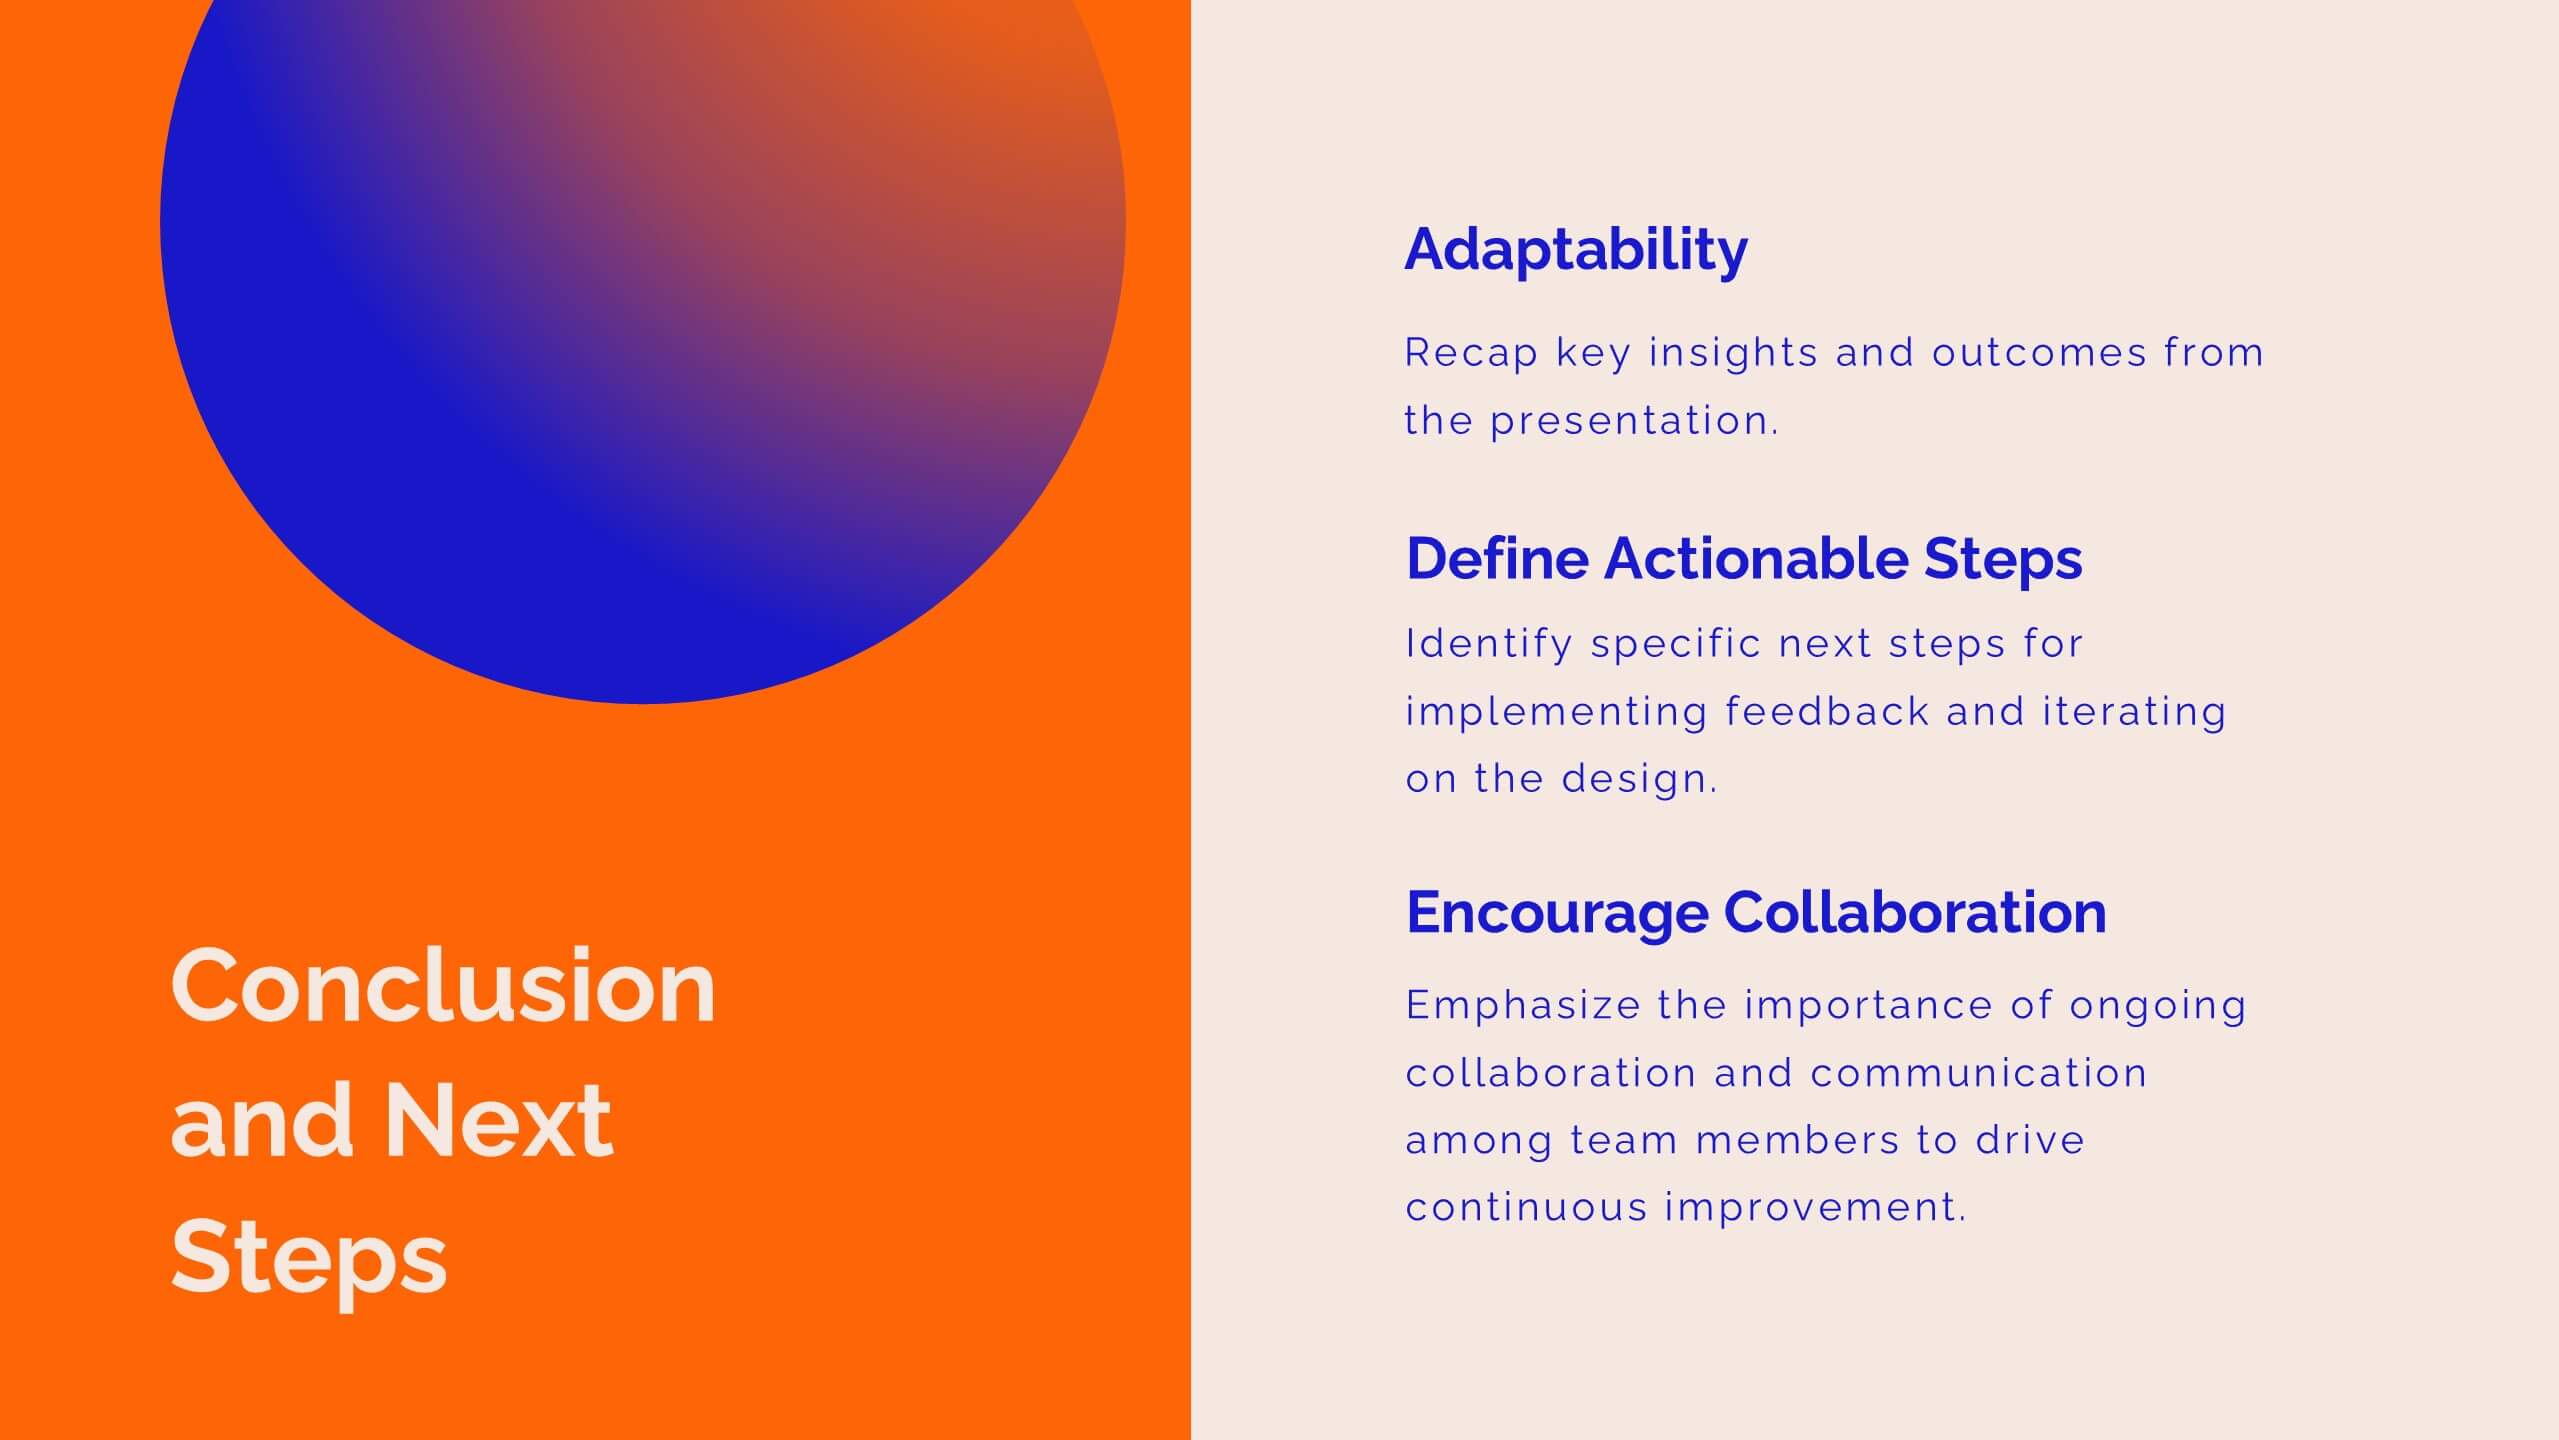
Niobium UX Research Report Presentation
Present your UX research findings with clarity and style using this vibrant UX research report template! It includes sections for user personas, wireframes, user testing, and design principles, making it ideal for sharing research insights. Fully customizable and compatible with PowerPoint, Keynote, and Google Slides, it's perfect for UX professionals and design teams.


7 diapositivas
Risk Management Plan Infographics
This Risk Management Plan infographic template is a comprehensive tool for identifying and assessing potential risks in projects or business operations. Compatible with PowerPoint, Google Slides, and Keynote, it features a range of visual aids including risk matrices, probability scales, and impact graphs. Each slide is tailored to categorize risks by severity, from low to high, and includes customizable fields for detailed risk descriptions and mitigation strategies. The color-coding aids in quick recognition of risk levels, and the straightforward design ensures clarity in communication. Ideal for project managers and business strategists, this template streamlines the process of risk analysis and planning in any professional presentation.


7 diapositivas
Real Estate Housing Market Infographic
Real estate is an important asset class that plays a vital role in the economy and society. This real estate template is perfect for presenting your local housing market statistics to potential homeowners, buyers and renters. Use these charts and tables to show trends in sales prices, gross produce, average household income over time and so much more. This presentation contains 7 slides of the housing market. It is fully customizable with many photo layouts to choose from and all professional charts are included in the file. This template can be used with Powerpoint, keynote or Google Slides.


7 diapositivas
IT Architecture Infographics Presentation Template
Our IT Architecture Infographic template is designed to help you create a quick, easy and simple-to-understand presentation that explains your IT Architecture. This template will provide you with material to set out your ideas and give an overview of what’s important so that you can rapidly make progress in this area. This is a perfect choice to impress your clients, teachers, students, or employees. This presentation creates an extravagant feeling that will invite investors and clients to become invested in your project. This template is well-organized and perfect for your next presentation!


5 diapositivas
Oil Industry Trends Infographics
The oil industry, also known as the petroleum industry, is a crucial sector of the global economy that involves exploration, production, refining, and distribution of petroleum products. These infographic templates are designed to showcase key trends and insights in the oil industry. They aims to present complex information in a clear and visually appealing manner, making it easy for your viewers to grasp important concepts and trends in the industry. This is perfect for anyone interested in understanding the trends and dynamics shaping the oil industry. Compatible with Powerpoint, Keynote, and Google Slides.


21 diapositivas
Quaver Annual Report Presentation
Deliver impactful annual reports with this professional presentation template, designed to showcase your company's progress and achievements with precision and clarity. This template is ideal for presenting financial summaries, performance metrics, strategic goals, and operational updates. The layout includes customizable slides for key highlights, risk assessments, project progress, and customer feedback summaries. Infographic elements and visual aids ensure complex data is easily understood, while dedicated sections for challenges, solutions, and recommendations facilitate meaningful discussions. Engage your audience with a clean design and logical structure that reflects professionalism. Compatible with PowerPoint, Google Slides, and Keynote, this template offers full customization to adapt to your branding and specific needs. Whether you're addressing stakeholders, team members, or external audiences, this presentation helps you communicate your accomplishments effectively. Save time and make a lasting impression with a polished and versatile design that aligns with your company’s vision.


6 diapositivas
Circular Business Wheel Model Presentation
Break down your strategy into dynamic segments with this Circular Business Wheel Model. This layout is ideal for showcasing interconnected business areas like sustainability, innovation, monetization, and market appeal. Perfect for strategy decks, business planning, and growth presentations. Compatible with PowerPoint, Keynote, and Google Slides—fully editable for your needs.


24 diapositivas
Brand Overview Presentation
Enhance your brand storytelling with our Brand Presentation template. Perfect for showcasing brand vision, values, and strategies, this template includes diverse slides for audience targeting and brand touchpoints. Suitable for all professional settings, it's compatible with PowerPoint, Keynote, and Google Slides.


7 diapositivas
Company Profile Structure Infographic
This series of templates is meticulously crafted to represent a company’s structure in a detailed and organized manner. Each template varies in design and layout, ensuring that there is a style to suit different business needs and preferences. From straightforward, clean layouts to more dynamic, visually engaging designs, these templates provide an excellent basis for companies to present their organizational structure, core team members, departmental divisions, and key business areas effectively. Key information such as company values, mission statements, and strategic objectives can be clearly highlighted, allowing companies to communicate their business essence and operational ethos to stakeholders. Each template also accommodates data visualization through charts, graphs, and infographics, which are instrumental in depicting growth trajectories, performance metrics, or demographic breakdowns. With customization options, these templates can be tailored to reflect a company's unique brand identity, including color schemes, typography, and corporate logos, making each presentation not only informative but also reflective of the company's image. This collection is ideal for corporate introductions, stakeholder meetings, and internal presentations aimed at fostering a clear understanding of the company’s operational framework and strategic direction.


5 diapositivas
Healthcare Solutions in Modern Medicine Presentation
Present pharmaceutical and medical data with clarity using these modern healthcare infographics. Designed with pill packs, bandages, and capsules, this editable template is ideal for illustrating treatment comparisons, solution options, or patient care data. Perfect for medical professionals, health startups, and researchers using PowerPoint, Keynote, or Google Slides.