


Características


¿Tienes alguna pregunta?
Recomendar


4 diapositivas
Illustrated Office Environment Templates Presentation
Bring your data to life with a fun, illustrated spin! This presentation template uses vibrant office-themed visuals to explain workplace stats, tasks, or organizational breakdowns with clarity. Perfect for showcasing team roles, resource allocation, or workflow insights. Fully compatible with PowerPoint, Keynote, and Google Slides for seamless customization.

21 diapositivas
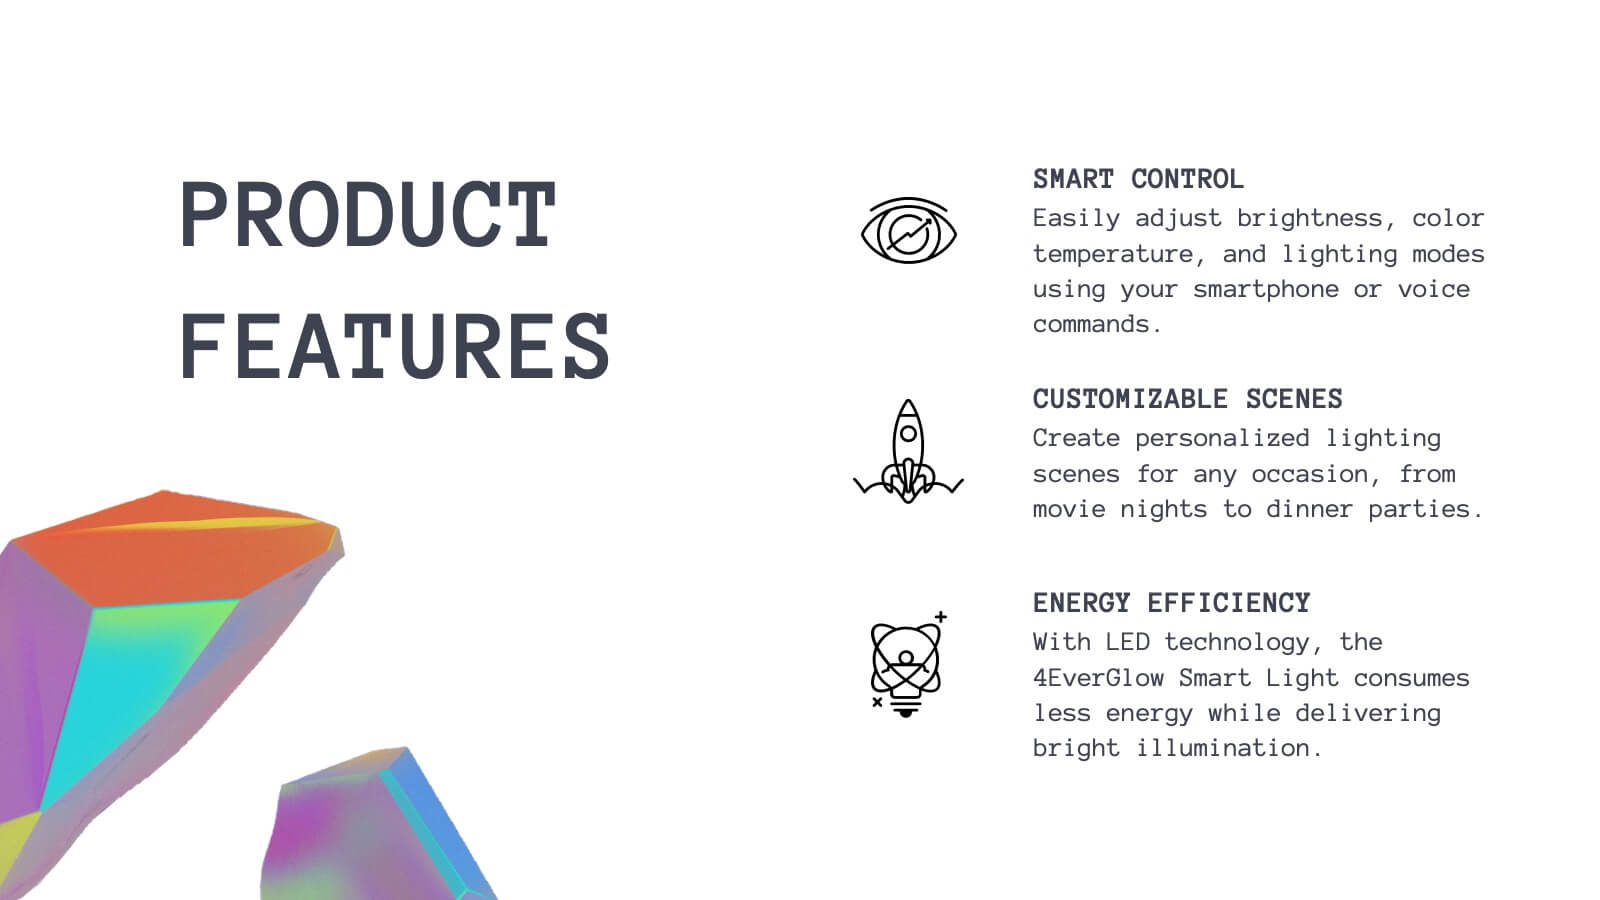
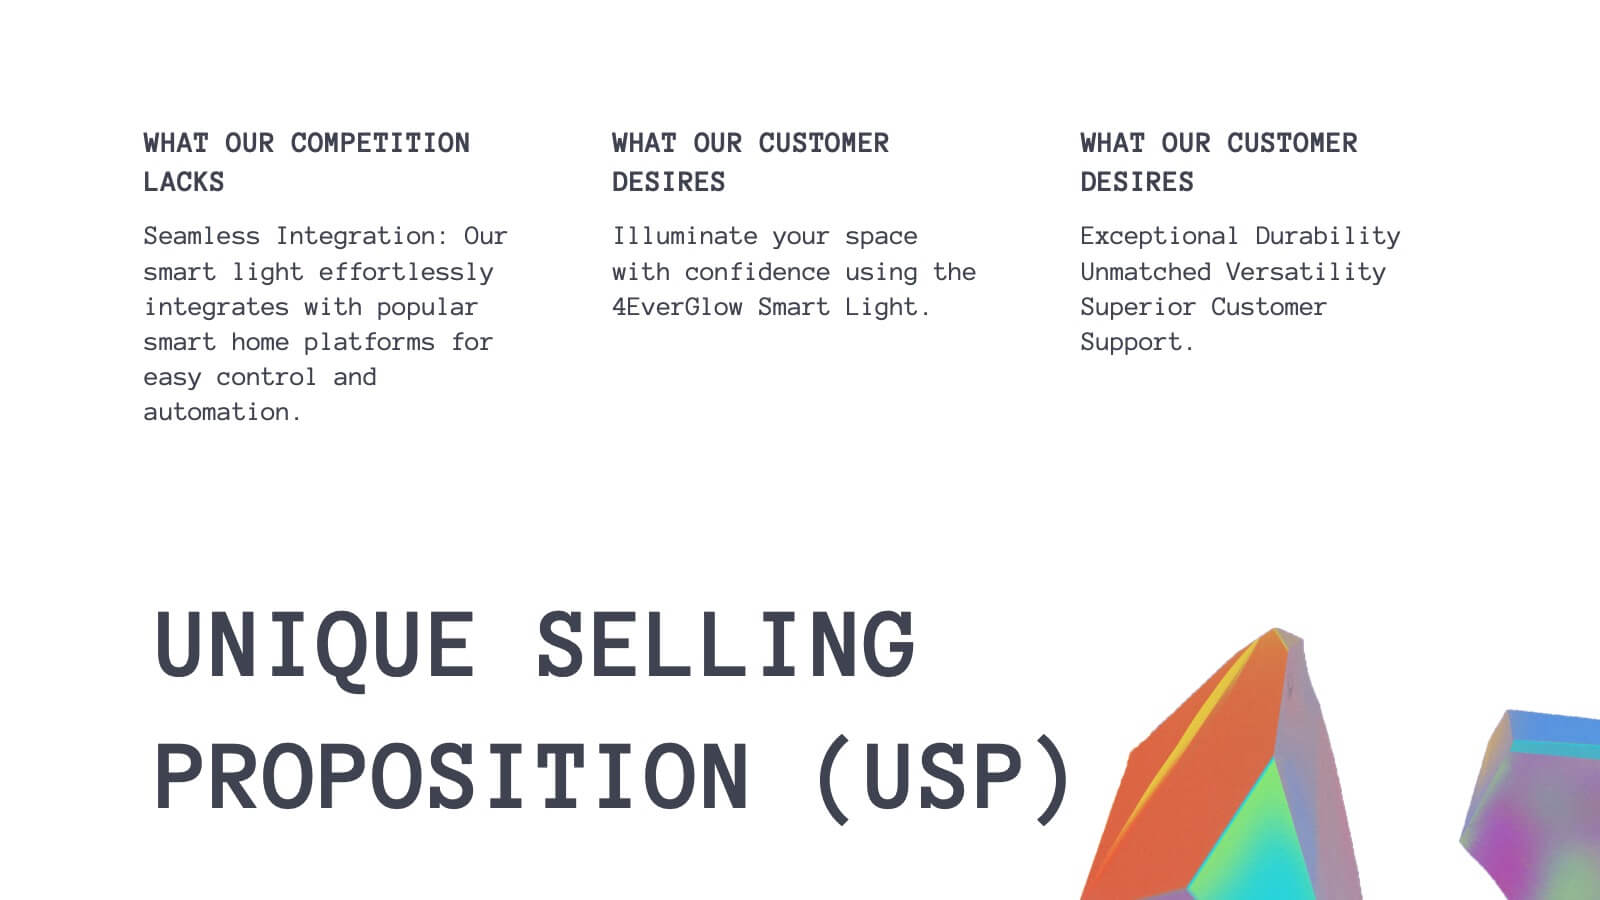
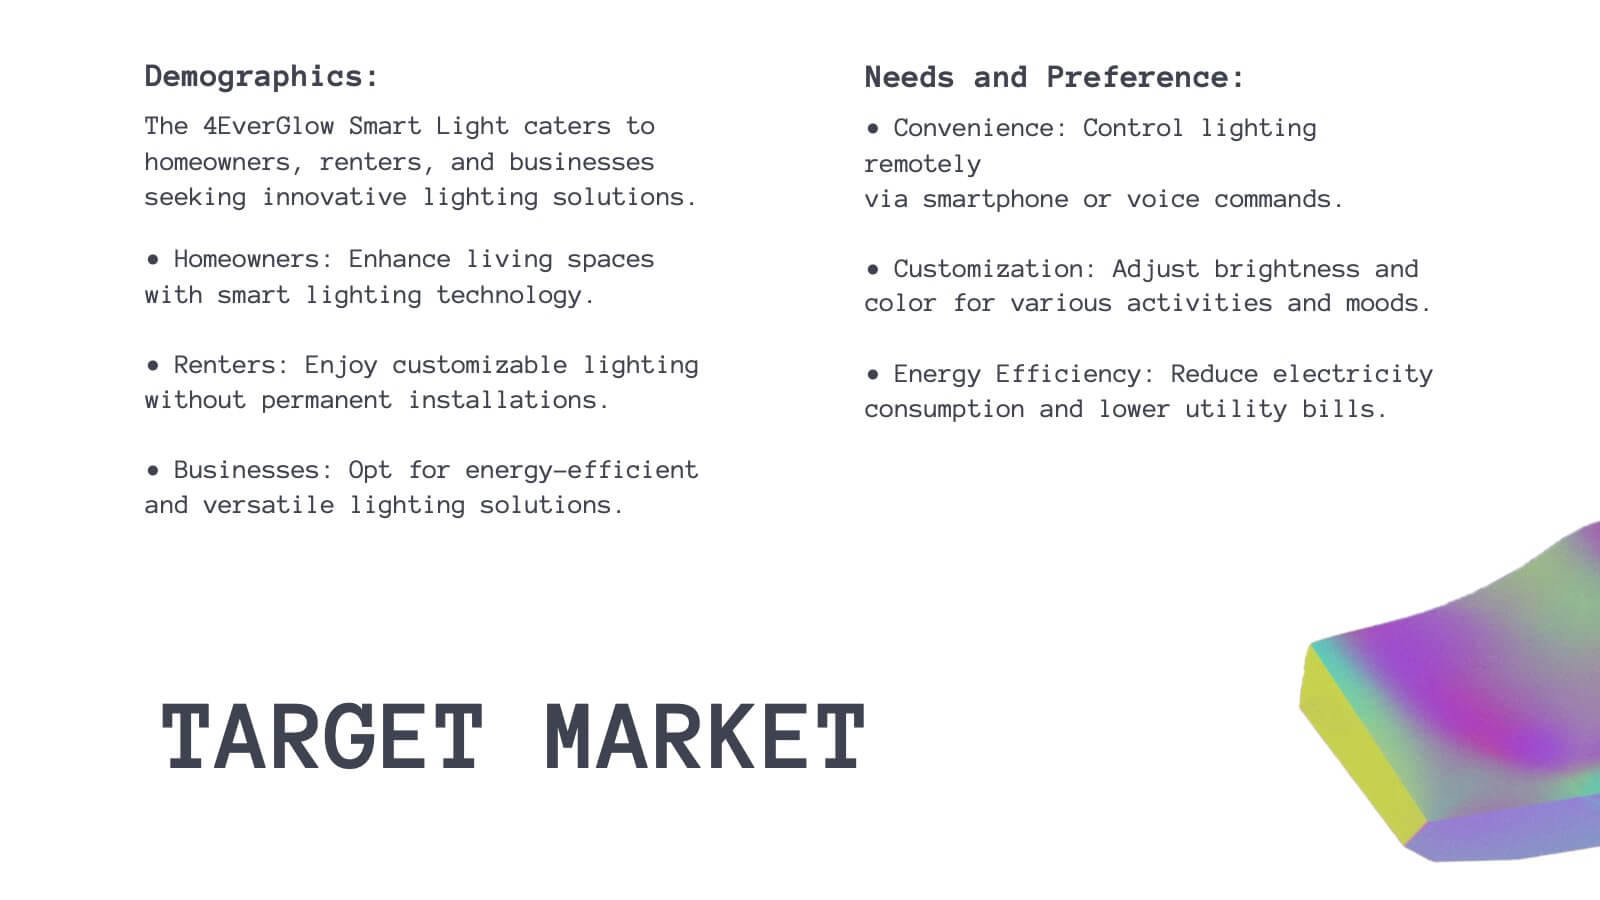
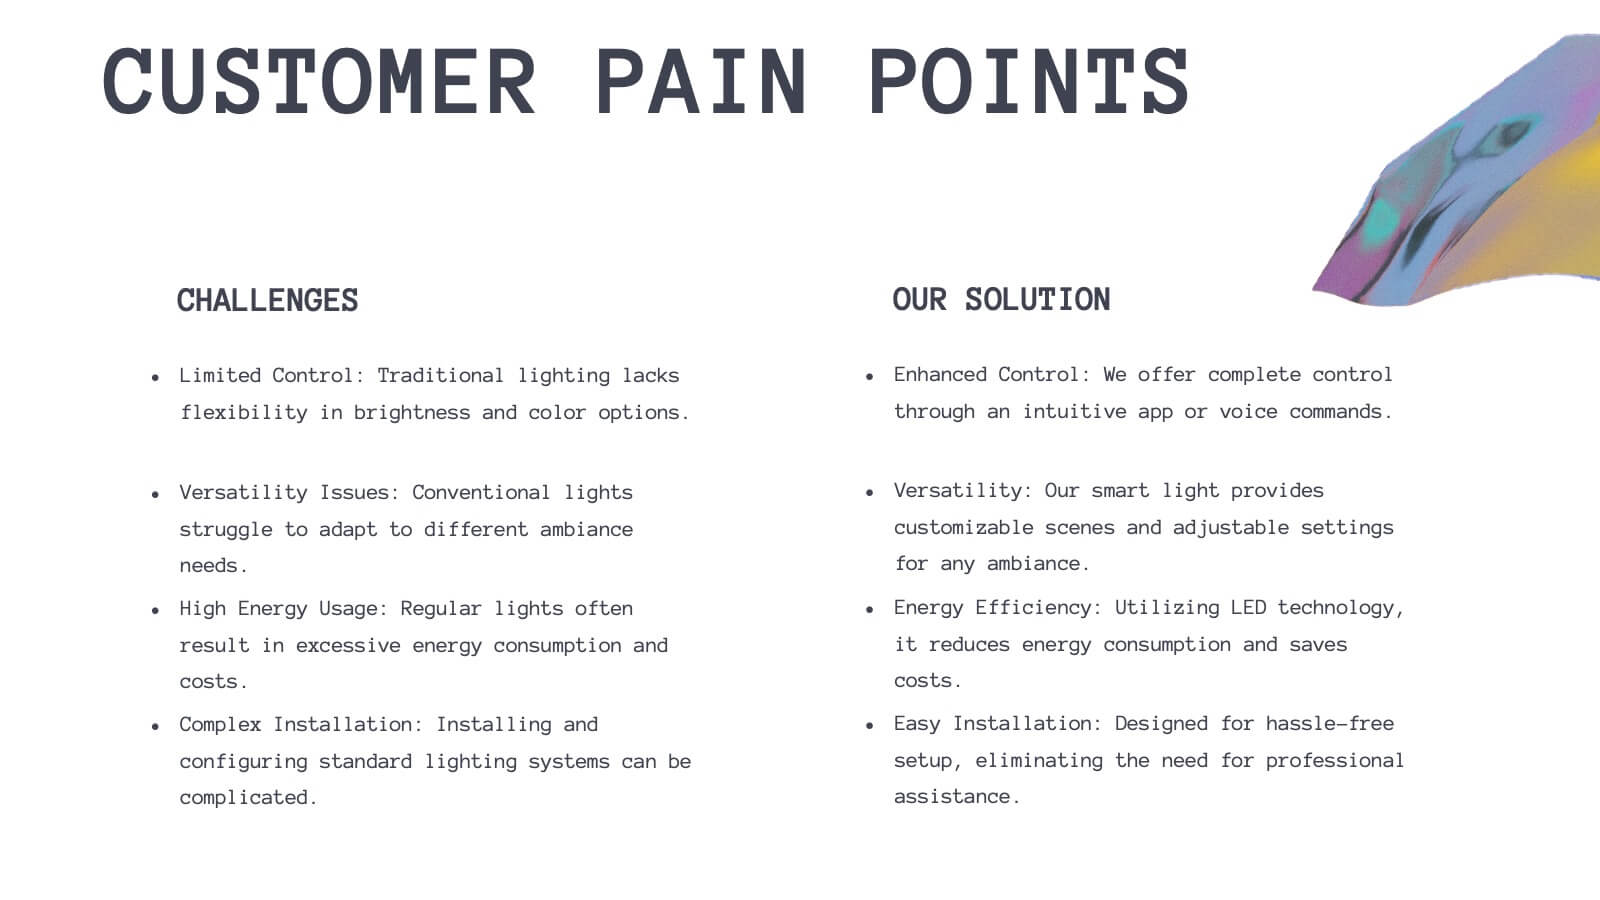
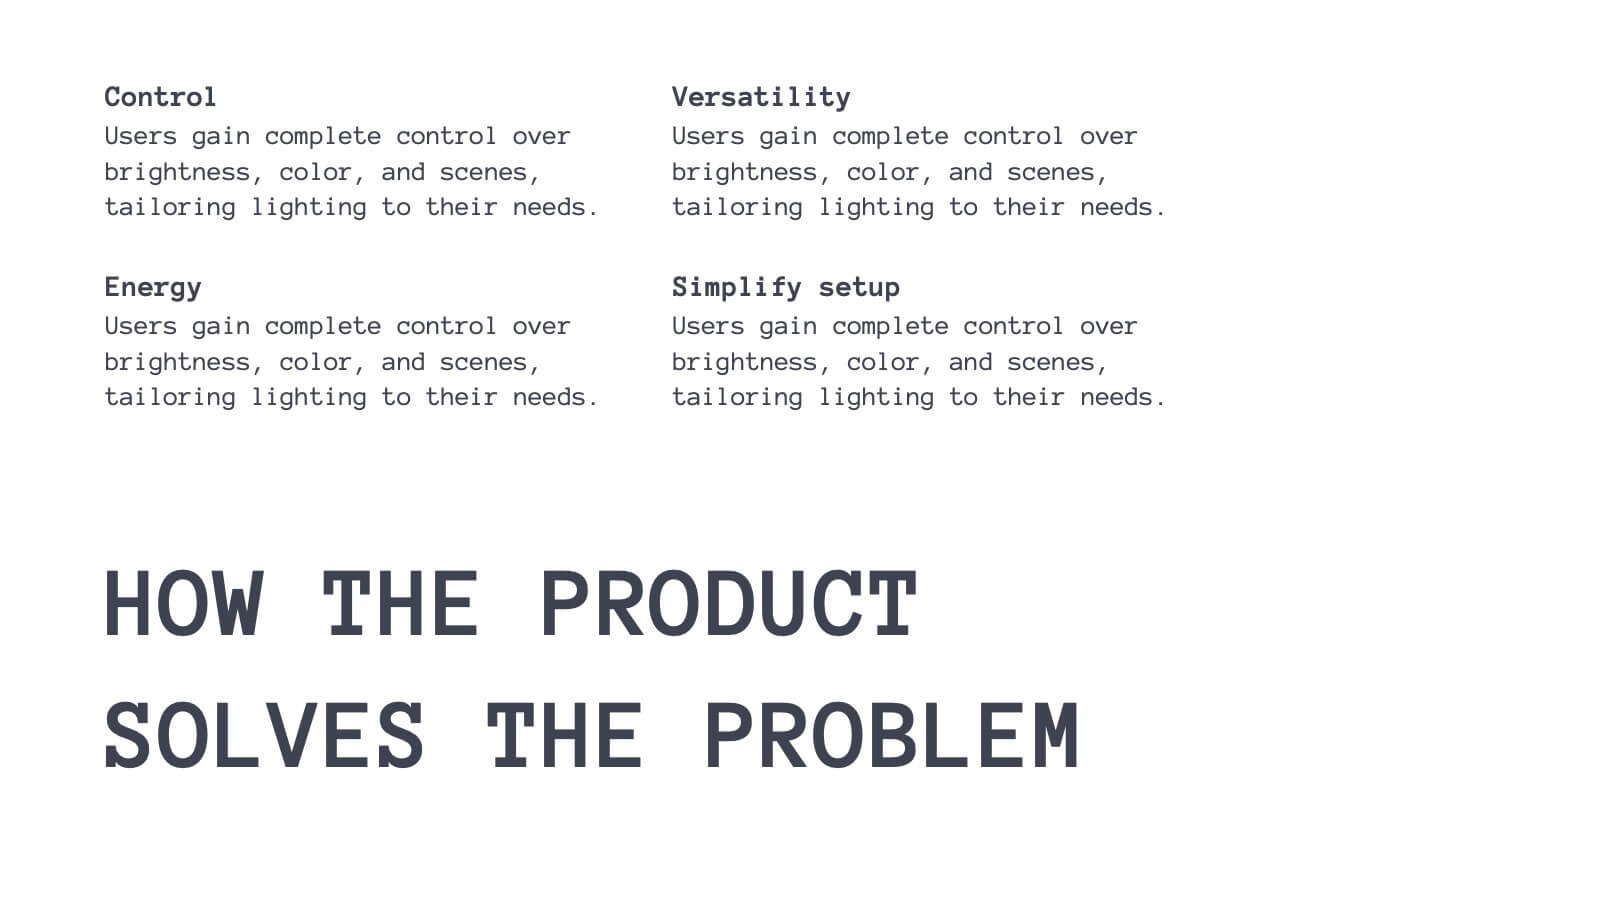
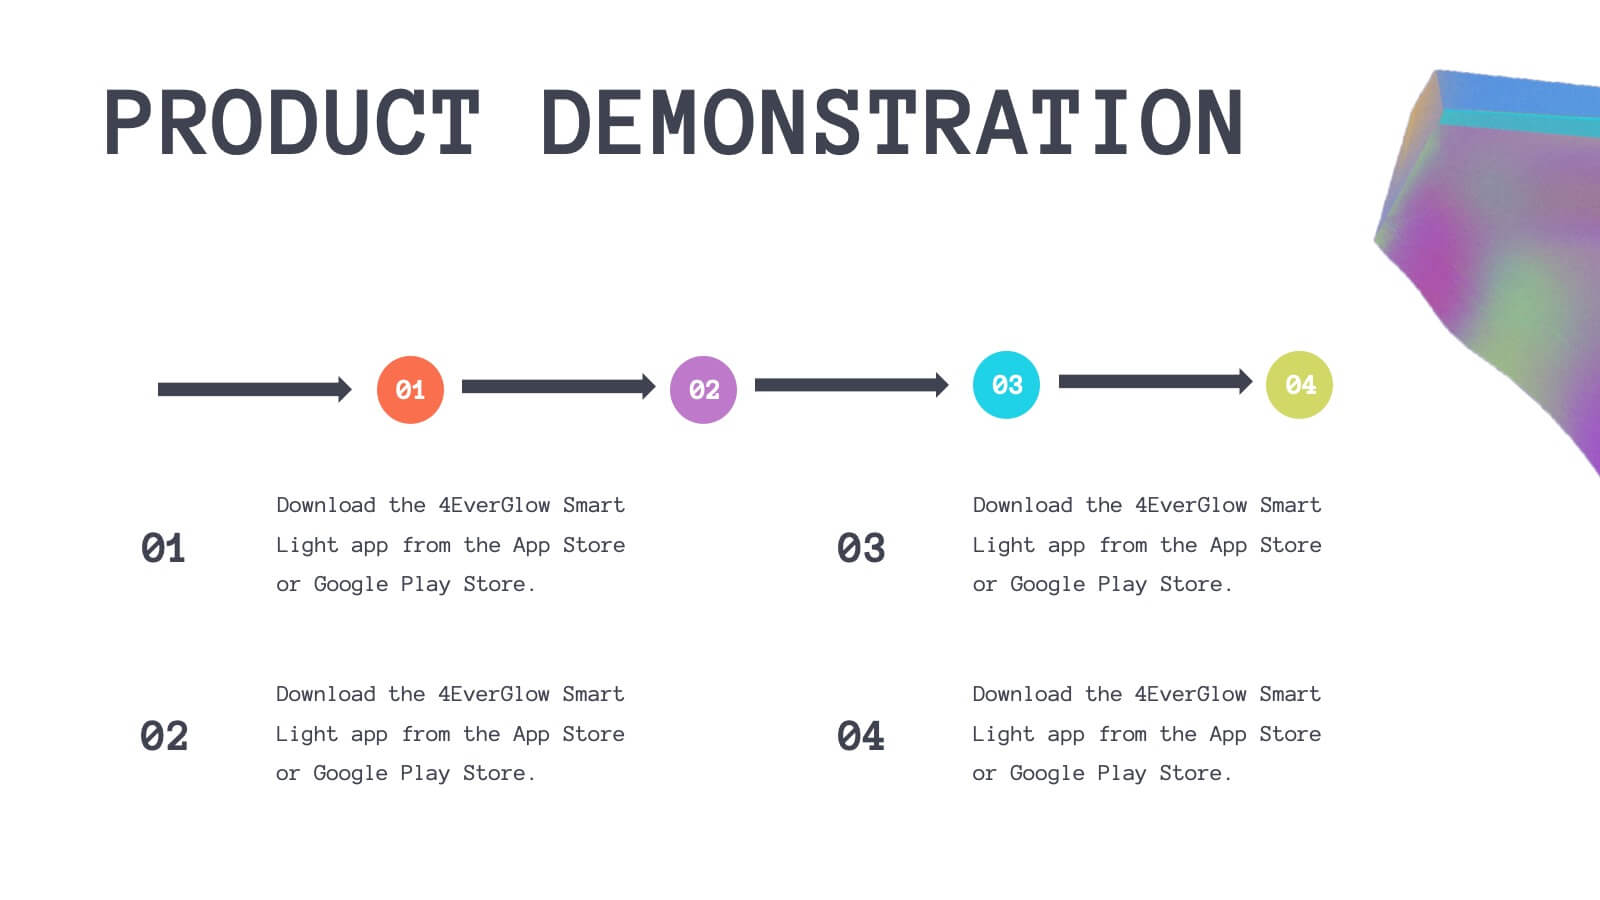
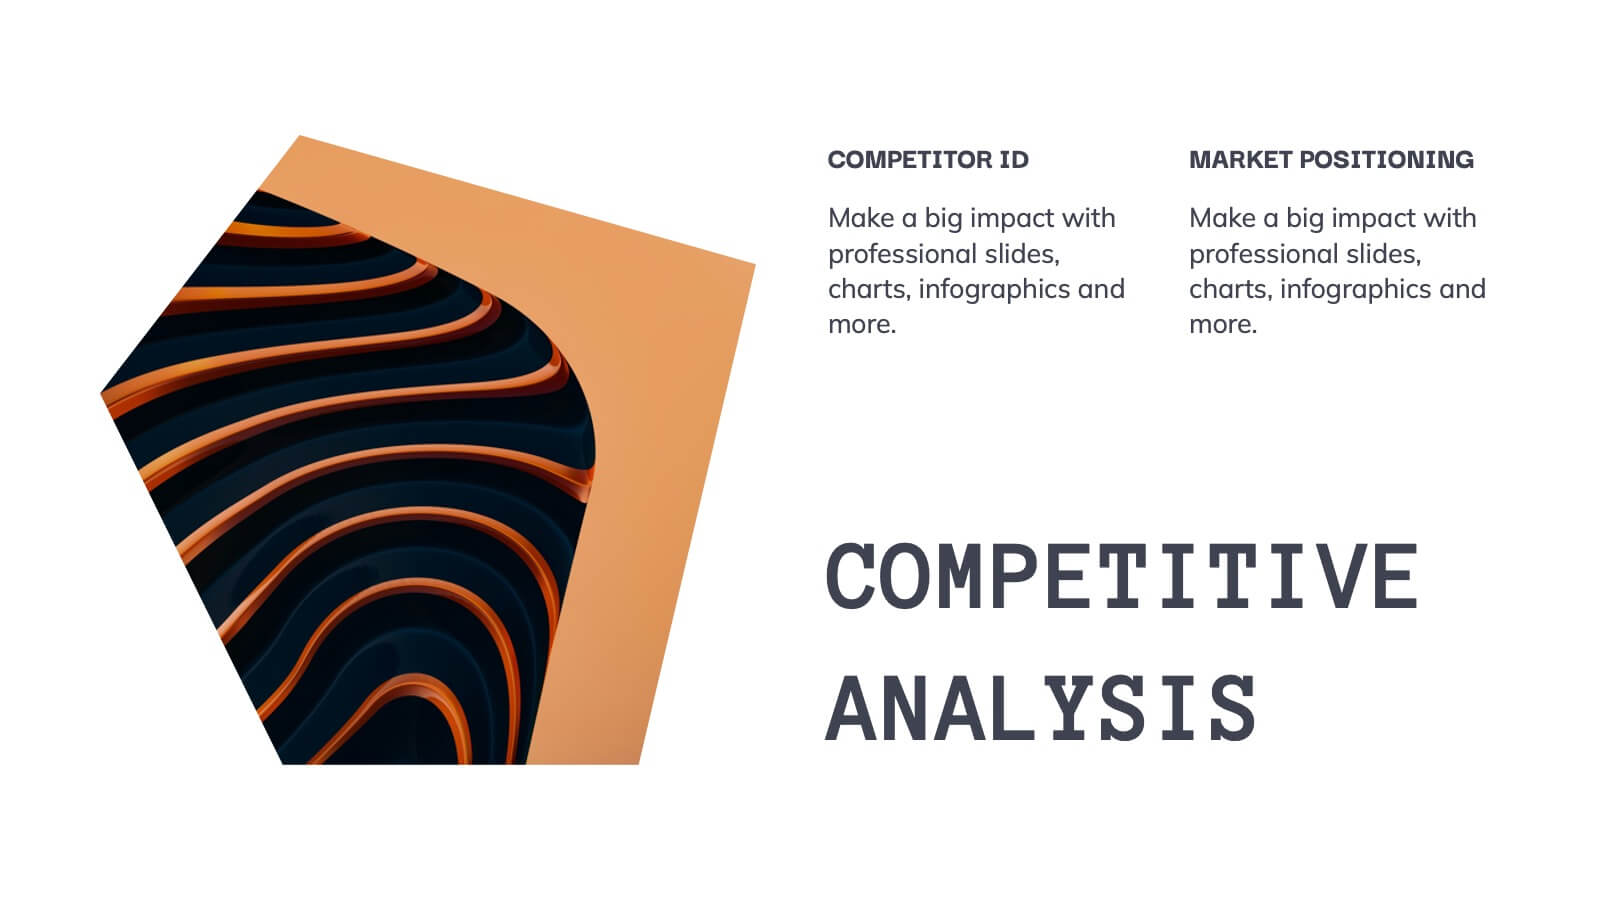
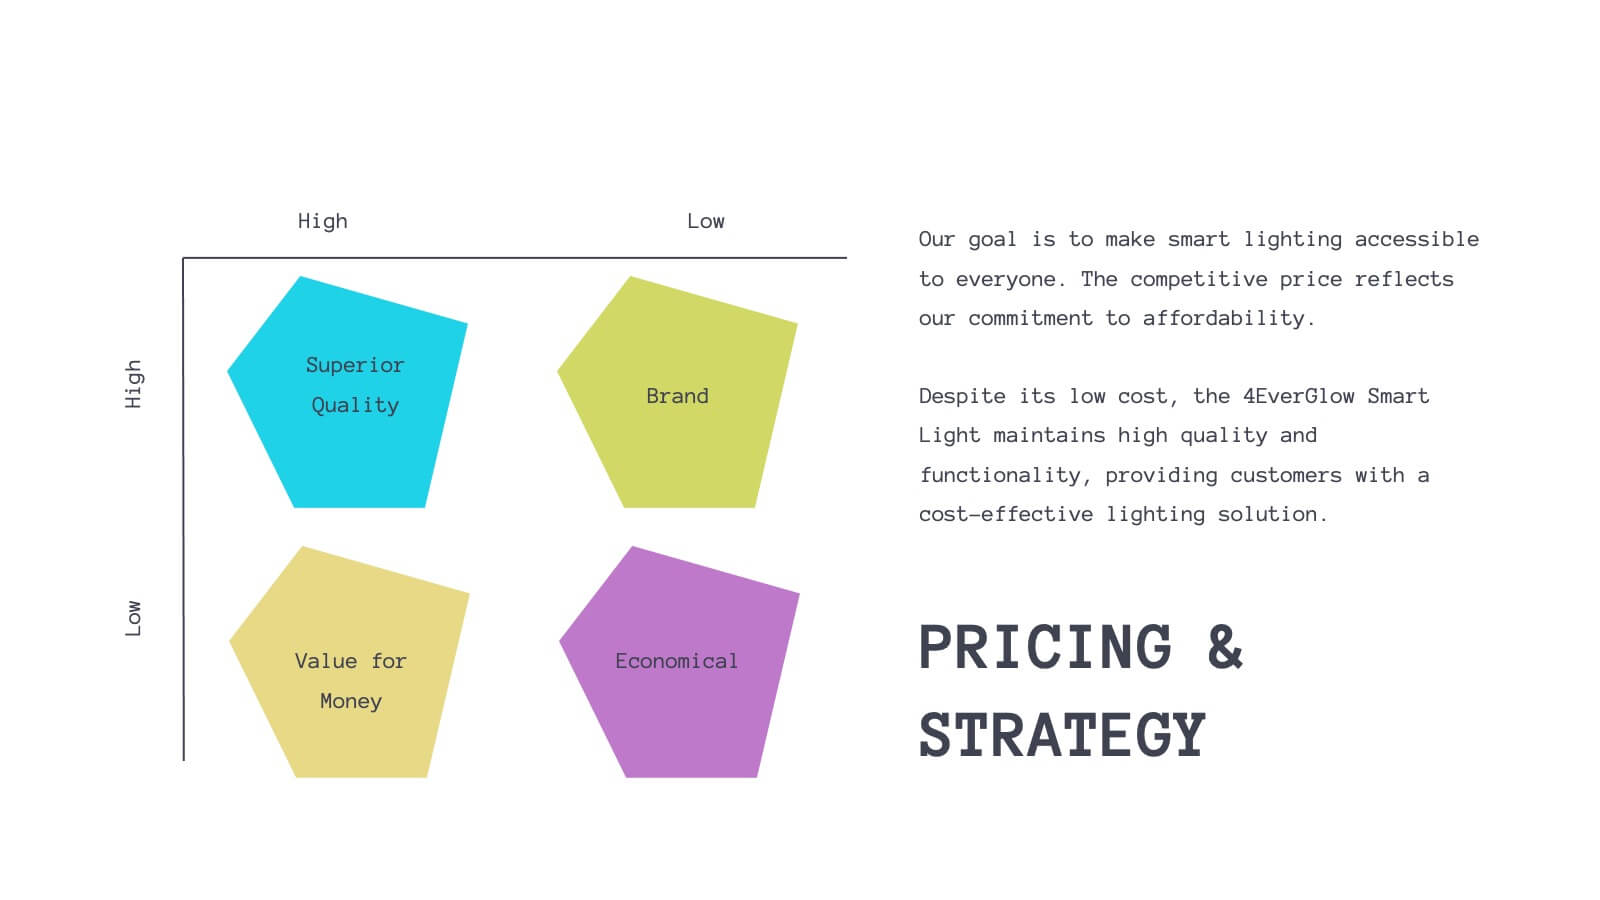
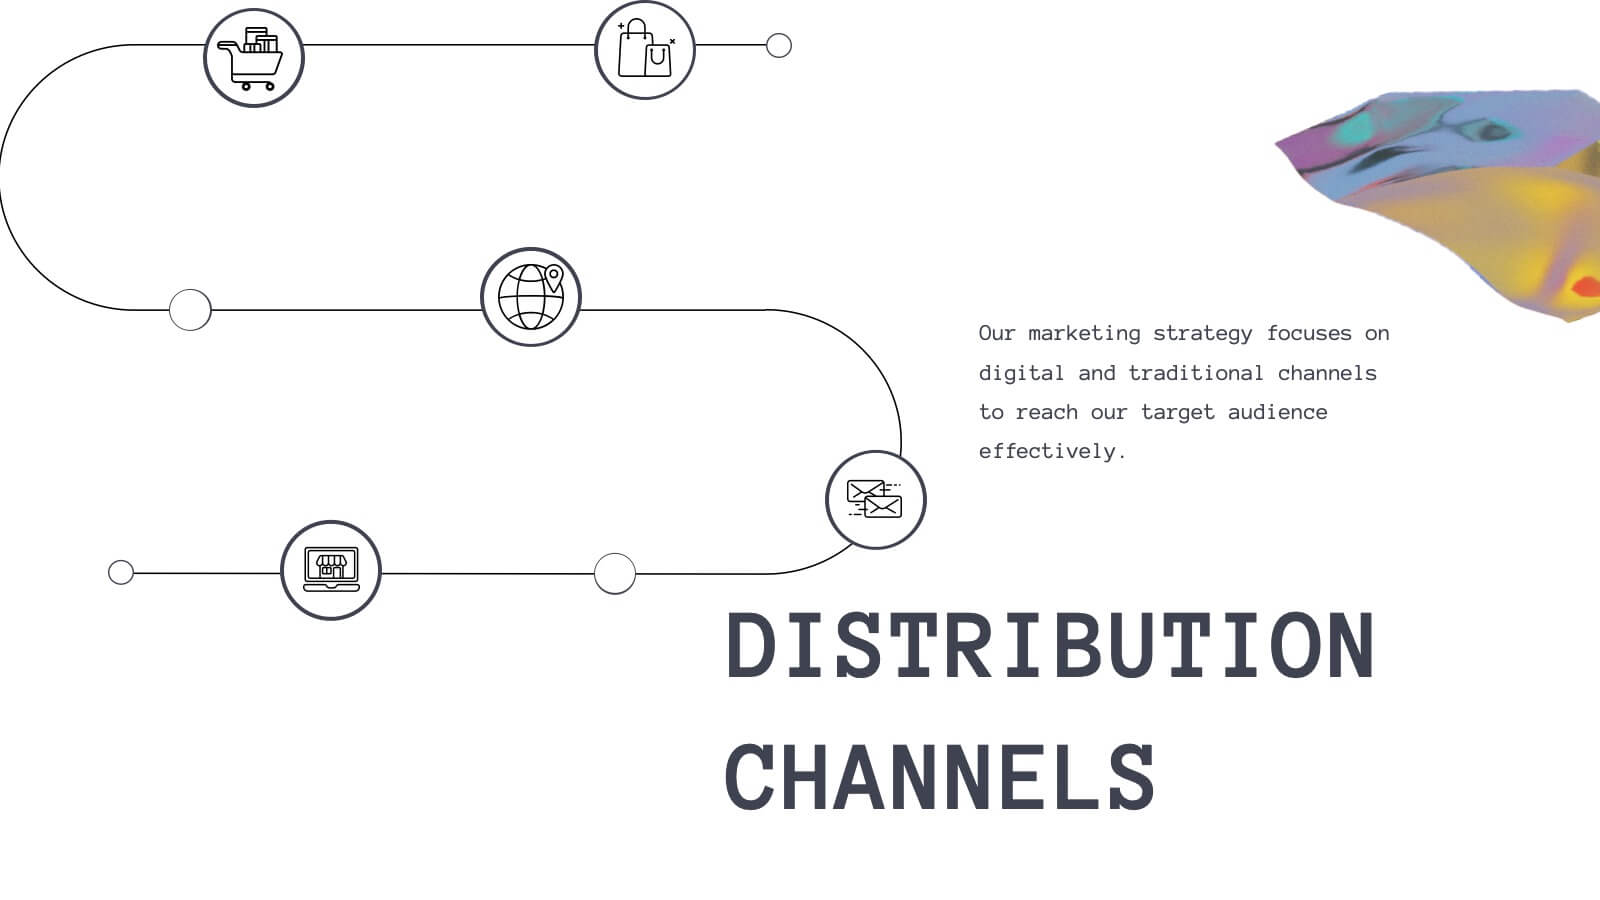
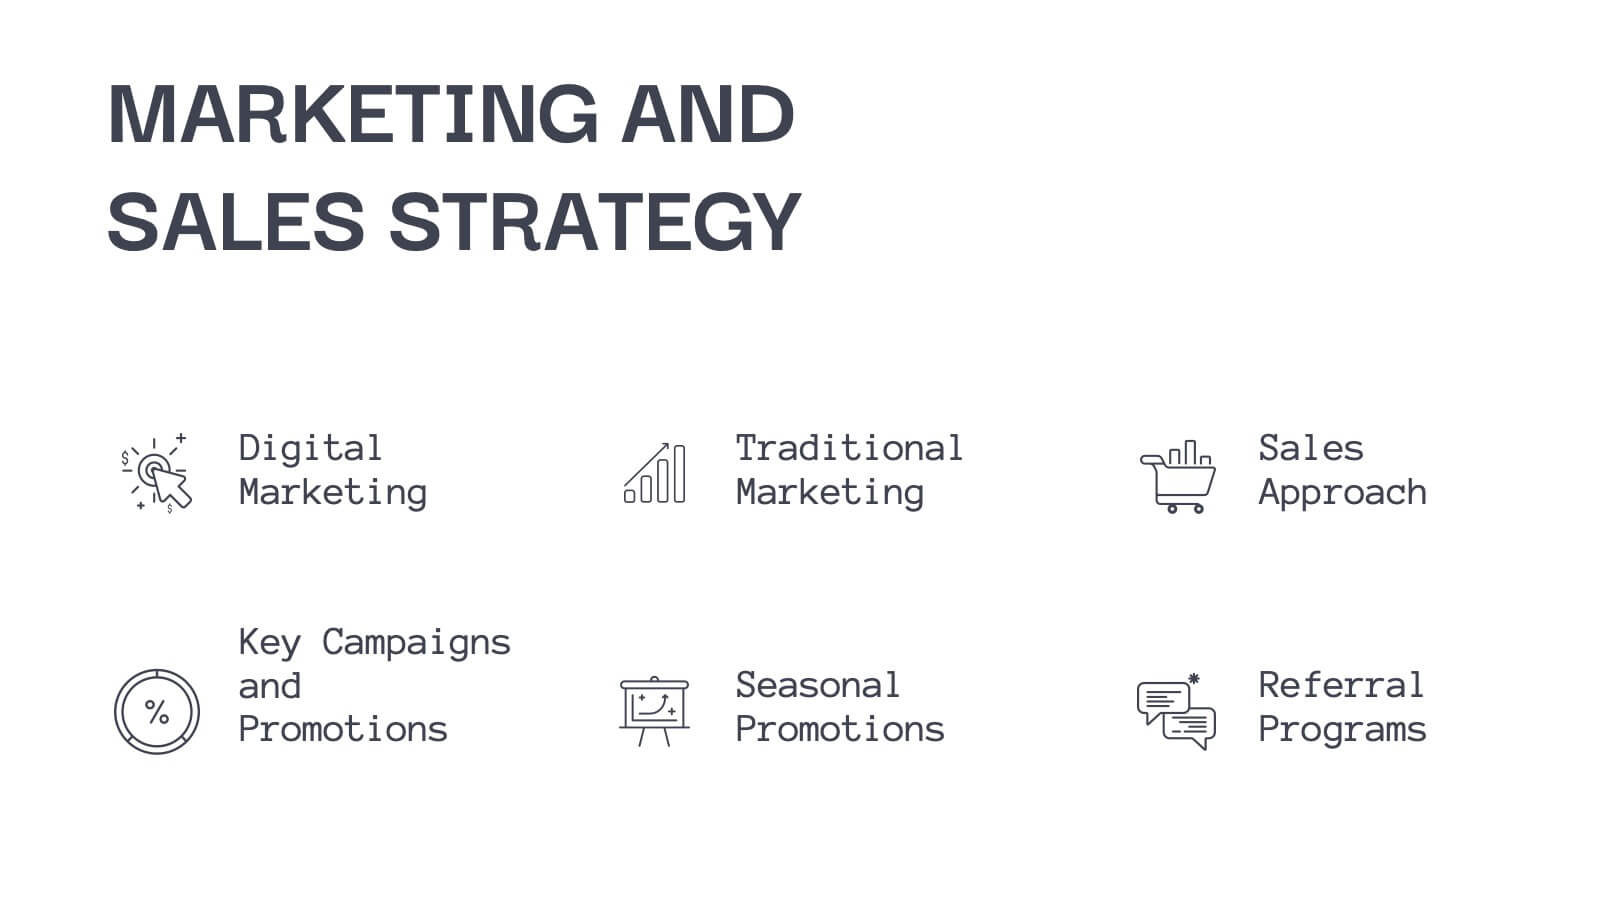
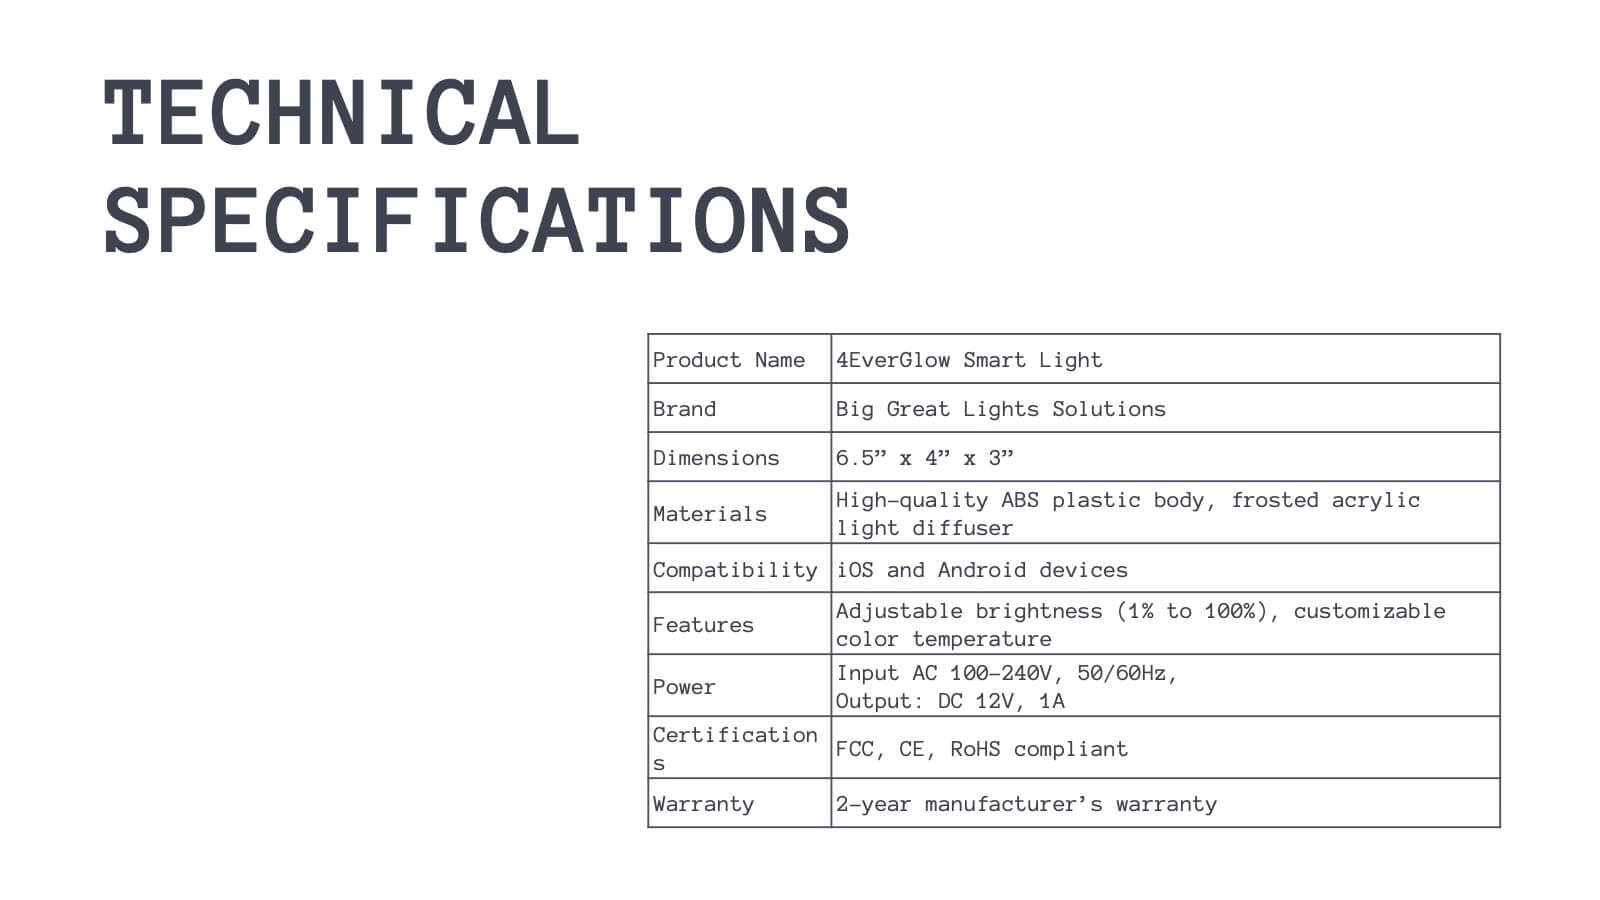
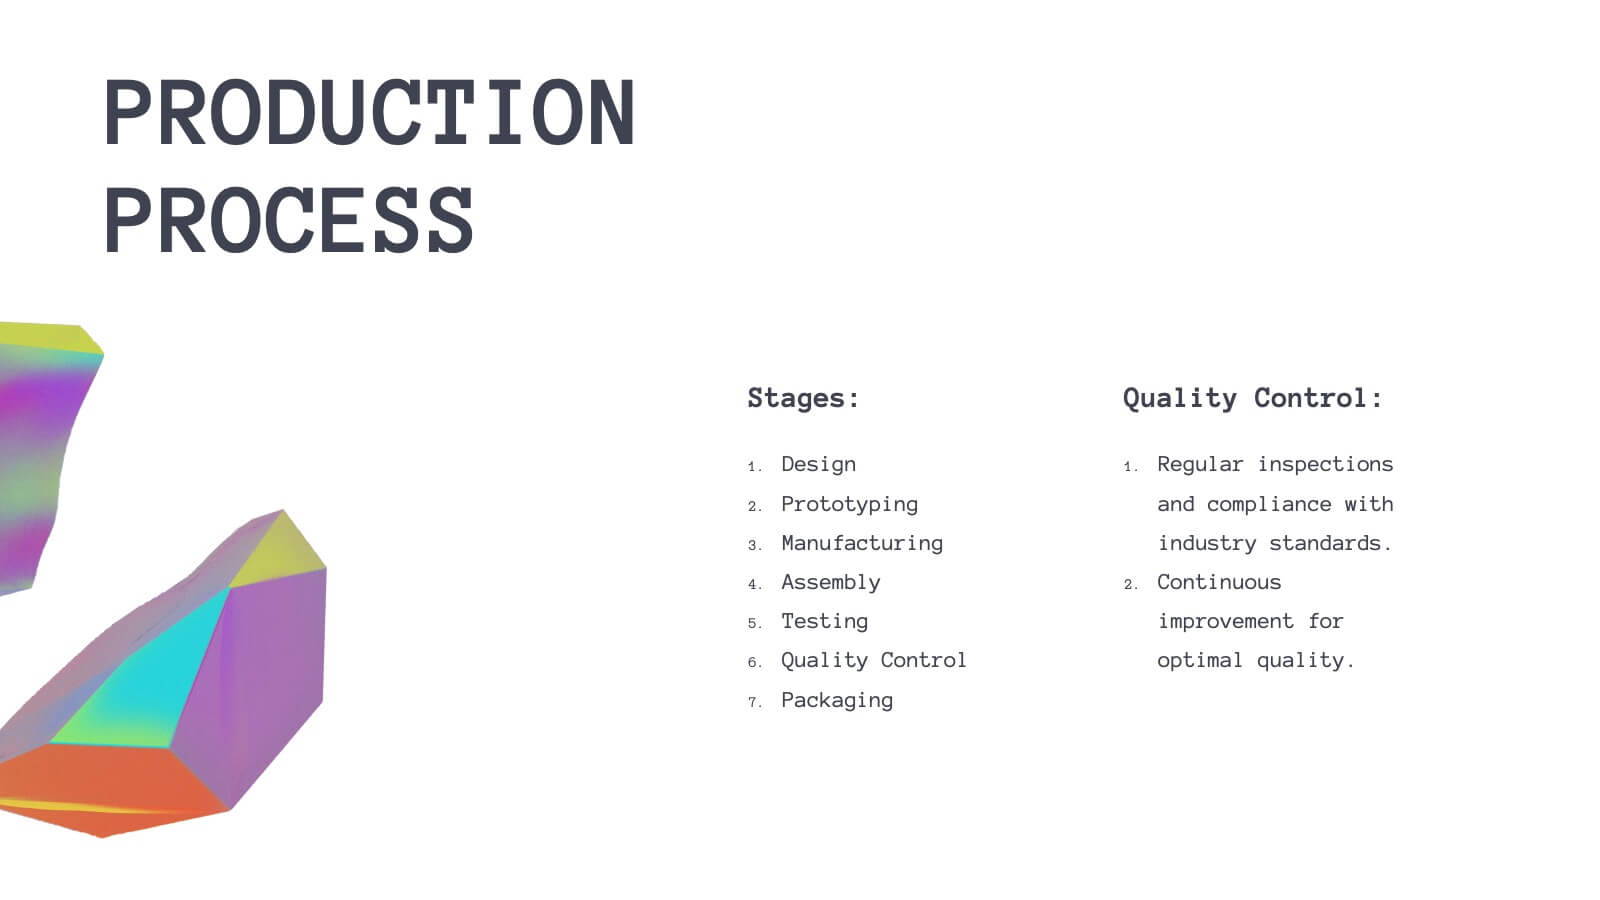
Luster Product Roadmap Presentation
Bring your product journey to life with this vibrant, modern presentation template! Perfect for guiding your audience through product features, customer pain points, and competitive analysis, it’s designed for maximum clarity and engagement. Whether you’re showcasing technical specs or marketing strategies, this template fits all your needs. Compatible with PowerPoint, Keynote, and Google Slides.


7 diapositivas
Performance Summary Infographic
Boost your reporting capabilities with our Infographic Templates, designed to deliver exceptional clarity and impact. This series is perfectly suited for professionals seeking to present performance data compellingly and concisely. With a variety of designs including radial graphs, tiered lists, and comparative bars, these templates allow for an informative and aesthetically pleasing showcase of critical metrics. Each template is customizable, letting you adjust the color schemes and text to fit your corporate style, enhancing both visual appeal and brand consistency. Whether used in PowerPoint, Google Slides, or Keynote, these tools are vital for anyone looking to articulate achievements, assess comparative results, and plan based on solid data insights. They are indispensable for consultants, managers, and team leaders who require clear, persuasive presentation resources to drive decisions and highlight successes.


5 diapositivas
Layered Business Pyramid Framework
Visualize business hierarchy and strategic layers with the Layered Business Pyramid Framework Presentation. This editable slide features a five-tier pyramid diagram aligned with corresponding text sections, ideal for showcasing organizational structures, workflow levels, or growth stages. Each layer is color-coded for clarity and impact, making your insights easy to digest. Fully compatible with PowerPoint, Keynote, and Google Slides.


31 diapositivas
Astralis Brand Strategy Report Presentation
Present your brand strategy effectively with this well-structured presentation template. This comprehensive design covers all essential aspects, including vision and positioning, identity components, brand guidelines, and touchpoints. It is perfect for showcasing how your brand stands out, communicates, and connects with its audience. Highlight your unique selling points, ensure visual consistency with color palettes, and emphasize your brand's voice through tailored sections. This template is easy to customize and works seamlessly across PowerPoint, Google Slides, and Keynote, ensuring accessibility for all. Empower your brand strategy discussions with a professional and polished design.


4 diapositivas
Cost Analysis and Budget Overview Presentation
Break down financial details with clarity using the Cost Analysis and Budget Overview Presentation. This slide helps you present cost structures, budget allocations, and key financial metrics side by side using icons and visual data blocks. Perfect for reports, planning, or investment decks. Fully editable in PowerPoint, Google Slides, Keynote, and Canva.


7 diapositivas
Industrial Safety Infographic
Industrial safety, also known as occupational safety, pertains to the management of processes and conditions within industrial settings to ensure the safety, health, and well-being of workers and the general public. This impactful infographic template encapsulates the essentials for fostering a secure and hazard-free industrial environment. Compatible with Powerpoint, Keynote, and Google Slides. The customizable set of icons represents emergency response actions, underlining the need for rapid and efficient responses in critical situations. Build a foundation of safety that fosters a secure and thriving work environment.


3 diapositivas
Market Size and Scaling Insights Presentation
Understand your market potential with the Market Size and Scaling Insights Diagram. This visually engaging template helps you analyze market segments, growth trends, and scaling opportunities with clarity. Ideal for business strategists, analysts, and investors, this slide ensures a concise and professional presentation of key market data. Fully customizable and compatible with PowerPoint, Keynote, and Google Slides.


5 diapositivas
Project Risk Management Framework Presentation
Visualize challenges before they arise with this dynamic framework designed to map, assess, and mitigate project risks efficiently. Its circular layout highlights every critical stage, helping you communicate strategies clearly and professionally. Fully editable and compatible with PowerPoint, Keynote, and Google Slides for effortless customization and presentation flexibility.


5 diapositivas
Business Pillars for Success Presentation
Present your organization's core values or strategic foundations with this column-style infographic. Each pillar represents a distinct success factor, ideal for visualizing business frameworks, goals, or leadership principles. Fully editable in PowerPoint, Keynote, or Google Slides to match your brand and message.


4 diapositivas
Fleet and Delivery Operations Overview Presentation
Kick your logistics story into motion with a clean, easy-to-follow layout designed to showcase routes, deliveries, and operational steps with clarity. This slide helps teams communicate fleet performance, delivery processes, and workflow improvements in a simple, visual way. Fully compatible with PowerPoint, Keynote, and Google Slides.


5 diapositivas
Relationship Mapping Diagram Presentation
Bring clarity to complex connections with this clean and modern visual layout designed to map relationships, processes, or ideas effortlessly. Perfect for presentations that require structure and flow, it balances simplicity with professionalism. Fully customizable and compatible with PowerPoint, Keynote, and Google Slides for seamless design flexibility.


12 diapositivas
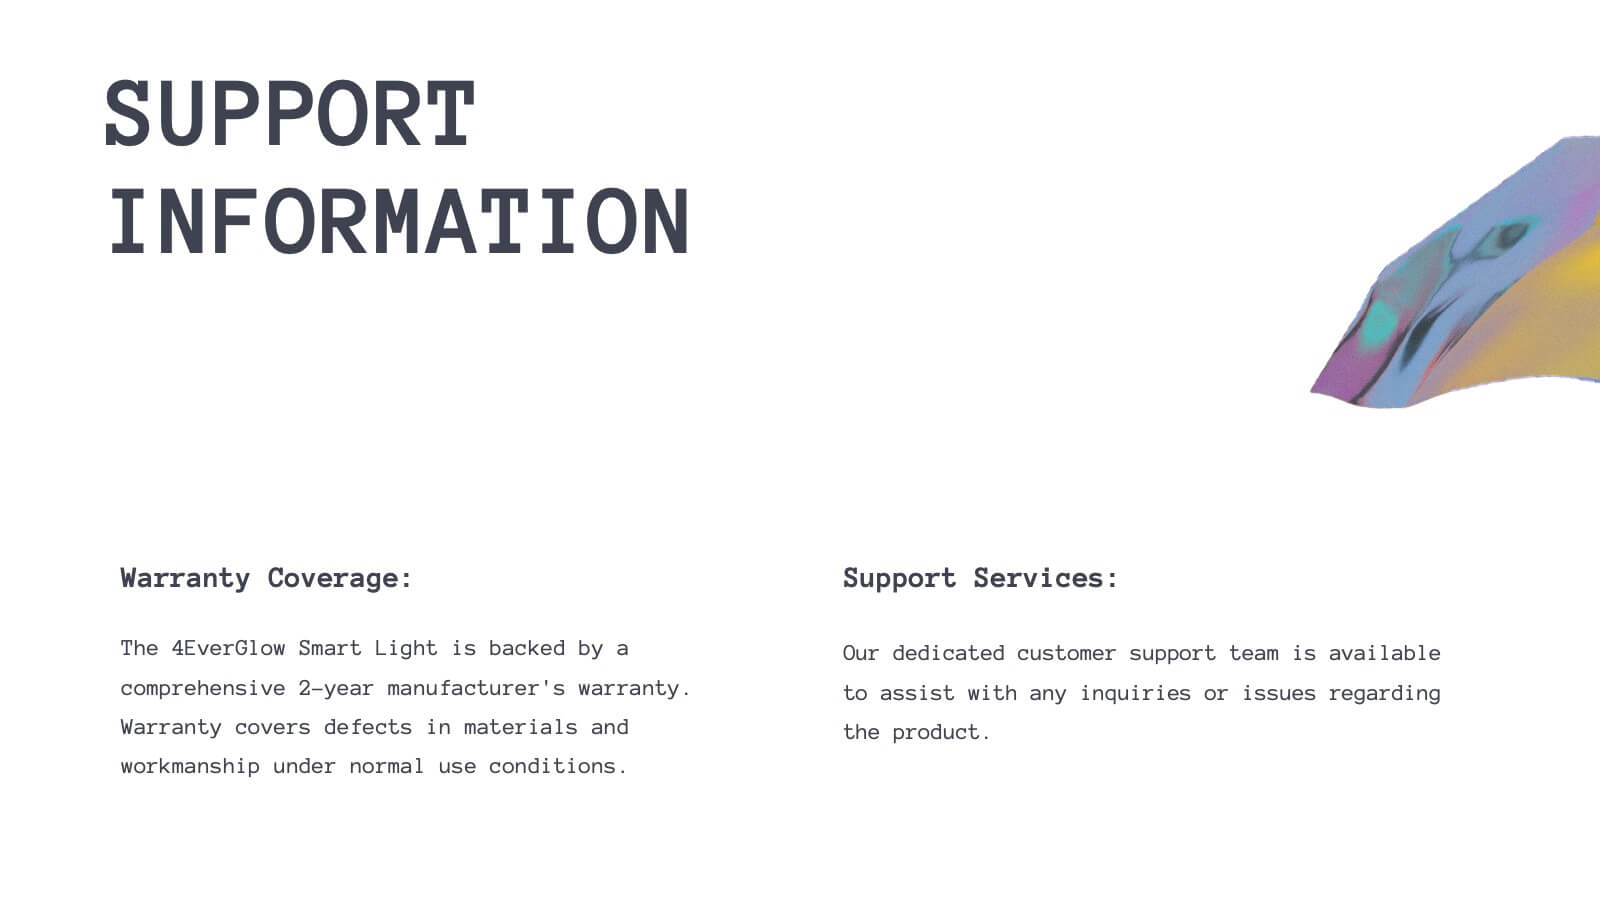
Customer Support Common Questions Presentation
Enhance customer support efficiency with this modern and structured presentation slide. Featuring a head silhouette with question marks, this template effectively represents customer inquiries and problem-solving processes. Perfect for help desk teams, customer service training, and support workflow presentations, it is fully editable, allowing you to customize text, colors, and layout for a tailored experience. Compatible with PowerPoint, Keynote, and Google Slides for seamless integration.
5 diapositivas
Project Progress Milestones Tracker Presentation
Stay on track and make timelines shine with this clean, visual layout. This template helps you clearly showcase task progress, deadlines, and deliverables over time—perfect for project updates, team planning, or stakeholder reporting. Fully editable and easy to use in PowerPoint, Keynote, and Google Slides for seamless collaboration.


5 diapositivas
Team Goals and Alignment Strategy Presentation
Align your team with clarity using the Team Goals and Alignment Strategy Presentation. This slide visually connects individual roles to a central target, making it ideal for showcasing strategic alignment, shared objectives, or team contributions. Fully customizable in Canva, PowerPoint, or Google Slides for seamless team planning.


7 diapositivas
Creative Timeline Infographic Presentation Template
A Timeline is an essential tool to illustrate the chronology of events; it also provides a method for organizing and summarizing material. With the timelines provided in this template you will be able to visualize the passage of time, so that you can better understand how influences from the past still impact your life today. This template is designed to assist you with crafting your timeline so that it can be easily understood. The color-coding makes it easy to see daily progress. Use the timelines in this template to create useful visualization, and convey the growth of your business or brand.


7 diapositivas
Product Innovation Infographic
Illuminate the path to creativity with our Product Innovation infographic, specifically designed for Powerpoint, Keynote, and Google Slides. This engaging infographic is an excellent resource for professionals seeking to present the innovation process in an accessible format. The eye-catching design breaks down complex ideas into digestible segments, perfect for sparking discussions on product development and creative brainstorming sessions. Our Product Innovation infographic is a versatile tool, offering a visual representation of the stages of innovation. It's ideal for educators, business leaders, and entrepreneurs who aim to inspire and educate their audience on the intricacies of innovative thinking. Each element of the infographic is crafted to encourage audience engagement, making it easier to convey the nuances of product innovation strategies. Compatibility with major presentation platforms ensures that this infographic can be seamlessly integrated into your slide deck. Use it to enhance your message and captivate your audience with a clear visual journey through the innovation process. Add this infographic to your presentation toolkit to bring your vision of innovation to life.