


Características


¿Tienes alguna pregunta?
Recomendar


7 diapositivas
Oceania Population Infographic Presentation
An Oceania map infographic is a visual representation of the Oceania region, which includes Australia, New Zealand, and the many small islands and archipelagos in the Pacific Ocean. This informative template highlights the geography, population, culture, history, and other relevant information about the region. This Oceania map infographic can be designed in a variety of styles and formats, including a political map, topographic map, population density map, and climate map. This template is compatible with Powerpoint, Keynote and Google Slides making it very easy to edit and include your data.


5 diapositivas
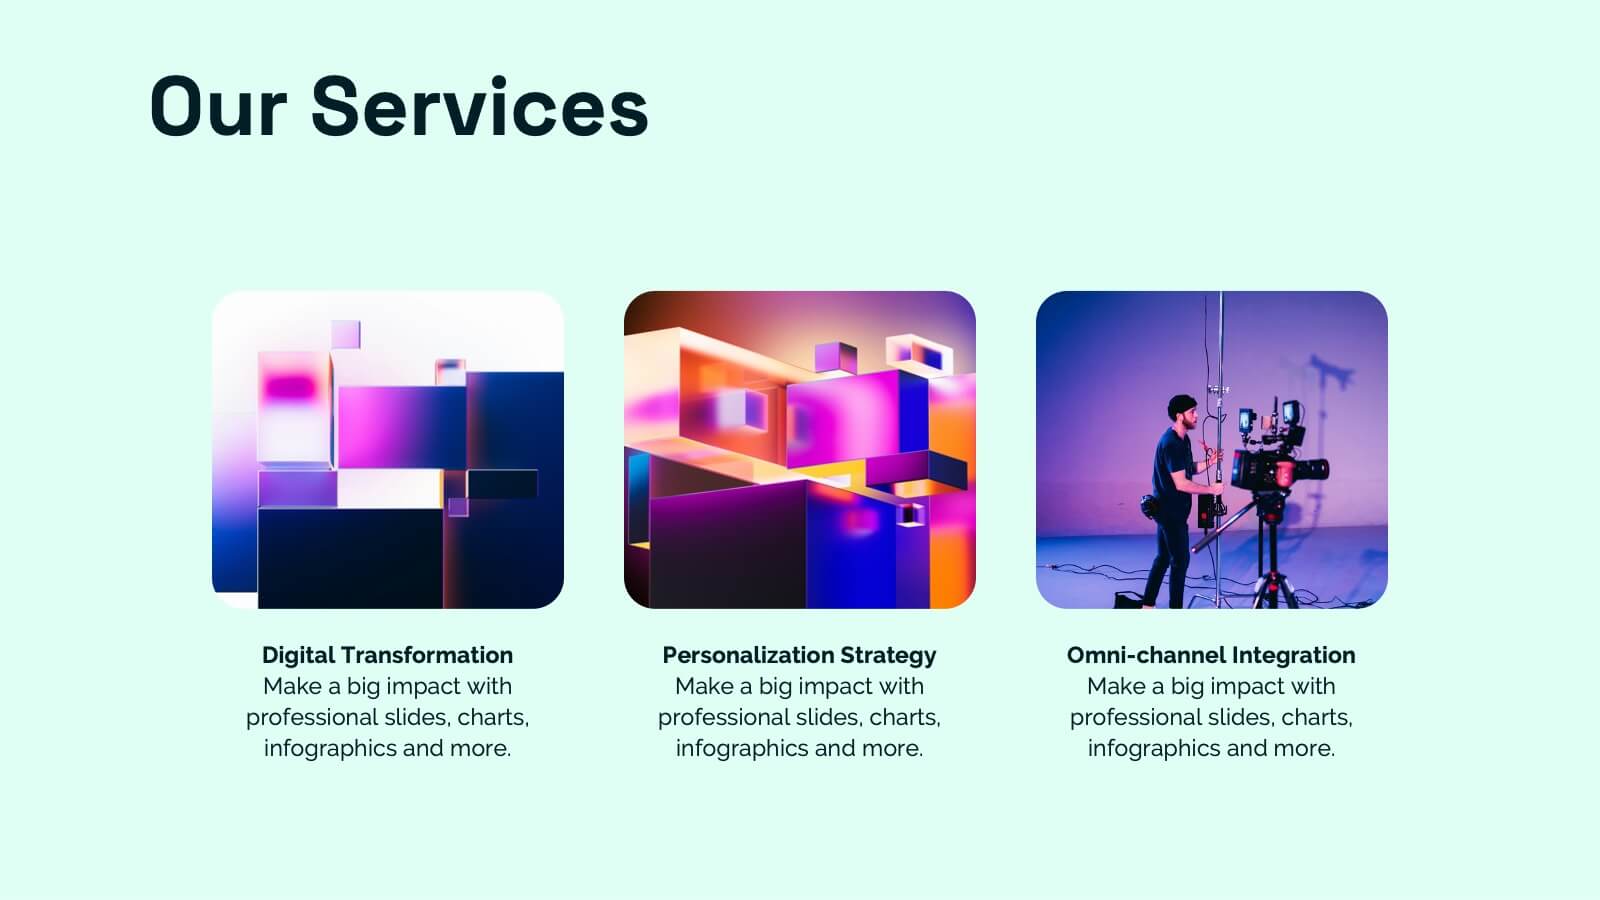
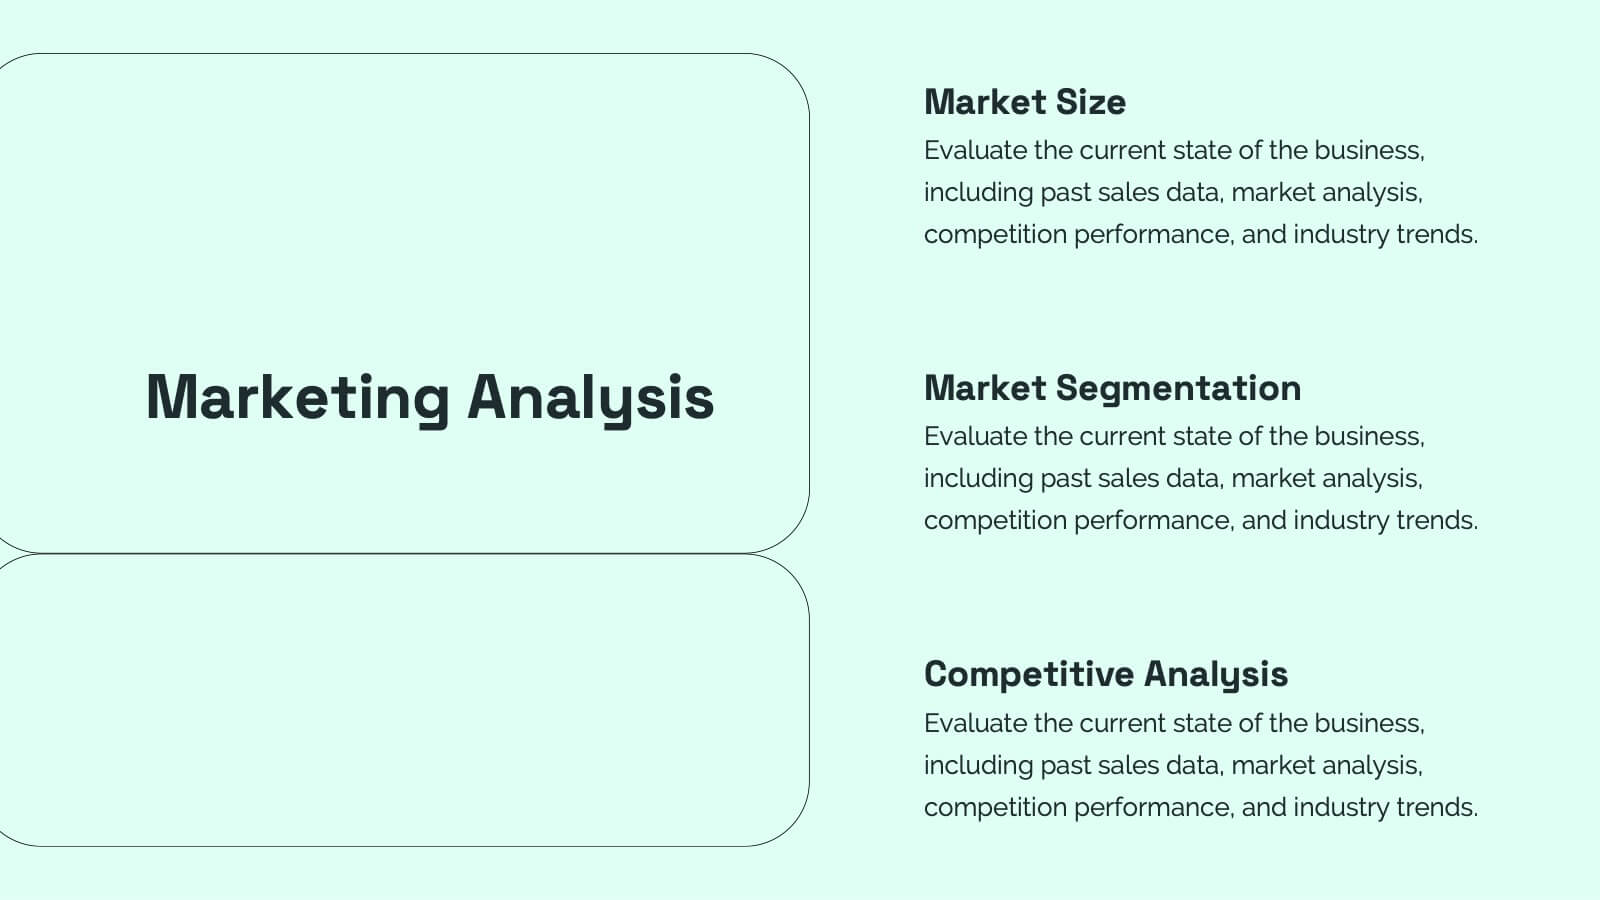
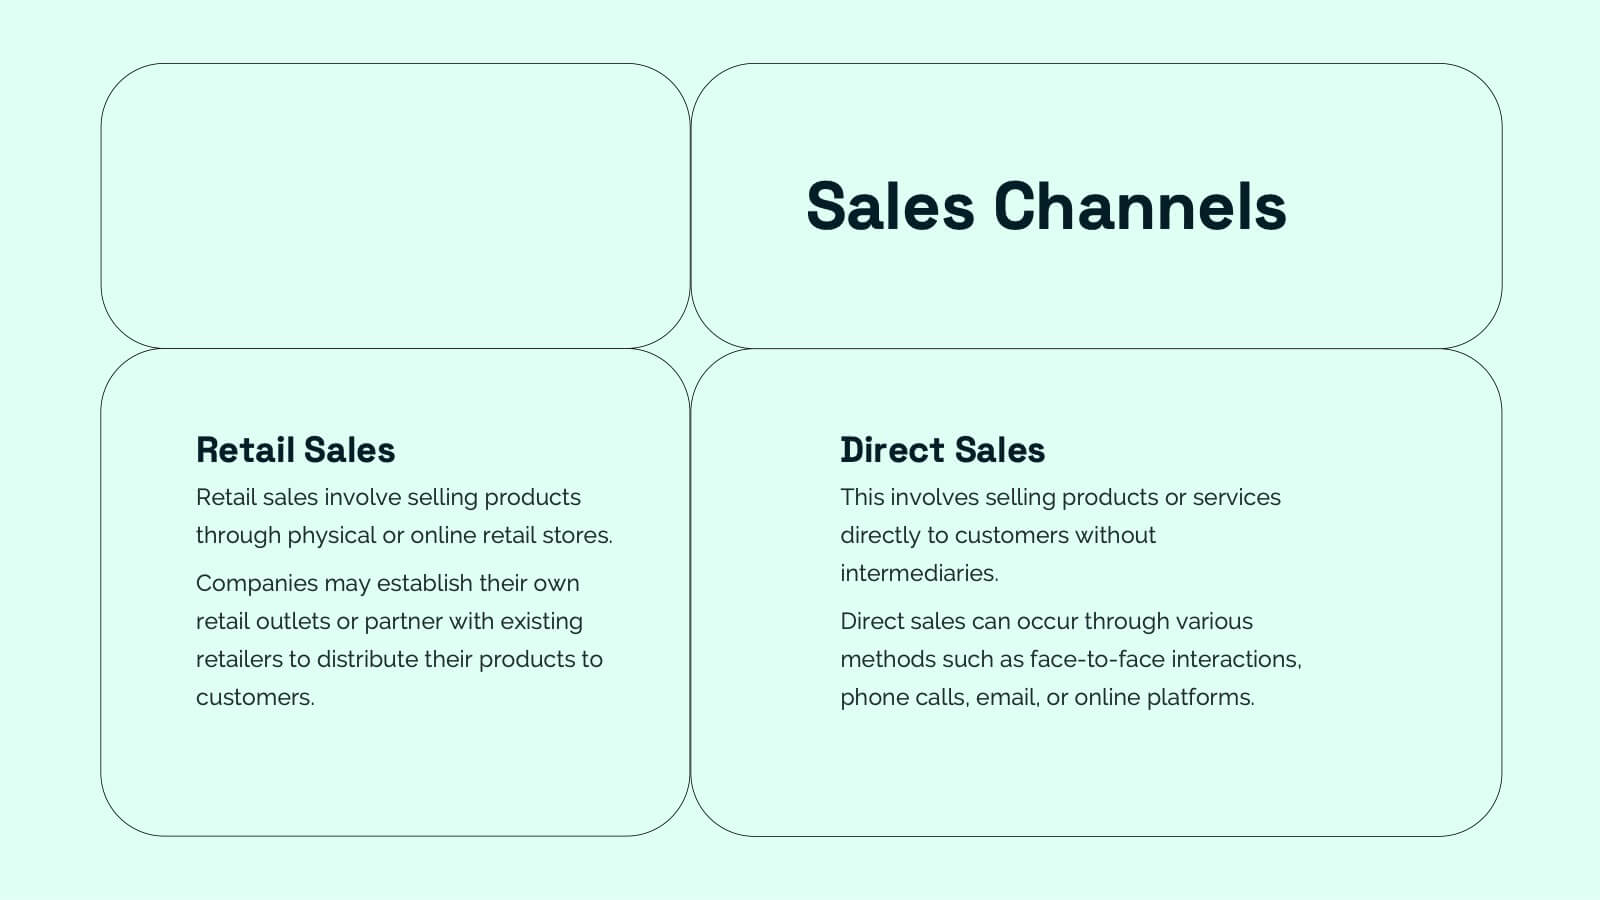
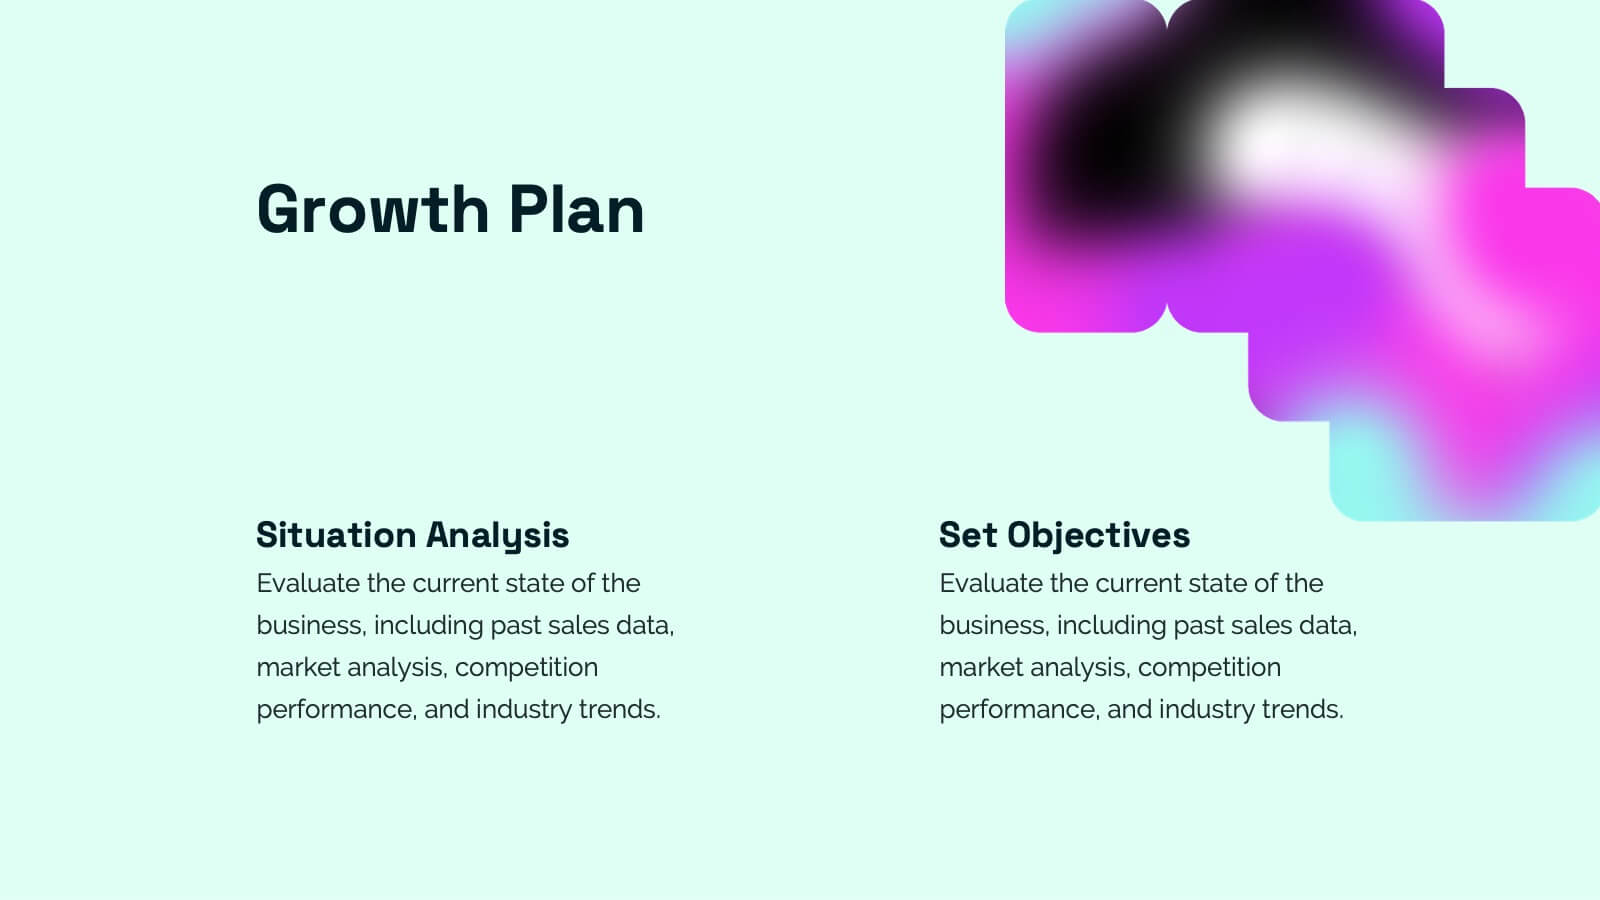
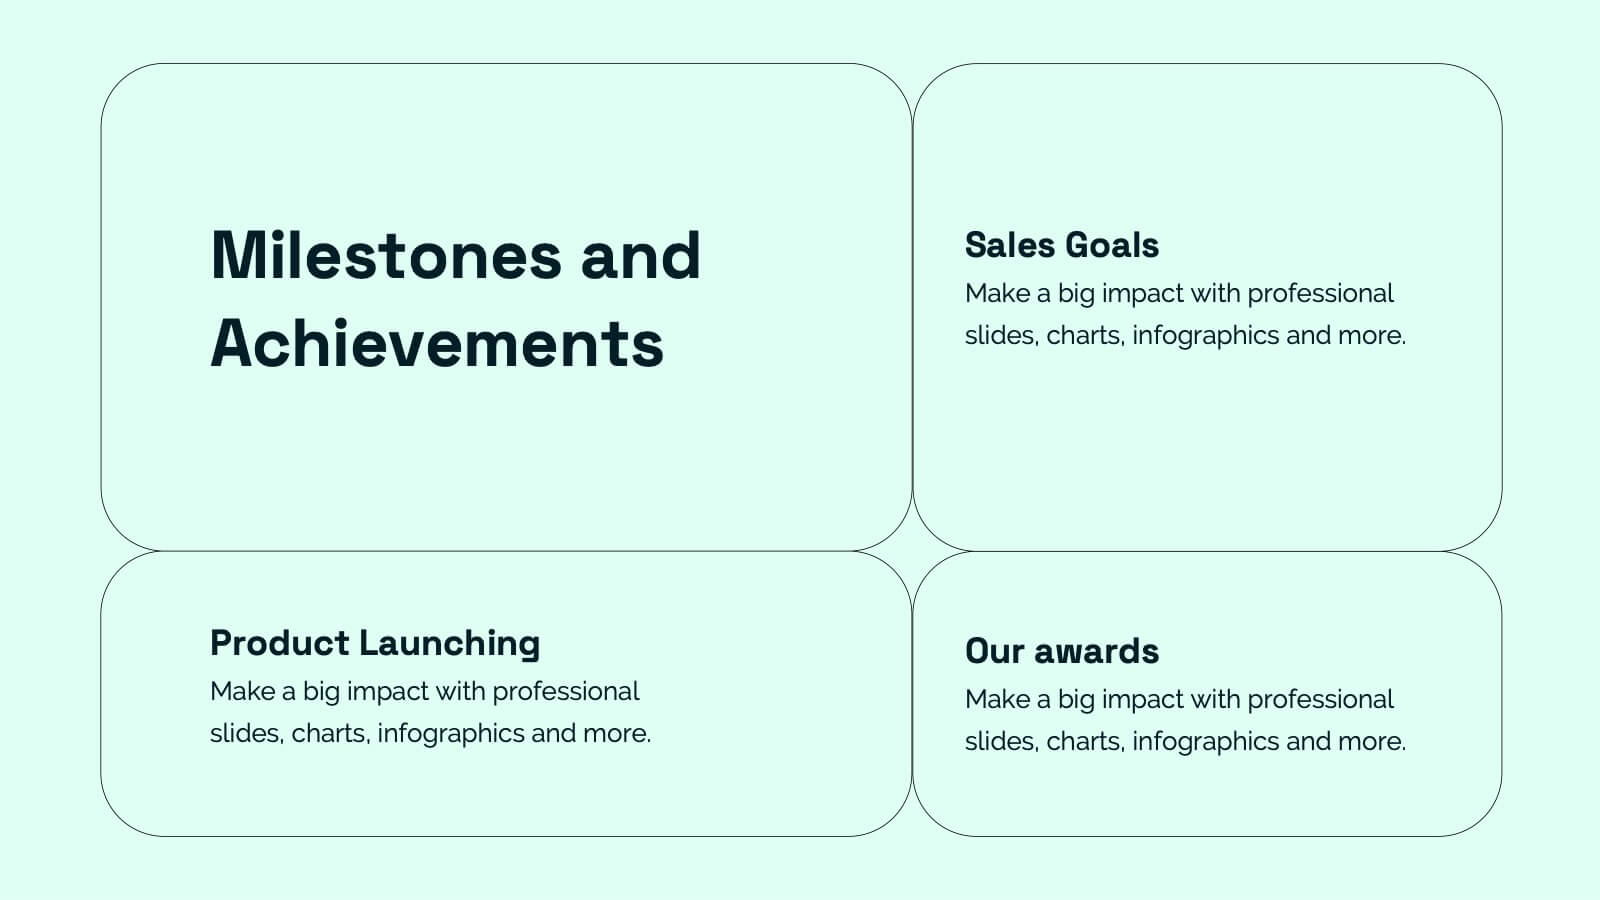
Small Business Plan Presentation
The "Small Business Plan Presentation" template is designed to visually articulate the essential elements of a business strategy effectively. This infographic employs 3D block graphics in varied colors to denote different sections of a business plan, such as market analysis, operations, marketing strategies, and financial projections. Each block is labeled clearly, facilitating an easy understanding and discussion of each business aspect. Ideal for entrepreneurs and small business owners, this template aids in presenting complex information in a straightforward, organized format during meetings with stakeholders or potential investors, ensuring key points are communicated clearly and professionally.


6 diapositivas
Meeting and Event Planning Schedule Presentation
Plan smarter and meet deadlines with the Meeting and Event Planning Schedule Presentation. This organized layout helps teams visualize phases, dates, and key activities at a glance—perfect for scheduling workshops, meetings, or launch events. Fully customizable in PowerPoint, Keynote, and Google Slides.


23 diapositivas
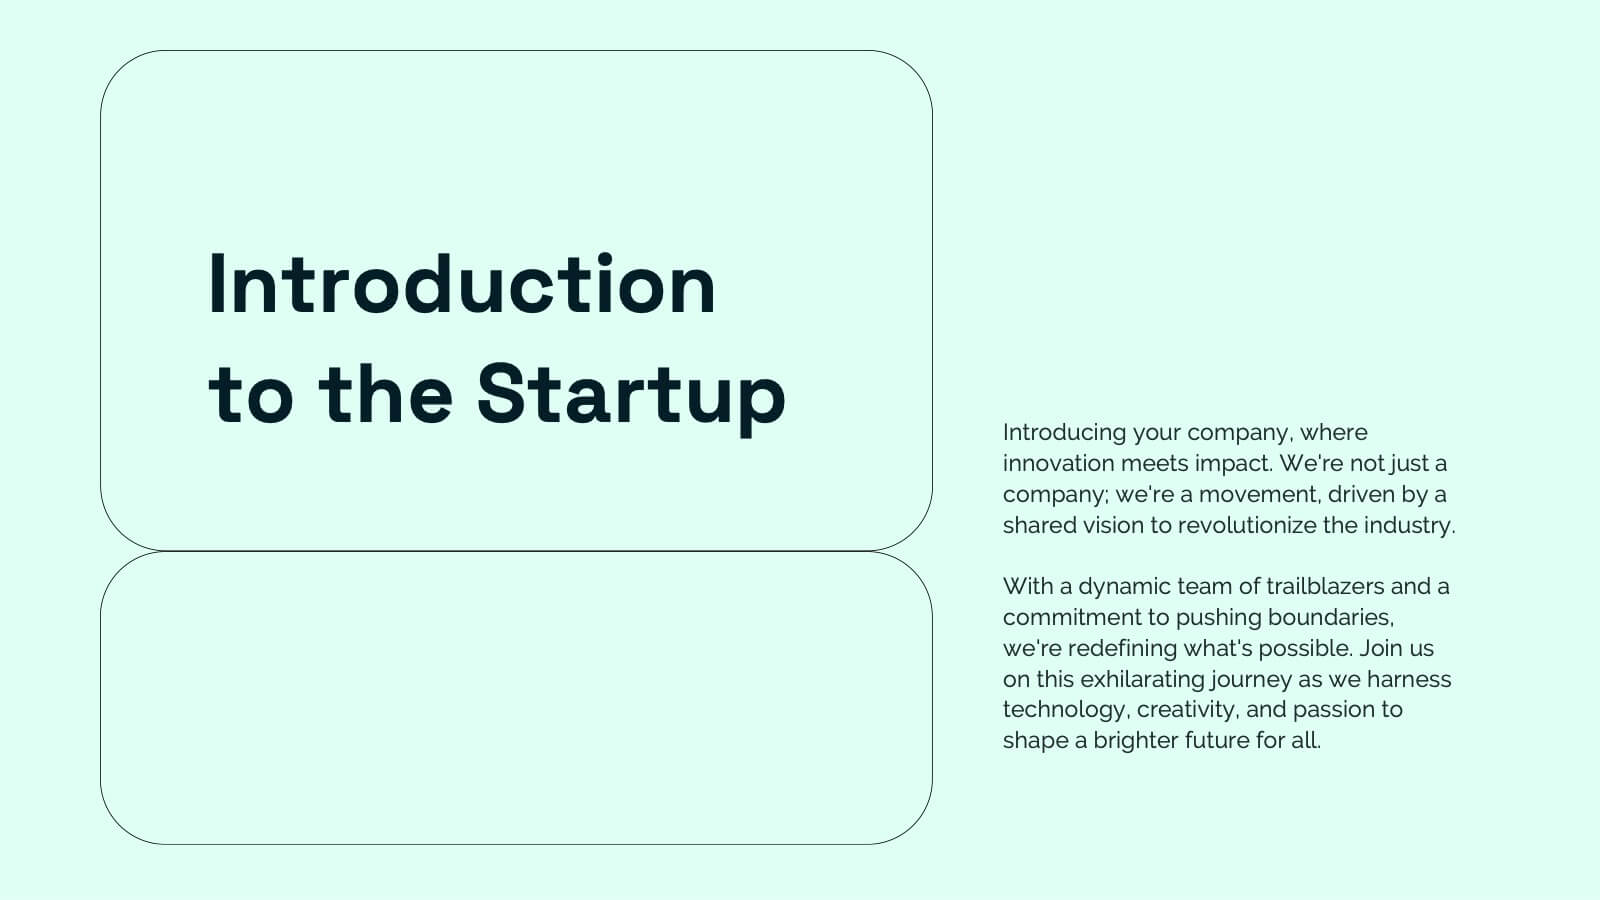
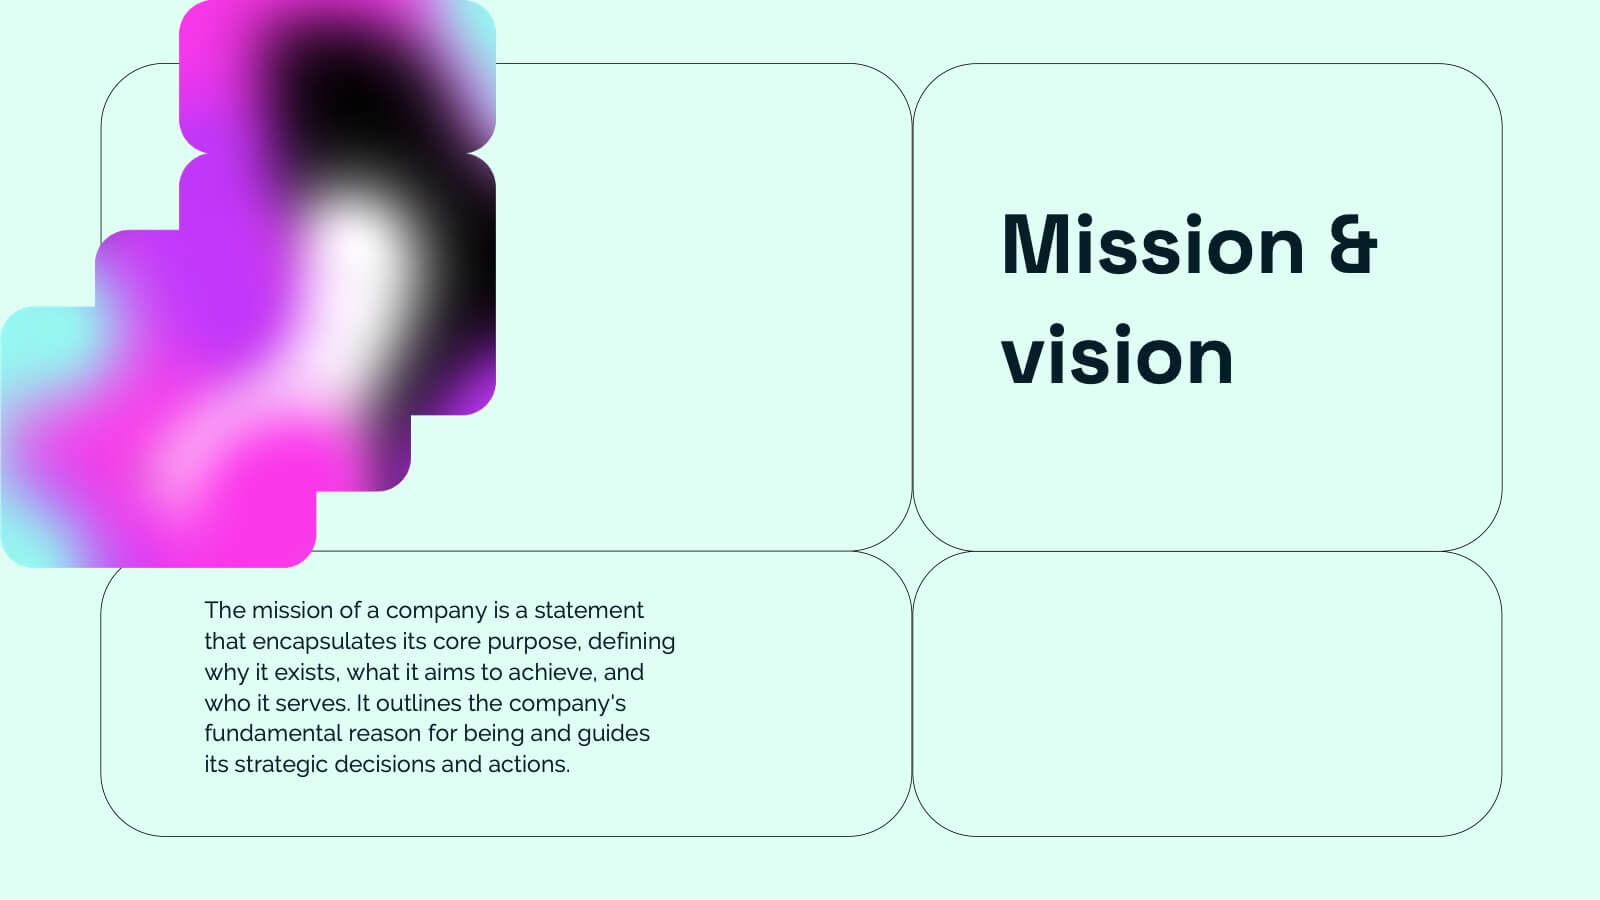
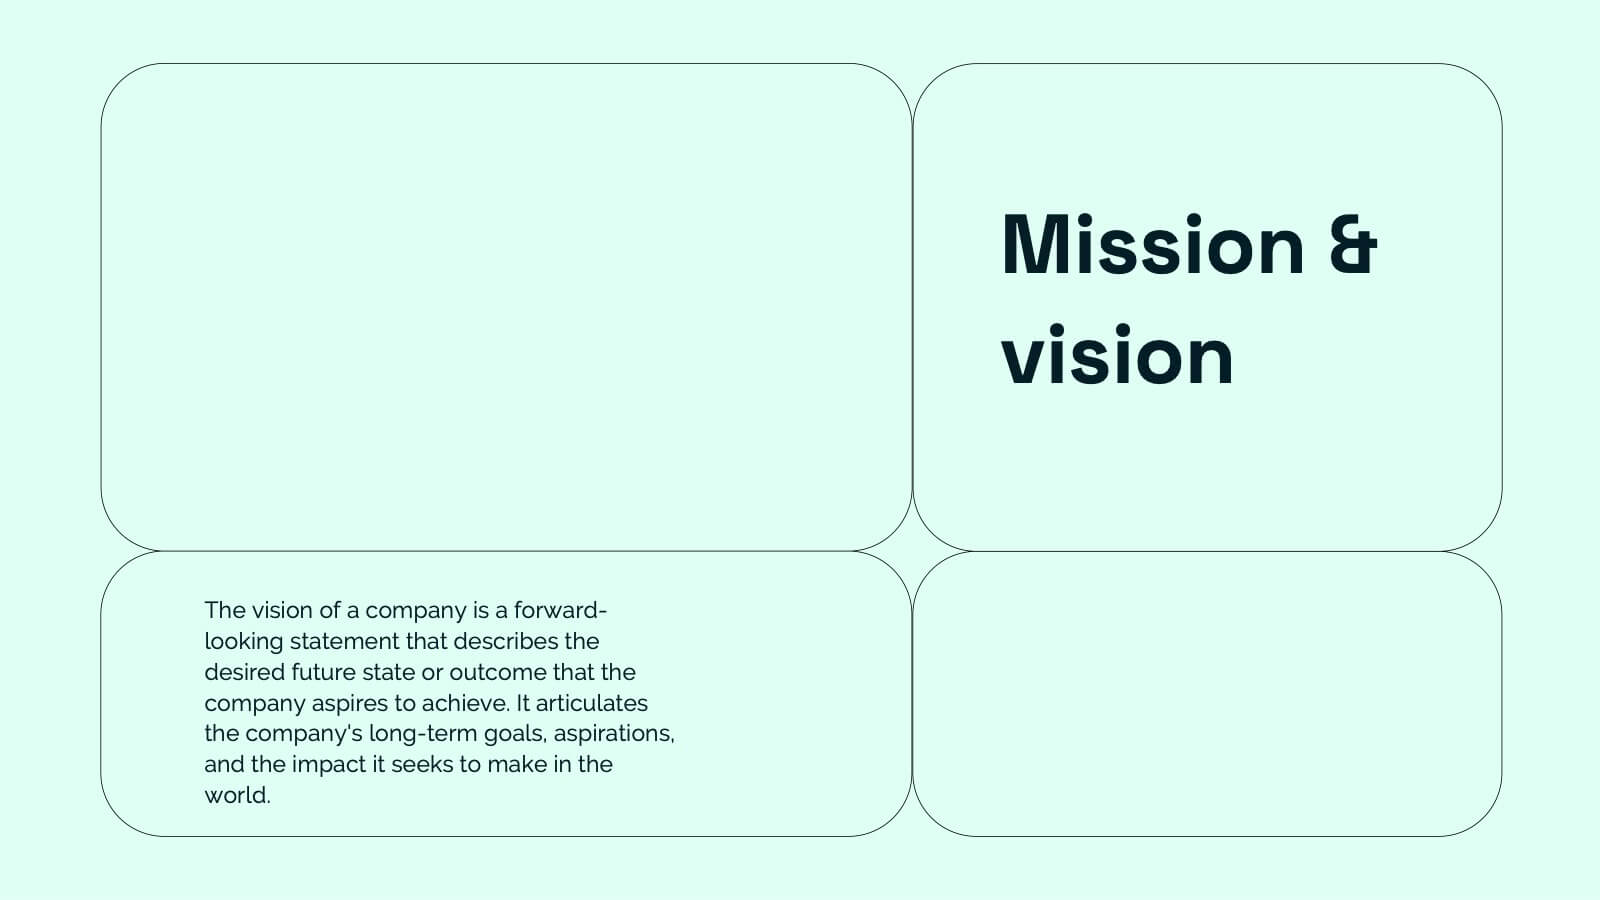
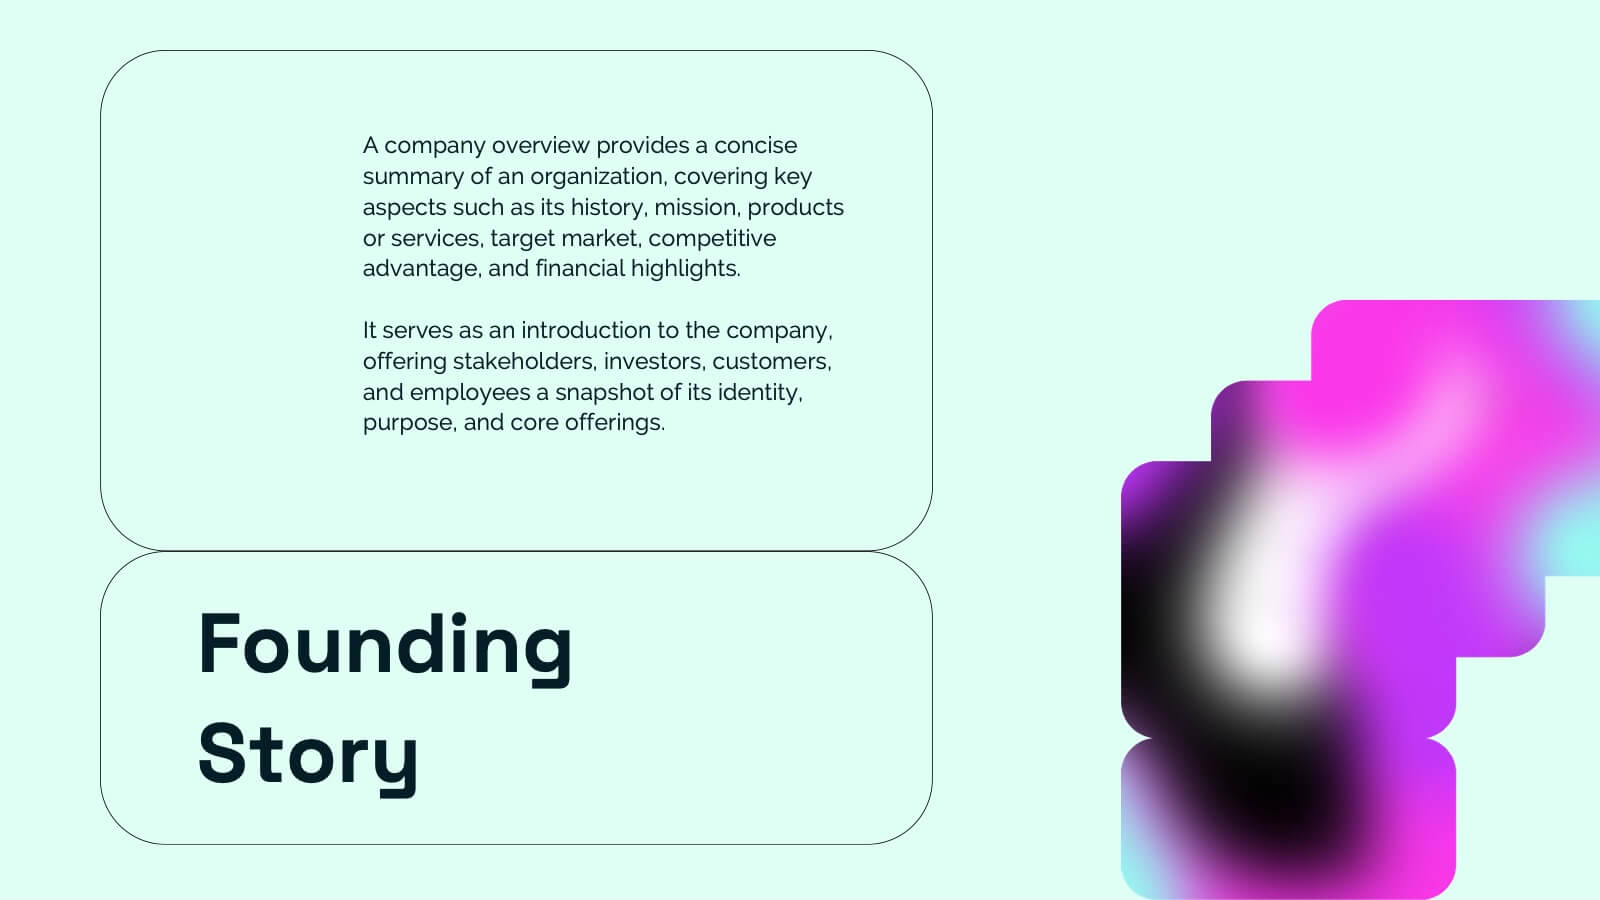
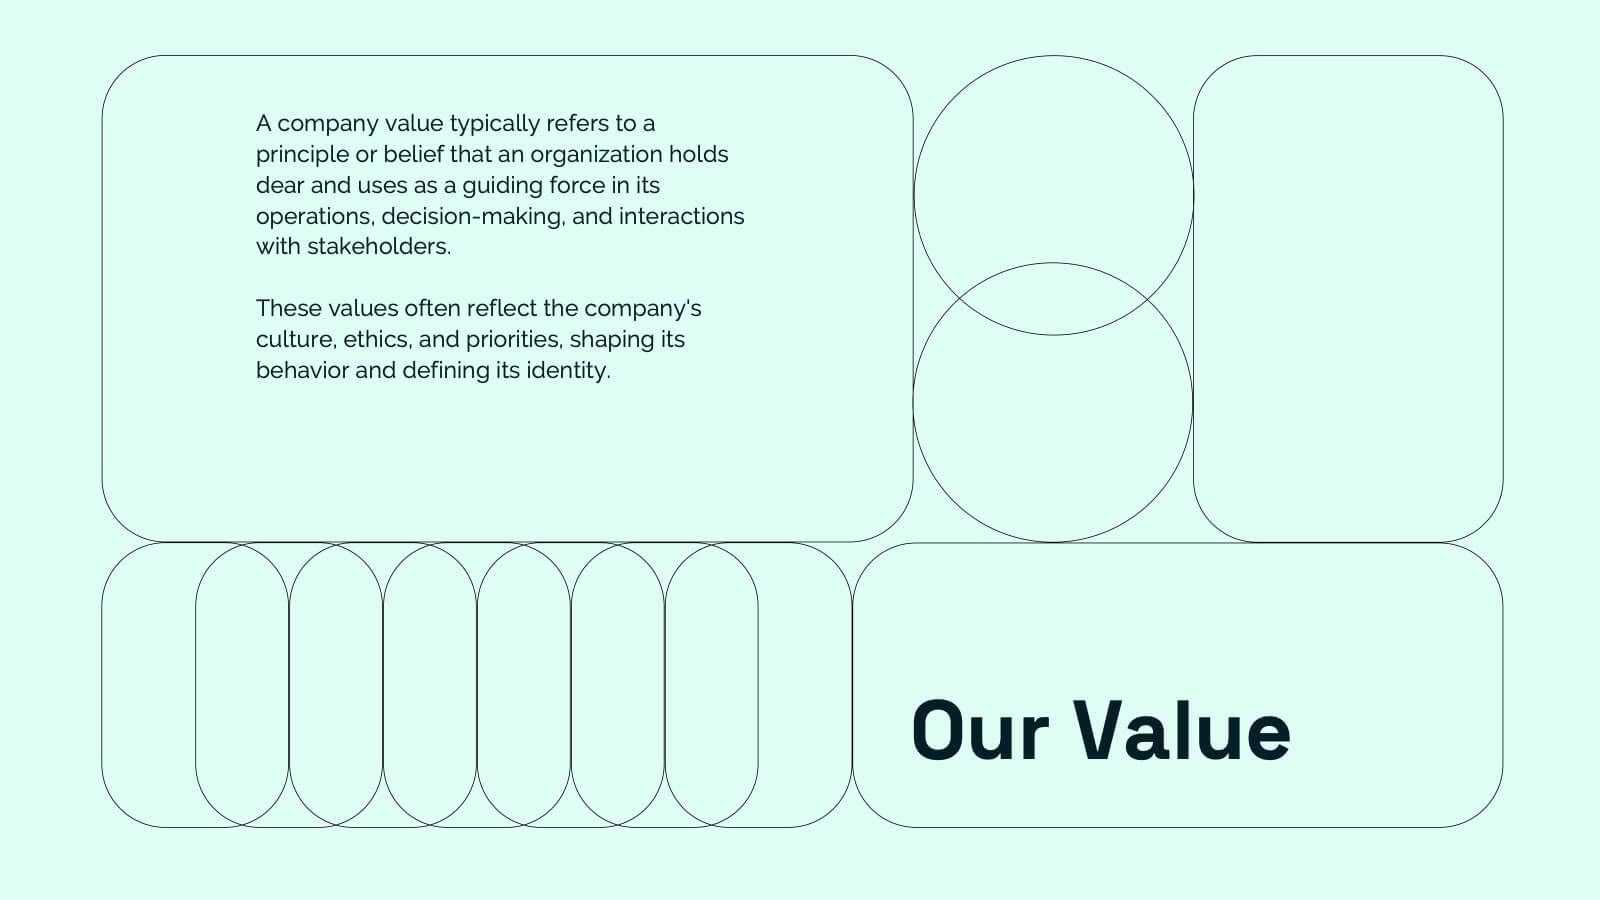
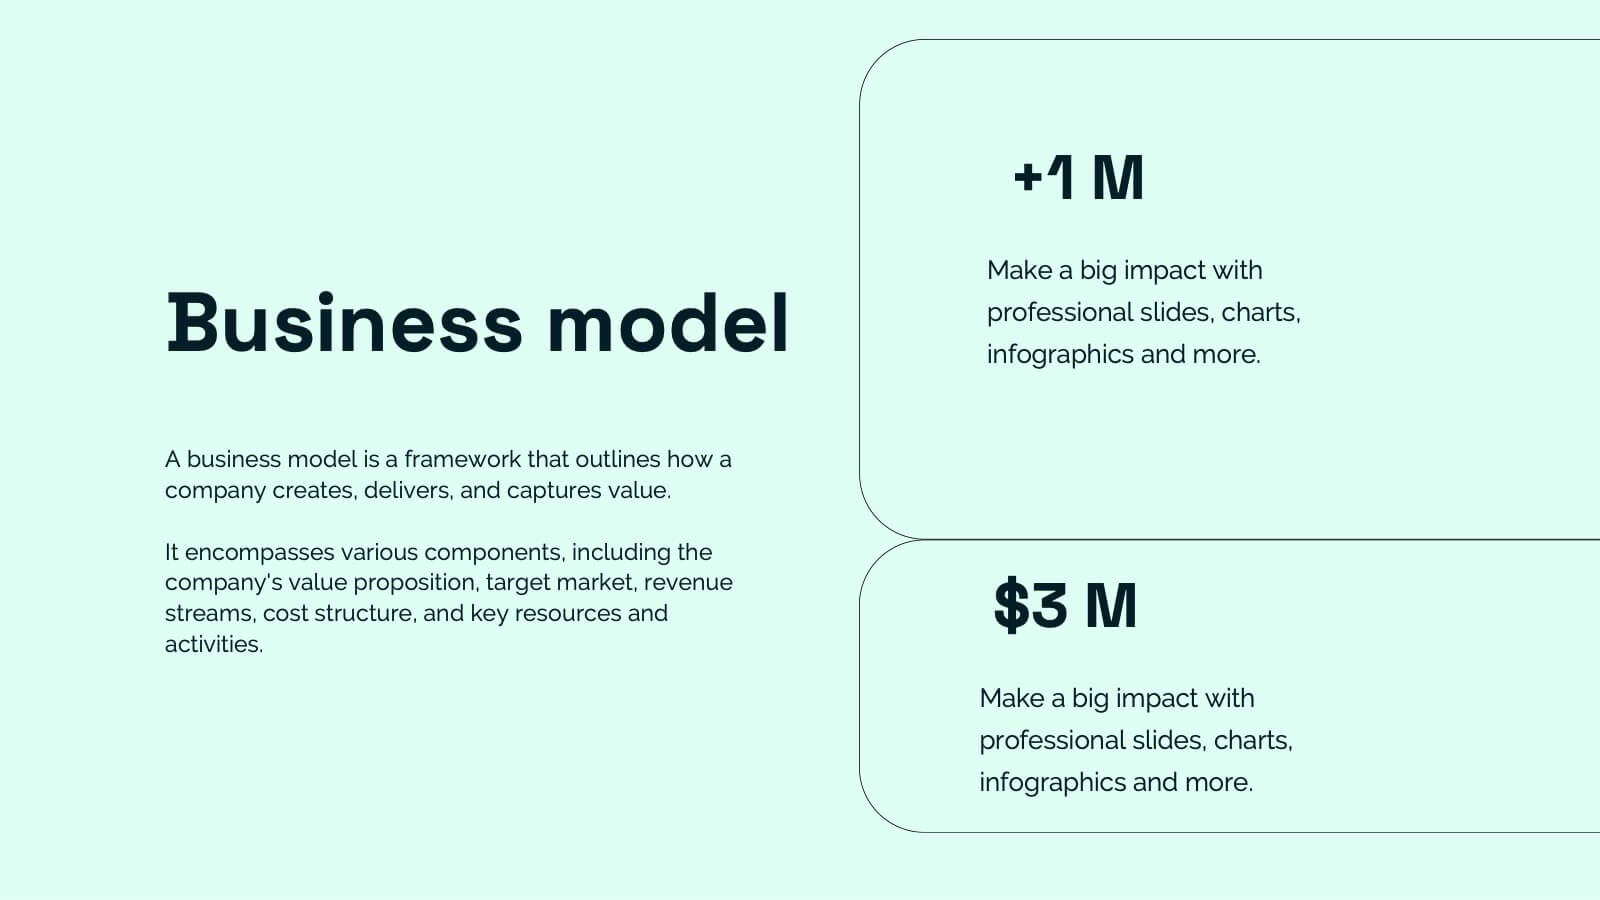
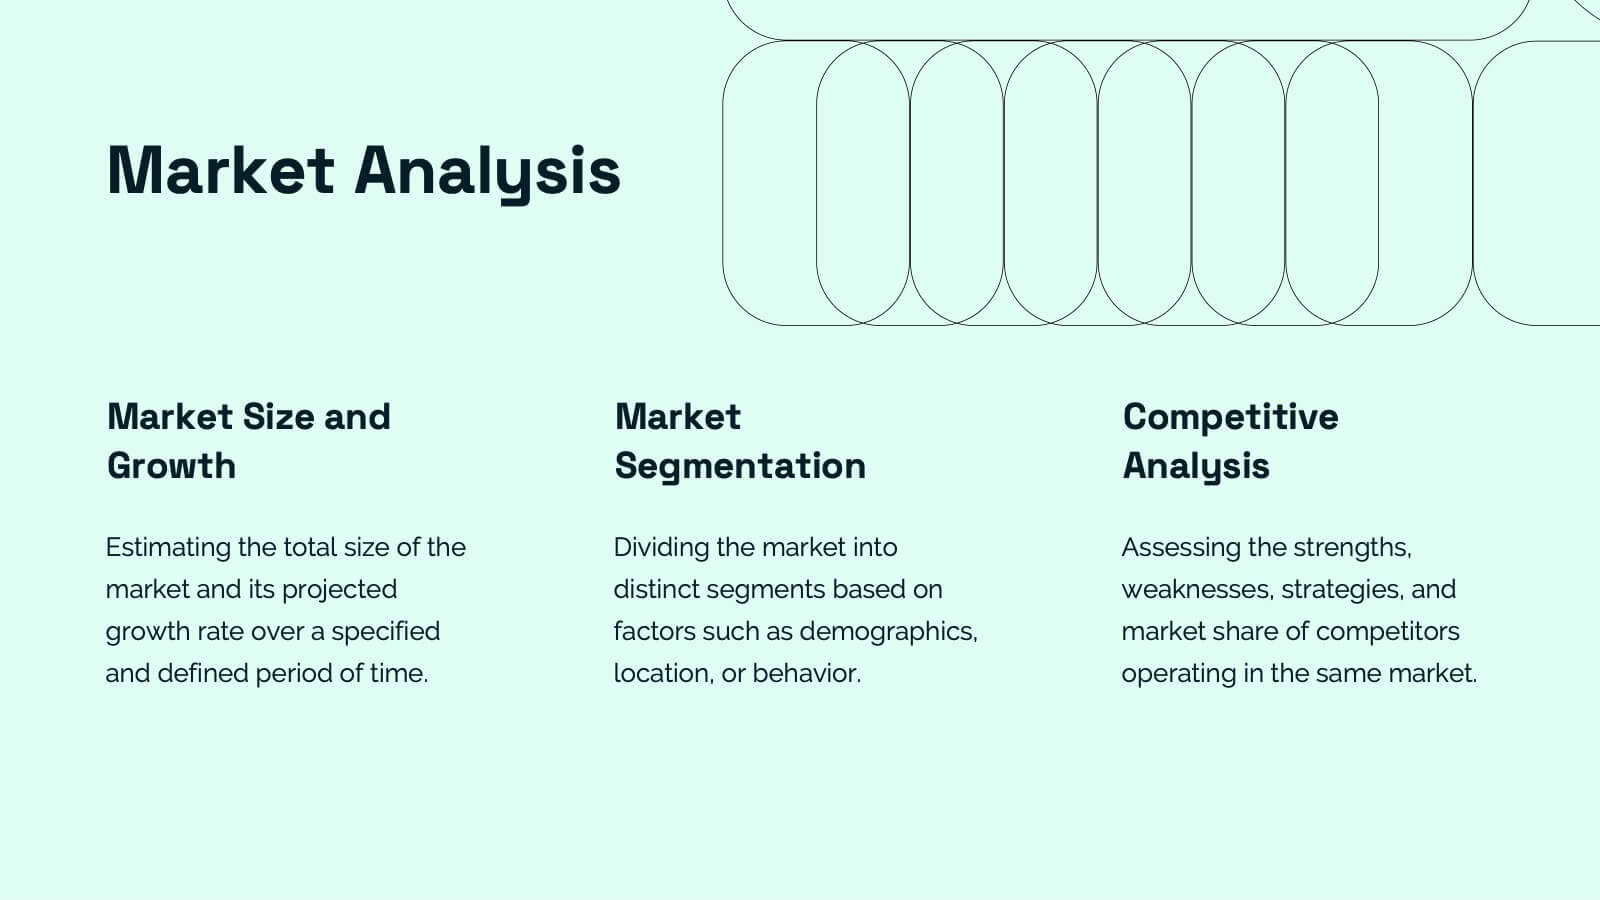
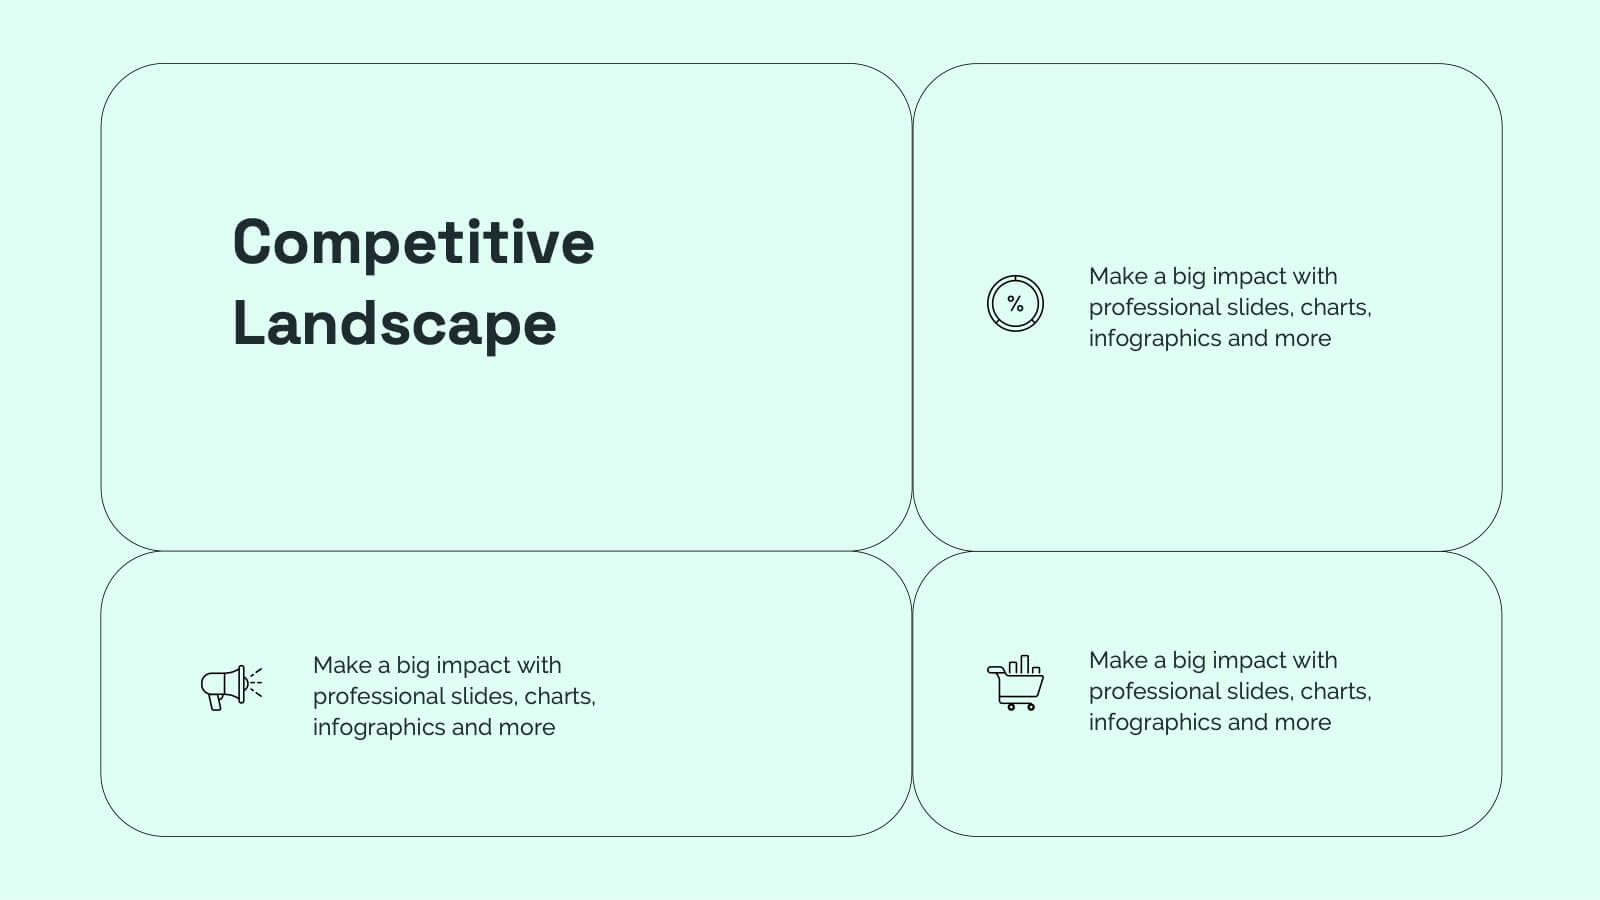
Nymph Startup Pitch Deck Presentation
This startup pitch deck template covers all the essentials for presenting a business. It includes slides for mission and vision, business model, market analysis, value proposition, and financial overview. Easily customizable for any startup industry, this modern design makes presenting your ideas a breeze. Compatible with PowerPoint, Keynote, and Google Slides.


20 diapositivas
Axisflare Artist Portfolio Presentation
Showcase your creative journey with this vibrant artist portfolio template, featuring sections for project highlights, philosophy, style, and client testimonials. Ideal for presenting your work and artistic approach, this template is compatible with PowerPoint, Keynote, and Google Slides for seamless presentation across various platforms.


7 diapositivas
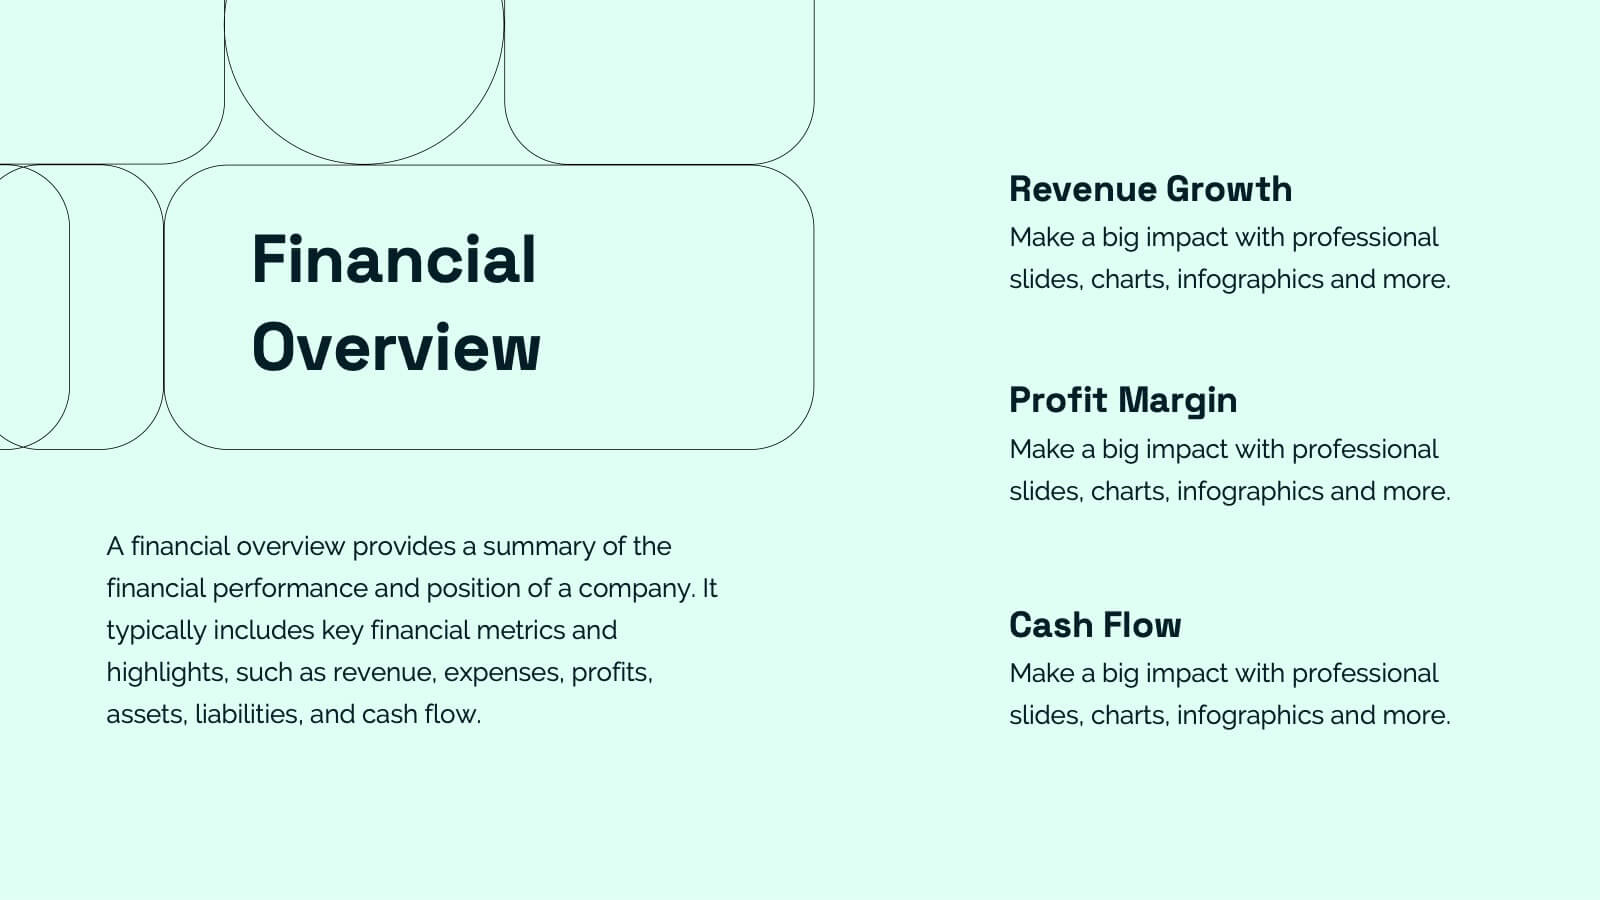
Company Profile Overview Infographic
This set of company profile templates is expertly designed to help organizations succinctly and effectively convey their corporate identity and core values. Ideal for businesses seeking to outline their brand, history, and capabilities, each template is structured to enhance the presentation of company data to stakeholders and clients. The templates feature professional layouts that prioritize ease of reading and aesthetic appeal, ensuring that critical information like company achievements, mission, and service offerings are highlighted effectively. The designs incorporate a clean, contemporary style with ample space for customization, allowing companies to adapt the visuals and text to match their branding requirements. This adaptability makes the templates suitable for a wide range of industries and purposes, from corporate introductions and annual reports to marketing materials and business proposals. By providing a coherent structure that businesses can personalize with their specific details, these templates serve as a valuable tool in building a strong, professional image. They offer practical solutions for companies to present themselves in a polished and organized manner, fostering a positive impression among potential investors, clients, and partners.


5 diapositivas
Hidden Layers Iceberg Presentation
Reveal what lies beneath the surface with this Hidden Layers Iceberg Presentation. Ideal for explaining visible outcomes versus underlying causes, it’s perfect for business, psychology, or education topics. Clearly segmented layers with labeled callouts enhance clarity. Fully customizable in PowerPoint, Keynote, and Google Slides for effortless professional use.


5 diapositivas
Hierarchical Pyramid Diagram Presentation
The "Hierarchical Pyramid Diagram Presentation" template is designed to effectively represent organizational structures, data hierarchies, or step-by-step processes. This versatile template features a layered pyramid structure, enabling clear visualization of relationships and dependencies between different levels or components within a system. Ideal for business presentations, strategy discussions, and educational materials, this template aids in conveying complex information in a straightforward and visually appealing manner. The use of distinct colors for each level enhances readability, making it easier to identify and discuss each segment in detail during presentations.


6 diapositivas
Market Differentiation with Blue Ocean Strategy Presentation
Set your brand apart with our Market Differentiation with Blue Ocean Strategy template. This visually compelling tool helps you chart a course through uncharted business waters, emphasizing innovation in cost management, value creation, and buyer engagement. Compatible with PowerPoint, Keynote, and Google Slides, it’s perfect for presenting strategic insights that escape the competitive red ocean into the clear, blue waters of uncontested market space.


5 diapositivas
Team Roles and Responsibilities Matrix Presentation
Define accountability with this Team Roles and Responsibilities Matrix. Clearly map tasks to team members using RACI codes (Responsible, Accountable, Consulted, Informed). Ideal for project planning, cross-functional alignment, and team coordination. Fully editable and compatible with PowerPoint, Keynote, and Google Slides to suit any workflow or team structure.


2 diapositivas
Office Interview Scenes Illustrations
Elevate your Interview experience with our office interview scenes illustrations pack! This is a burst of high-energy and lightheartedness that infuses the often nerve-wracking interview process with a touch of excitement and fun. These illustrations seamlessly fit into PowerPoint, Google Slides, and Keynote. Add a splash of color and playfulness to the serious nature of interviews, creating an environment where both interviewers and candidates can feel at ease!


8 diapositivas
Territorial Reach Map of United States Presentation
Showcase your national footprint with the Territorial Reach Map of United States Presentation. This slide visually highlights specific states and aligns them with key data points—perfect for illustrating market penetration, sales concentration, or operational presence. Designed for clarity and impact, it's fully customizable in Canva, PowerPoint, and Google Slides.


23 diapositivas
Echo Startup Pitch Deck Template Presentation
This sleek pitch deck template is perfect for showcasing your startup’s potential. Highlight your problem, solutions, revenue model, and unique value proposition in a professional format. It's fully customizable, easy to use, and compatible with PowerPoint, Keynote, and Google Slides, making it ideal for impressing investors.


5 diapositivas
Myths & Facts About Cases Of Mass Hysteria Infographics
Delve into the intriguing world of collective human psychology with myths & facts about cases of mass hysteria infographics. Set against an engaging purple backdrop, these infographics are designed to captivate, educate, and debunk misconceptions surrounding mass hysteria events. Ideal for historians, educators, psychologists, and students. The creative use of vibrant colors and compelling icons help in breaking down complex psychological phenomena into understandable content, making it easier to spark discussion on this fascinating subject. Whether it's for academic purposes, or informational content, this template stands out by blending education with intriguing storytelling.


20 diapositivas
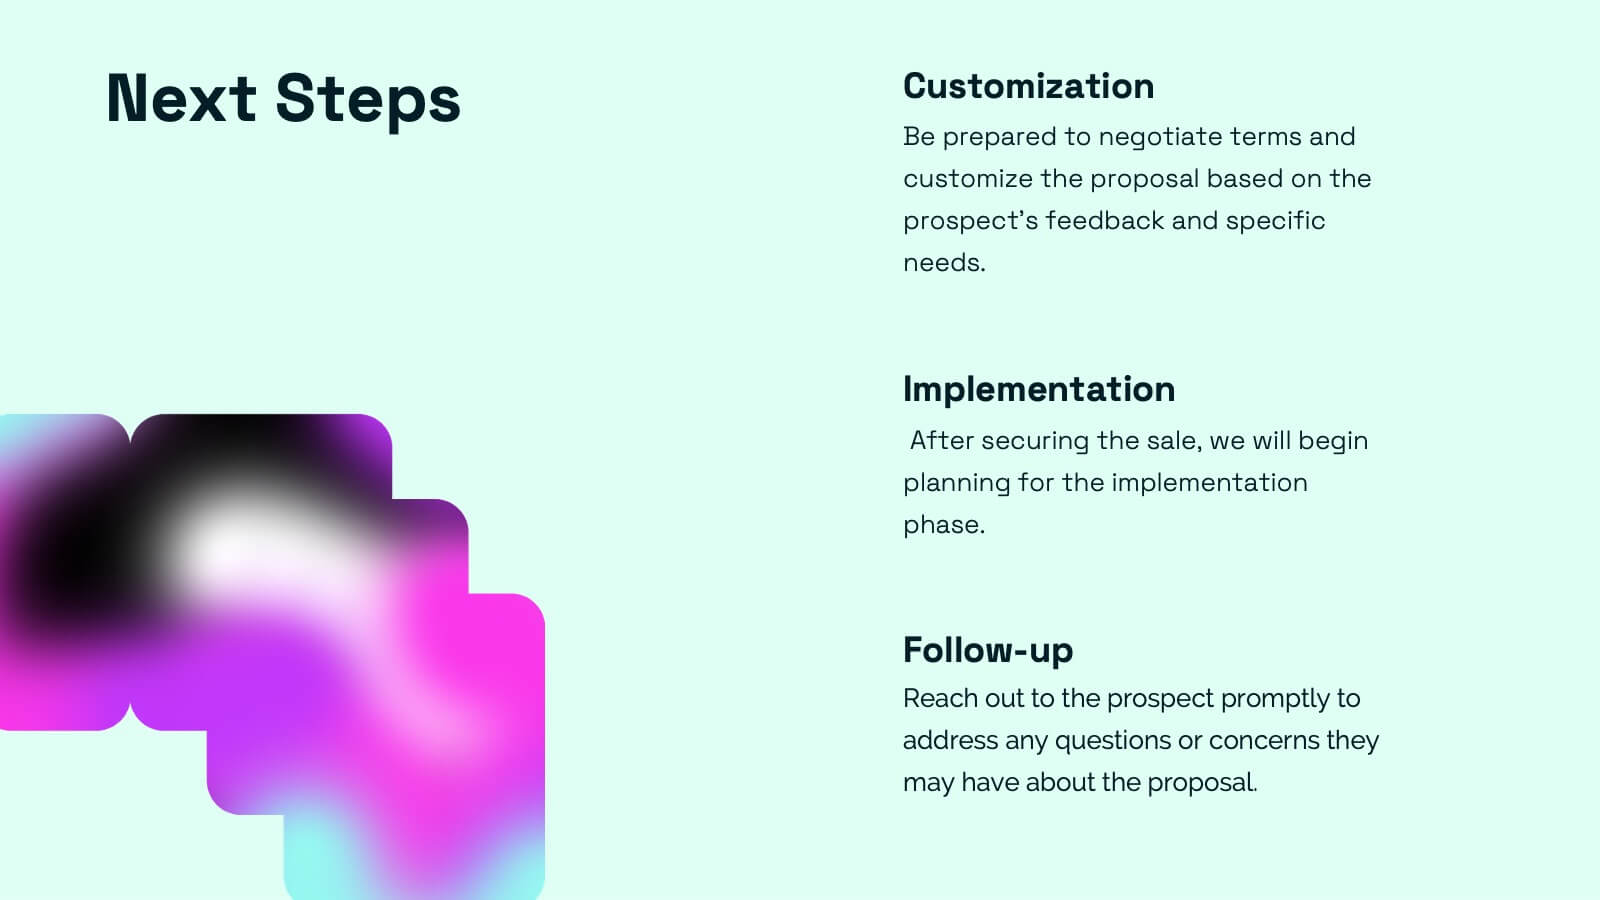
Ascent Design Strategy Proposal Presentation
A minimalist and sleek template ideal for presenting design strategy and development. Includes sections for design brief, audience insights, concept development, design elements, prototyping, and feedback. Suitable for design professionals to showcase visual direction and project timelines. Fully customizable in PowerPoint, Keynote, and Google Slides for versatile presentations.


5 diapositivas
Customer Behavior and Demographics Presentation
Break down customer segments with clarity using this behavior and demographics infographic set. Featuring colorful cylinder diagrams and intuitive labels, these slides are ideal for presenting consumer insights, age groups, behavior trends, and buyer types. Fully editable in PowerPoint, Keynote, and Google Slides—perfect for marketers, analysts, and business development teams.


10 diapositivas
Territorial Insights with South America Map Presentation
Unlock regional clarity with the Territorial Insights with South America Map Presentation. This editable slide visualizes country-specific highlights using a modern grid-based map layout, customizable color zones, and label connectors to break down key insights. Ideal for sales analysis, market entry strategies, or logistics reporting. Compatible with PowerPoint, Keynote, Google Slides, and Canva.