


Características


¿Tienes alguna pregunta?
Recomendar


7 diapositivas
Organizational Structure with 7S Model Presentation
Bring your organizational framework to life with a clean, modern layout that makes complex relationships easy to understand. This presentation helps you explain key elements, show how they connect, and guide strategic discussions with clarity and structure. Fully editable and compatible with PowerPoint, Keynote, and Google Slides.


10 diapositivas
Business Performance Metrics Presentation
Track and display your business metrics effectively with the "Business Performance Metrics" presentation templates. These visually engaging slides are designed to help you present key performance indicators in a clear and structured manner, enhancing understanding and decision-making. Ideal for corporate presentations, these templates are fully compatible with PowerPoint, Keynote, and Google Slides, ensuring seamless integration into your workflow.


7 diapositivas
Job Objective Infographic Presentation
A Job Objective is an introduction that summarizes an individual's career goals and objectives. This Template is designed to create a visual experience with a focus of solving your objectives, showcasing your expertise and individuality. Use this infographic to help you visually communicate your knowledge and skills with a powerful presentation. Highlight your experience, skills and key achievements. You can edit the graphics, photos, data and text in this template so that it fits your needs perfectly. All you have to do is just download this template in PowerPoint, Keynote, or Google Slides.


6 diapositivas
Scientific Experiment Presentation Template Presentation
Showcase your research with clarity using this Scientific Experiment Presentation Template. Featuring lab-themed visuals like microscopes and molecular diagrams, it’s perfect for sharing hypotheses, procedures, and results. Ideal for science professionals and students, this editable deck works seamlessly with PowerPoint, Keynote, and Google Slides for compelling, educational presentations.


10 diapositivas
Marketing Wheels Strategy Presentation
Turn your marketing process into a powerful visual story with this dynamic circular design. Each stage connects seamlessly to highlight planning, execution, and performance insights. Perfect for illustrating campaigns, workflows, or business strategies. Fully customizable and compatible with PowerPoint, Keynote, and Google Slides for effortless editing and presentation.


6 diapositivas
Process Cycle Wheel Slide Presentation
Give your workflow a visual rhythm with this clean, circular layout designed to highlight every stage of a process with clarity and style. Perfect for showcasing cycles, systems, or strategies, it keeps your message organized and engaging. Fully editable and compatible with PowerPoint, Keynote, and Google Slides.


4 diapositivas
Business Gap Analysis Framework
Visually bridge the gap between current and desired performance with this impactful Business Gap Analysis slide. Featuring a creative cliff and bridge design with editable text sections, it's ideal for strategic planning, performance improvement, and operational reviews. Fully compatible with PowerPoint, Keynote, and Google Slides.


6 diapositivas
Asia Map Population Infographic
Explore the demographic dynamics of Asia with our collection of infographic slides, designed to illustrate the population statistics across the continent. These templates are an essential tool for educators, demographers, and business analysts, providing detailed visualizations of population distribution, density, and growth trends. Each infographic combines the map of Asia with engaging graphical elements such as bar graphs, pie charts, and statistical callouts that emphasize key data points like total population, urban versus rural distribution, and demographic forecasts. The color-coding and spatial arrangements on the map effectively highlight variations and trends across different countries and regions, making complex data easy to understand and visually compelling. Fully customizable, these templates allow you to adjust the data presentation to suit specific needs or focuses, such as comparing population growth rates or highlighting demographic challenges. Whether used in presentations, reports, or educational materials, these slides offer a comprehensive and accessible way to communicate the demographic landscape of Asia.


5 diapositivas
Business Vision Statement Presentation
Focus on the future with our "Business Vision Statement" presentation template, ideal for outlining your company's aspirations. This visually engaging template helps you present your business's core values and long-term goals, ensuring alignment across the organization. Perfect for strategic meetings and stakeholder presentations, it is compatible with PowerPoint, Keynote, and Google Slides. This template is a crucial tool for leaders looking to inspire and direct their teams towards common objectives.


26 diapositivas
Digital Art Tools and Techniques Presentation
Unleash your creativity with this vibrant presentation on digital art tools and techniques. Covering essential topics like graphic design software, digital brushes, layering methods, and creative workflows, this template helps artists and designers enhance their skills. Fully customizable and compatible with PowerPoint, Keynote, and Google Slides for a seamless and visually stunning presentation experience.


4 diapositivas
Circular Data Flow in Systems Presentation
Visualize relationships and flow within your systems using the Circular Data Flow in Systems Presentation. Ideal for showcasing input-output dynamics, data loops, or stakeholder interaction, this diagram presents centralized nodes with surrounding connectors for clarity. Each element is editable and works seamlessly in PowerPoint, Google Slides, and Canva.


5 diapositivas
Cryptocurrency Market Infographic
Cryptocurrency Infographics can help explain the benefits and risks of investing in cryptocurrency, as well as provide valuable information about different types of crypto and their market trends. You can use this infographic to cover a range of topics related to cryptocurrencies, such as its history, how they work, the different types of crypto, the advantages and disadvantages, and the potential risks and challenges associated with investing. This fully customizable template feature eye catching color schemes along with icons and diagrams to illustrate complex concepts related to cryptocurrencies.


7 diapositivas
Network Marketing Infographic
Network marketing, is a business strategy where salespersons earn income through both direct sales of products or services and by recruiting new salespeople. This infographic template serves as a compass, guiding you through the intricate pathways of this business model and shedding light on the strategies and dynamics that lead to success. Compatible with Powerpoint, Keynote, and Google Slides. Illustrate a network of interconnected nodes to visualize the structure and growth potential of network marketing, demonstrating how each node represents a potential customer or distributor.


4 diapositivas
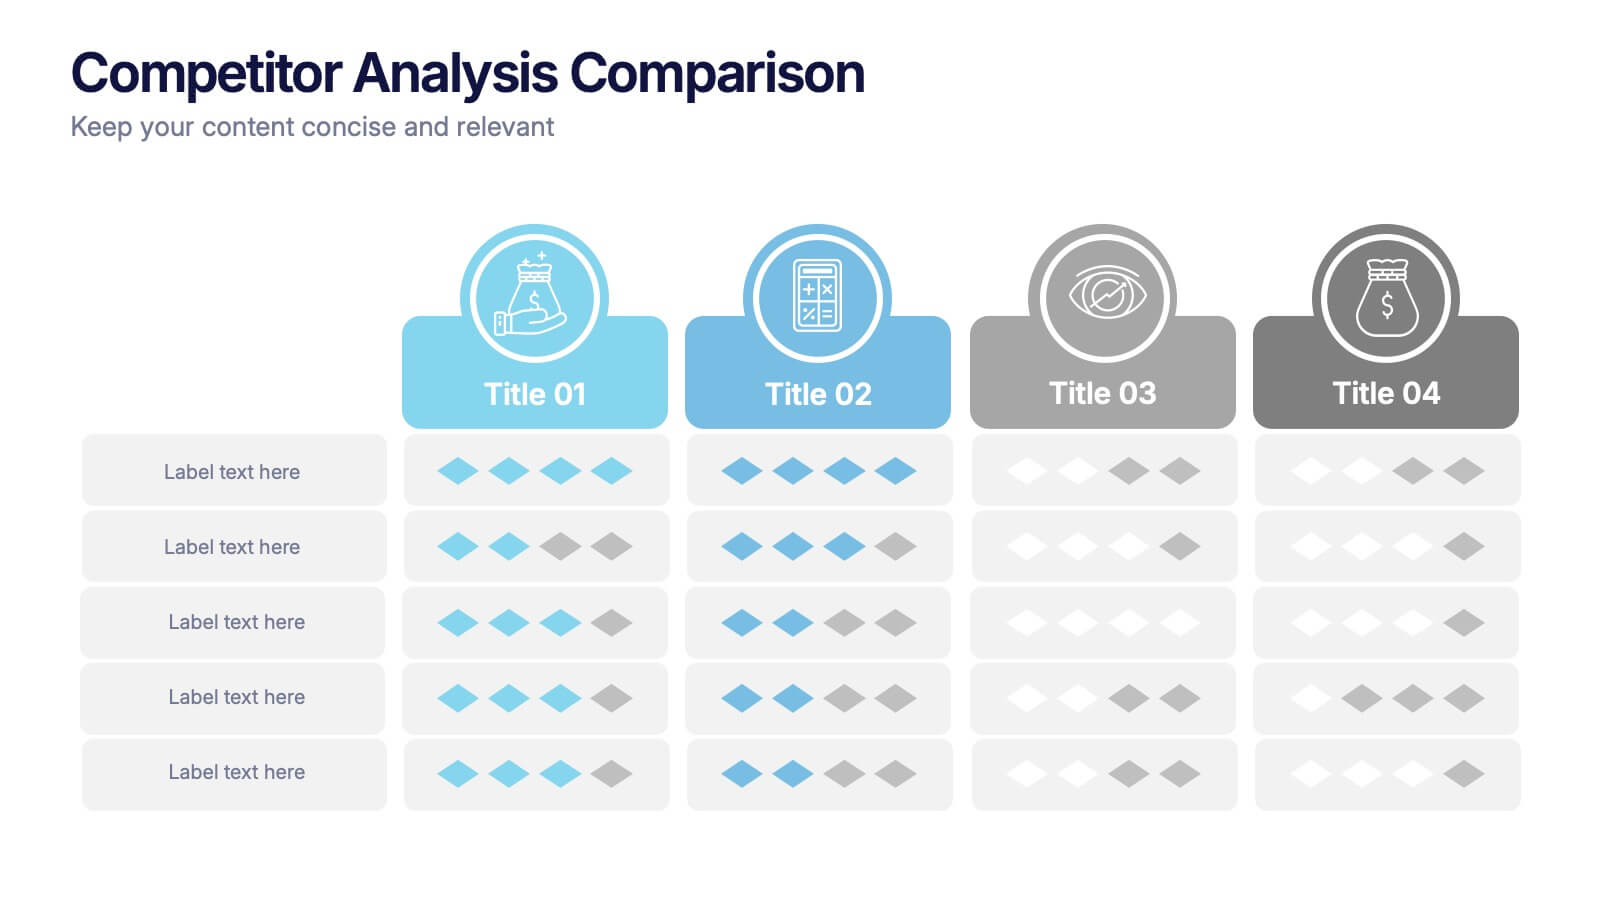
Competitor Analysis Comparison Presentation
Quickly evaluate strengths and weaknesses across your market landscape with this Competitor Analysis Comparison Presentation. Featuring clean tables, icons, and rating visuals, it's ideal for highlighting where your brand stands out. Fully editable in PowerPoint, Keynote, and Google Slides.


4 diapositivas
Sales Funnel Data Presentation
Turn your data into a clear story with a visual flow that shows exactly how leads move from one stage to the next. This presentation helps explain conversion steps, highlight drop-off points, and simplify complex marketing insights. It’s easy to customize and fully compatible with PowerPoint, Keynote, and Google Slides.


4 diapositivas
Creative Thinking and Brain Functions Presentation
Illuminate cognitive processes with the Creative Thinking and Brain Functions Presentation. Featuring a clean mind map-style layout with illustrated heads and title blocks, this slide is ideal for showcasing mental models, decision paths, or concept relationships. Fully editable in PowerPoint, Canva, and Google Slides for effortless customization.


7 diapositivas
Local Sales Infographic
Local sales refer to transactions or sales activities that occur within a specific geographic area or locality. This infographic template is a visual tour through the vibrant world of neighborhood commerce, where small businesses flourish and community connections thrive. This template is designed to encourage your audience to embrace the local sales experience. This invites them to explore and support their community's treasures, fostering a strong local economy. Fully customizable and compatible with Powerpoint, Keynote, and Google Slides. Use visuals like sale tags or a shopping cart to illustrate the concept of attracting shoppers through offers.