


Características


¿Tienes alguna pregunta?
Recomendar


23 diapositivas
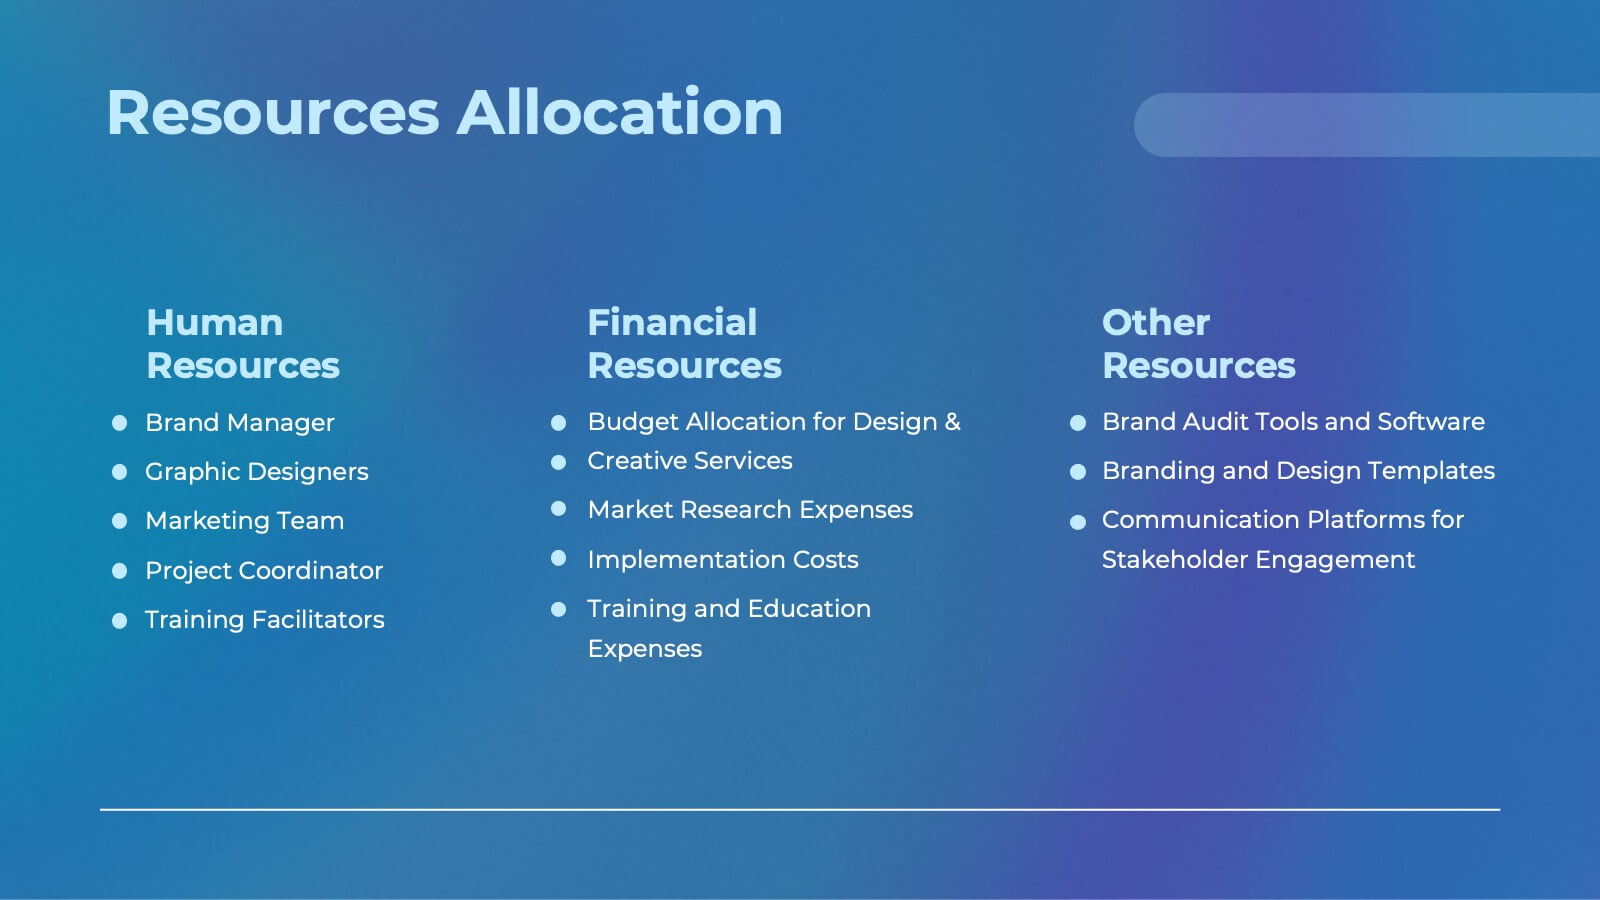
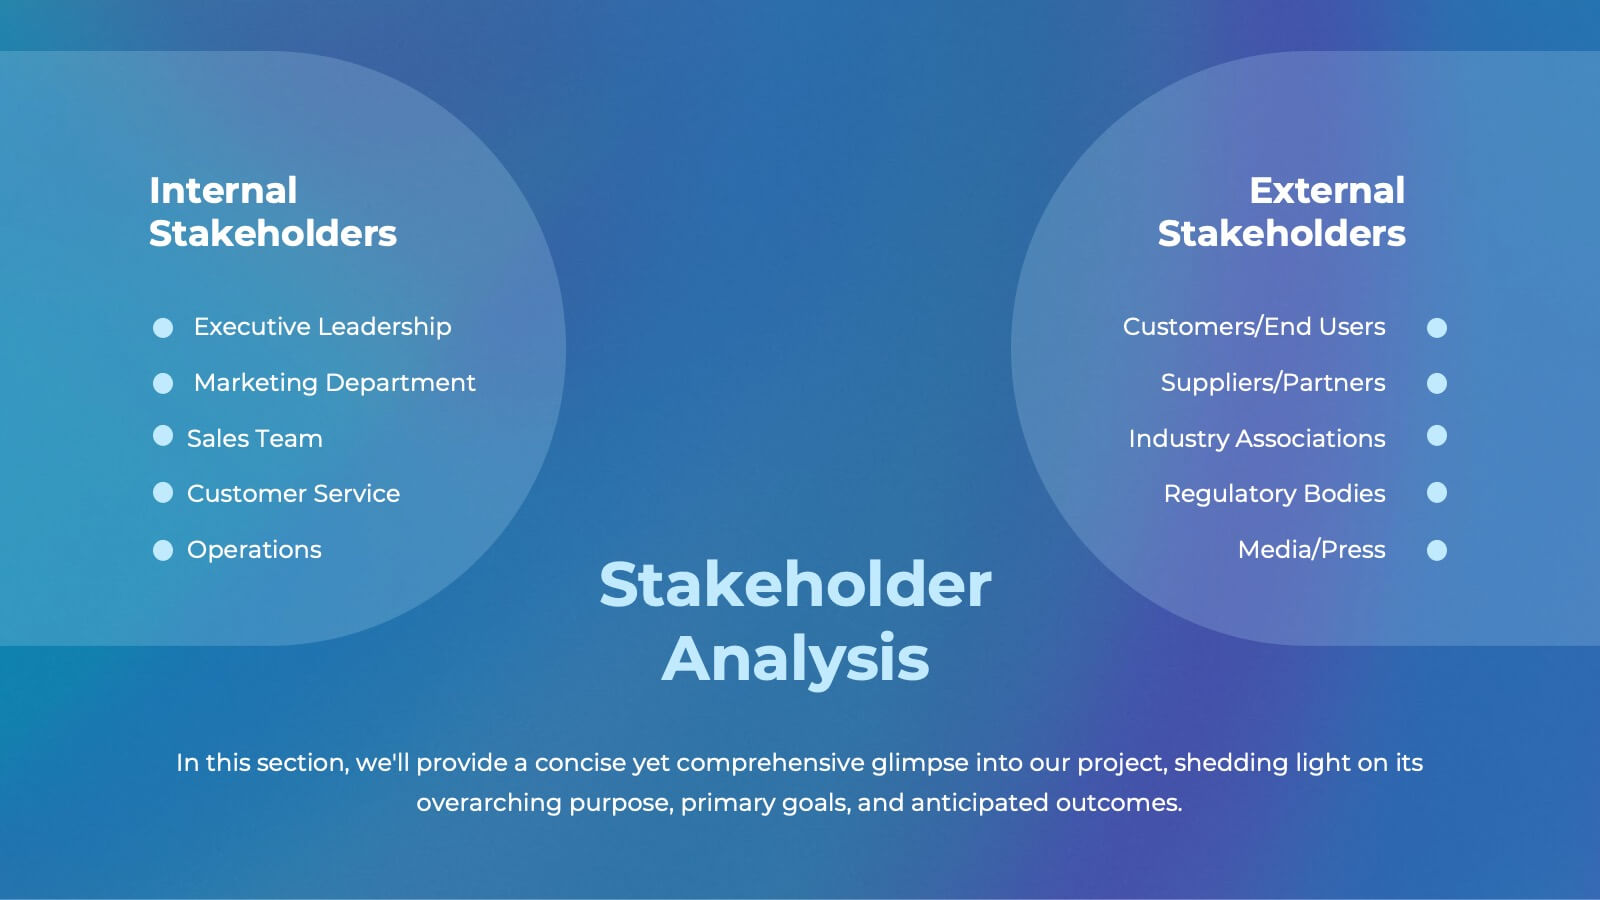
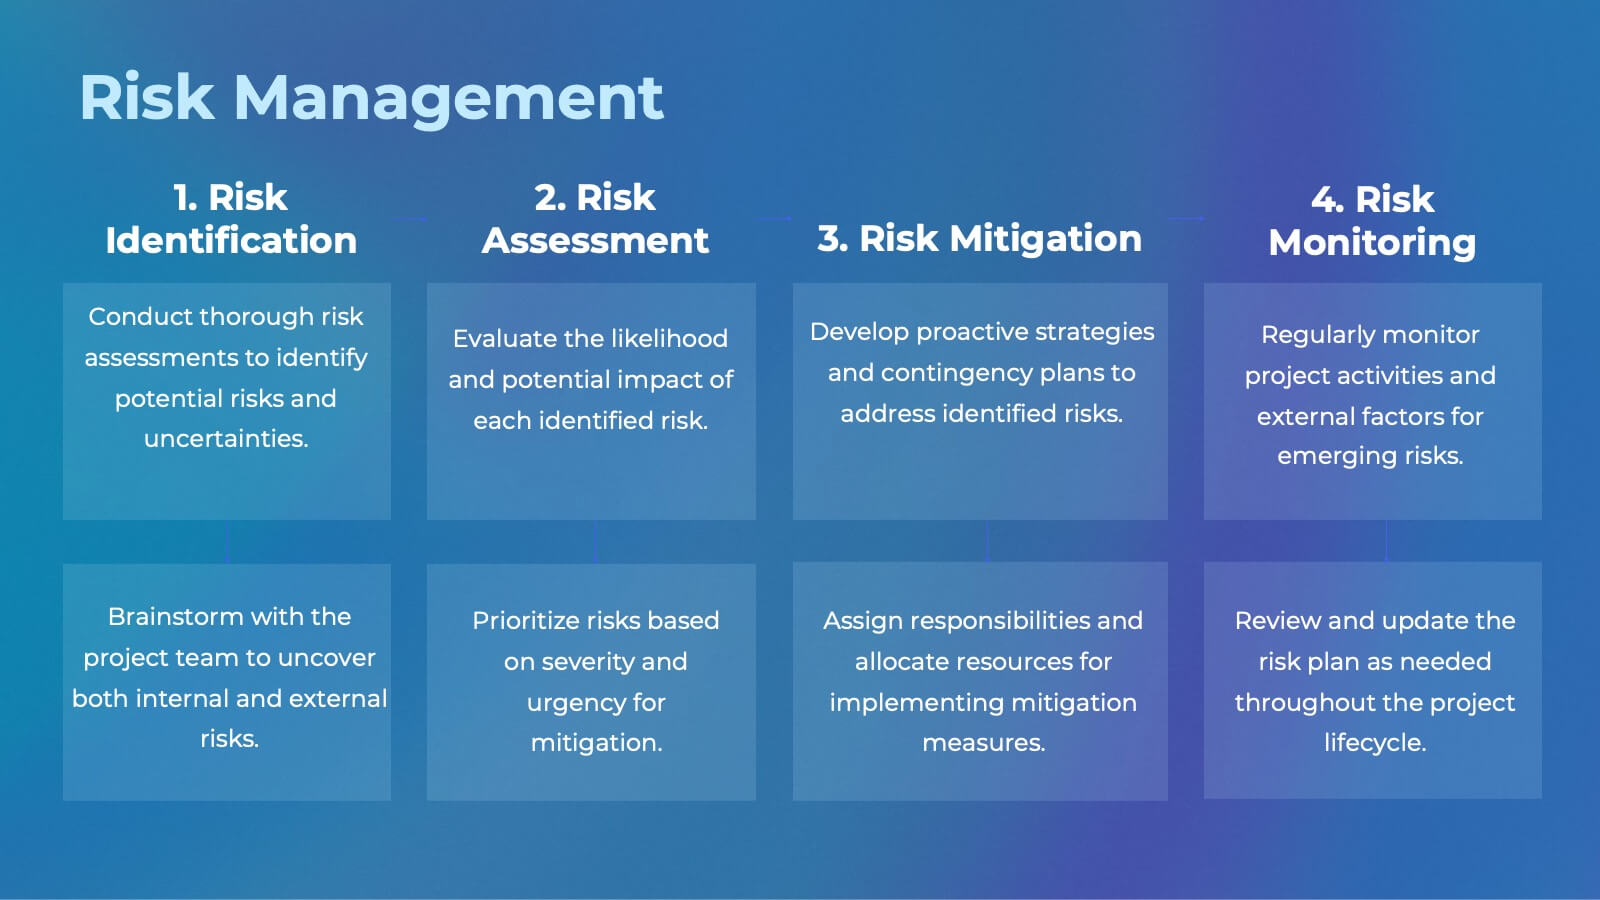
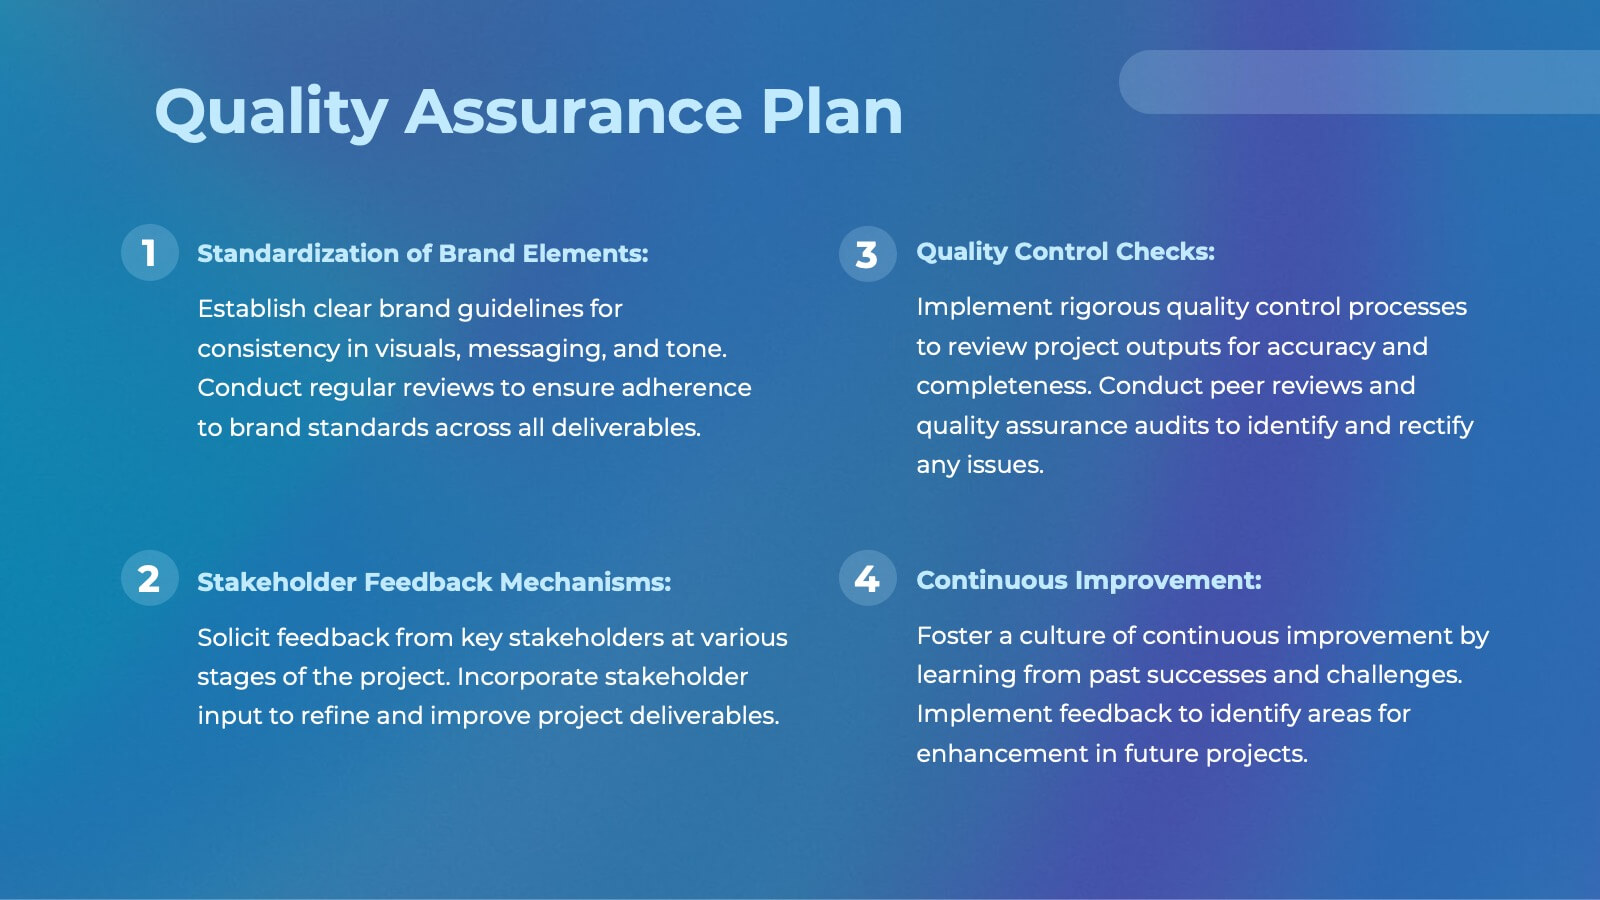
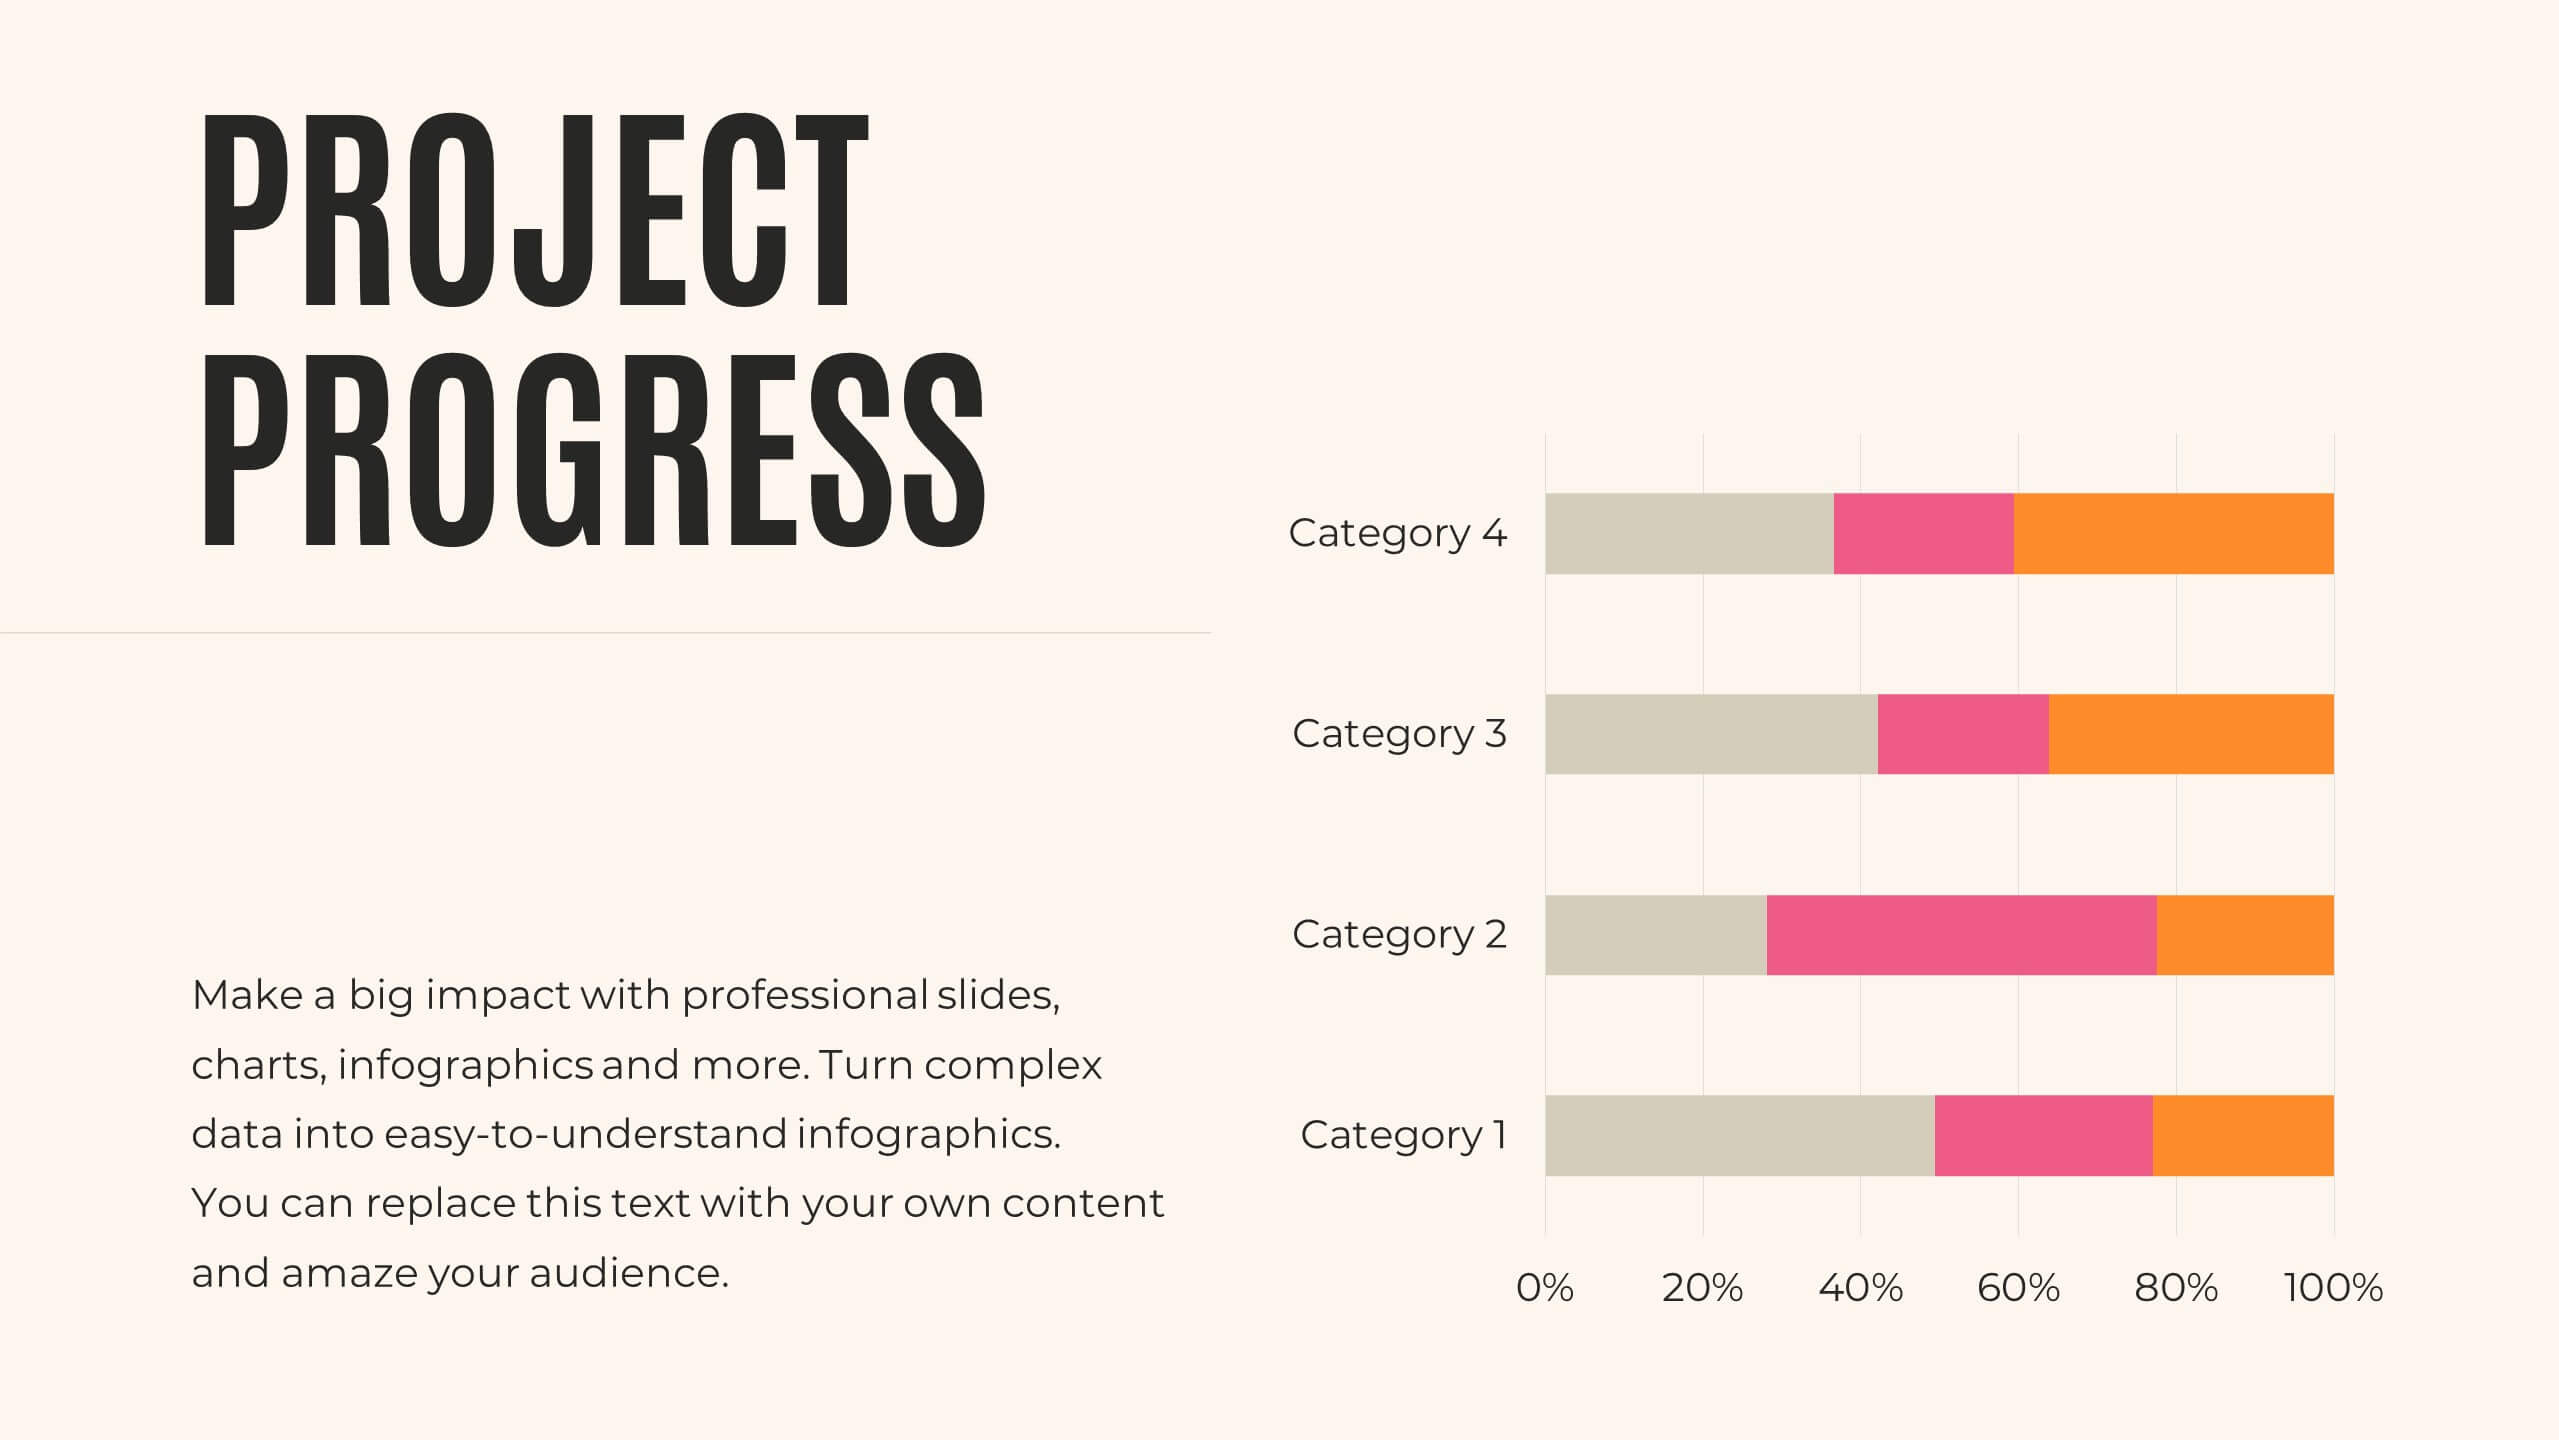
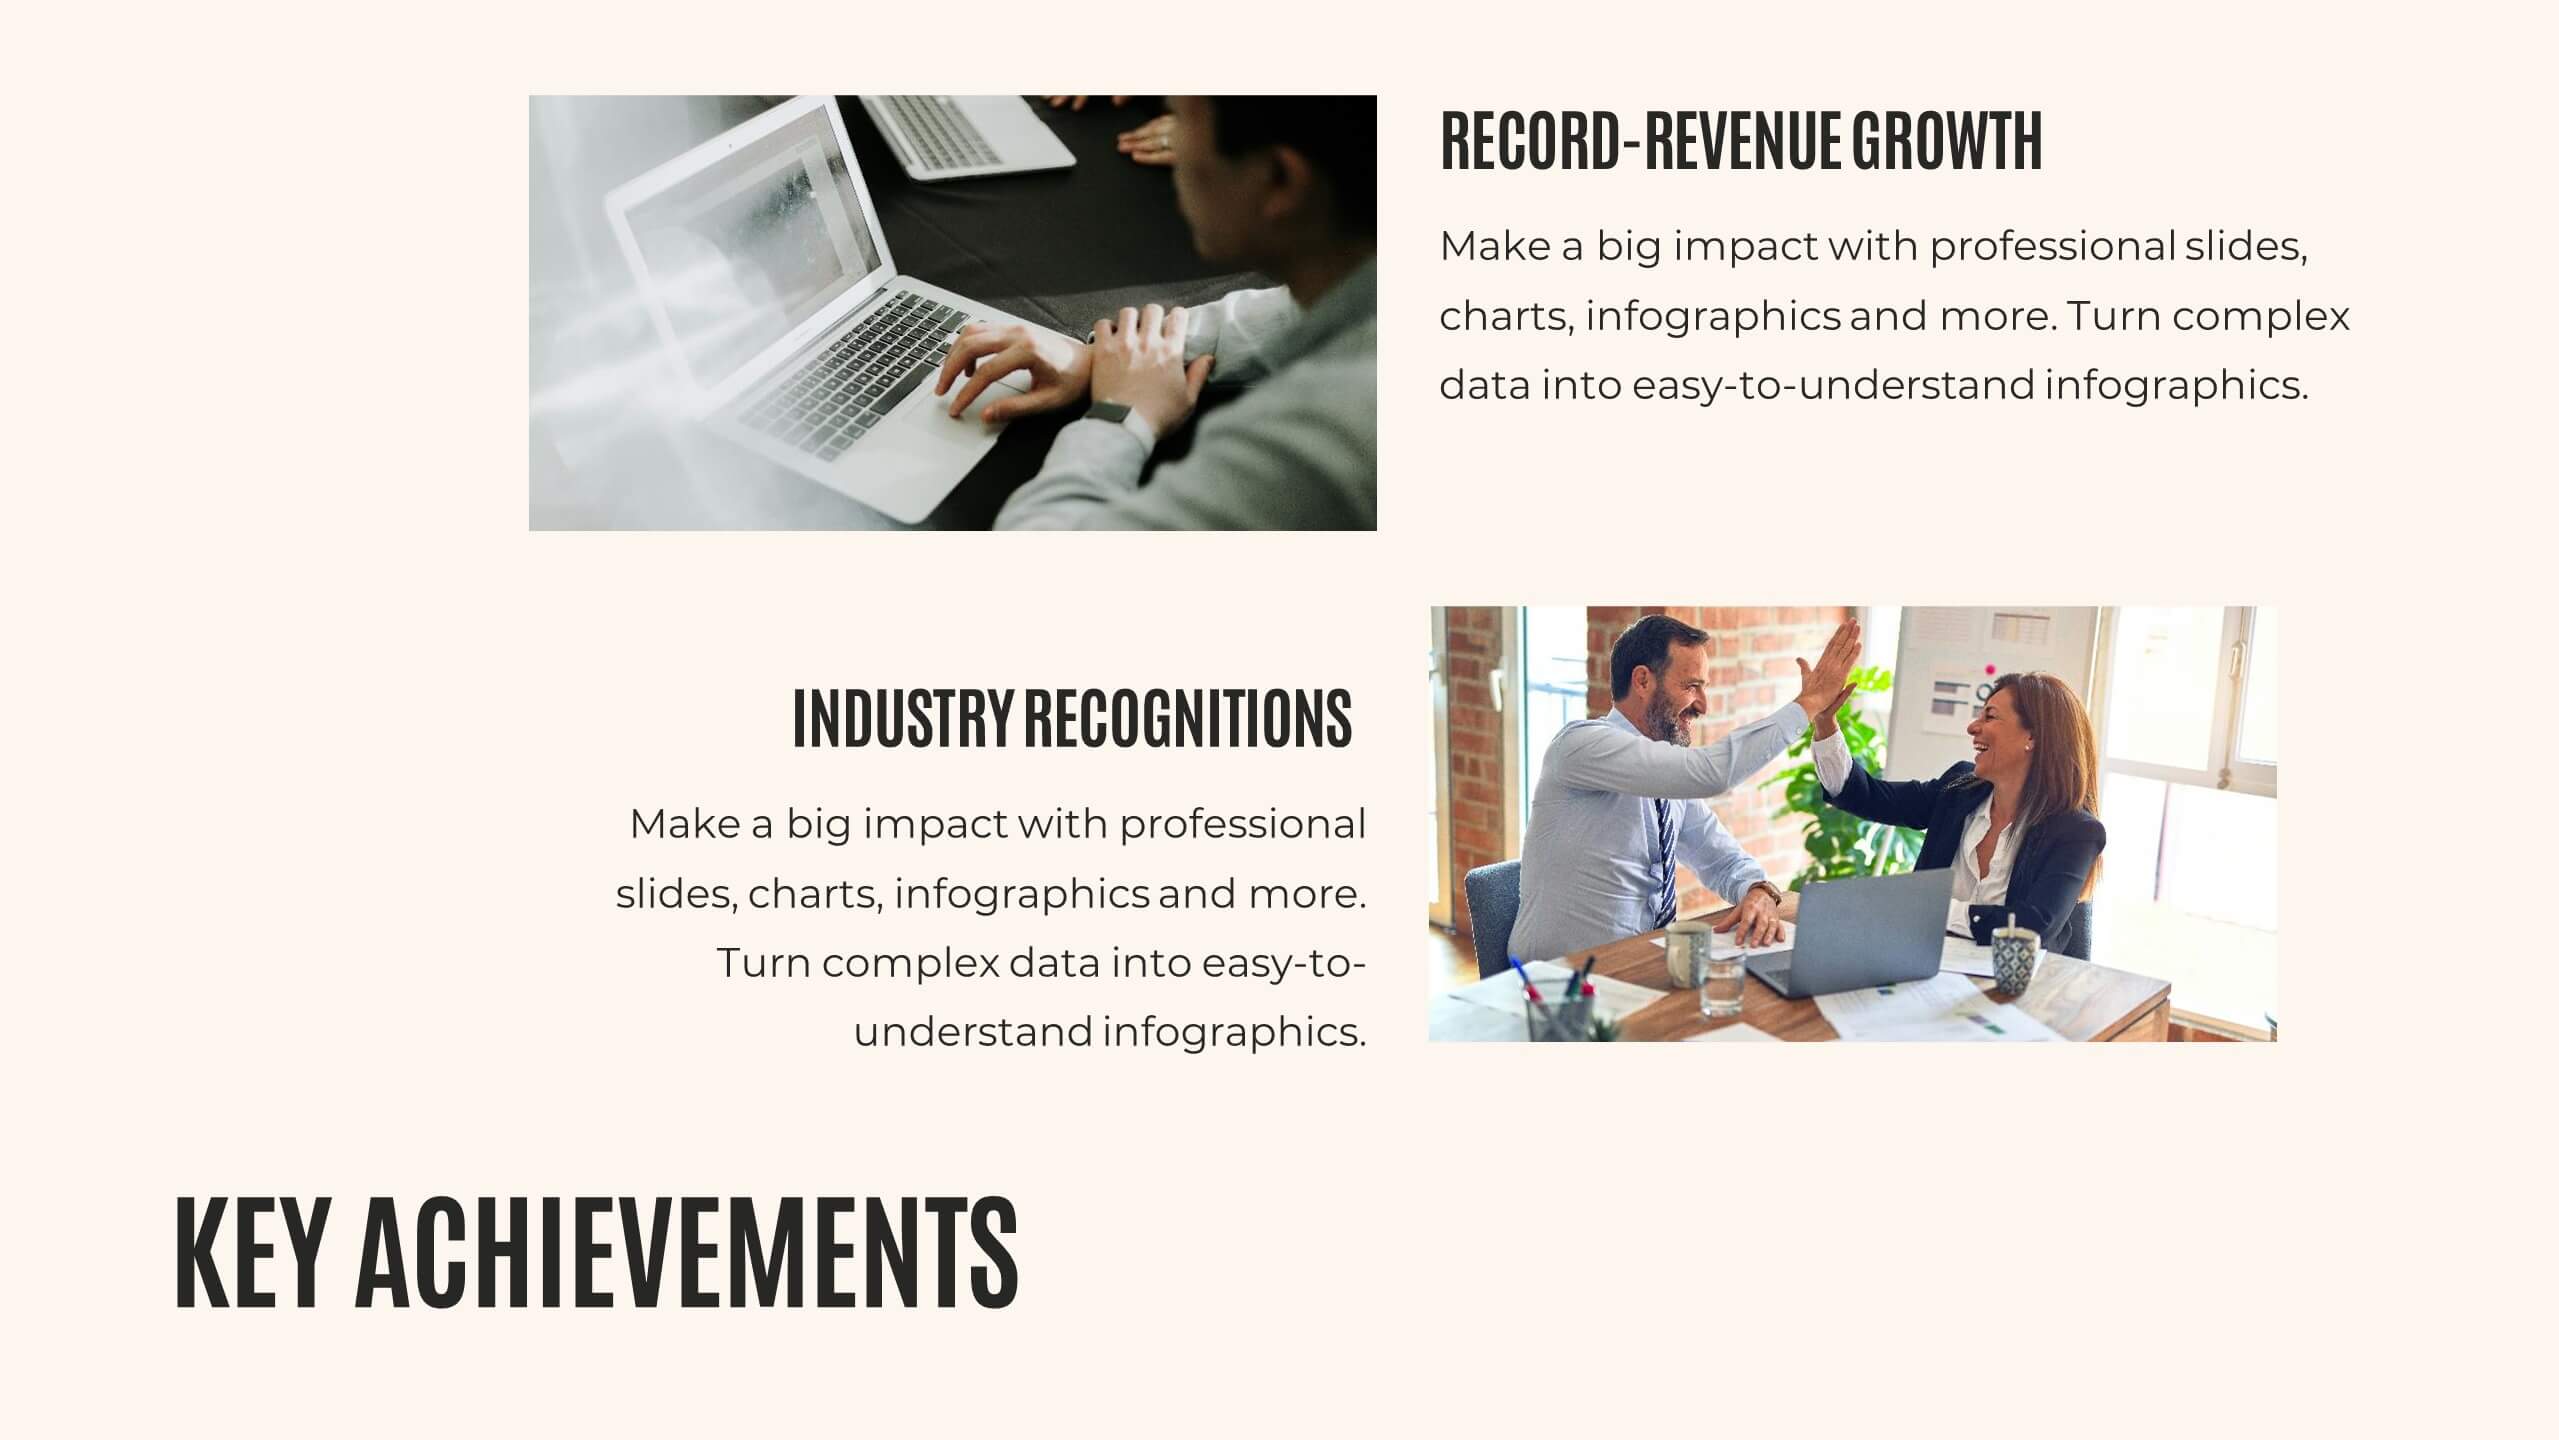
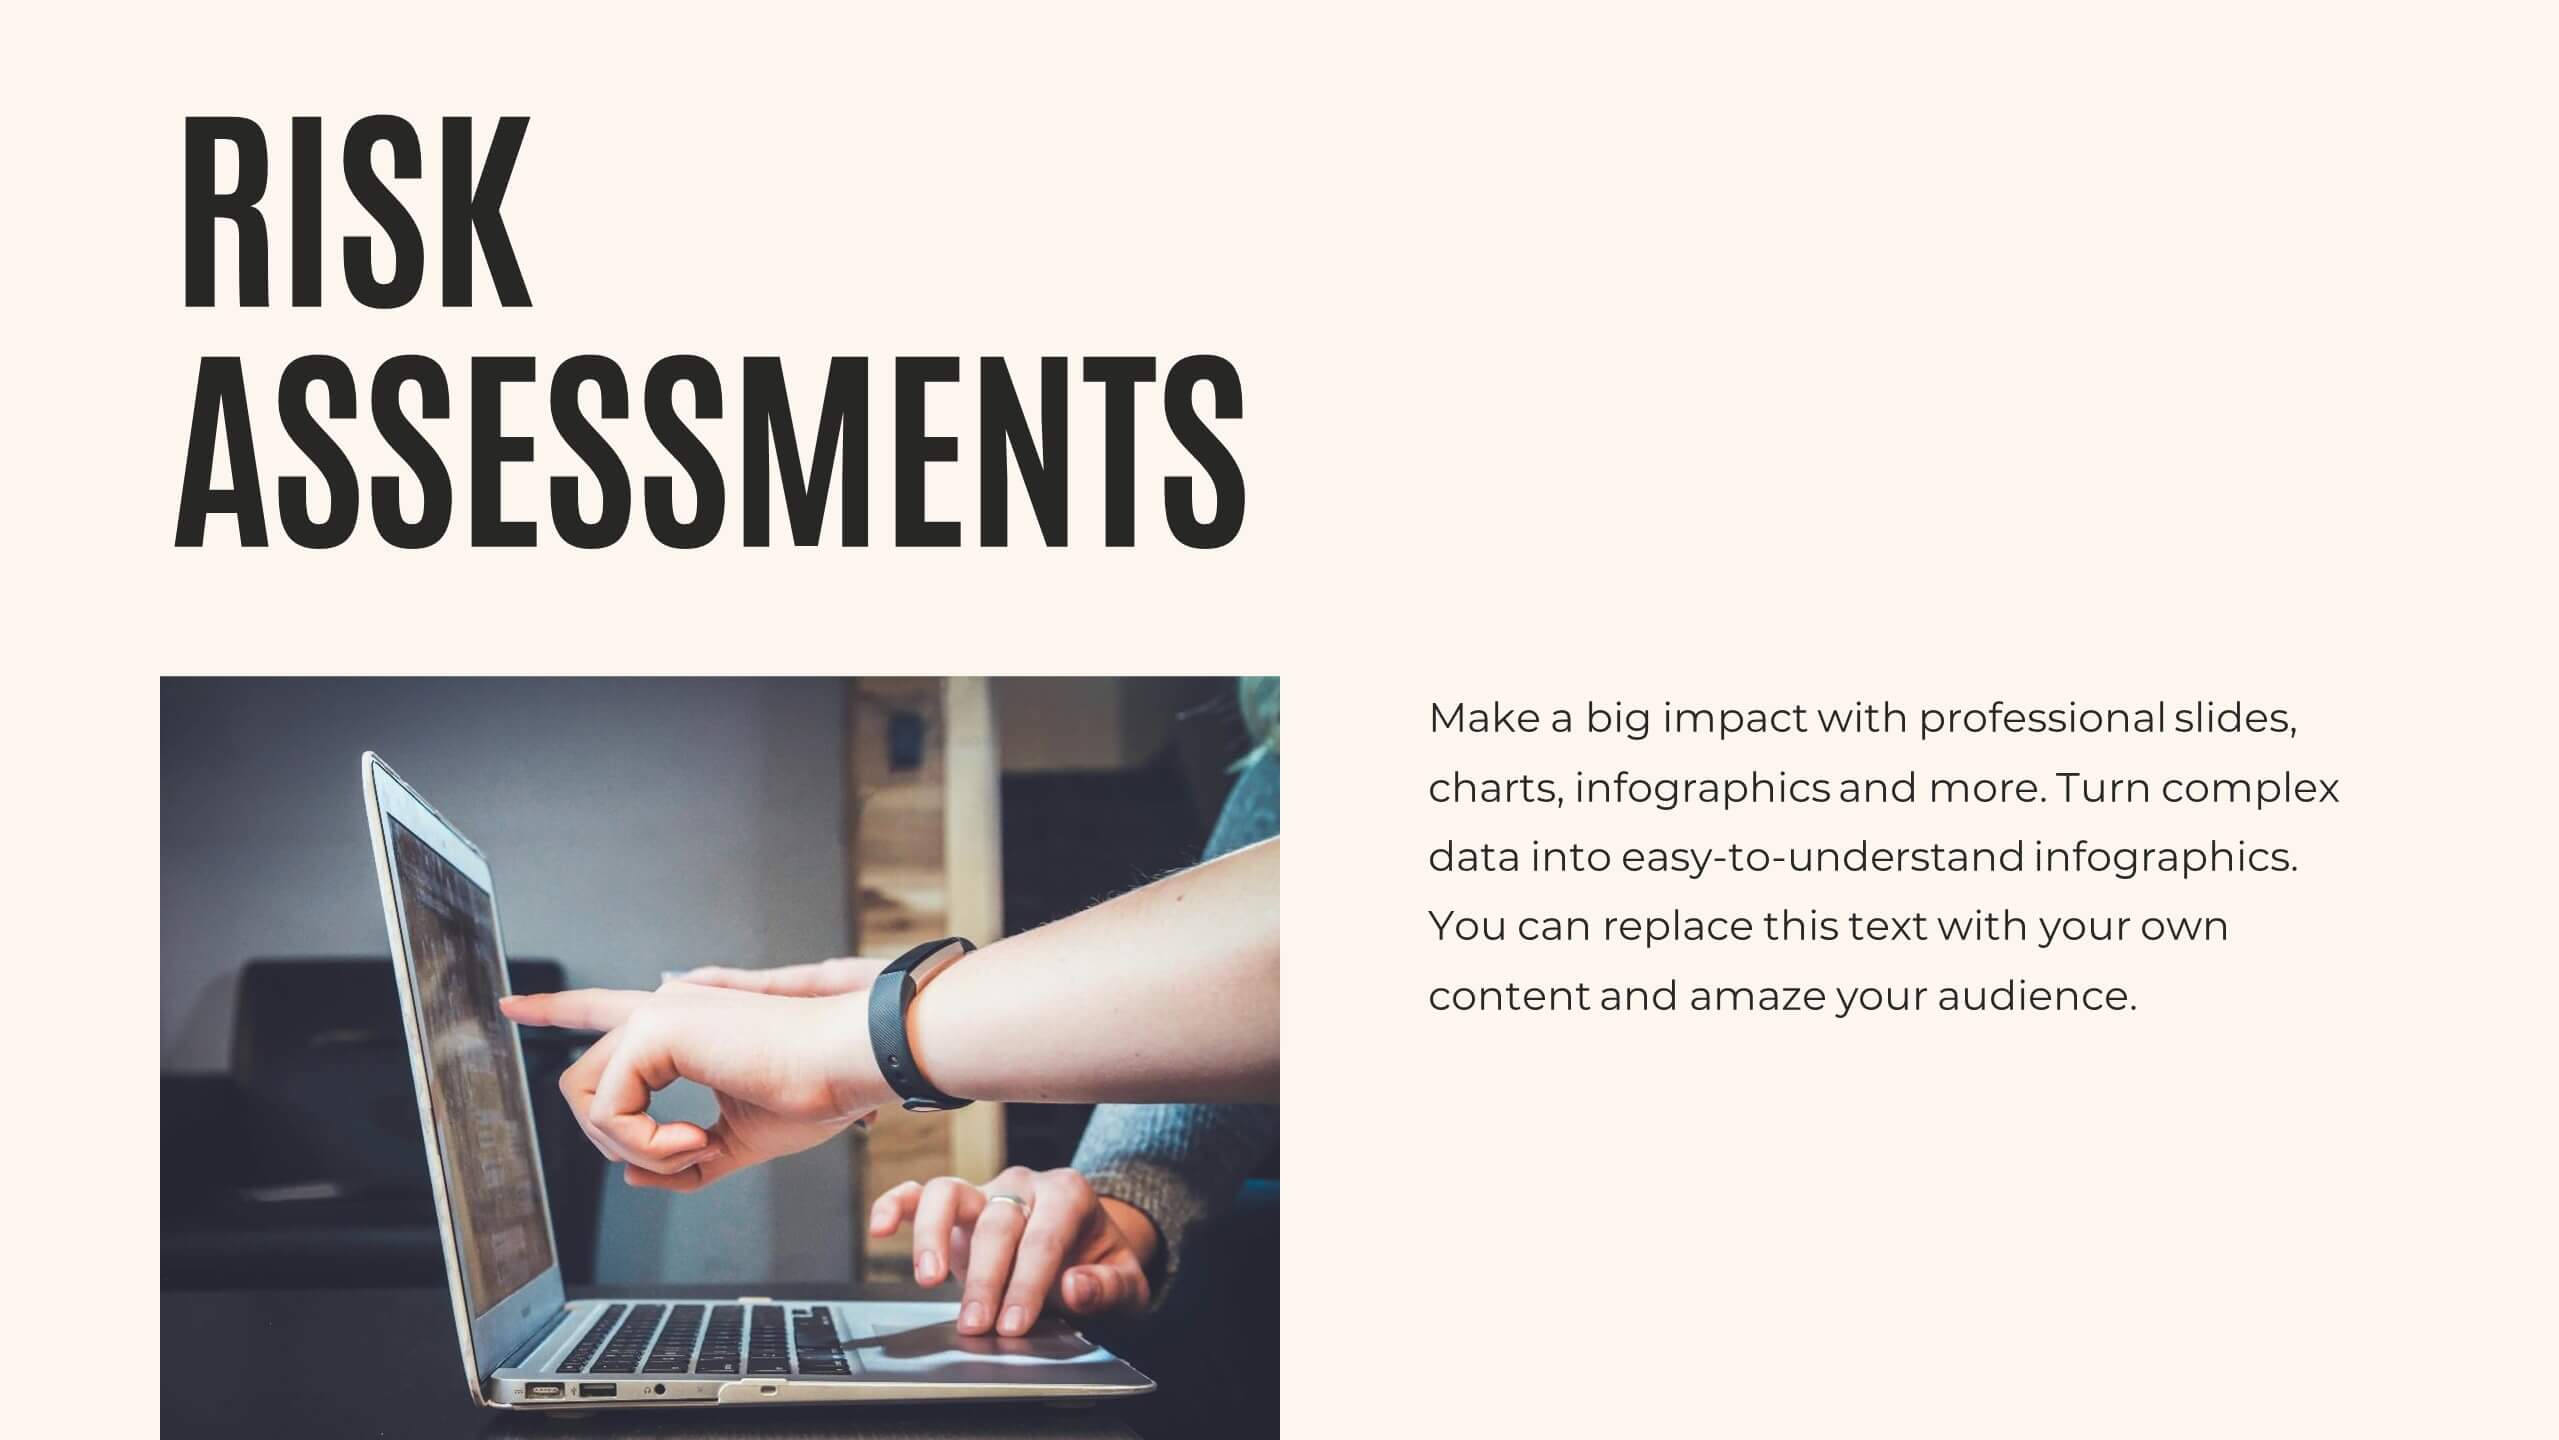
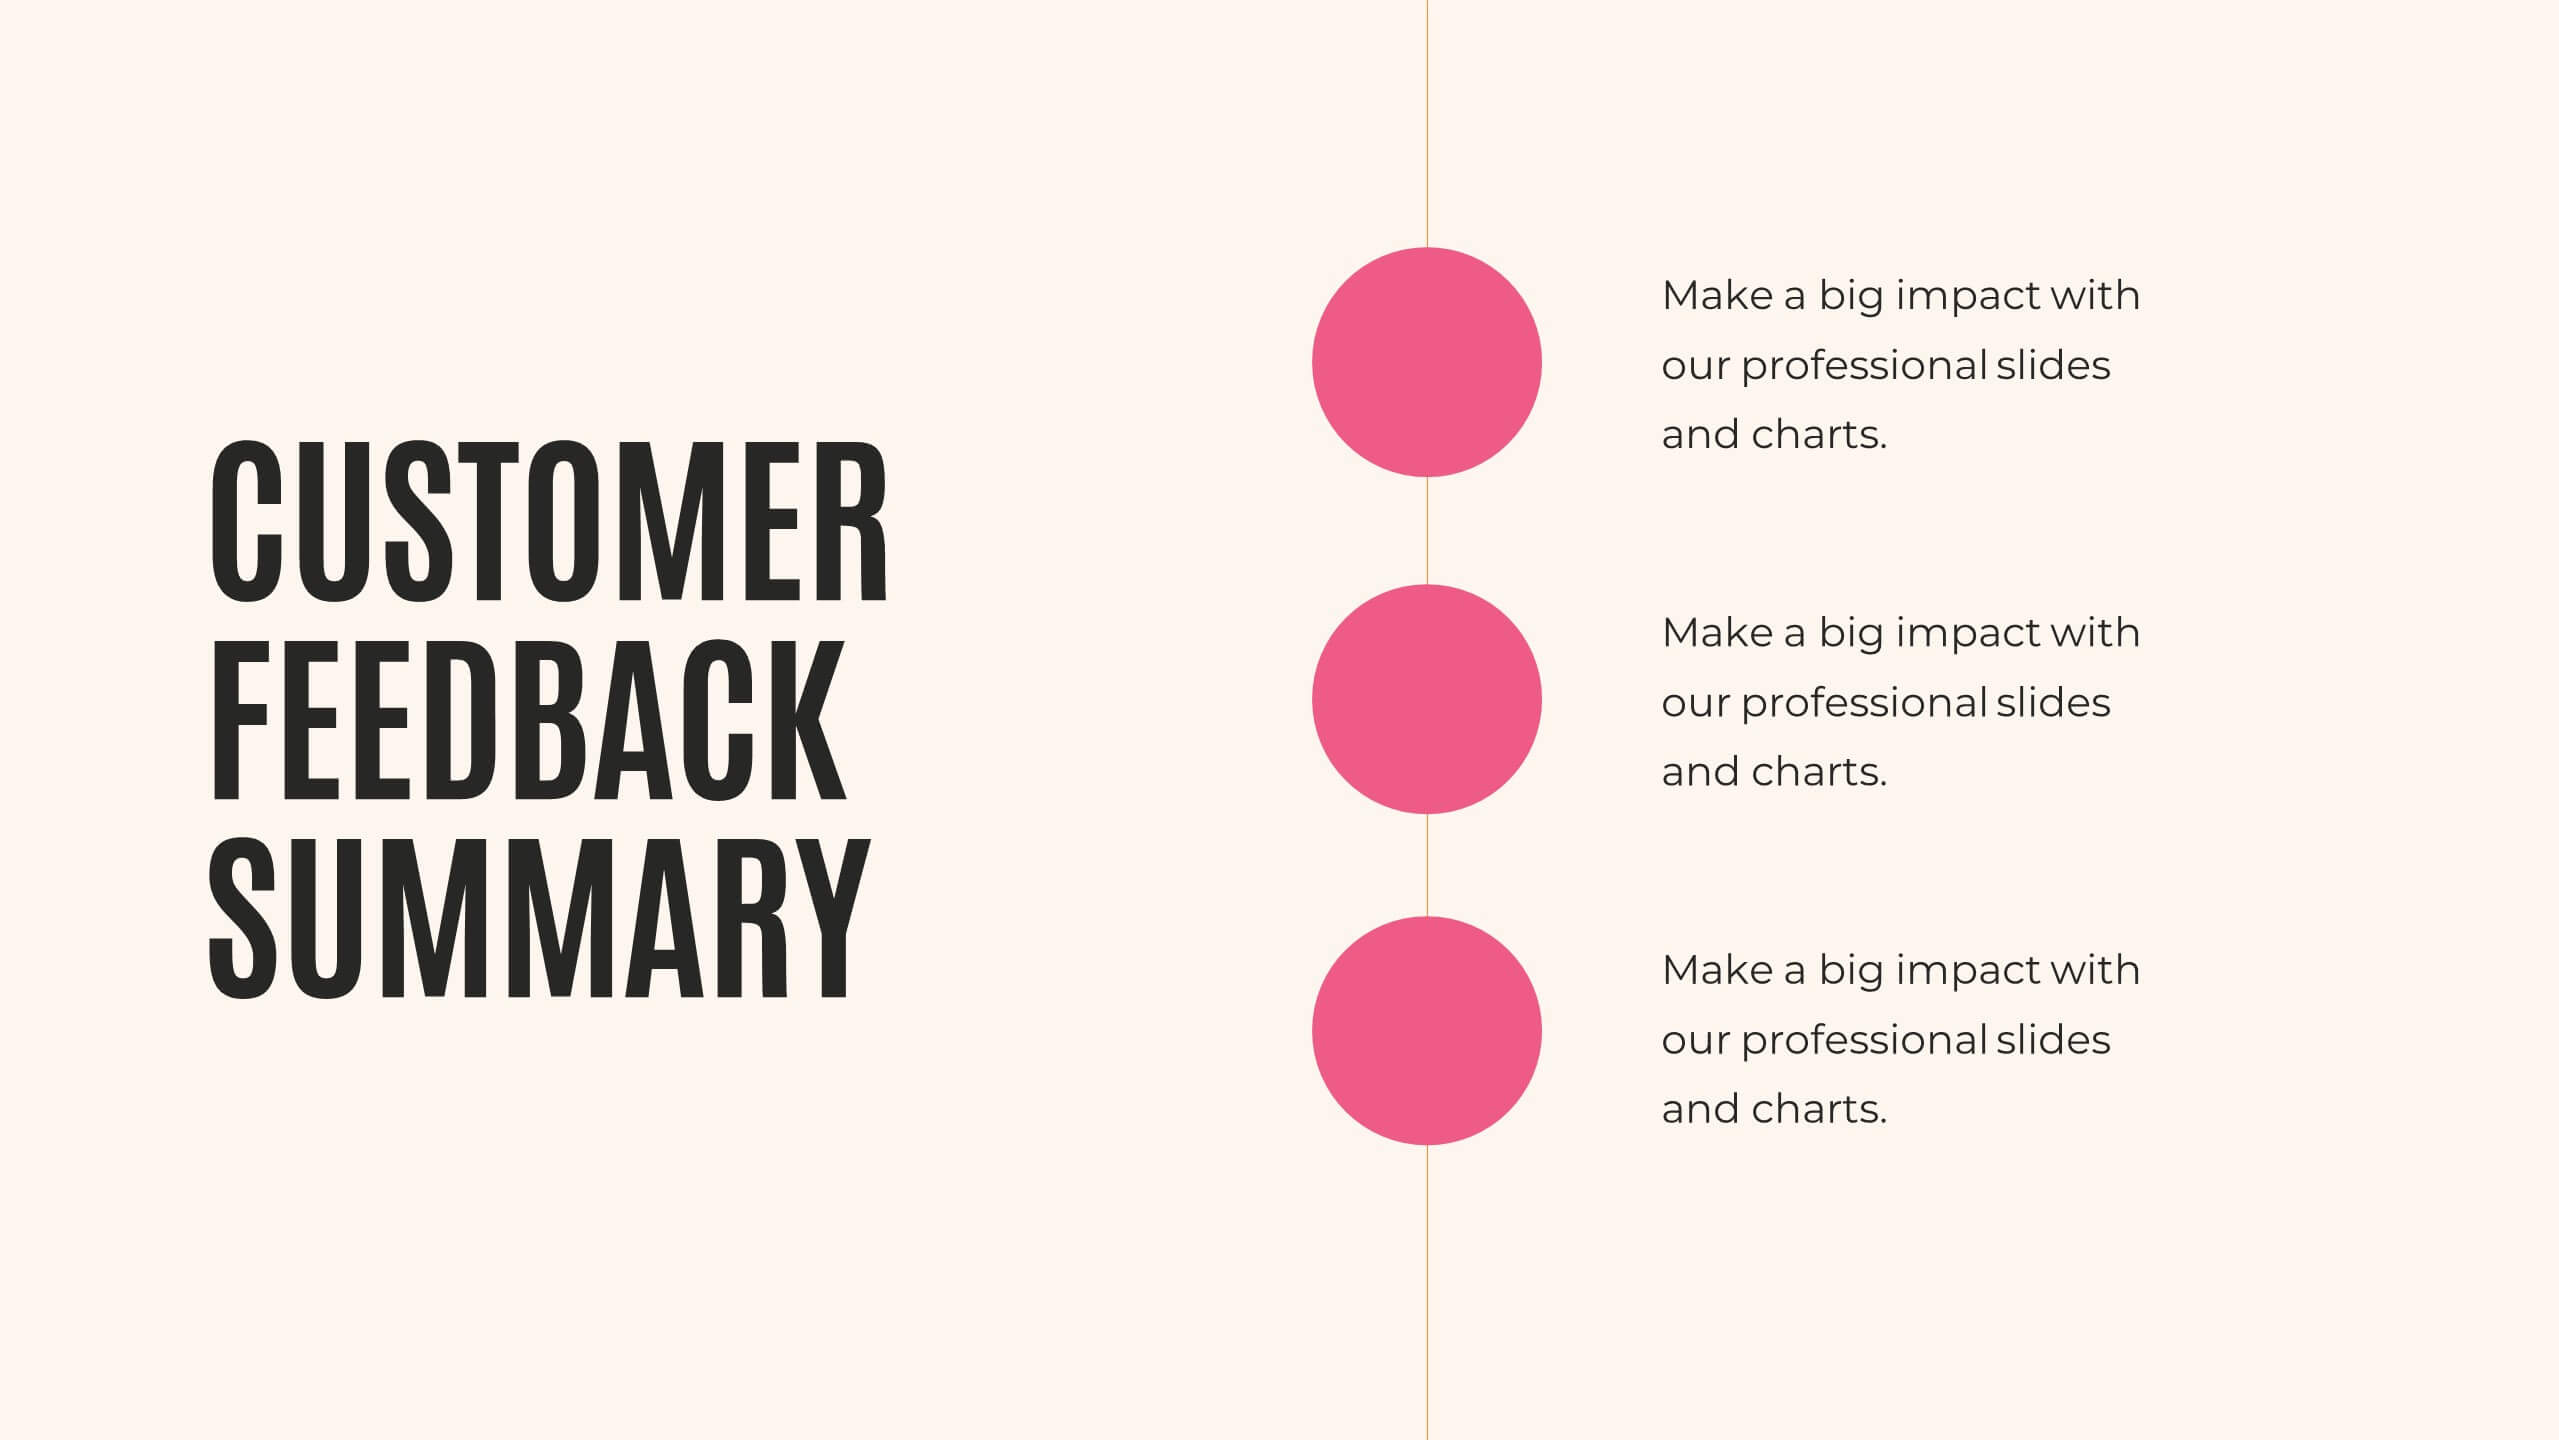
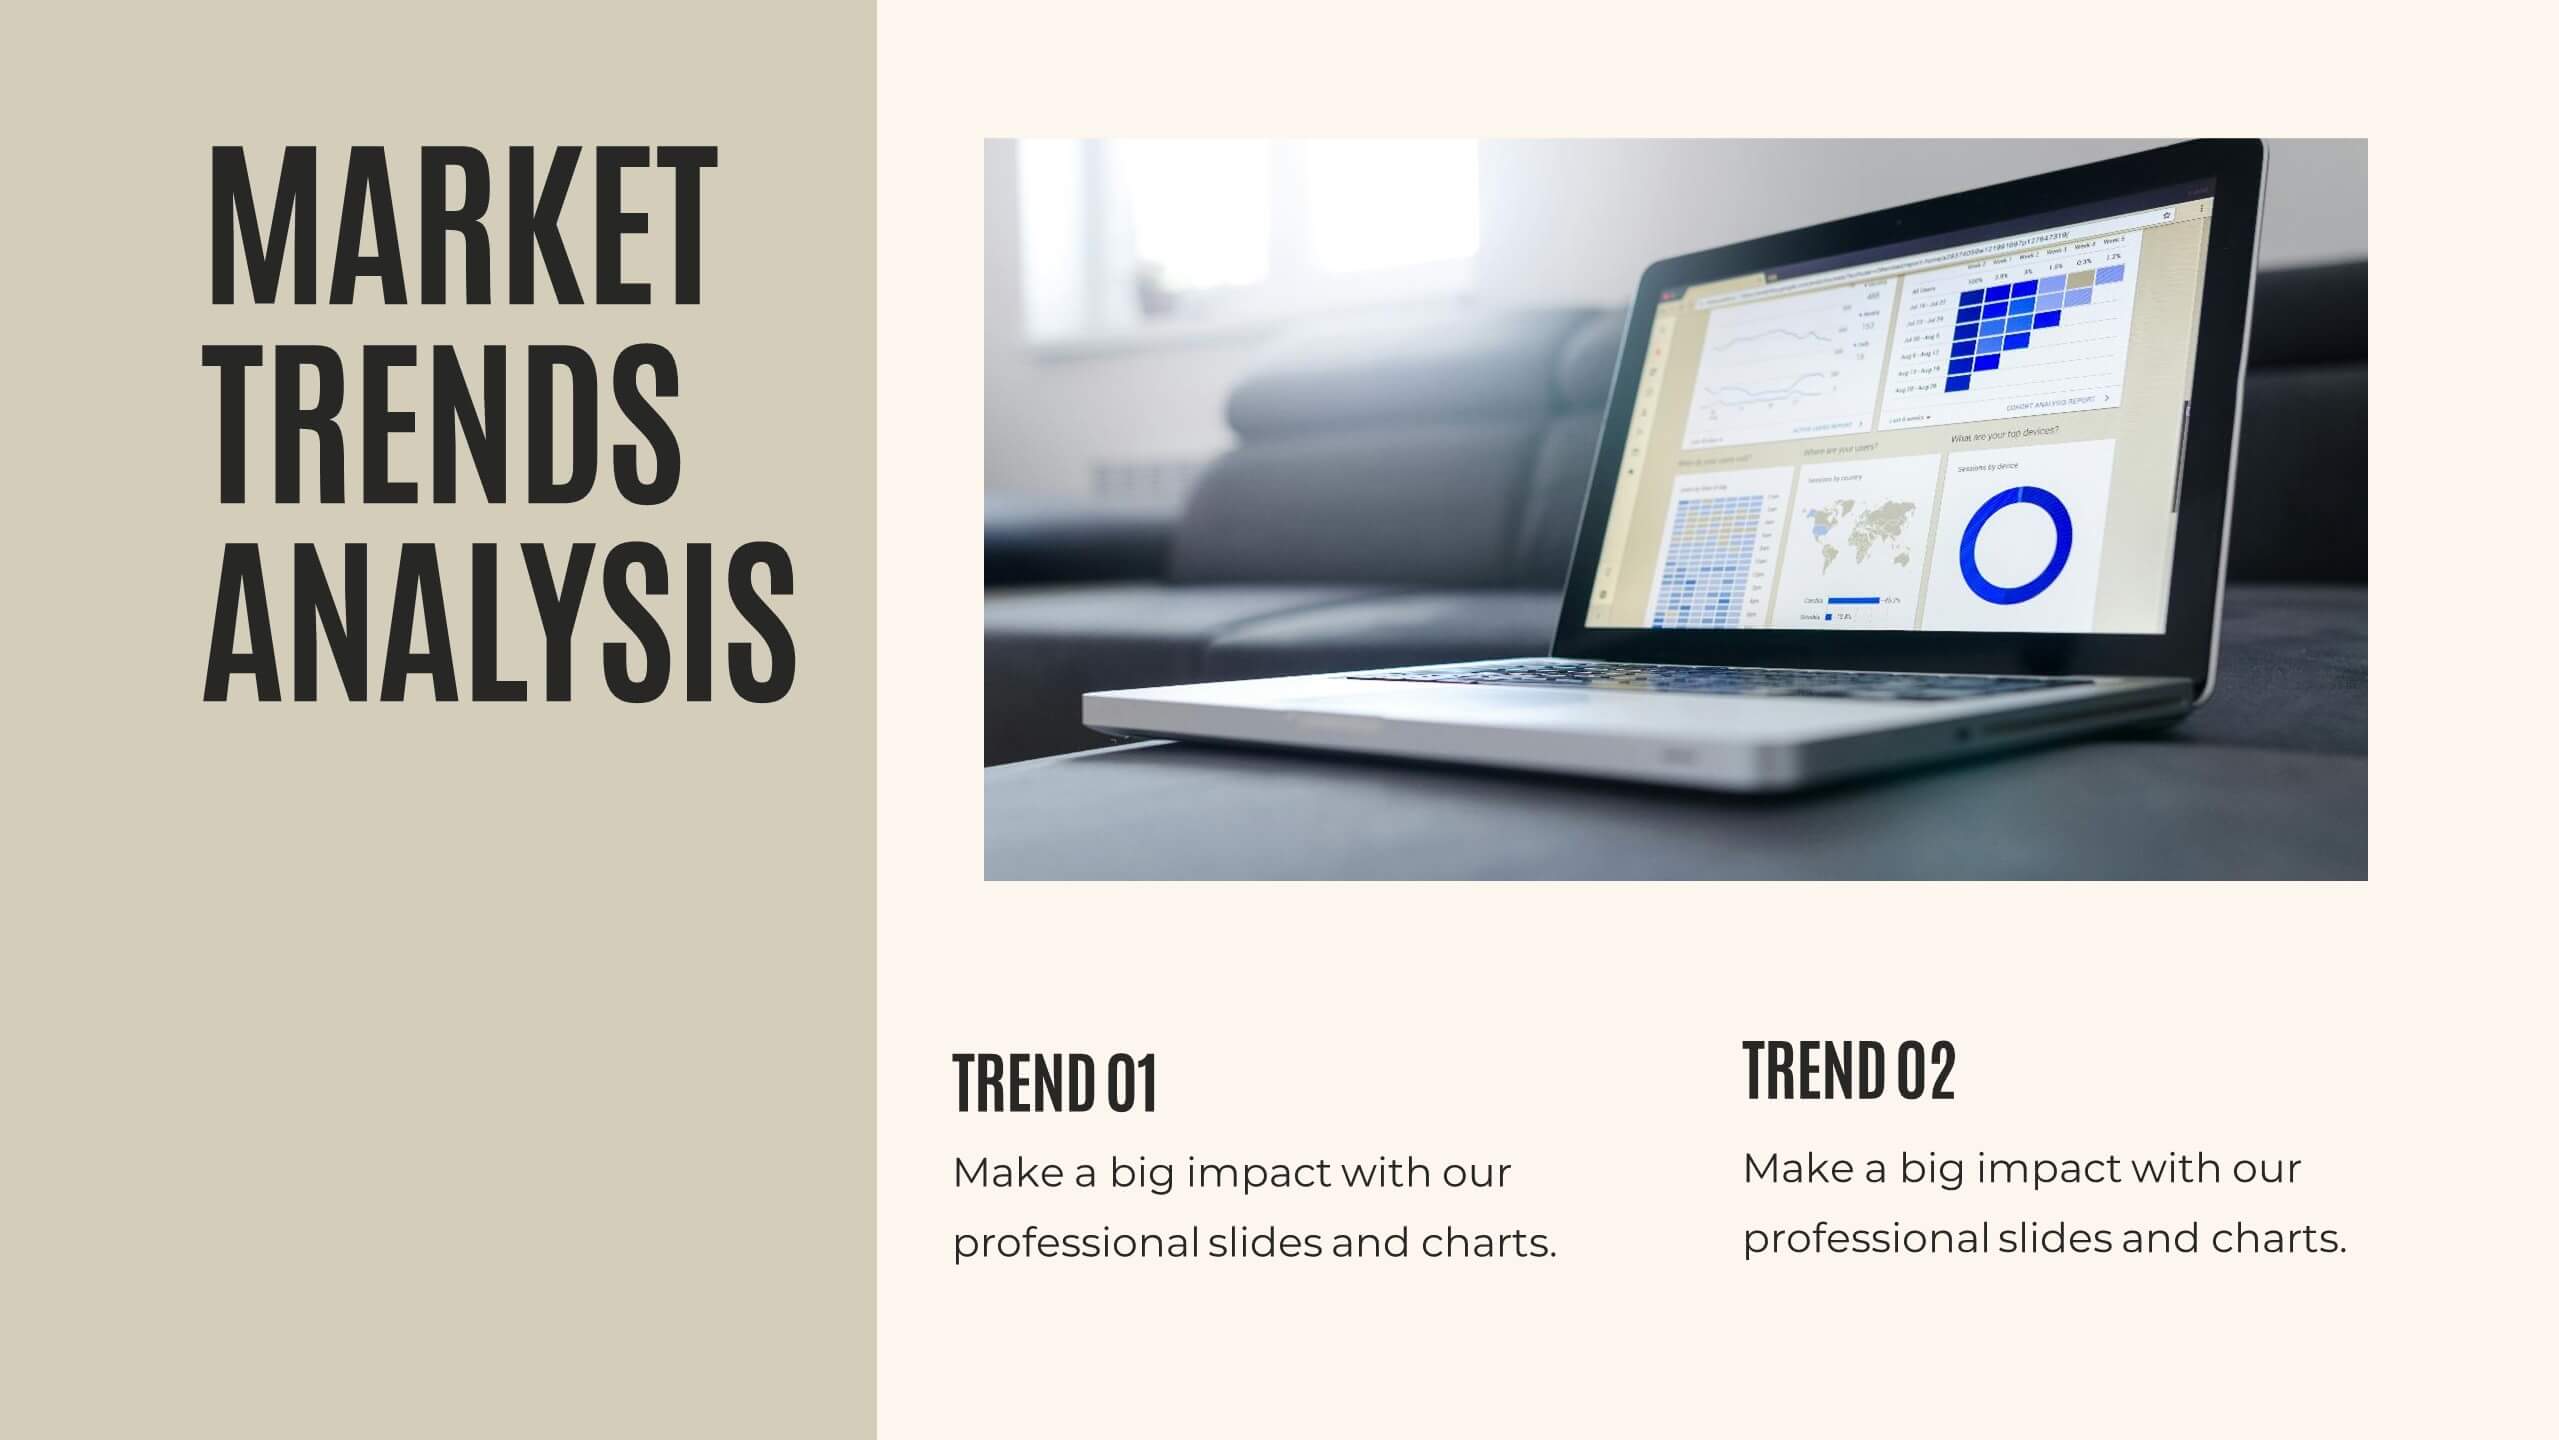
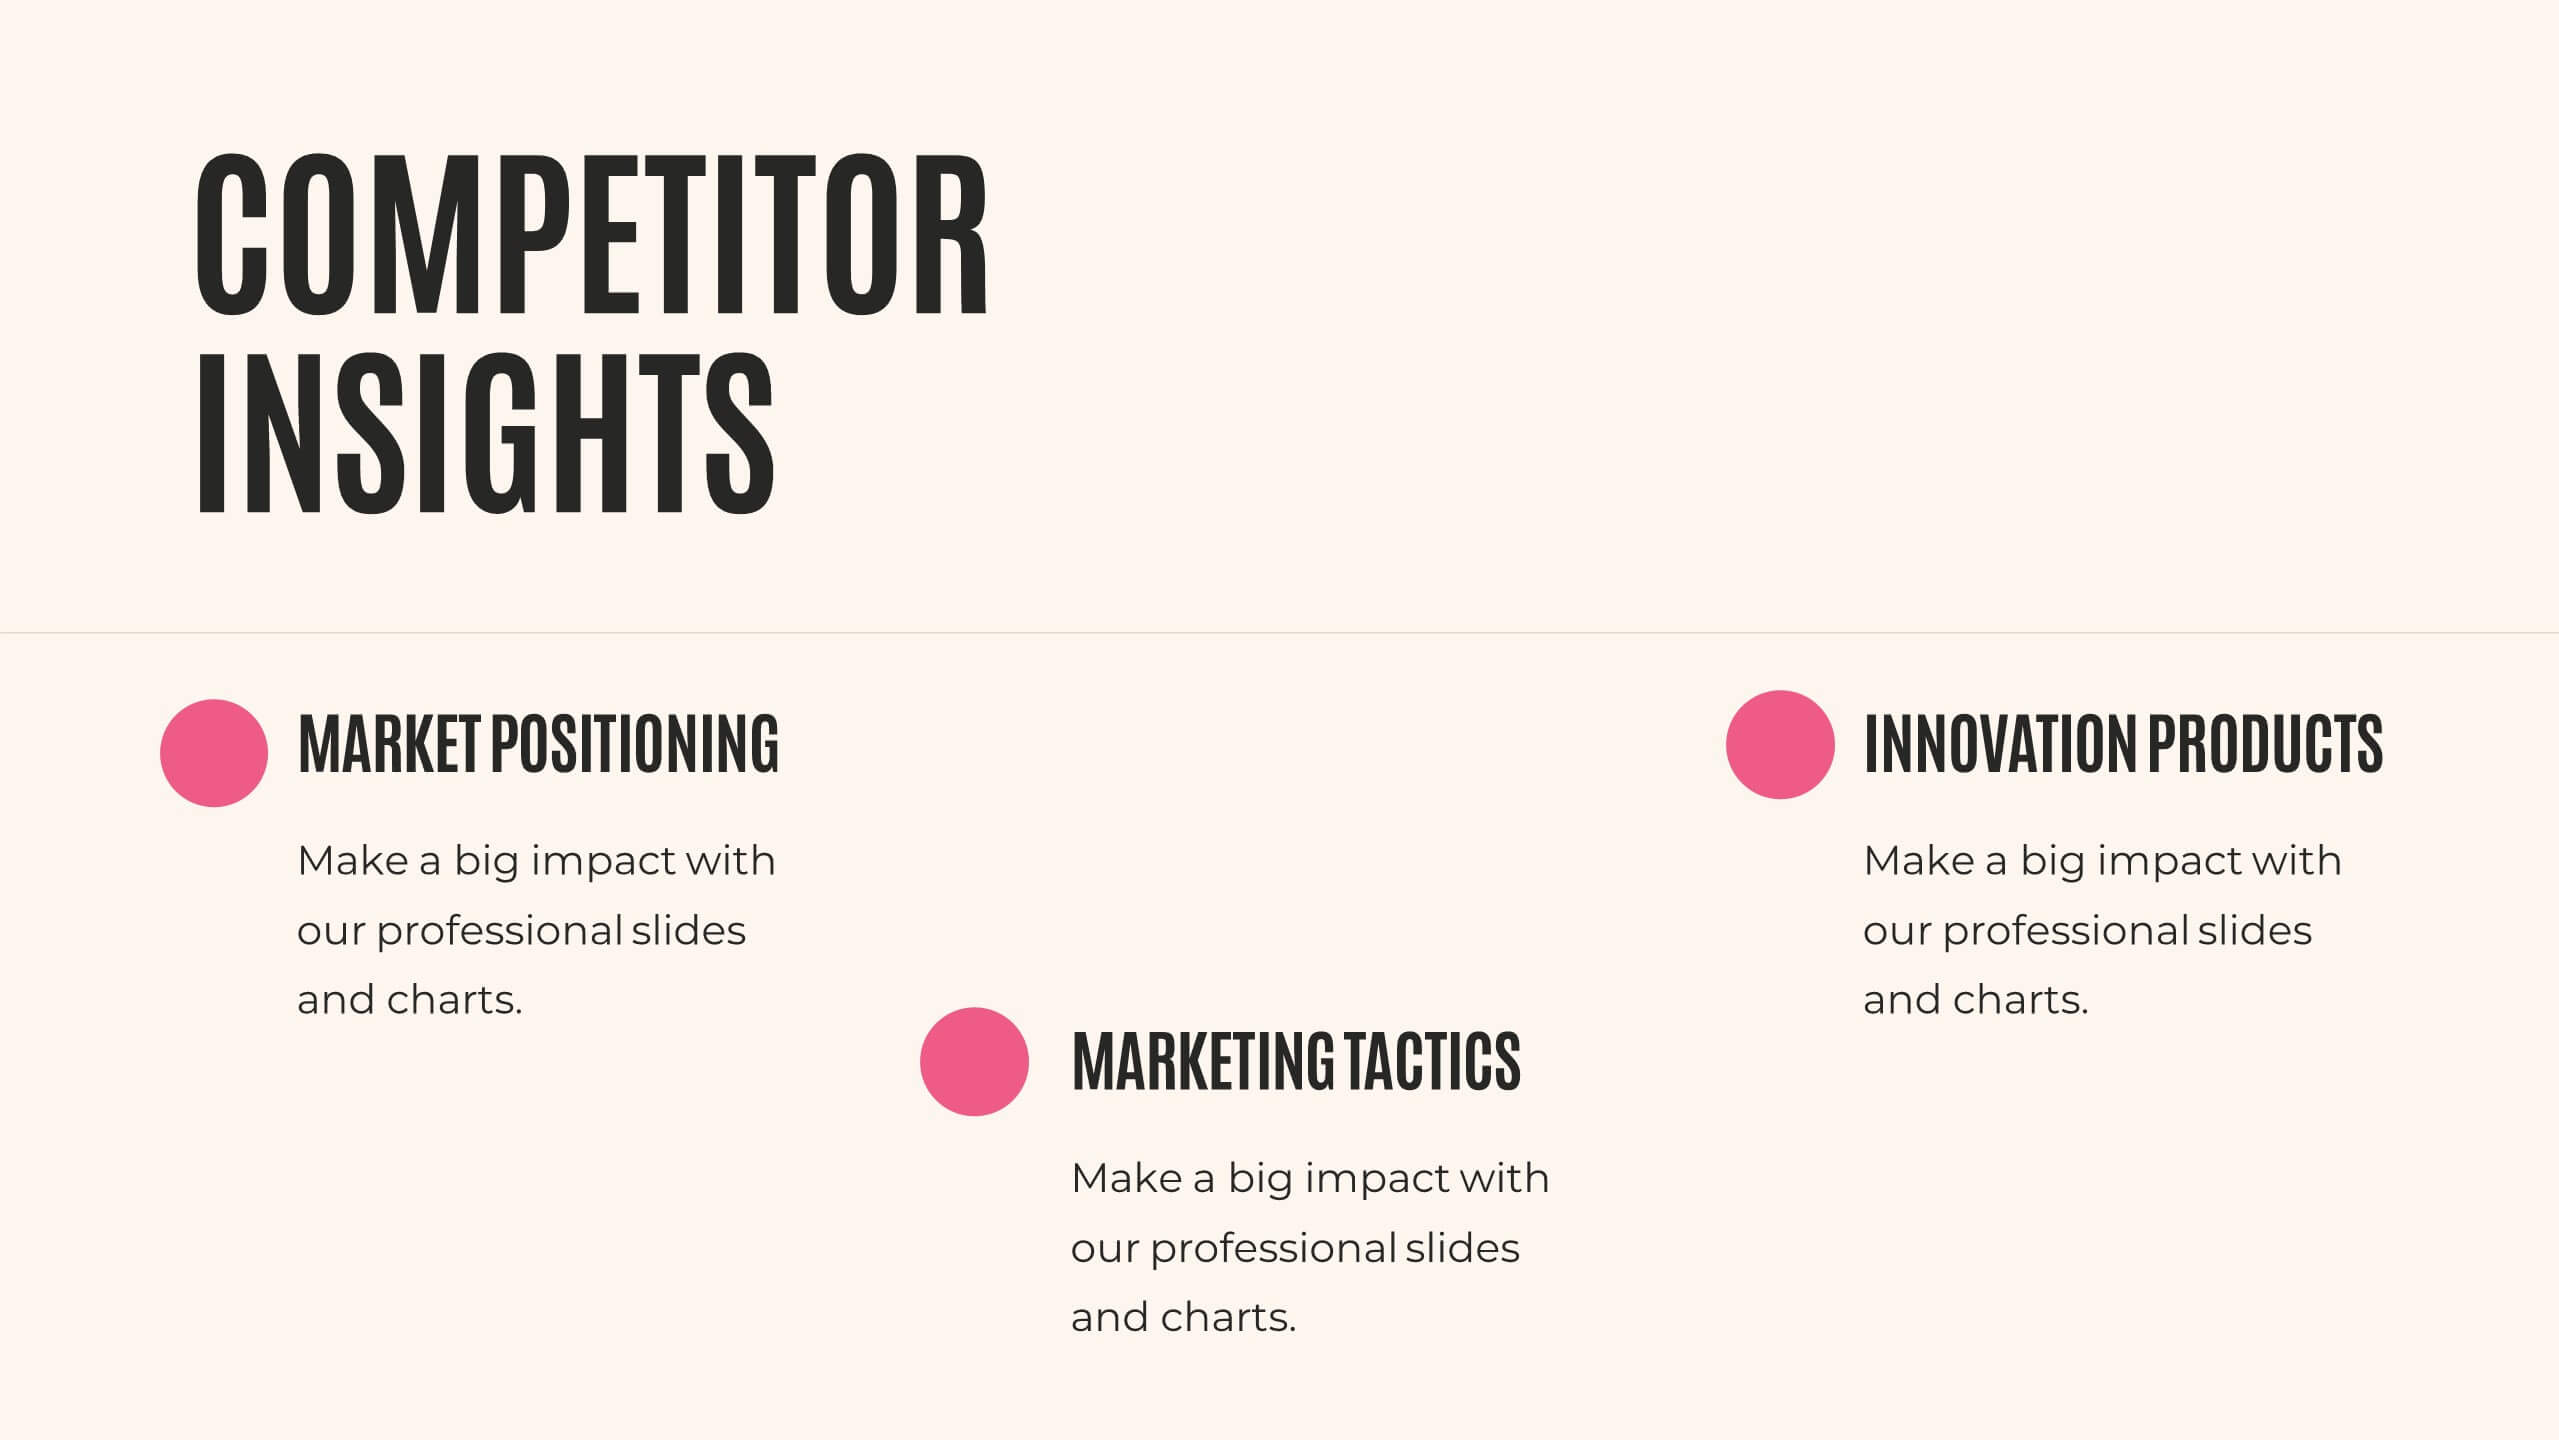
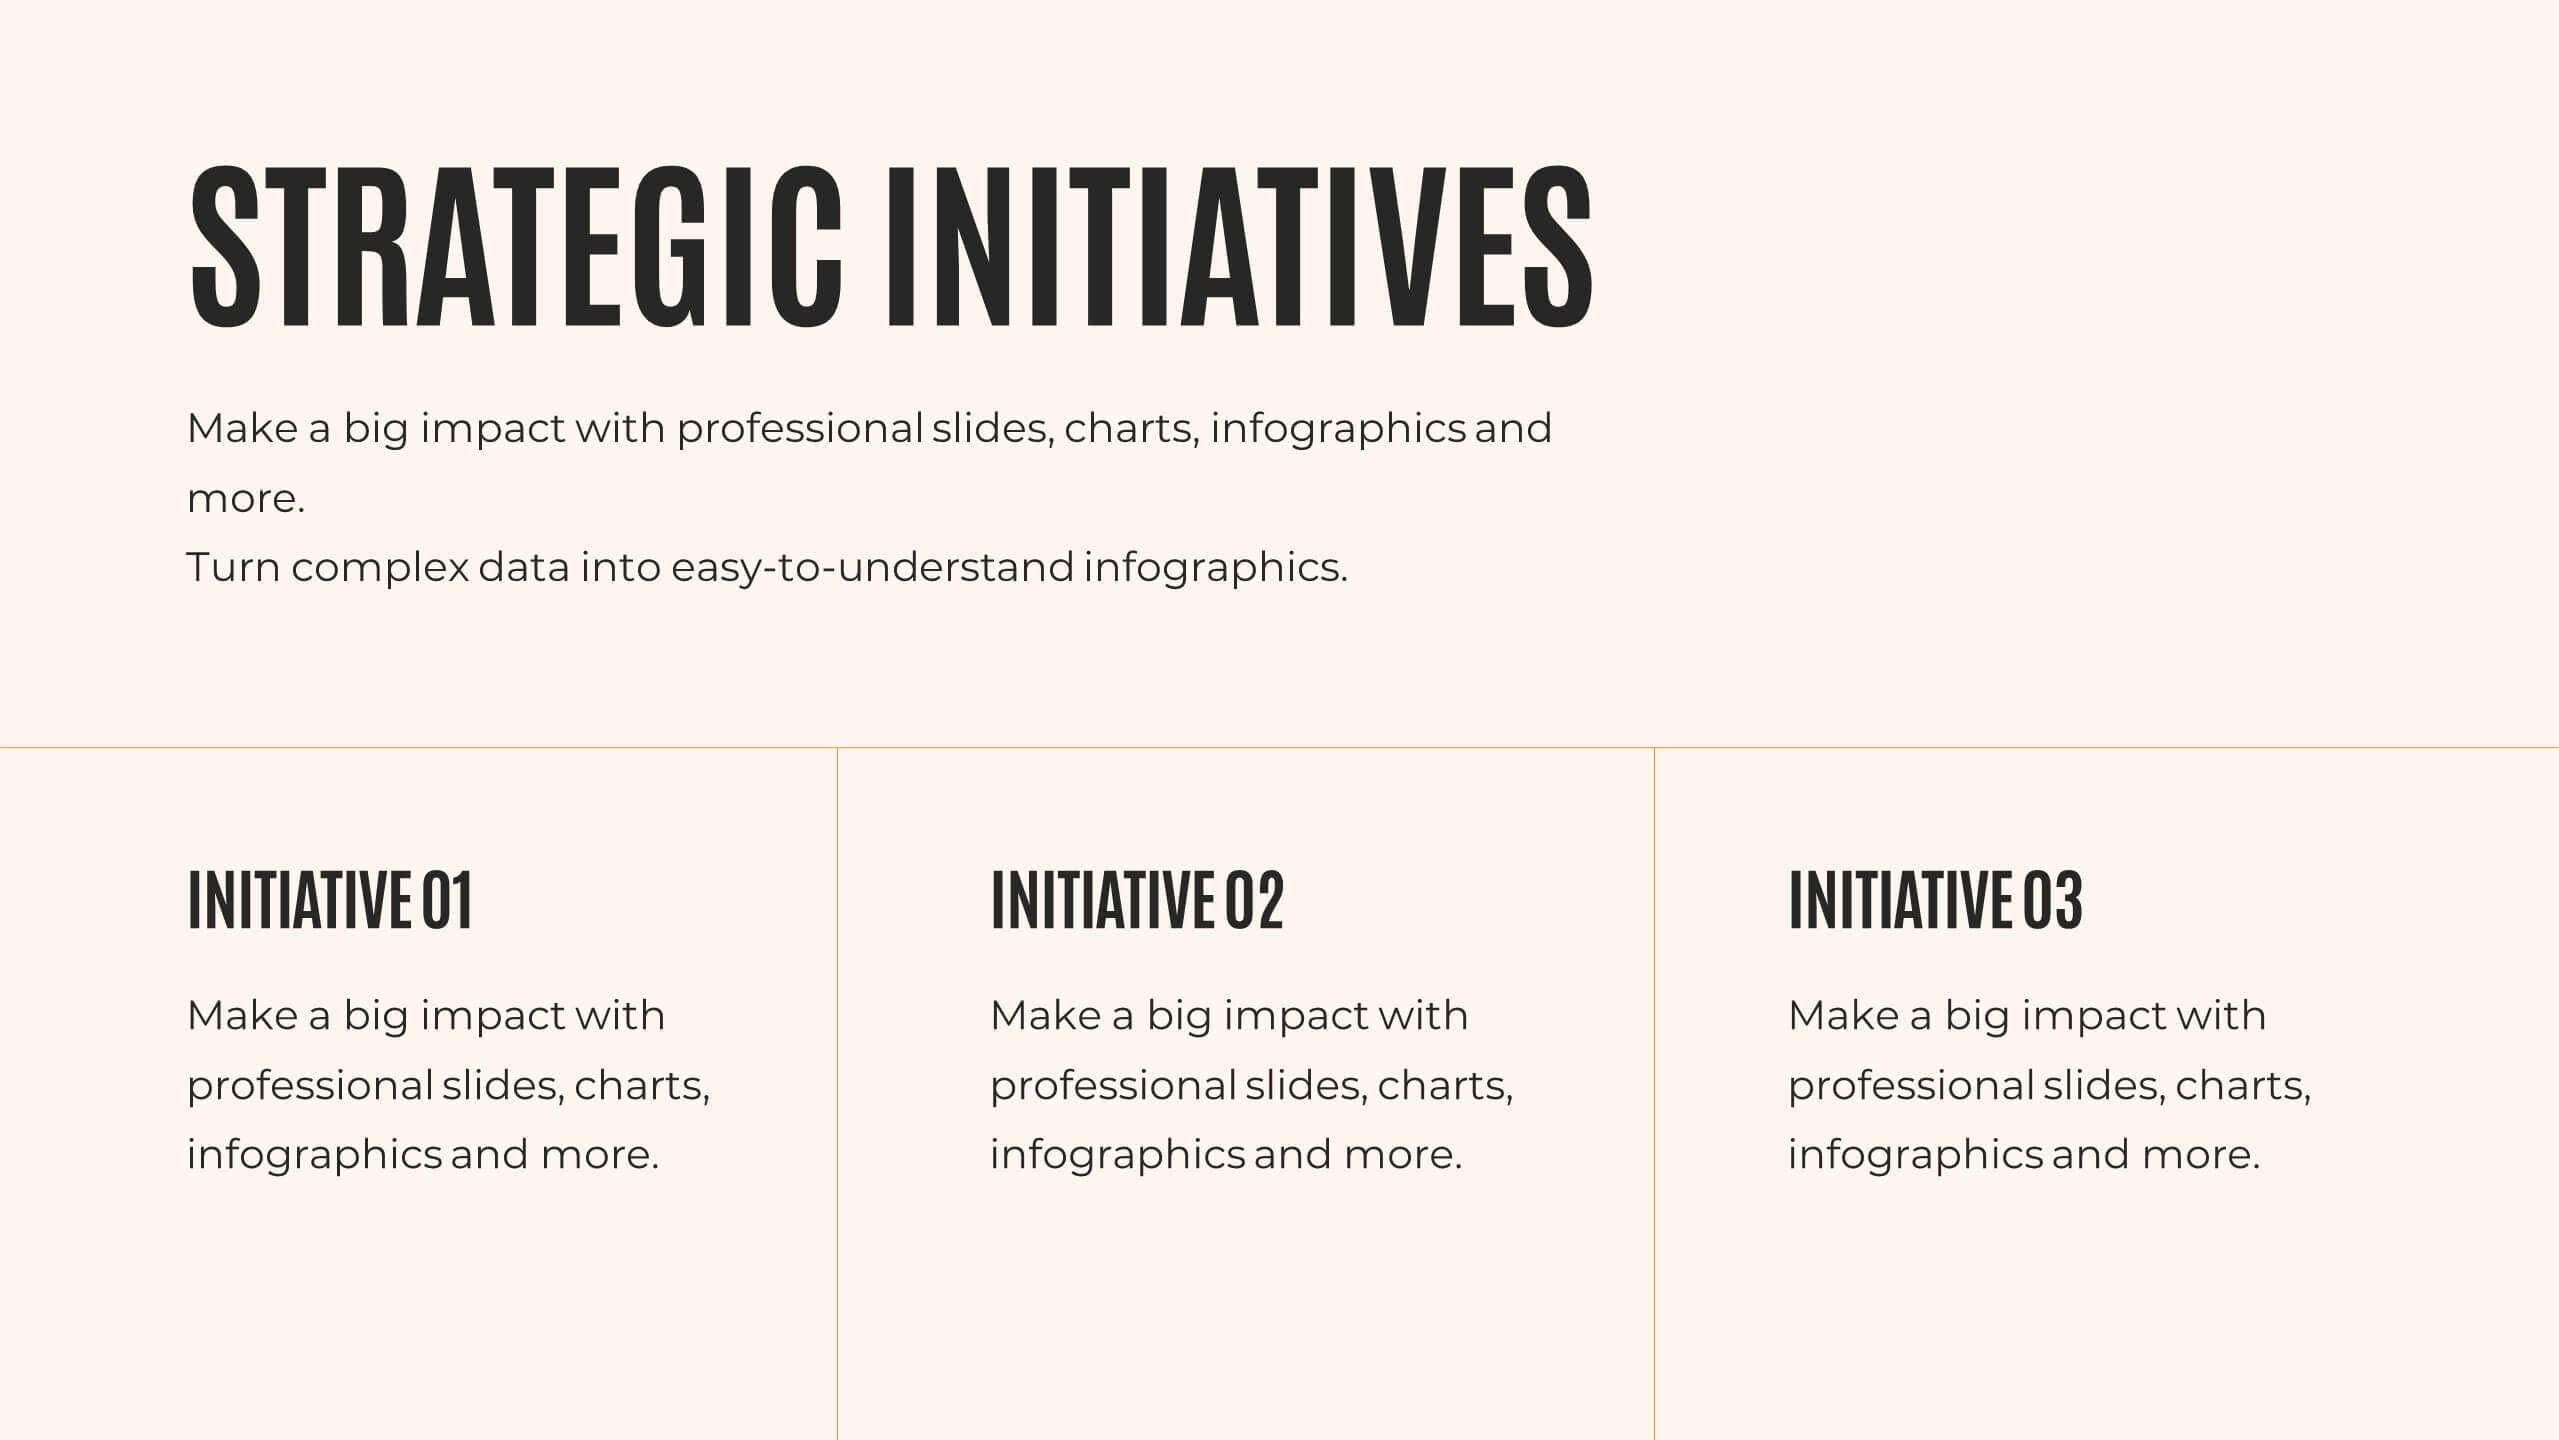
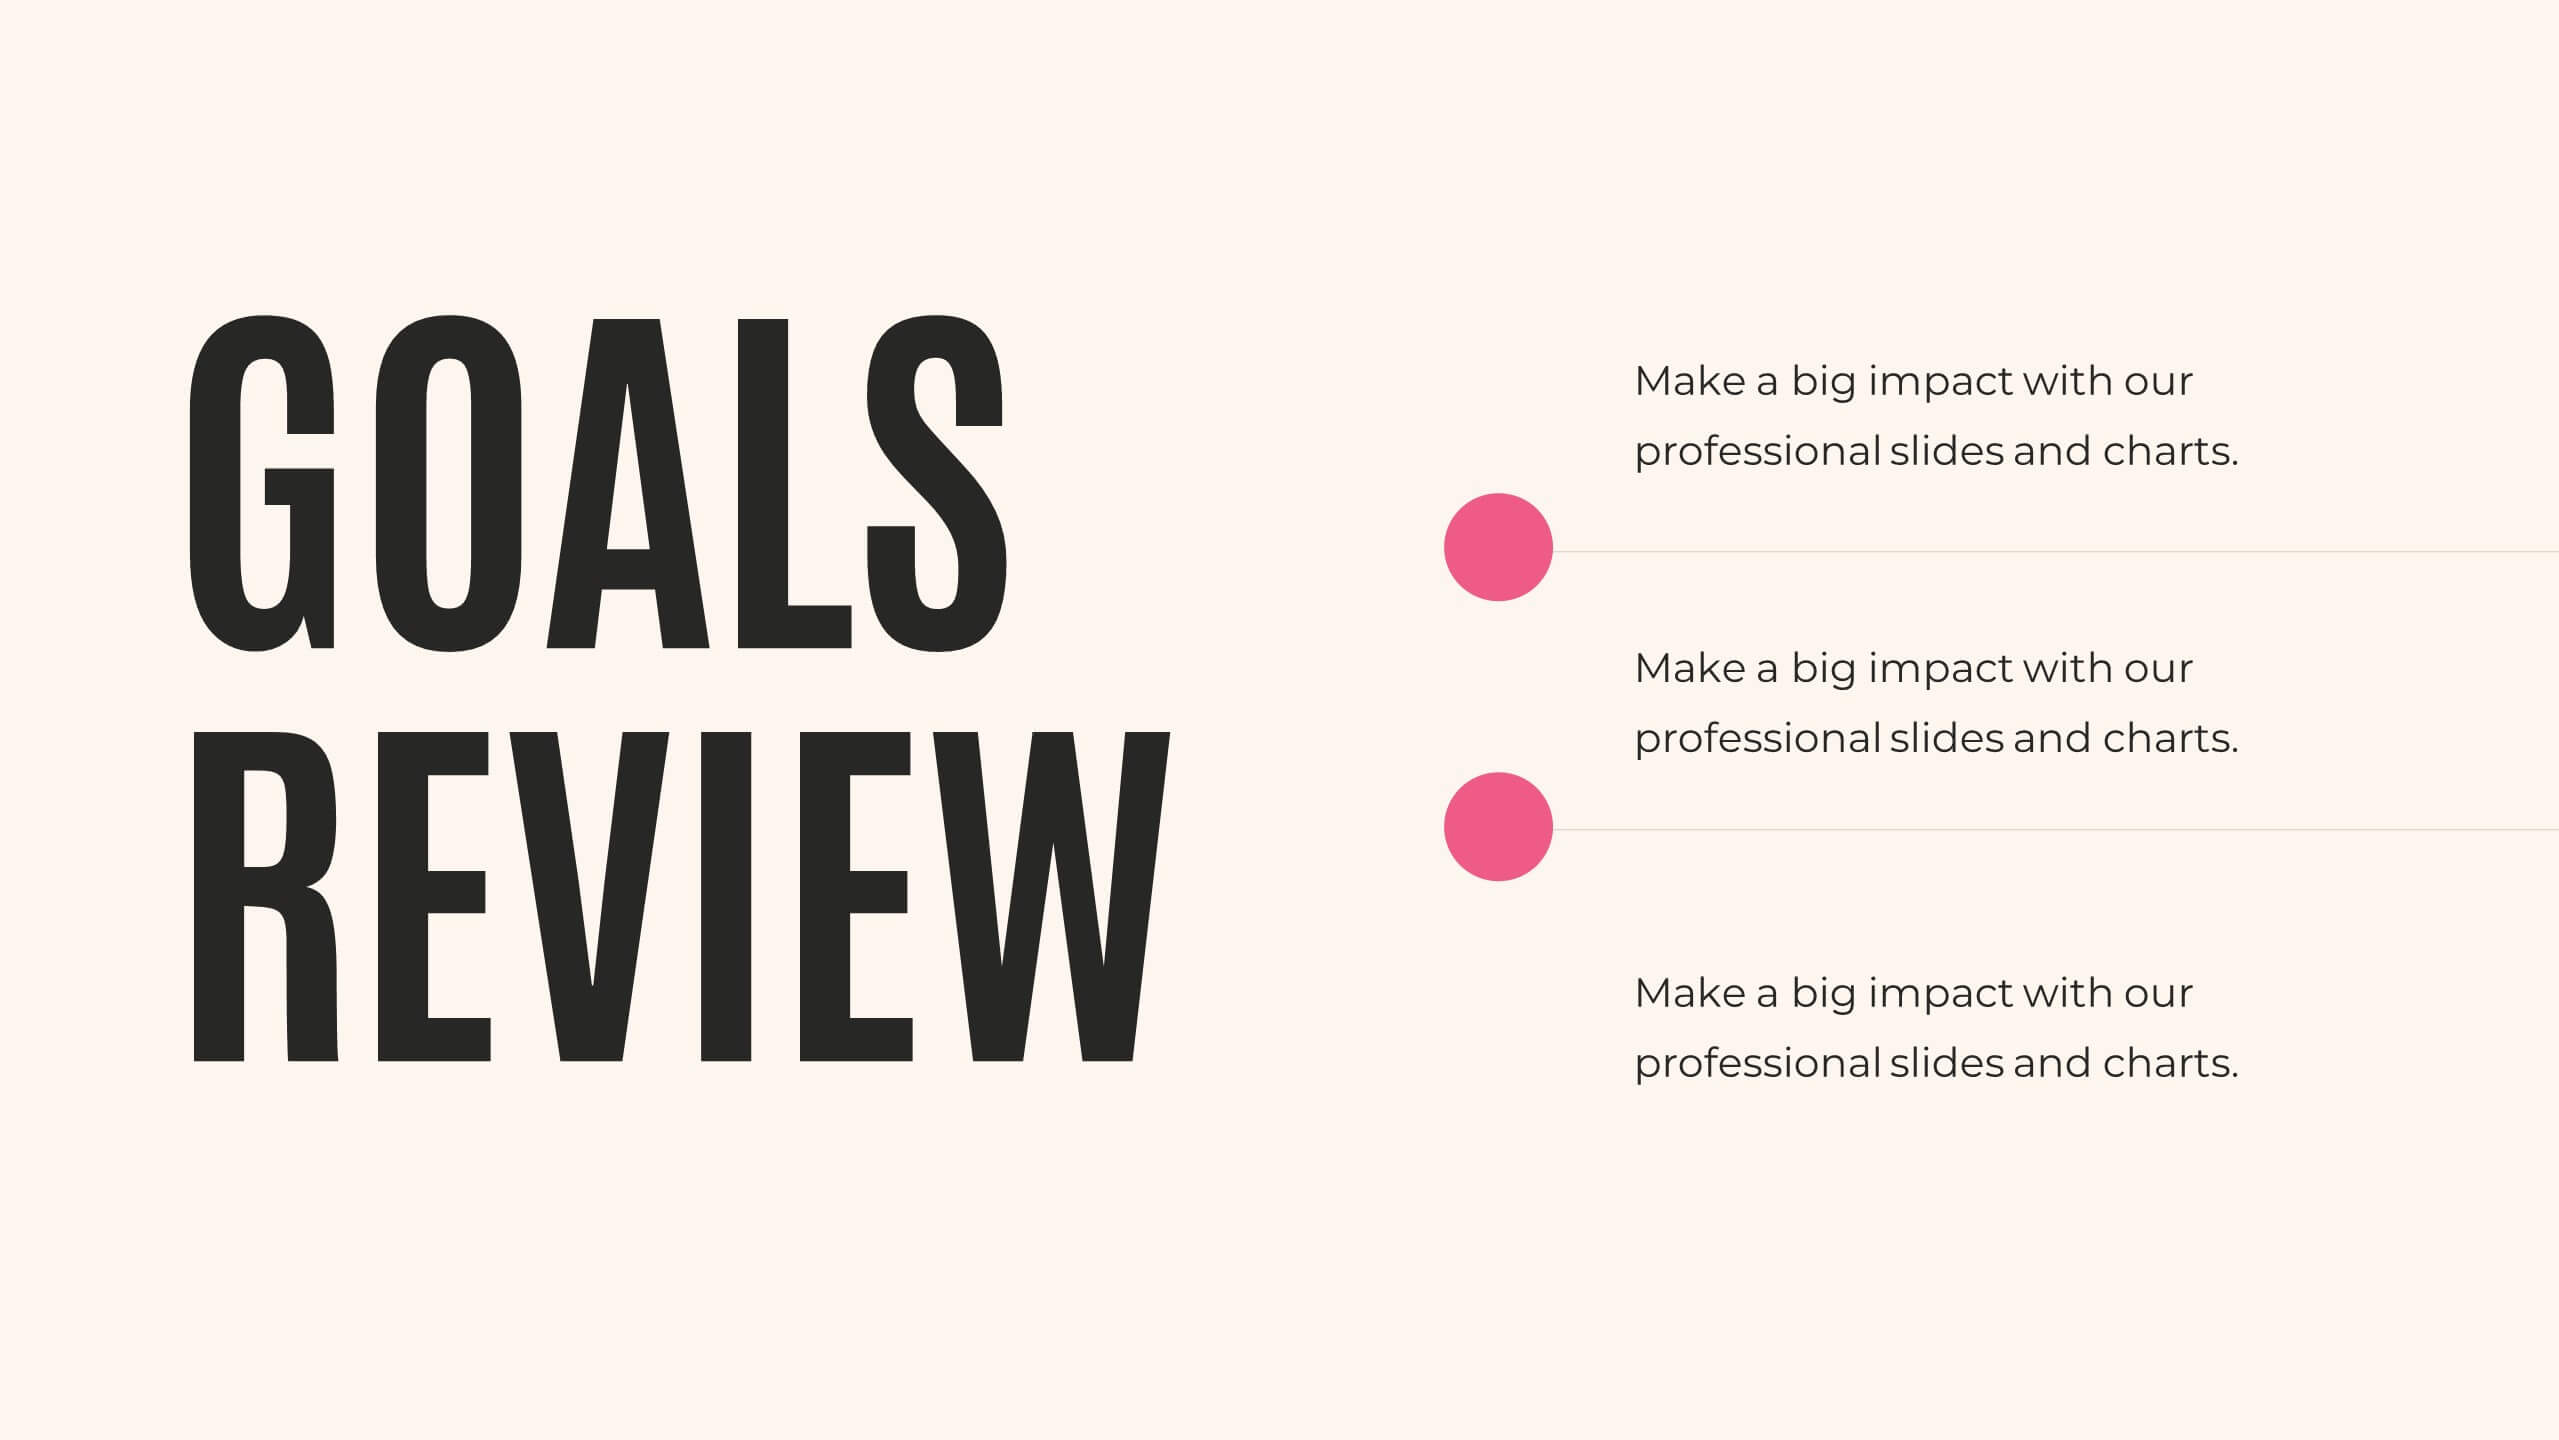
Soundscape Marketing Strategy Plan Presentation
Craft a compelling marketing strategy with a modern and sophisticated presentation template designed for marketers, agencies, and entrepreneurs. Perfectly organized, this template allows you to present strategic objectives, SWOT analysis, and competitive landscape insights in a structured manner. Communicate key challenges, value propositions, and resource allocations with sleek, minimalistic slides. Visualize your timeline, team expertise, and communication strategy using editable graphics and streamlined layouts. Dedicated slides for performance metrics and risk management ensure your plan resonates with stakeholders and decision-makers. Compatible with PowerPoint, Google Slides, and Keynote, this fully customizable template empowers you to deliver your strategy with impact and clarity. Elevate your presentation with professional design elements that captivate your audience and drive actionable results.


7 diapositivas
Pyramid Scheme Infographic Presentation
A Pyramid Infographic is a great way to organize, highlight, and illustrate your ideas and content. This design uses visual hierarchy and colors to convey key information in an attractive way. The Pyramid incorporates colorful diagrams to allows your text to stand out while it is set against a white background. This is a simple, engaging design that can be easily edited. This is great for analyzing data and it is the perfect choice to impress the audience. It will surely help you convey your message in a much better way. It's a great way to communicate the key points of your Infographic.


4 diapositivas
Options Comparison Chart Presentation
Make every decision crystal clear with a dynamic, easy-to-follow layout designed to compare options side by side. Perfect for presenting business strategies, pricing plans, or feature breakdowns, this presentation helps your audience see the value instantly. Fully compatible with PowerPoint, Keynote, and Google Slides for effortless editing.


5 diapositivas
Tech Stack and IT Infrastructure Presentation
Visualize your systems with this Tech Stack and IT Infrastructure Presentation. Featuring a vertical ribbon layout with five clearly defined segments, it's perfect for illustrating architecture layers, development pipelines, or infrastructure components. Easily editable in Canva, PowerPoint, or Google Slides to match your brand and IT strategy.


7 diapositivas
Digital Marketing Services Infographic
A Digital Marketing Services Infographic is a visual representation of information and data related to digital marketing services. This template is a type of graphic design that presents complex or large amounts of information in a simple and informative way. This infographic includes statistics, charts, graphs, and other visual elements to convey your information about various aspects of digital marketing, such as social media marketing, content marketing, search engine optimization, email marketing, and paid advertising. Compatible with Powerpoint, Keynote and Google Slides.


3 diapositivas
First 90 Days Action Strategy Plan Presentation
Get ready to crush your first 90 days with a strategy layout that actually makes sense. This template helps you outline clear goals, actions, and milestones to hit during your critical first quarter—perfect for managers or new hires. Fully customizable and compatible with PowerPoint, Keynote, and Google Slides for easy editing.


5 diapositivas
Business Objectives and Strategic Goals Presentation
Clarify your roadmap to success with this visually structured Business Objectives and Strategic Goals slide. Featuring five segmented goal icons arranged in a semi-circle layout, this template is perfect for strategic planning, quarterly reports, and team briefings. Each section allows space to detail your specific objectives with matching visuals for easy comprehension. Fully editable in PowerPoint, Keynote, and Google Slides.


7 diapositivas
Mind Map Infographic Presentation Template
A mind map is a diagram that allows you to visualize how related ideas and concepts are connected to one another. It is especially good for brainstorming, planning and organizing. A mind map allows you to organize information in a way that shows your thinking process and gives you the opportunity for deeper understanding. This template will help others understand how you think about a particular subject or topic. Use this template to "brainstorm" a topic, and create an interesting mind map. You can also use it to share your ideas with others, or to visually organize your thoughts.


26 diapositivas
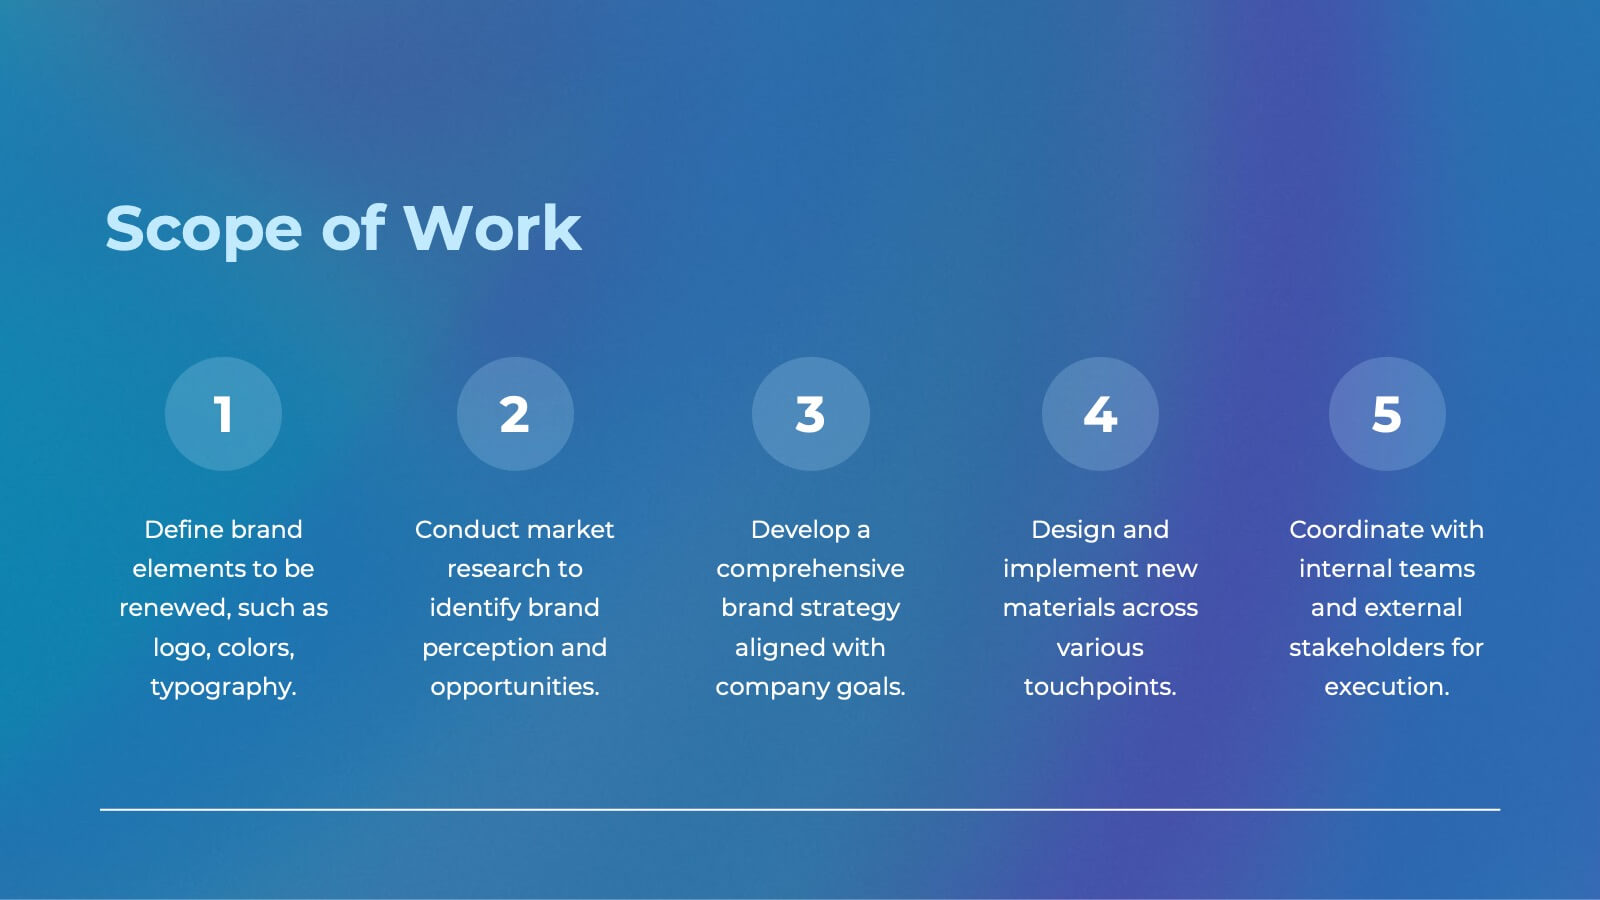
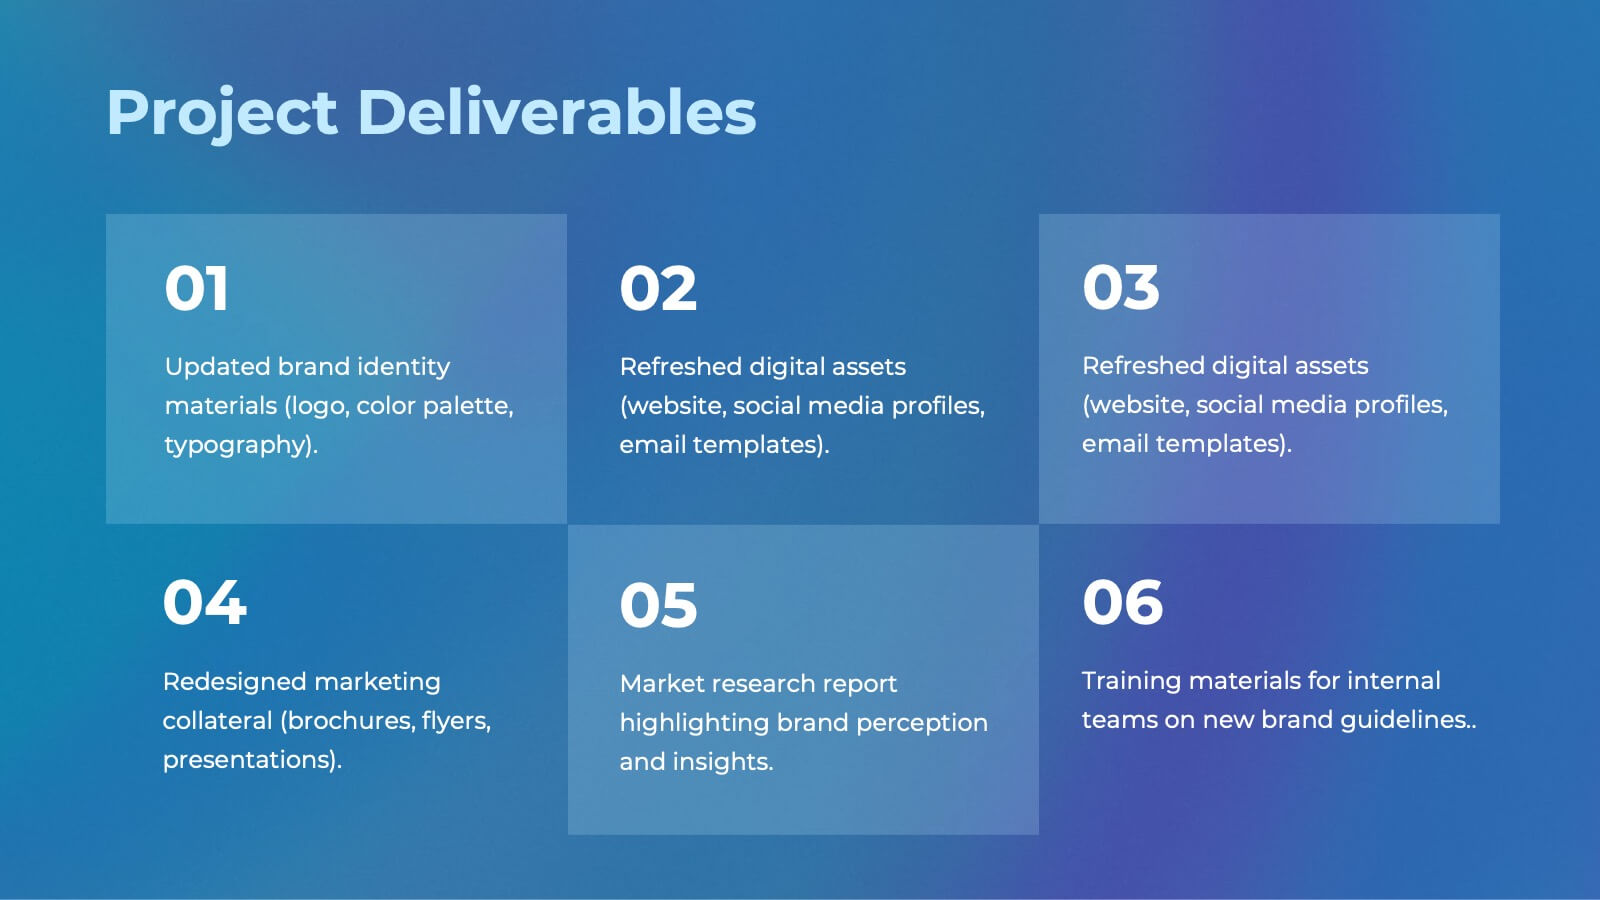
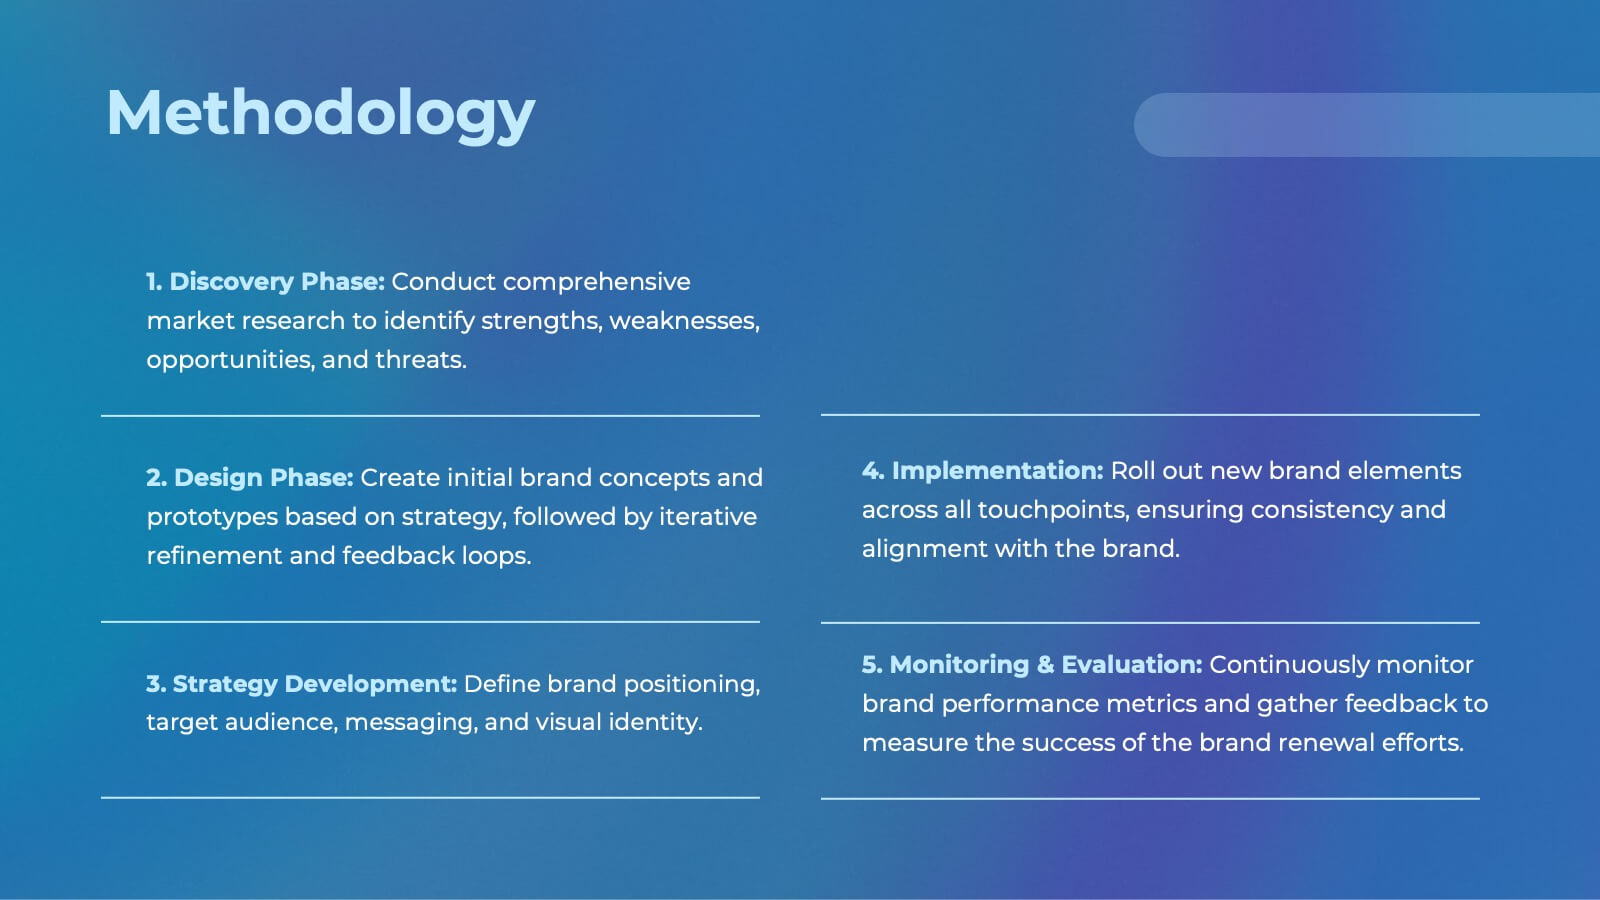
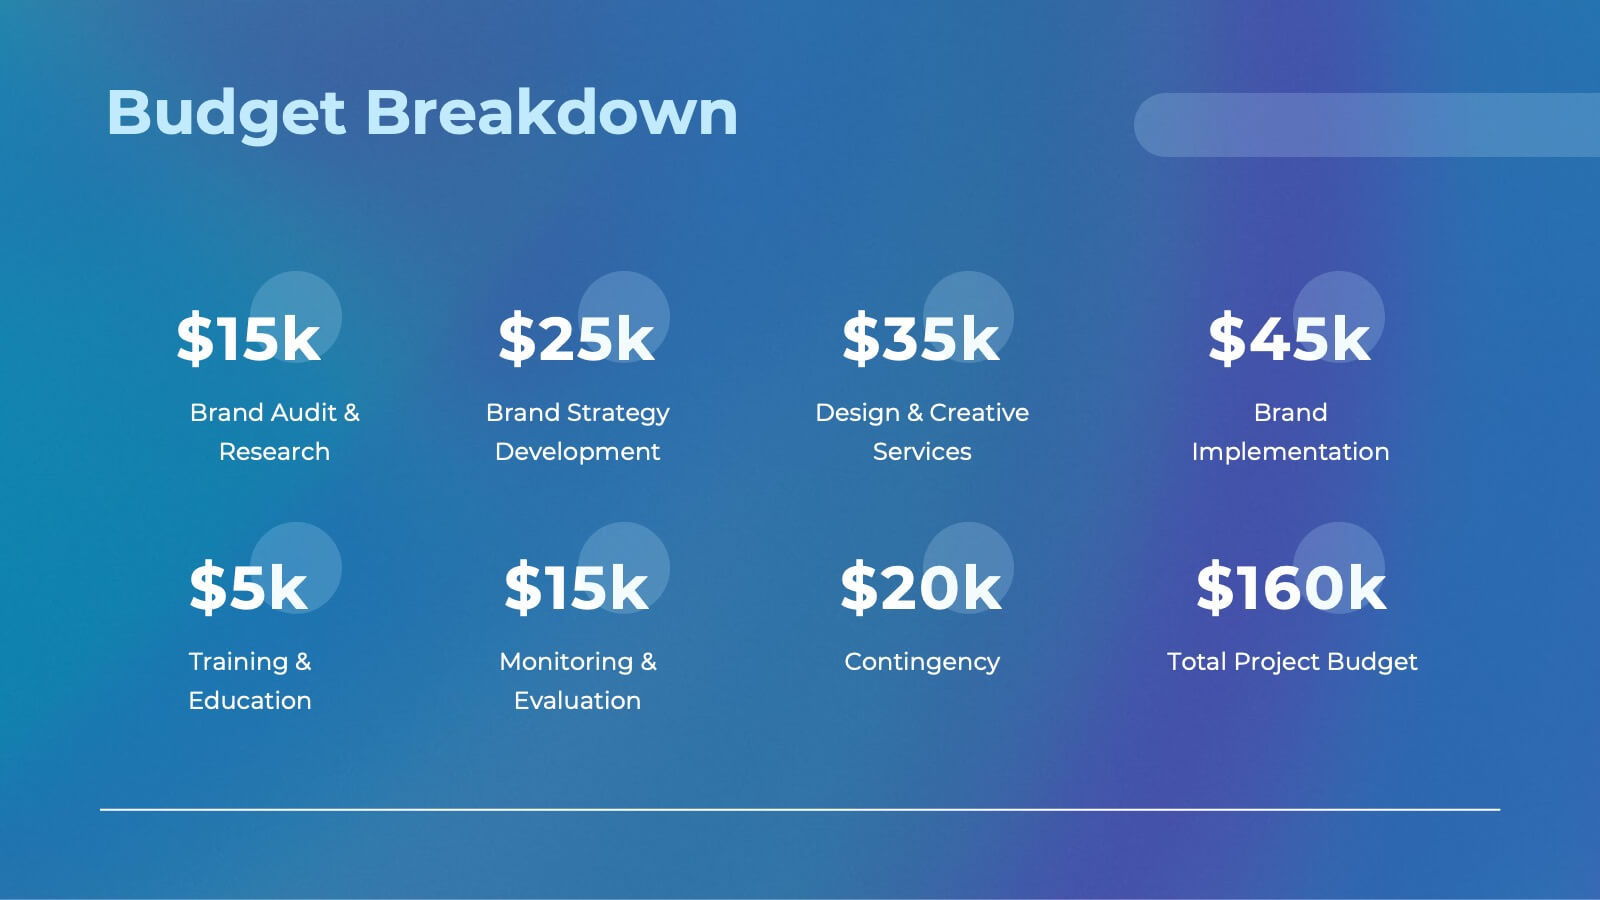
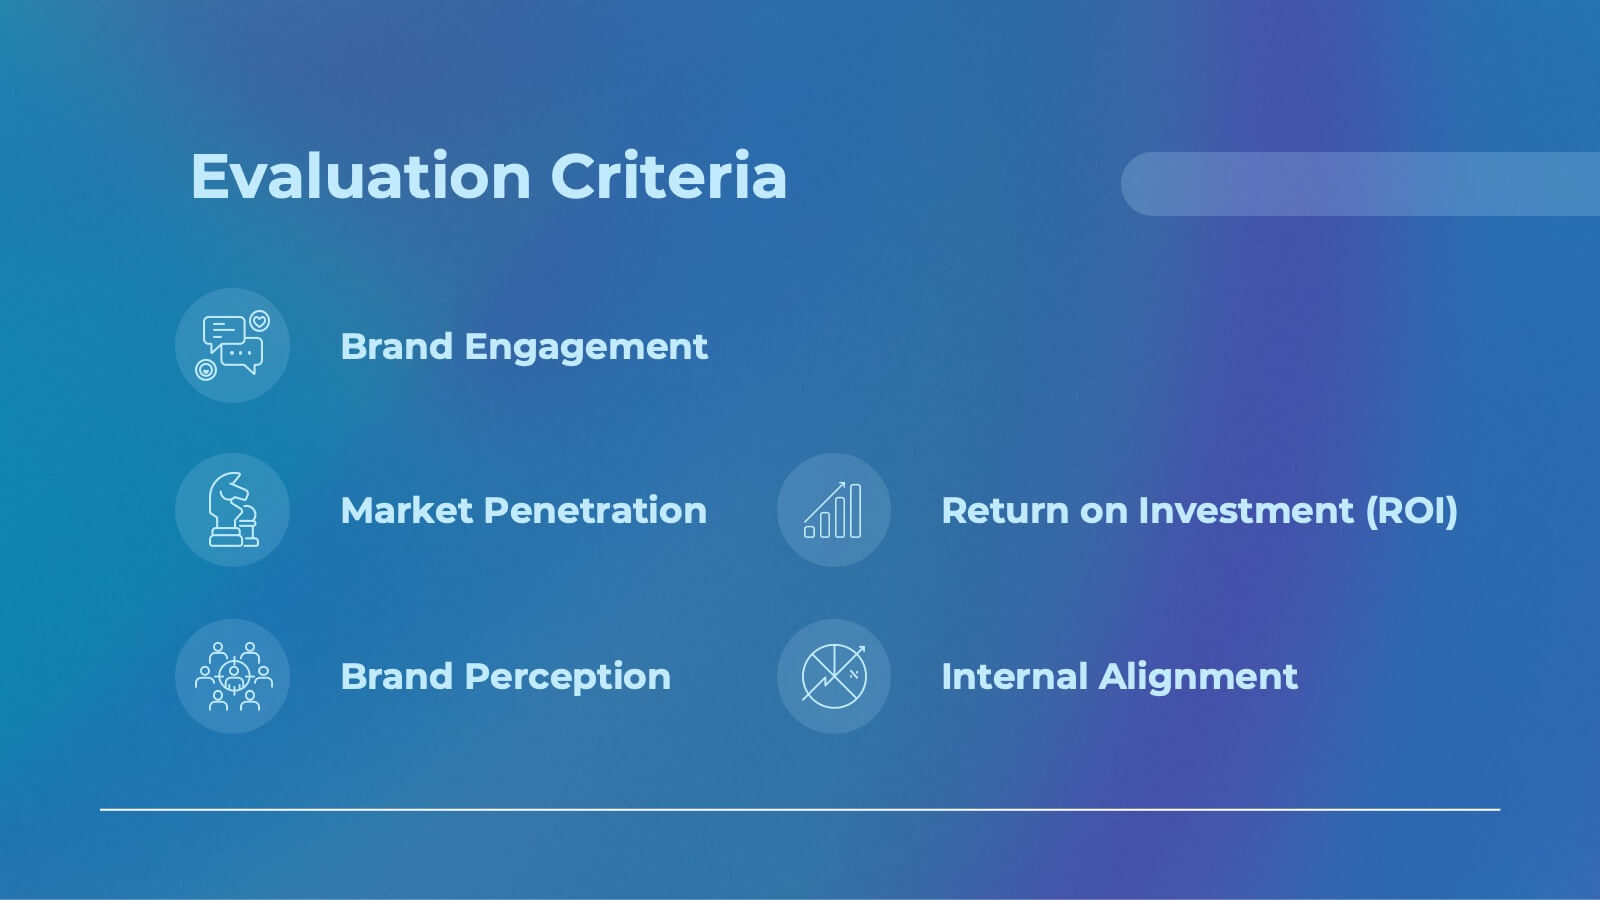
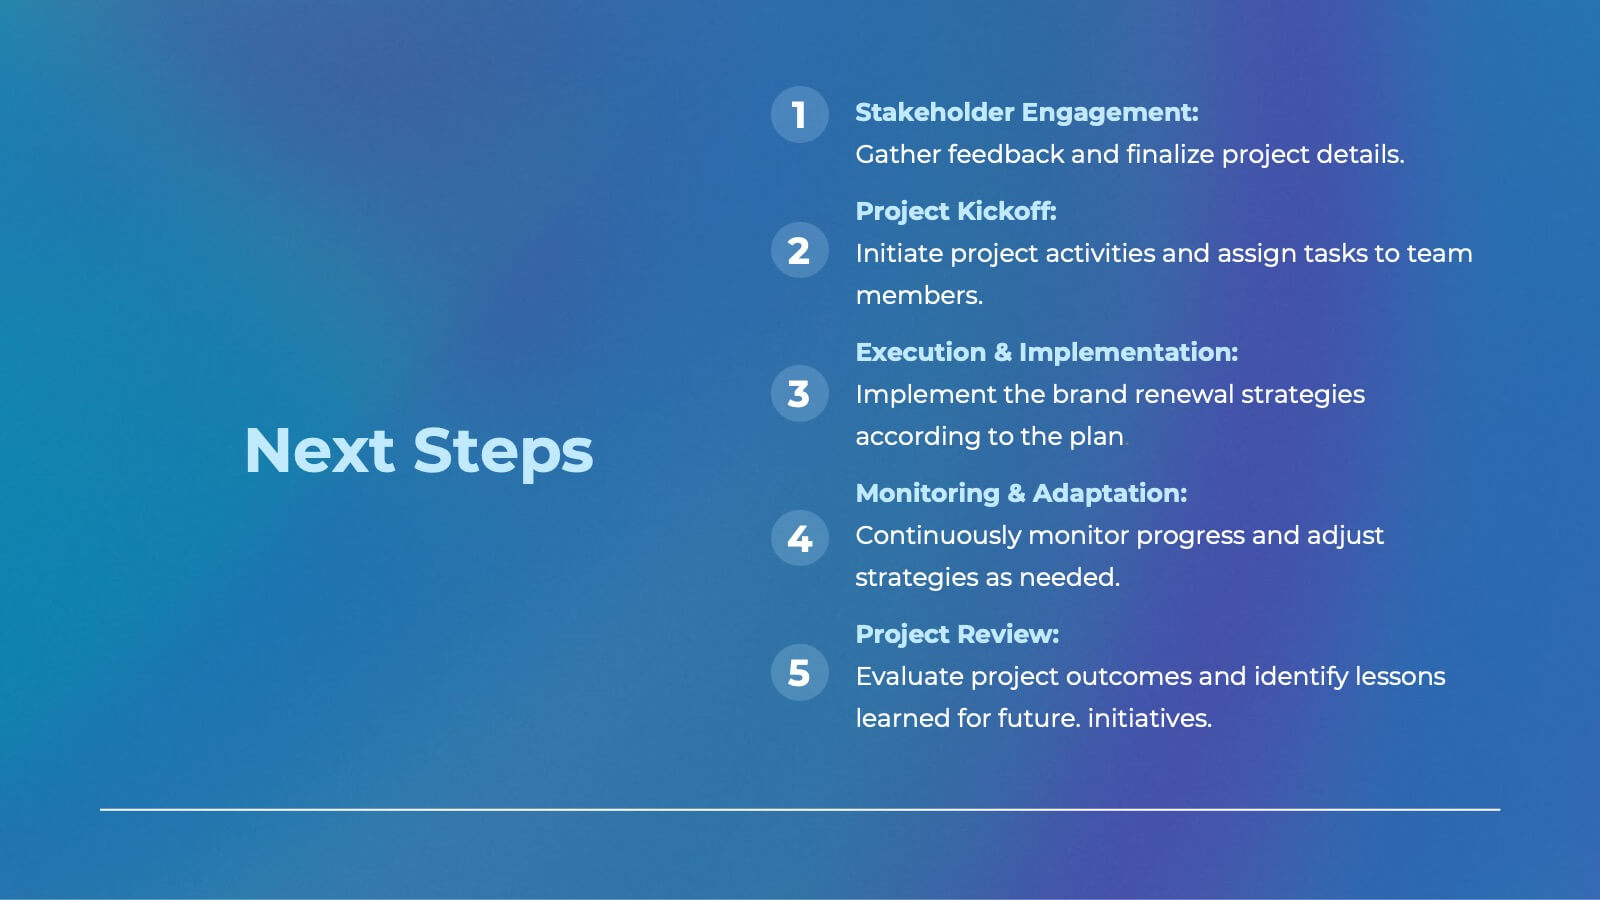
Branding Agency Company Profile Presentation
Branding for a digital agency is essential for creating a strong and memorable identity that sets it apart from competitors and resonates with its target audience. This presentation is a professional template, designed to showcase the expertise and capabilities of a branding agency. With its modern and sleek design, this presentation is perfect for introducing the agency's services, achievements, and client success stories to potential clients, partners, or investors. This template is perfect to showcase successful branding projects and campaigns, emphasizing the challenges faced, the creative solutions employed, and the results achieved for clients.


21 diapositivas
Ember Agile Project Plan Presentation
Ready to ace your next project proposal? This sleek presentation template is perfect for outlining objectives, timelines, and budgets. Designed for professionals aiming to impress stakeholders and secure approvals. Compatible with PowerPoint, Keynote, and Google Slides, it ensures a smooth and professional presentation every time. Ideal for project managers and business leaders.


7 diapositivas
KPI Dashboard Infographic Presentation Template
A KPI (Key Performance Indicator) dashboard is a visual tool that displays important metrics and data related to a specific business or organizational goal. It allows users to track and monitor key performance indicators (KPIs) over time, making it easier to identify trends, track progress, and make data-driven decisions. This template is perfect for keeping track of important information about your business or organization. This template include a variety of charts, graphs, and tables that present information in an easy-to-understand format. Customized to track different types of data.


5 diapositivas
Annual Business Report Slide Deck Presentation
Turn your yearly data into a stunning visual story with this clean and structured presentation design. Perfect for showcasing company performance, growth metrics, and strategic goals, it helps make complex data clear and engaging. Fully editable and compatible with PowerPoint, Keynote, and Google Slides for seamless customization.


5 diapositivas
Cyber Security Best Practices Infographics
Navigate the digital landscape safely with our cyber security best practices infographics. Crafted in a striking combination of black with colorful accents, this creative, vertical template is a powerhouse of cyber safety education. It's an indispensable resource for IT professionals, and educators seeking to propagate security protocols. The design encapsulates compelling graphics, intuitive icons, and dedicated placeholders. Compatible with Powerpoint, Keynote, and Google Slides. By employing this infographic, users can foster a culture of digital vigilance and defense, making it an asset in the fight against online threats.


21 diapositivas
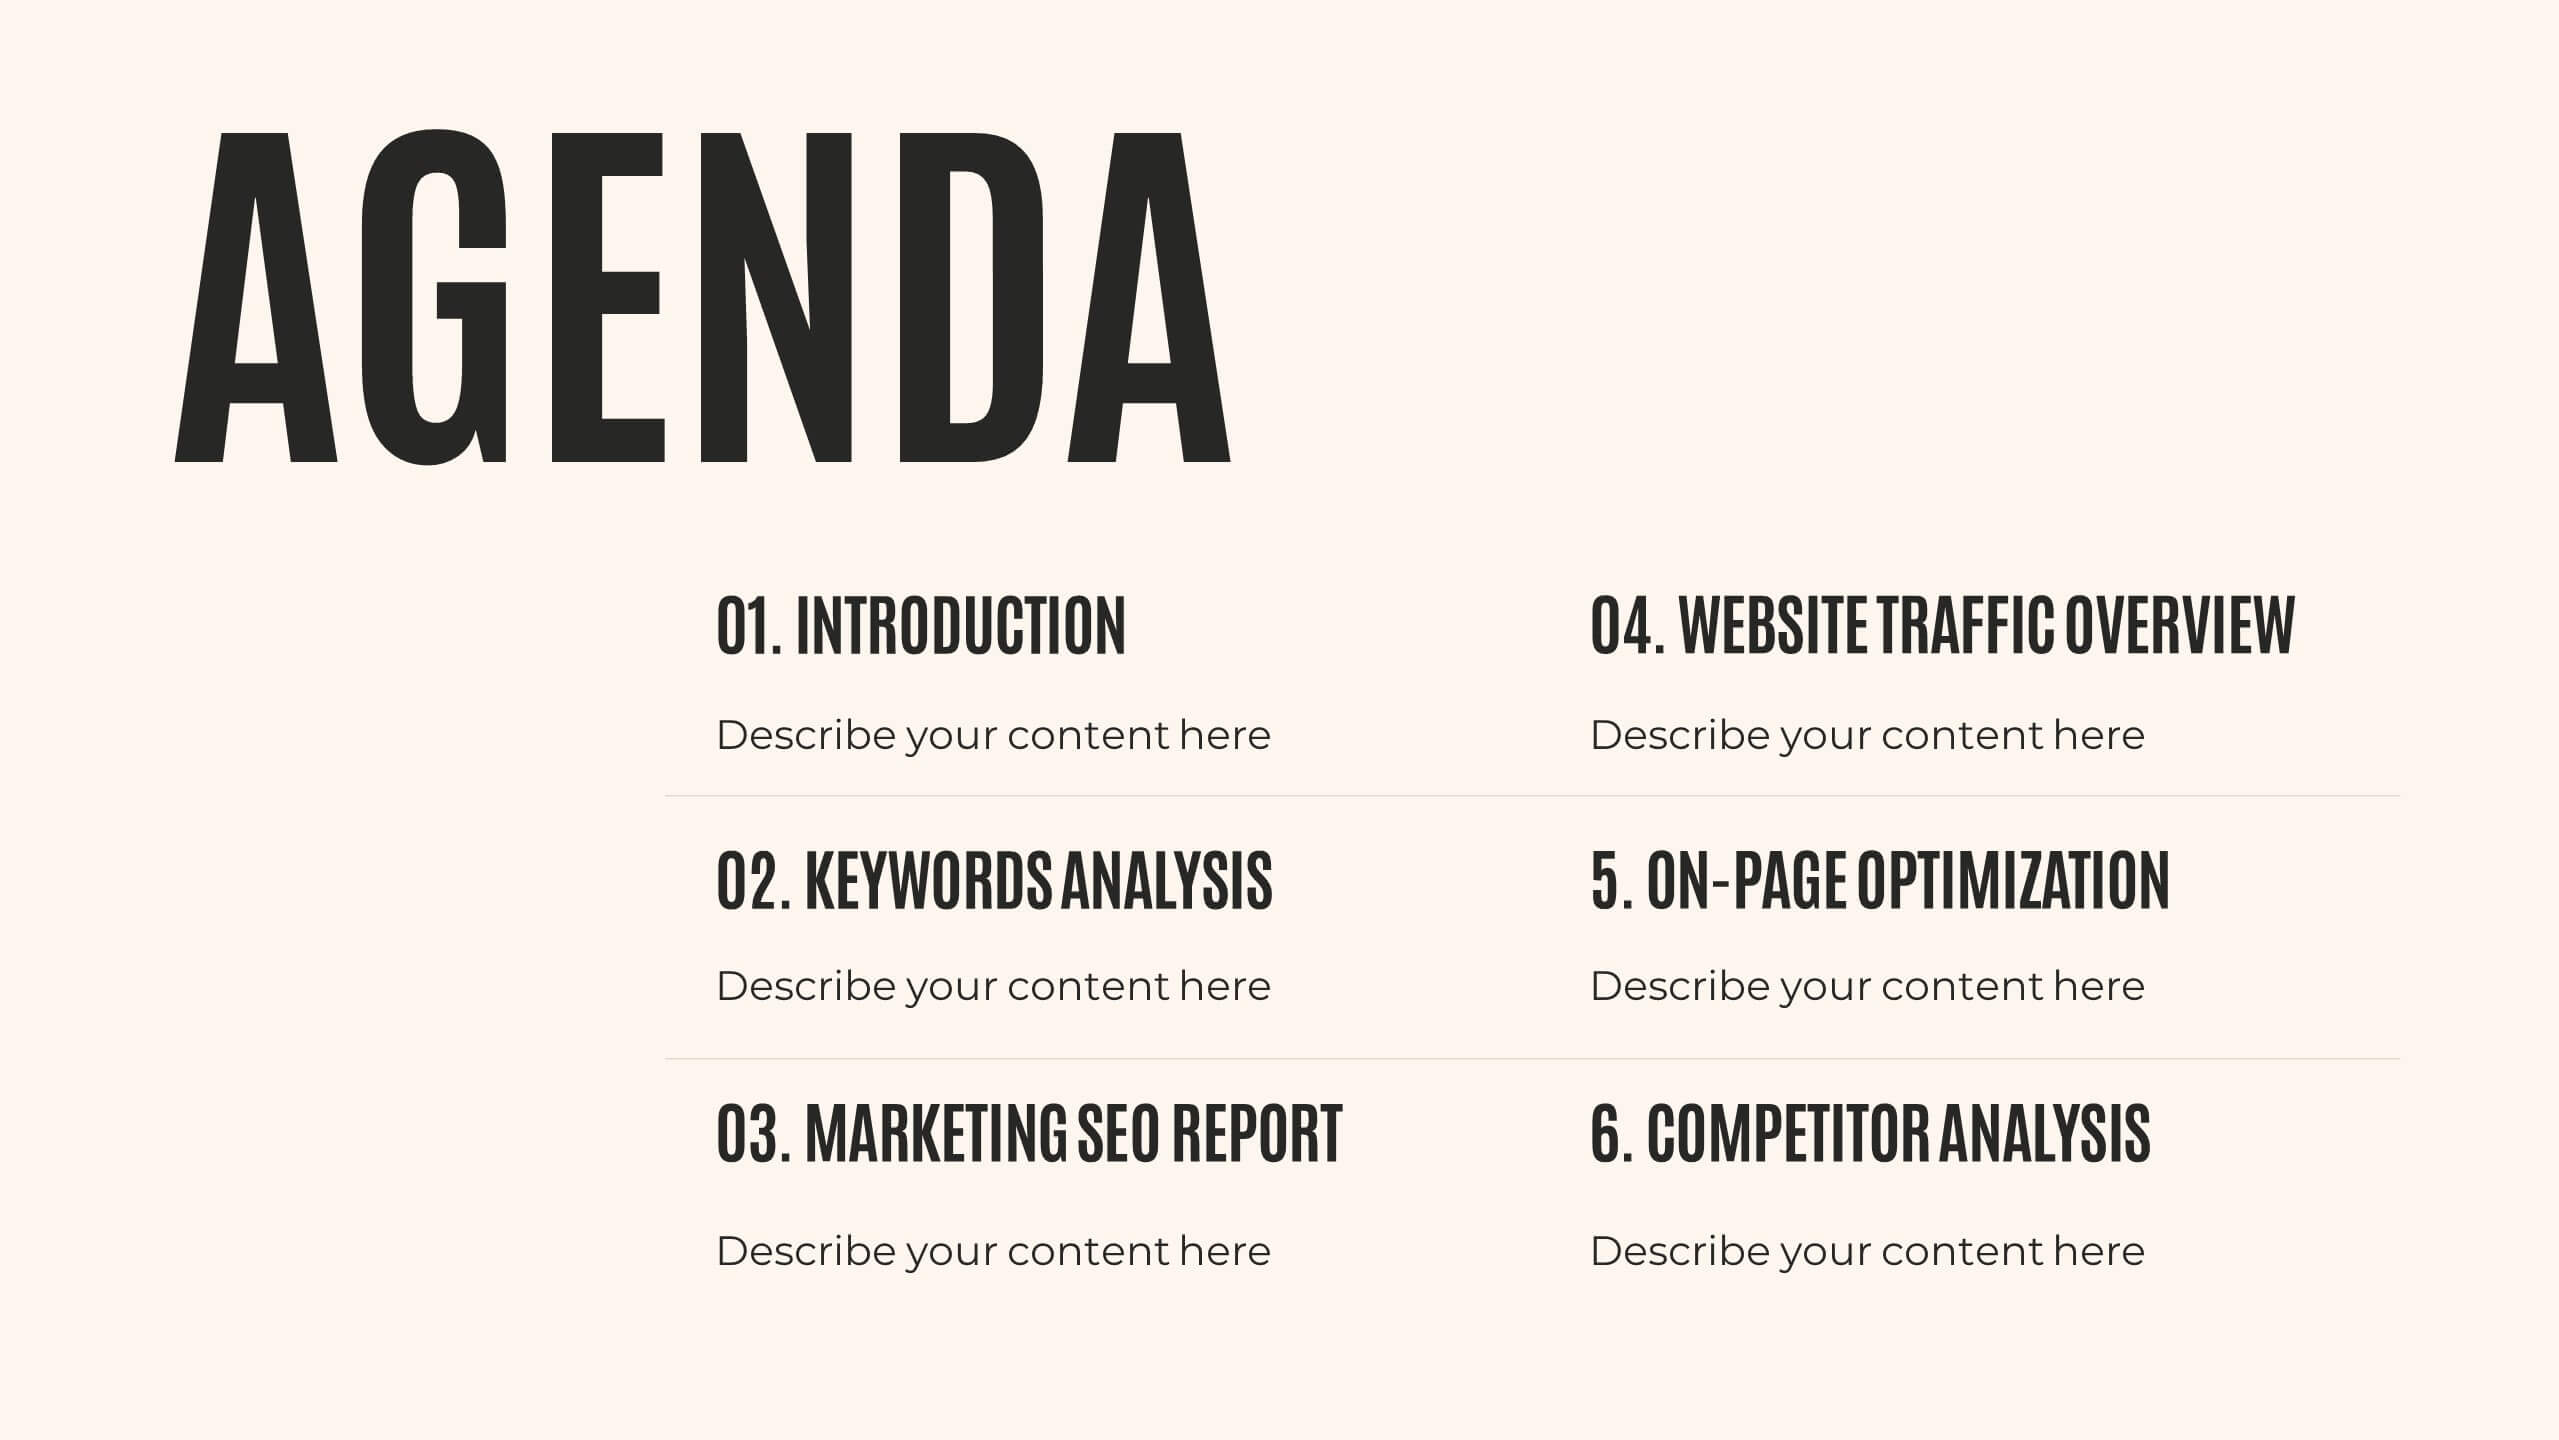
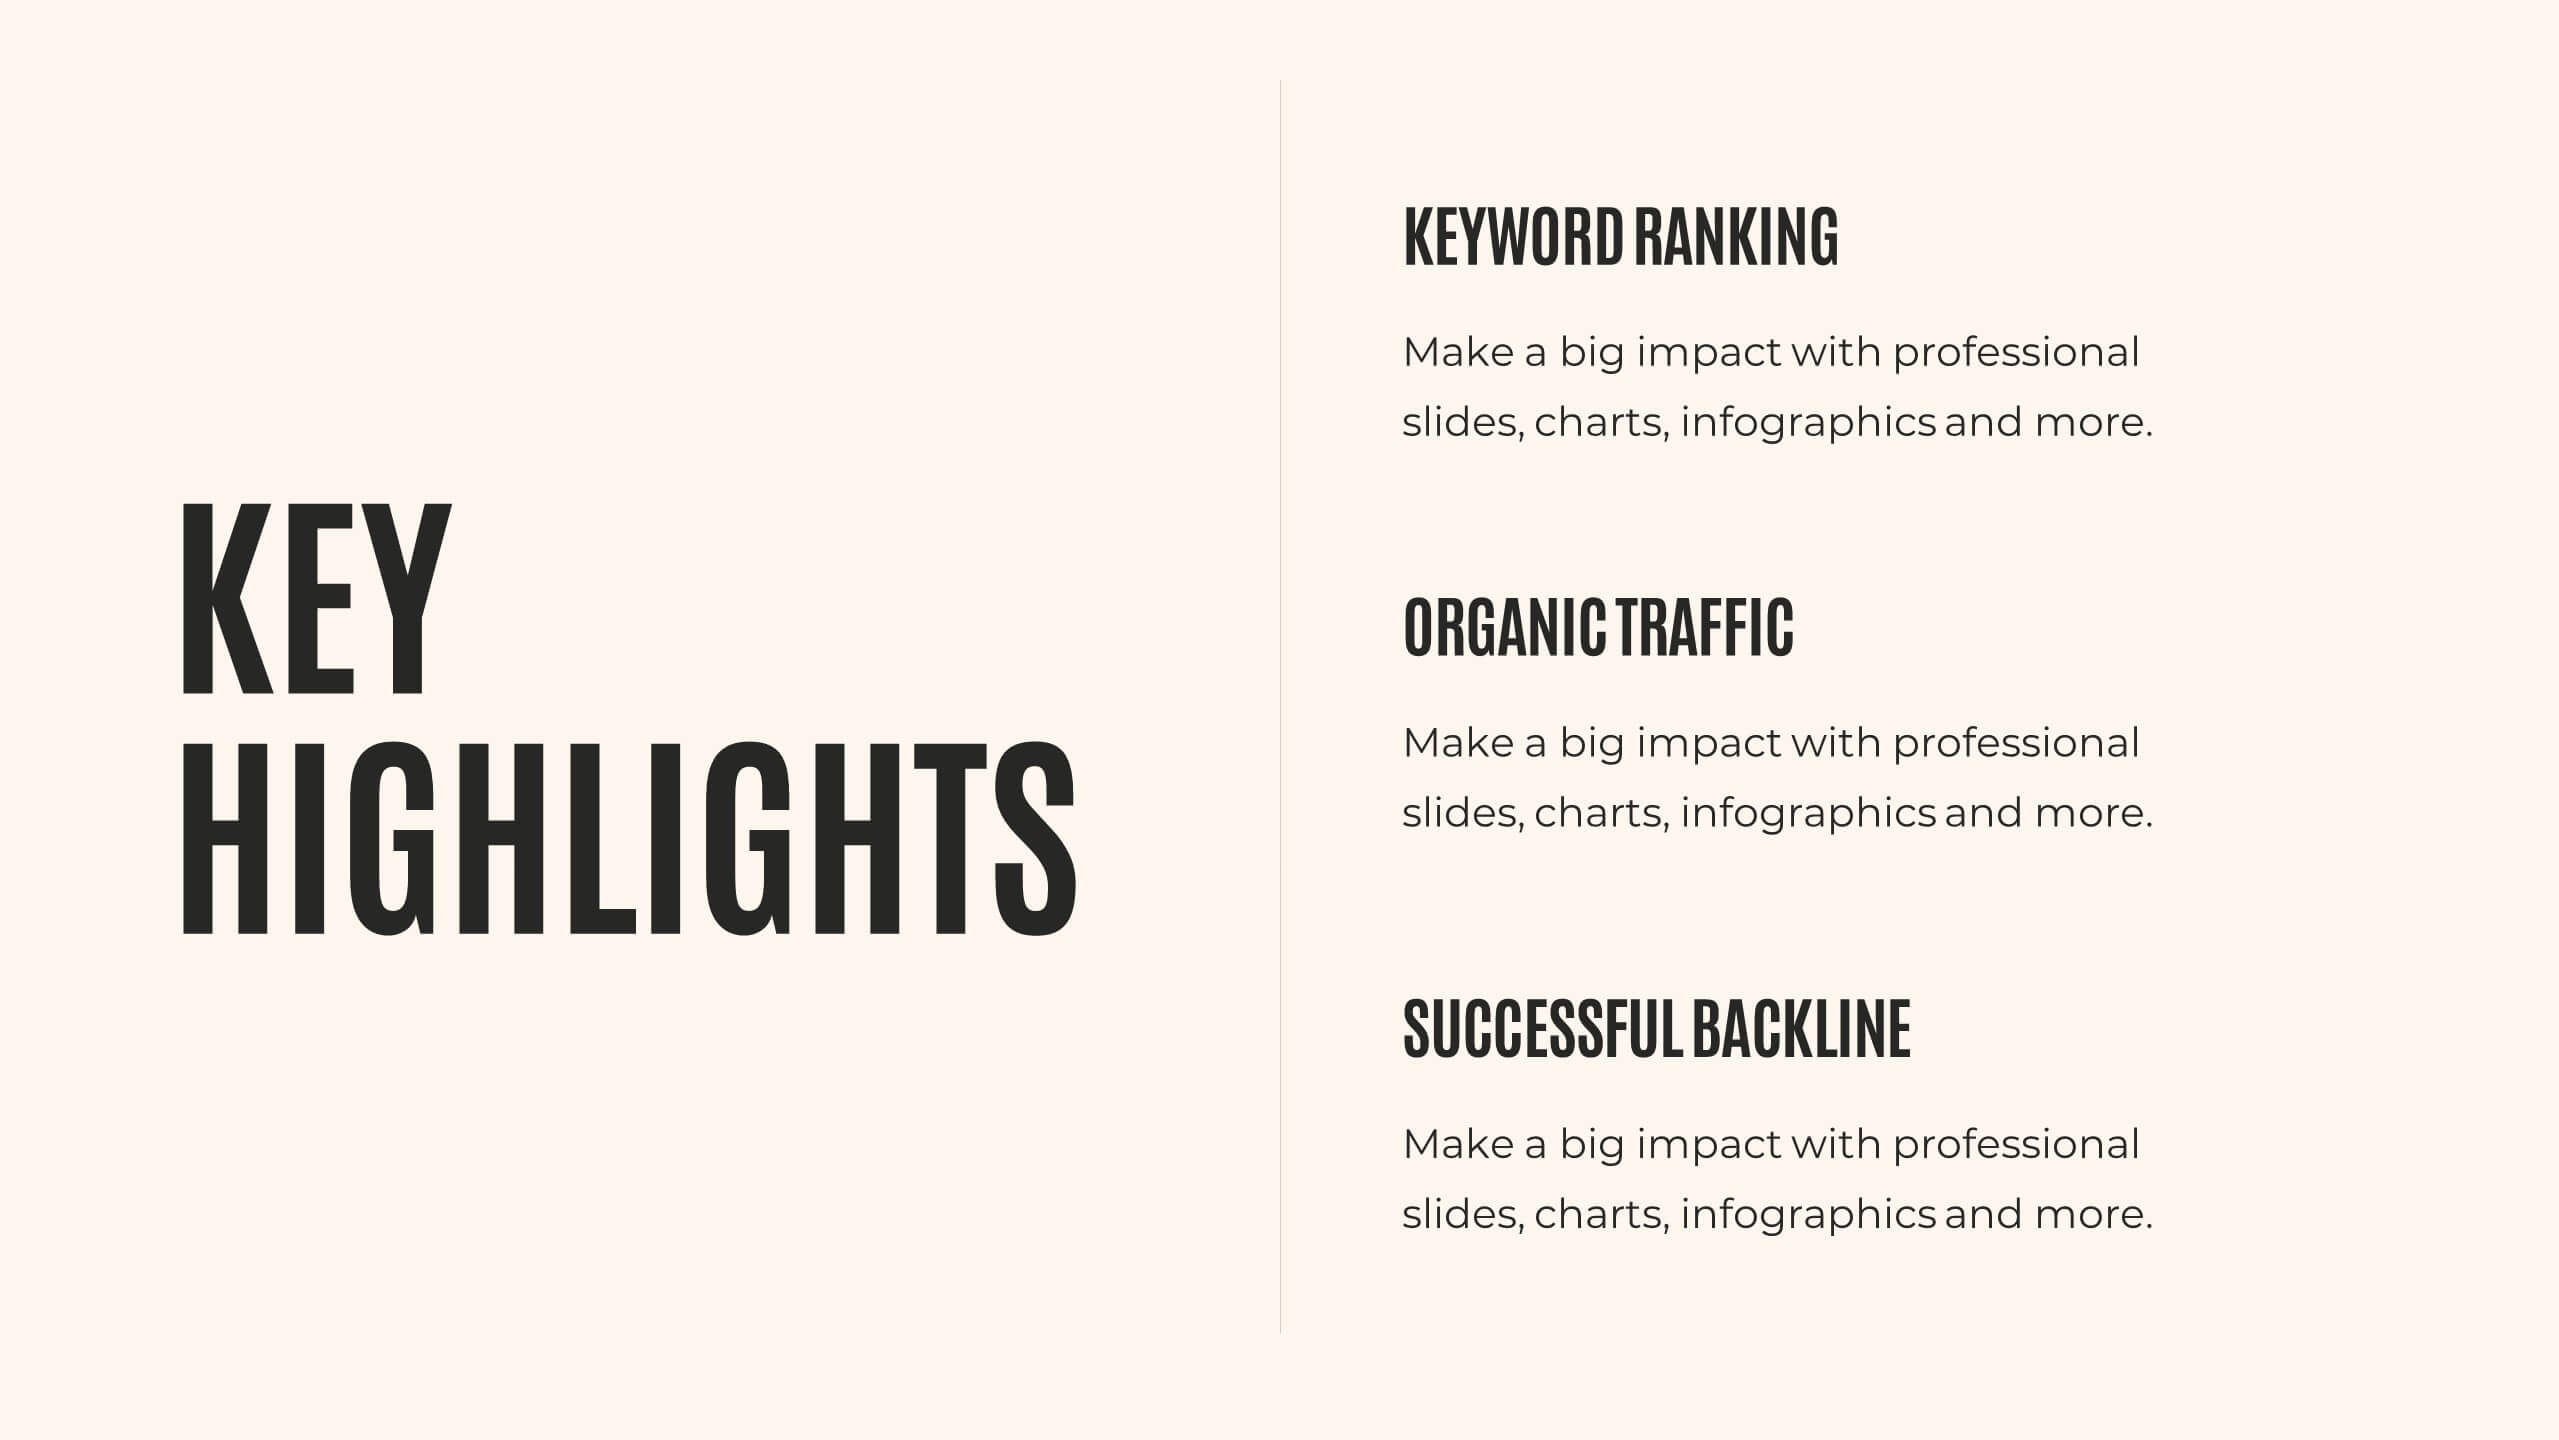
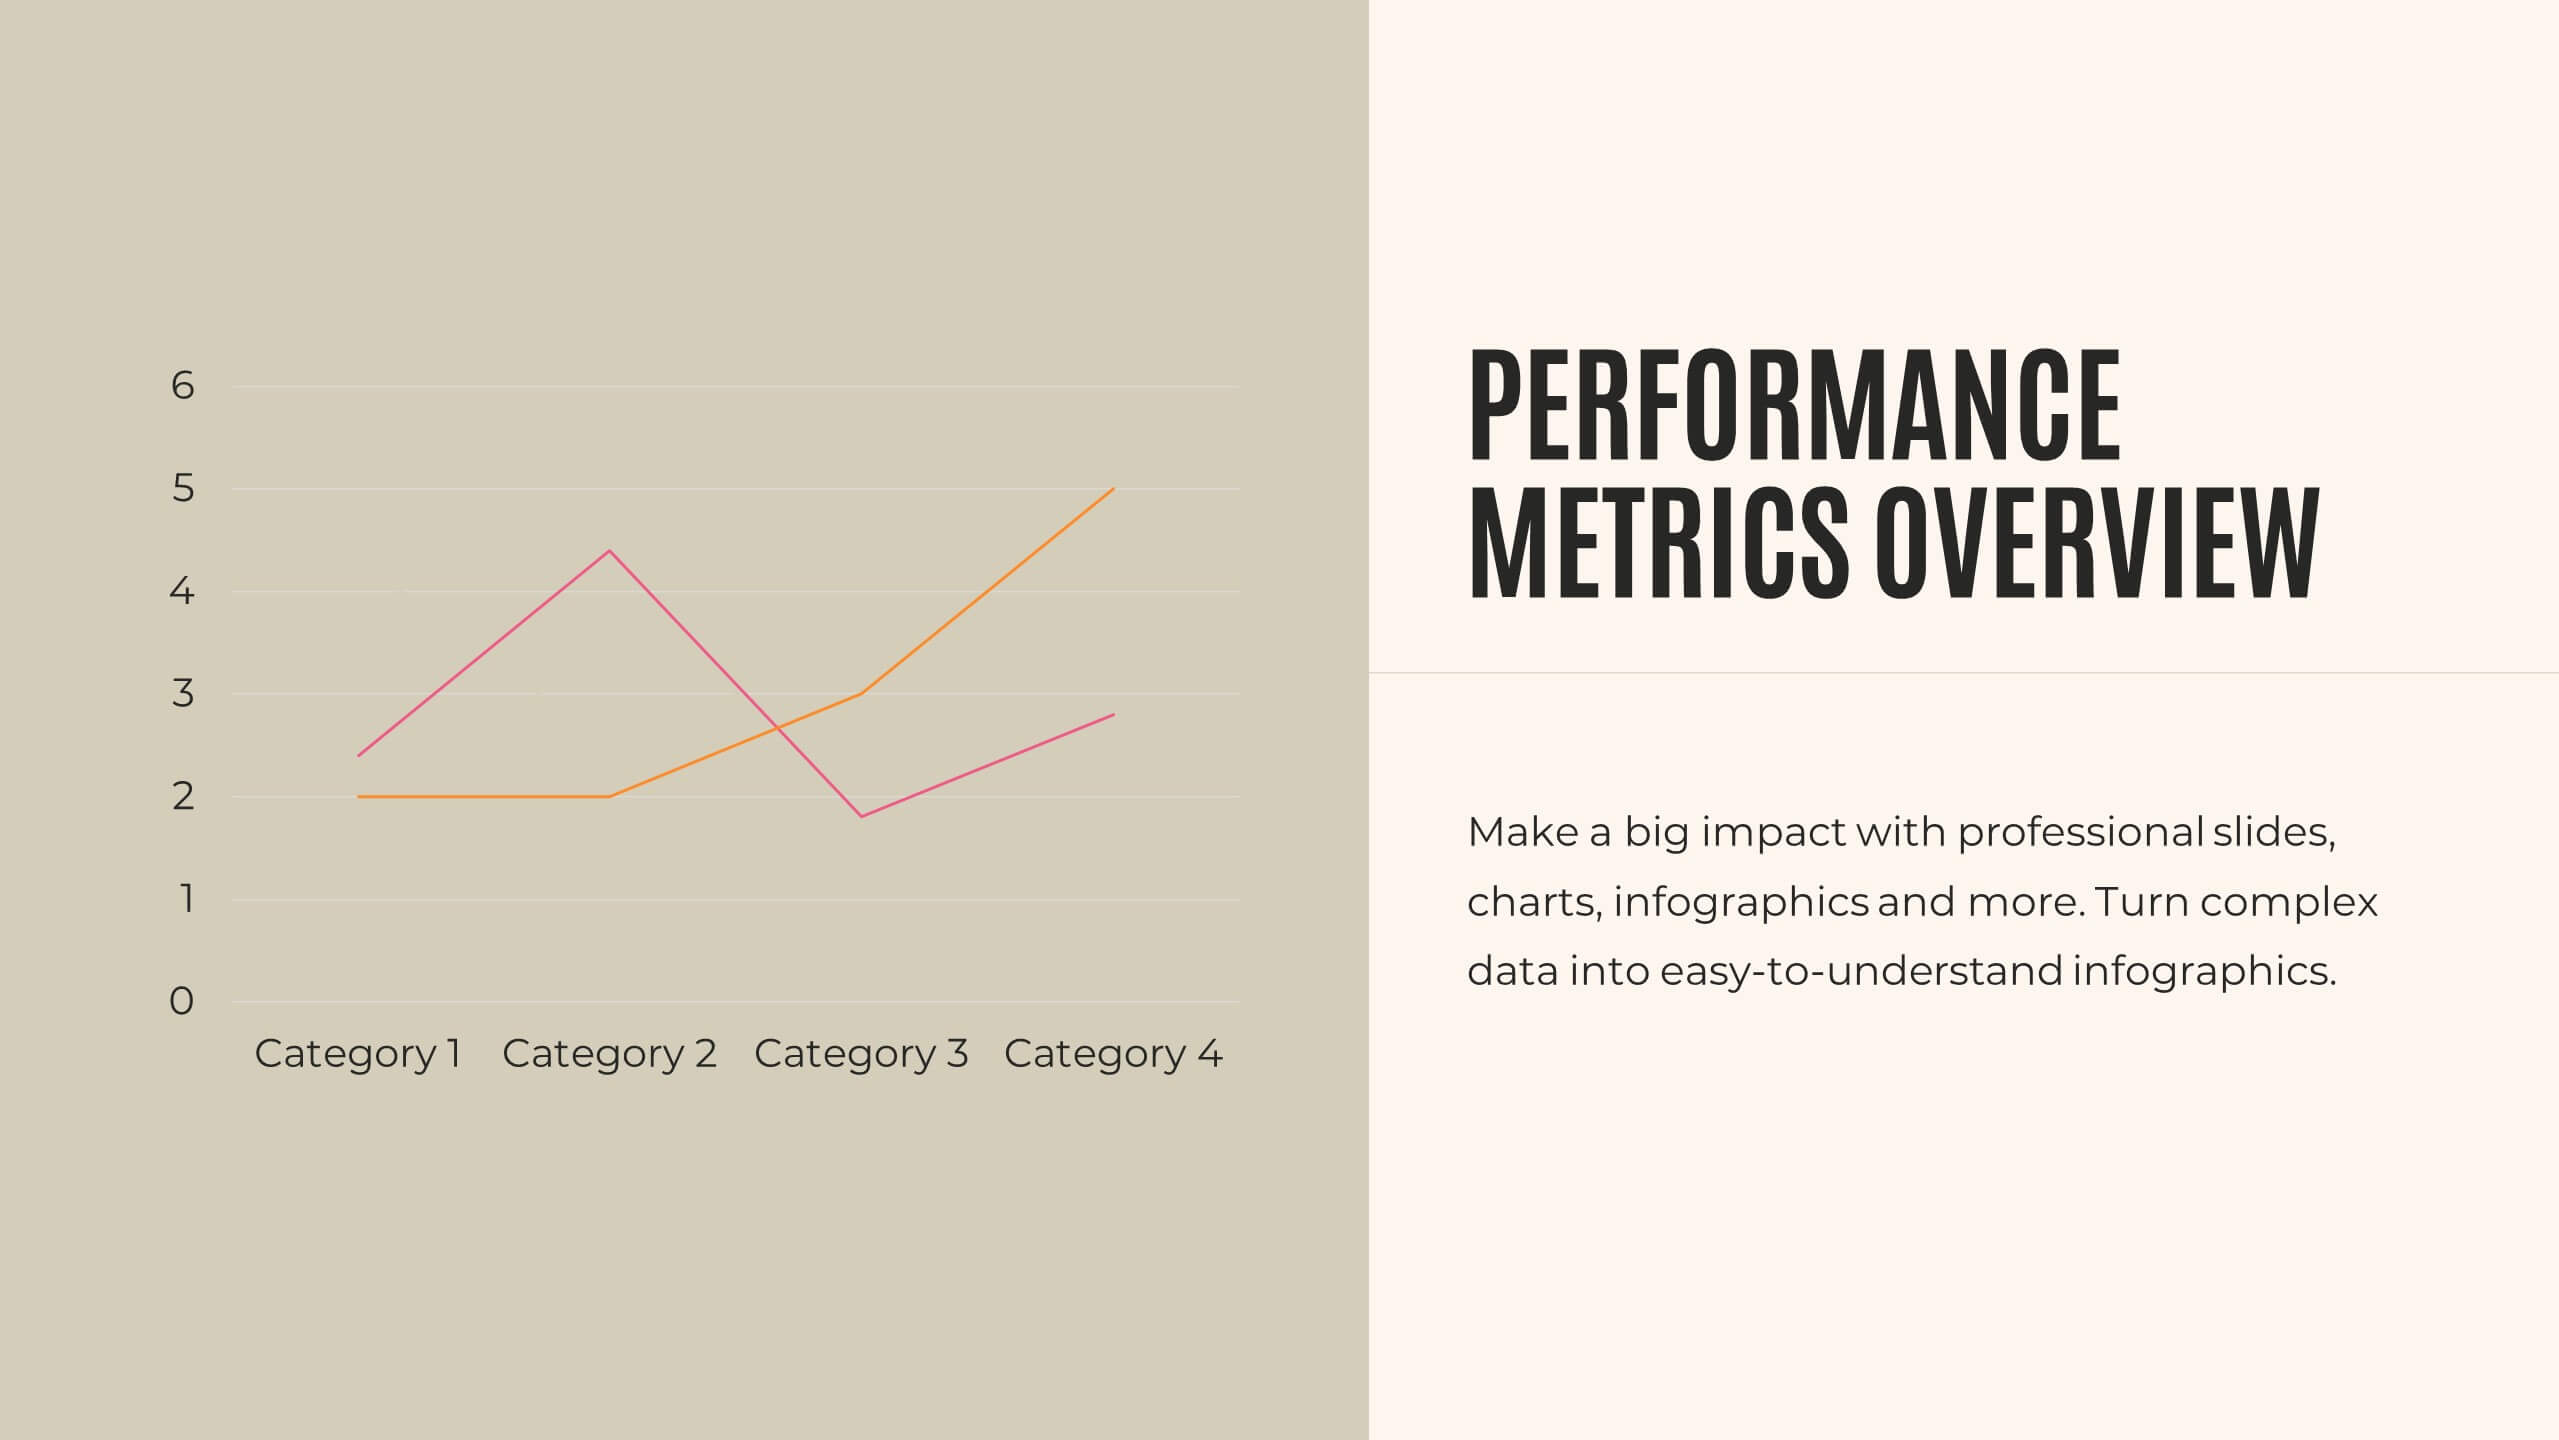
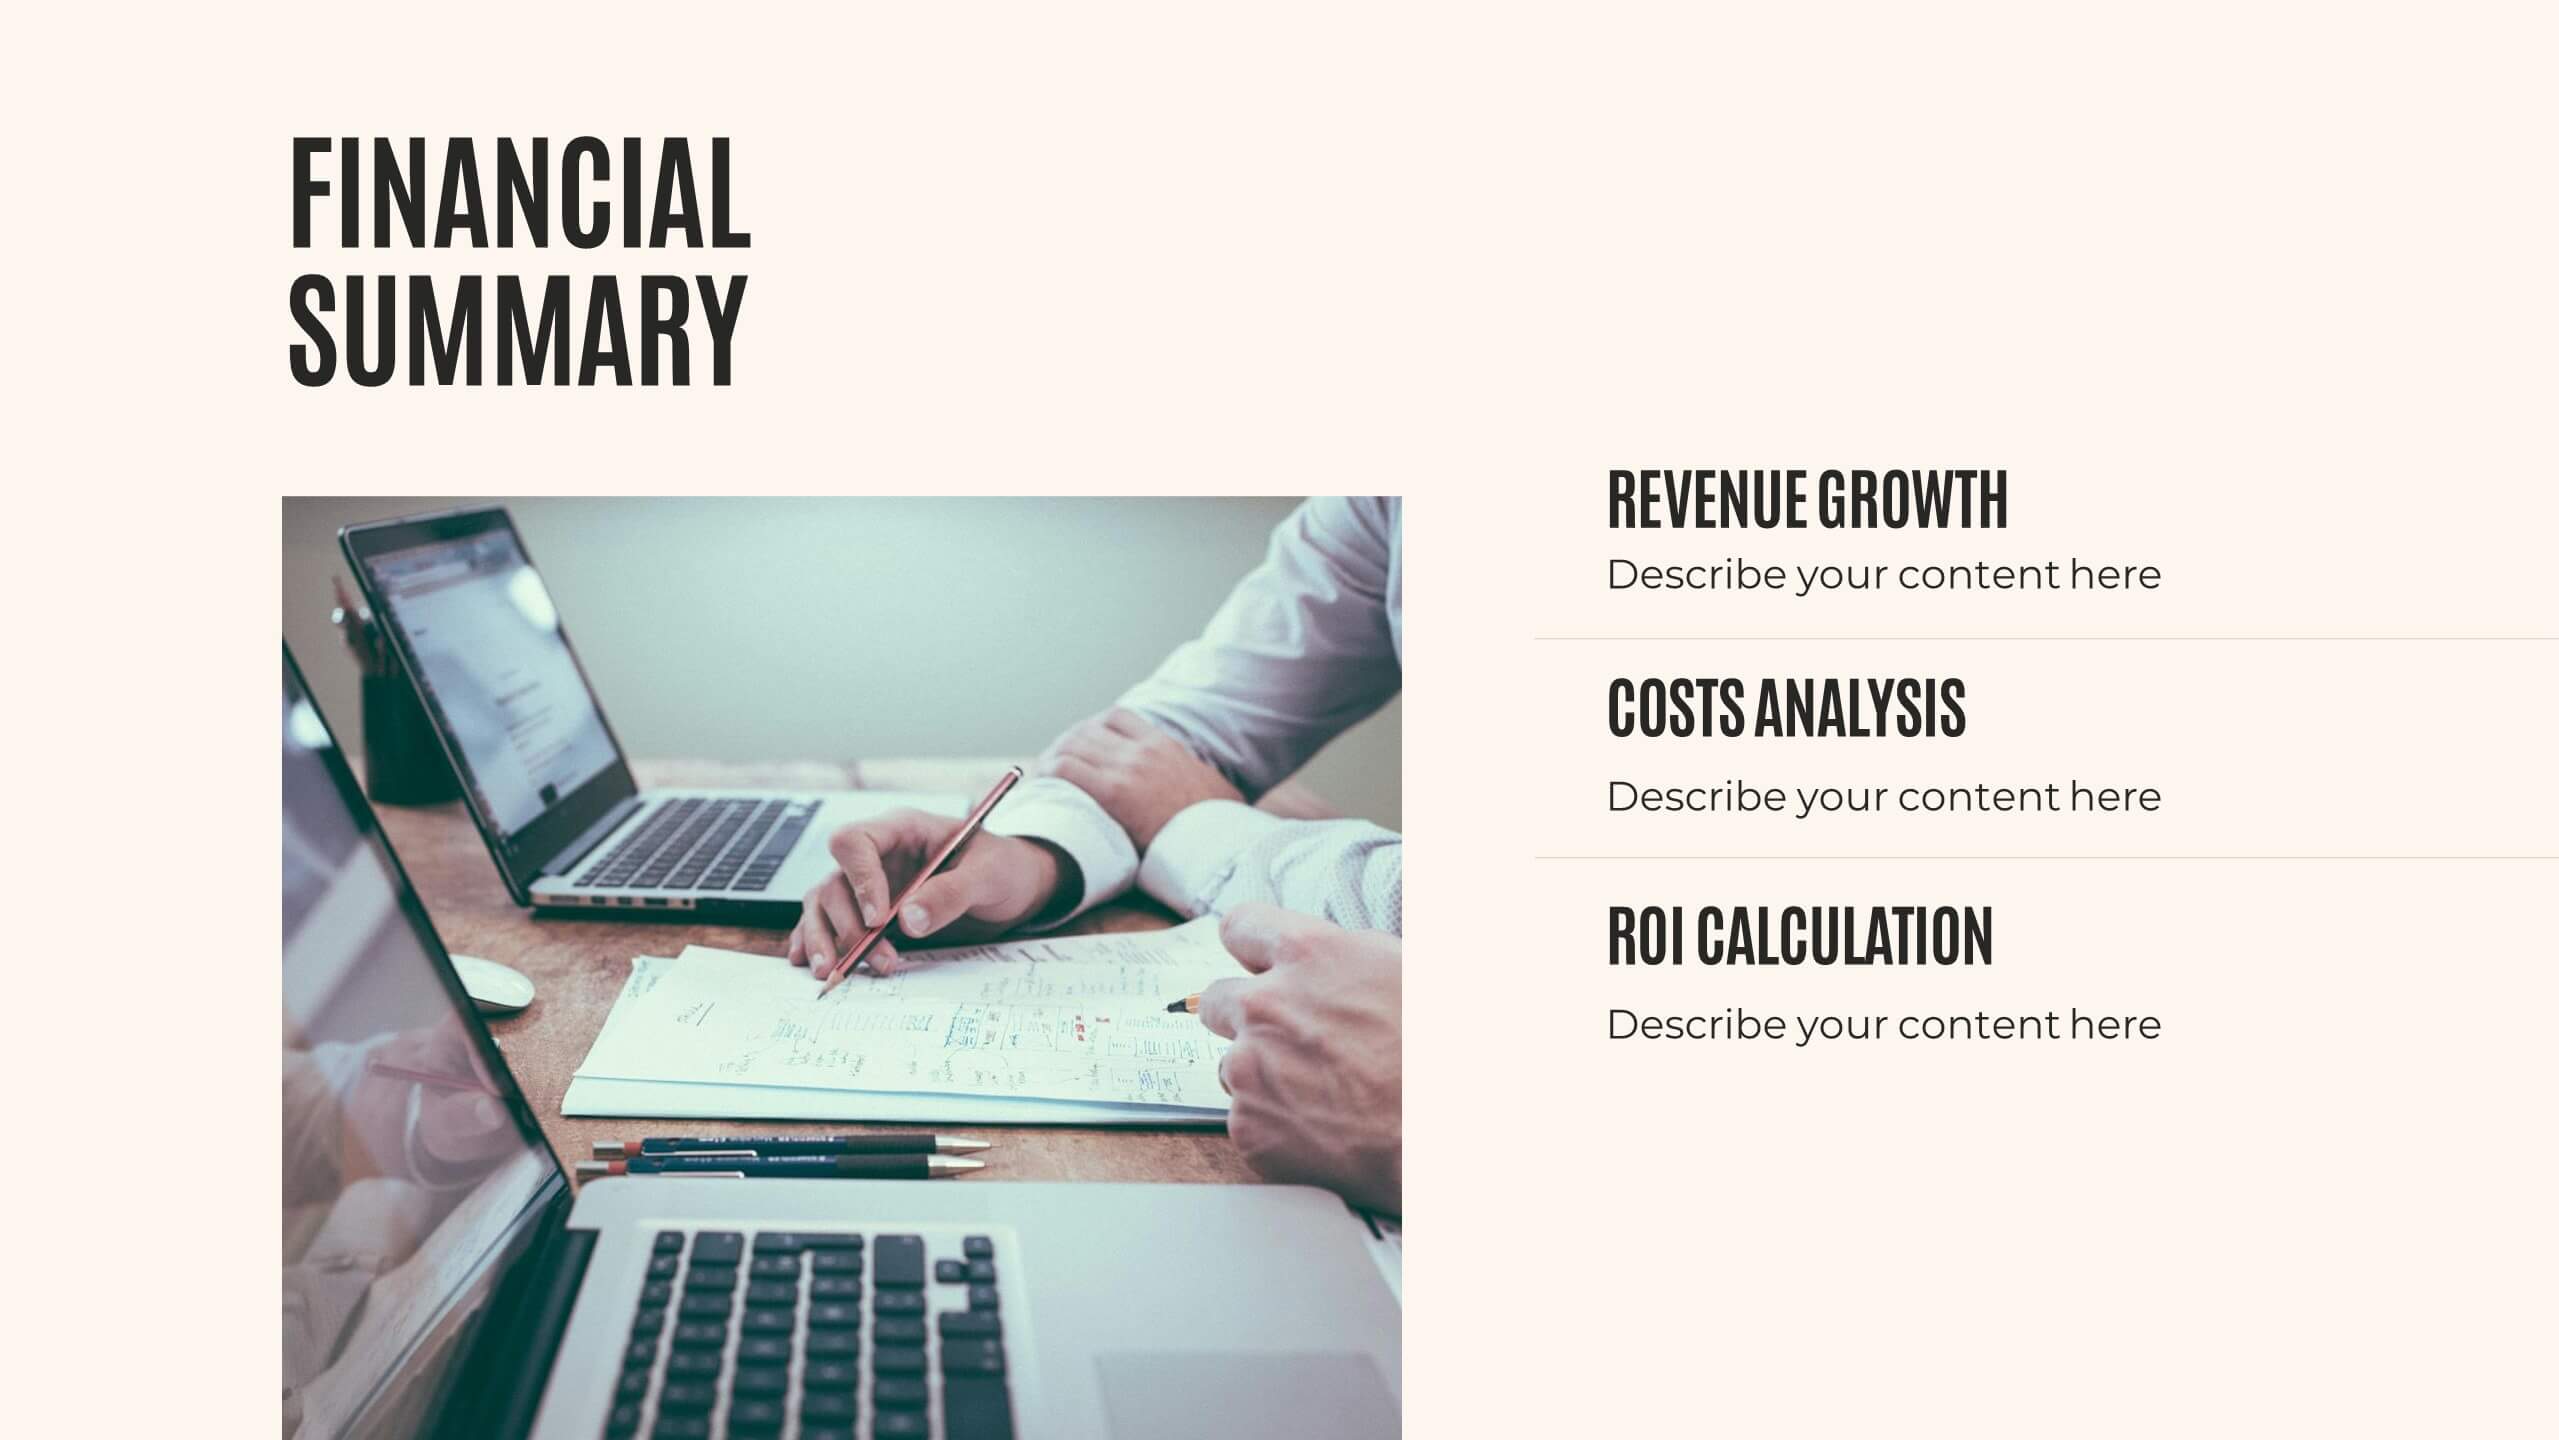
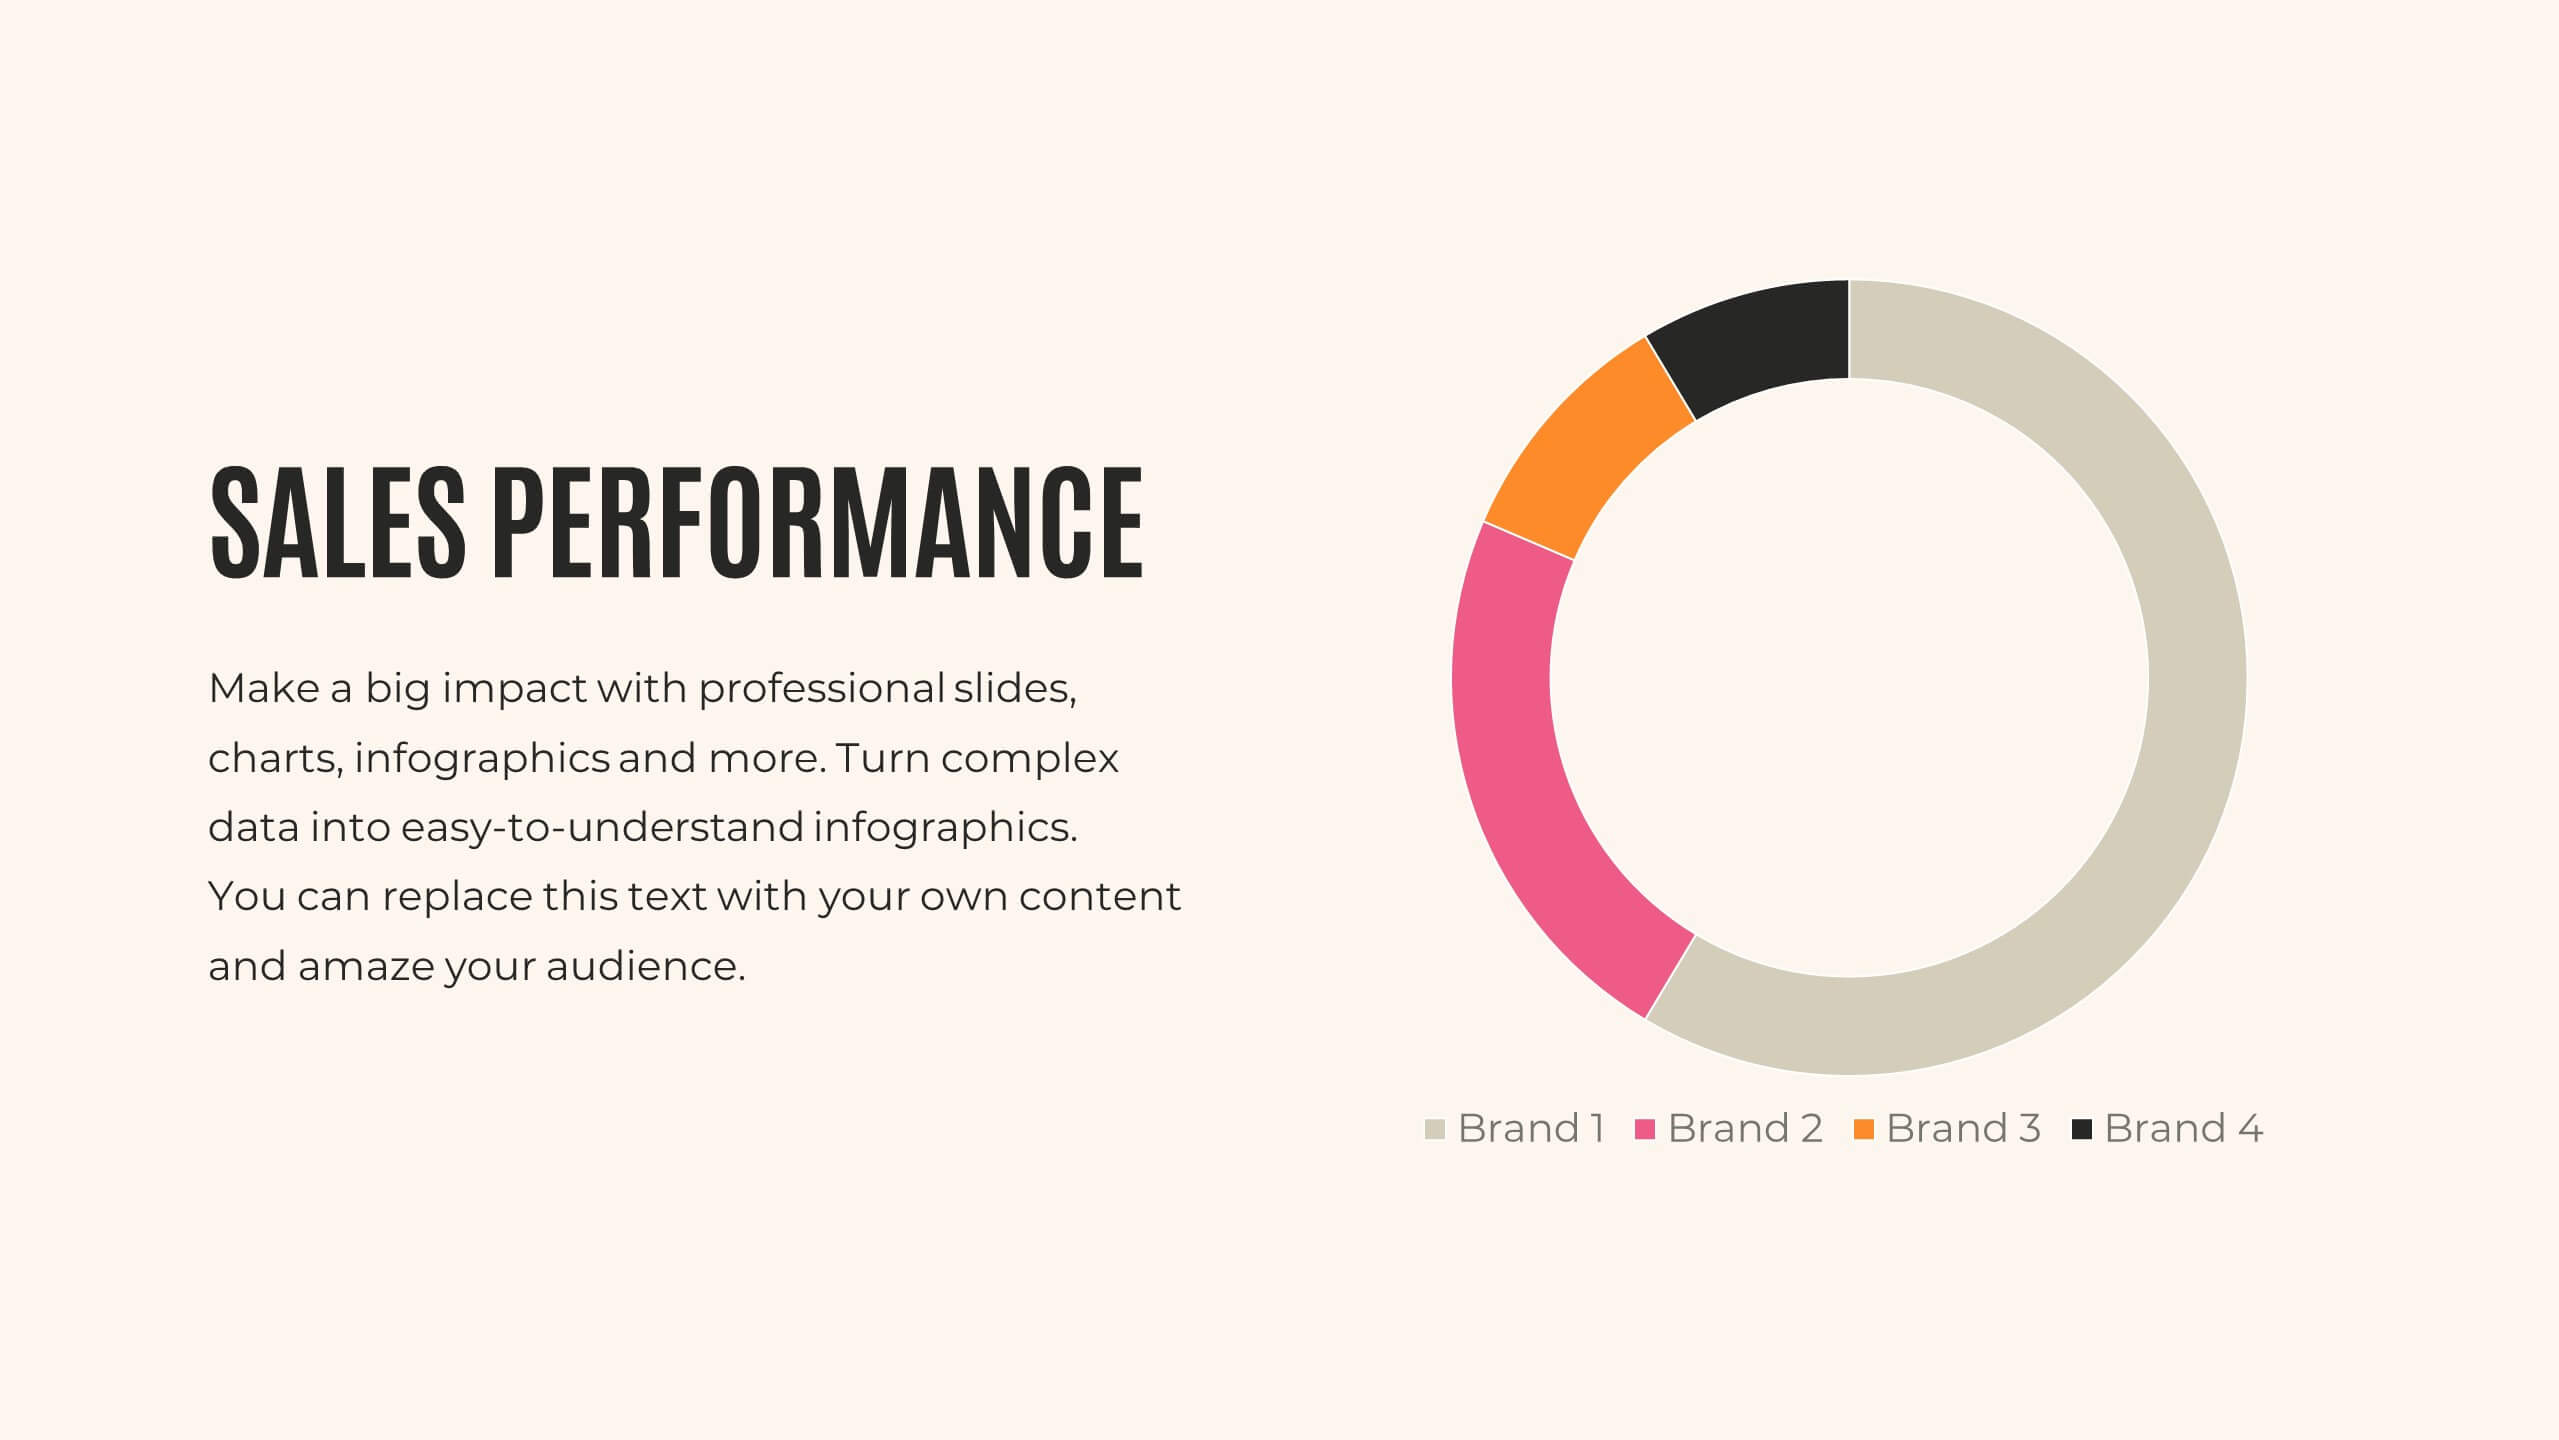
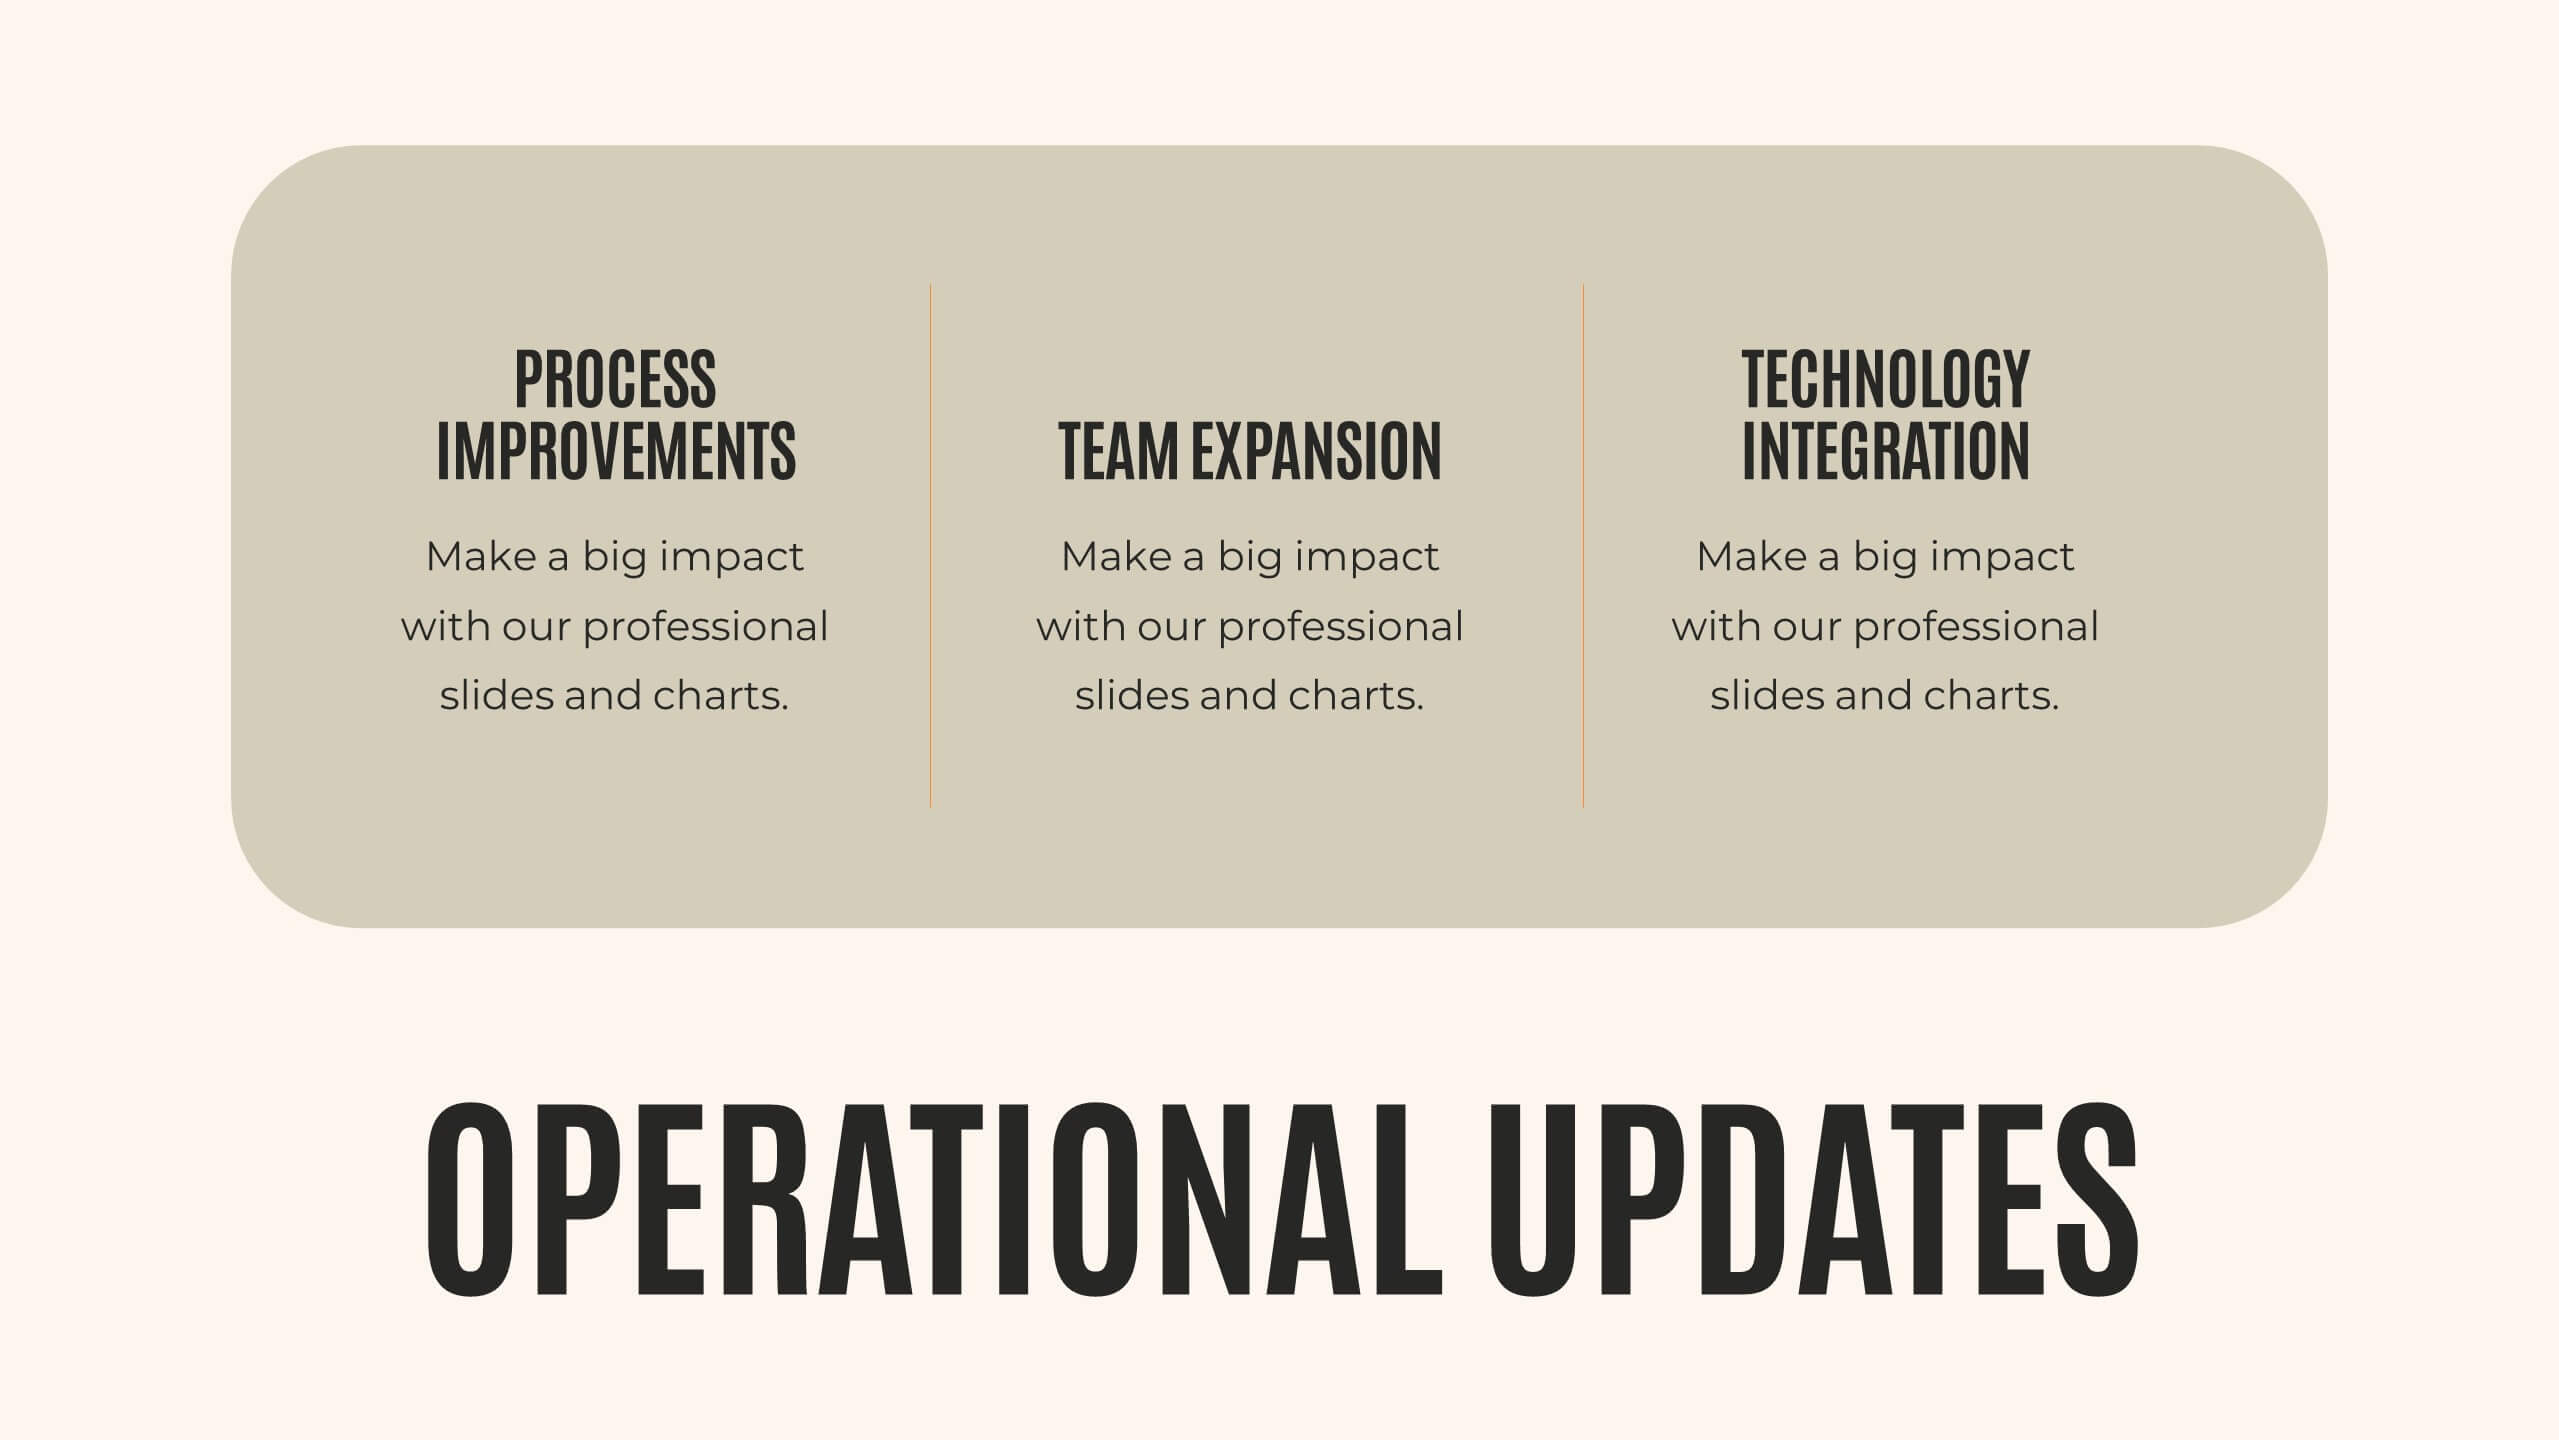
Journey Annual Report Presentation
Present your annual report with clarity and impact! This template covers agenda, key highlights, financial summary, sales performance, and project progress. Ideal for detailing achievements, insights, and future priorities. Compatible with PowerPoint, Keynote, and Google Slides, it ensures your data is visually compelling and easy to understand. Showcase your success effortlessly!


23 diapositivas
Naiad Qualitative Research Findings Presentation
Dive into your data with this refreshing, Naiad-inspired presentation template, perfect for sharing qualitative research findings! Designed to showcase insights, trends, and key conclusions with clarity, this visually appealing layout ensures your research captivates and informs. Make your data flow effortlessly. Compatible with PowerPoint, Keynote, and Google Slides for easy customization.


2 diapositivas
Creative Work Portfolio Collection Presentation
Present your projects with impact using the Creative Work Portfolio Collection Presentation. Designed for photographers, artists, and creators, this layout highlights visuals while leaving space for thoughtful captions or project notes. Easily editable and fully compatible with Canva, PowerPoint, Keynote, and Google Slides to match your brand and showcase your style.


20 diapositivas
Solstice Product Launch Presentation
Introducing our product launch template! Highlight your product’s features, target audience, and unique selling proposition with a sleek, modern design. Showcase marketing strategies, distribution channels, and competitive landscape effortlessly. Ideal for sales teams and marketers. Compatible with PowerPoint, Keynote, and Google Slides.