


Características


¿Tienes alguna pregunta?
Recomendar


7 diapositivas
Sales Cycle Infographic
A sales cycle, refers to the series of stages or steps that a salesperson or a sales team follows to convert a prospective customer into a paying customer. This infographic template is a structured approach to lead a potential customer from the initial contact to making a purchase. Compatible with Powerpoint, Keynote, and Google Slides. This is an illustrative guide to the fundamental stages of the sales journey. Equip yourself with an understanding of how sales progress, from prospecting to closing the deal, enabling you to optimize your strategies and drive success in the dynamic world of sales.


6 diapositivas
Buyer Behavior Trends Infographic
Unlock the secrets of consumer psychology with our Buyer Behavior Trends Infographic Template. This template offers a compelling visual exploration of modern consumer trends, designed to capture and convey the nuances of buyer behavior in today’s fast-paced market. Featuring a sleek, modern design, each slide is tailored to present data effectively, from spending habits and brand loyalty to digital consumption and decision-making processes. Use this template to illustrate the underlying factors that influence consumer choices and how these trends shape the future of marketing. Perfect for marketers, researchers, and business strategists, this template allows you to customize layouts, colors, and fonts to align with your brand or study focus. It's an invaluable tool for presentations, reports, and digital content, helping you to communicate complex data in an accessible and engaging way.


6 diapositivas
Business Development Strategy Infographic
Business Strategy refers to a set of planned actions and decisions designed to achieve specific goals and objectives within an organization. This infographic template is designed to showcase the key elements and steps involved in a business development strategy. Ideal for entrepreneurs and marketing professionals, this template helps present the roadmap for business growth and success. The visuals showcase the market research and analysis conducted to identify target audiences, market trends, and competitors. Graphs and charts represent market growth potential and opportunities. This template is fully compatible with Powerpoint, Keynote, and Google Slides.


7 diapositivas
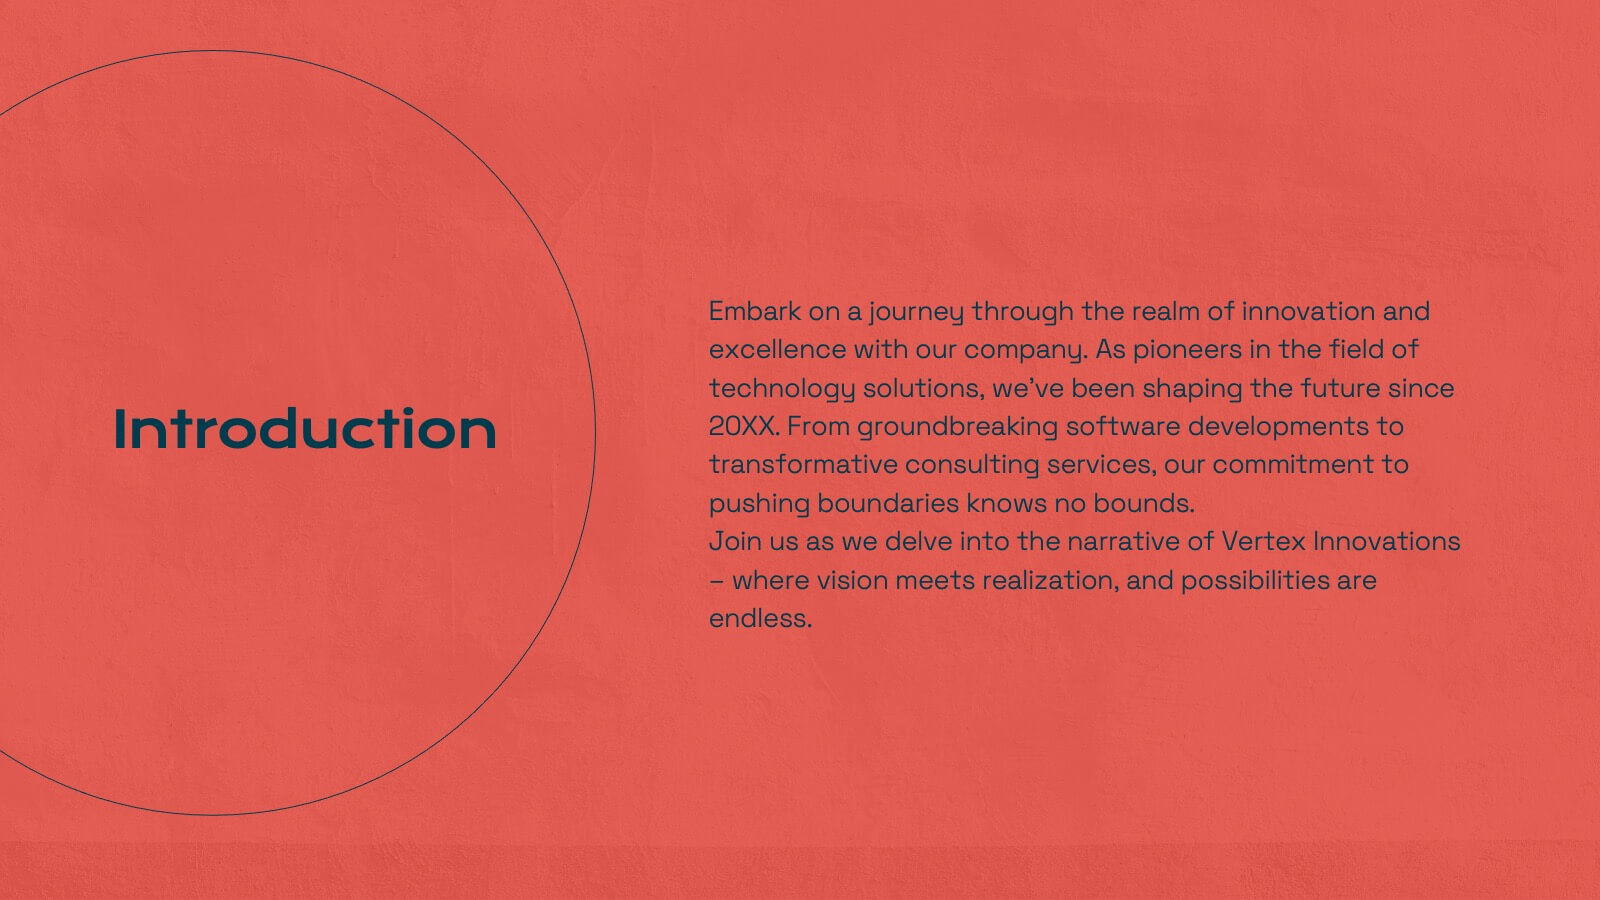
Healthcare Strategy Plan Presentation
Bring your strategy to life with a clean, modern slide that turns complex healthcare planning into a clear, visual roadmap. This presentation outlines key initiatives, supports data-driven decision-making, and keeps stakeholders aligned with an easy-to-follow layout. Fully compatible with PowerPoint, Keynote, and Google Slides for seamless professional use across any workflow.


20 diapositivas
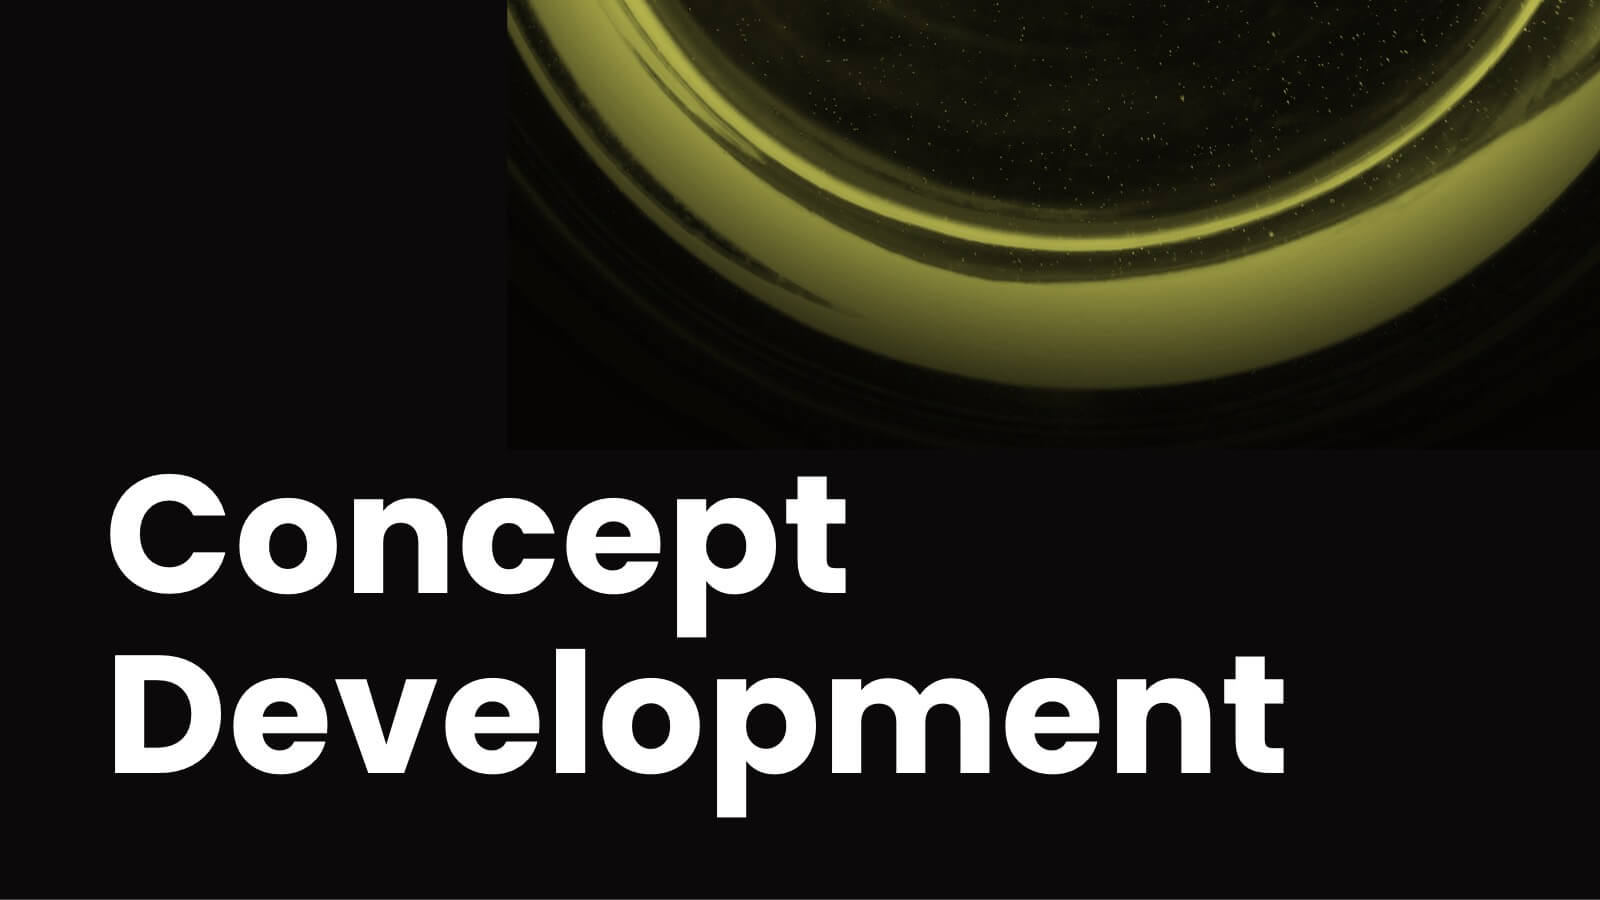
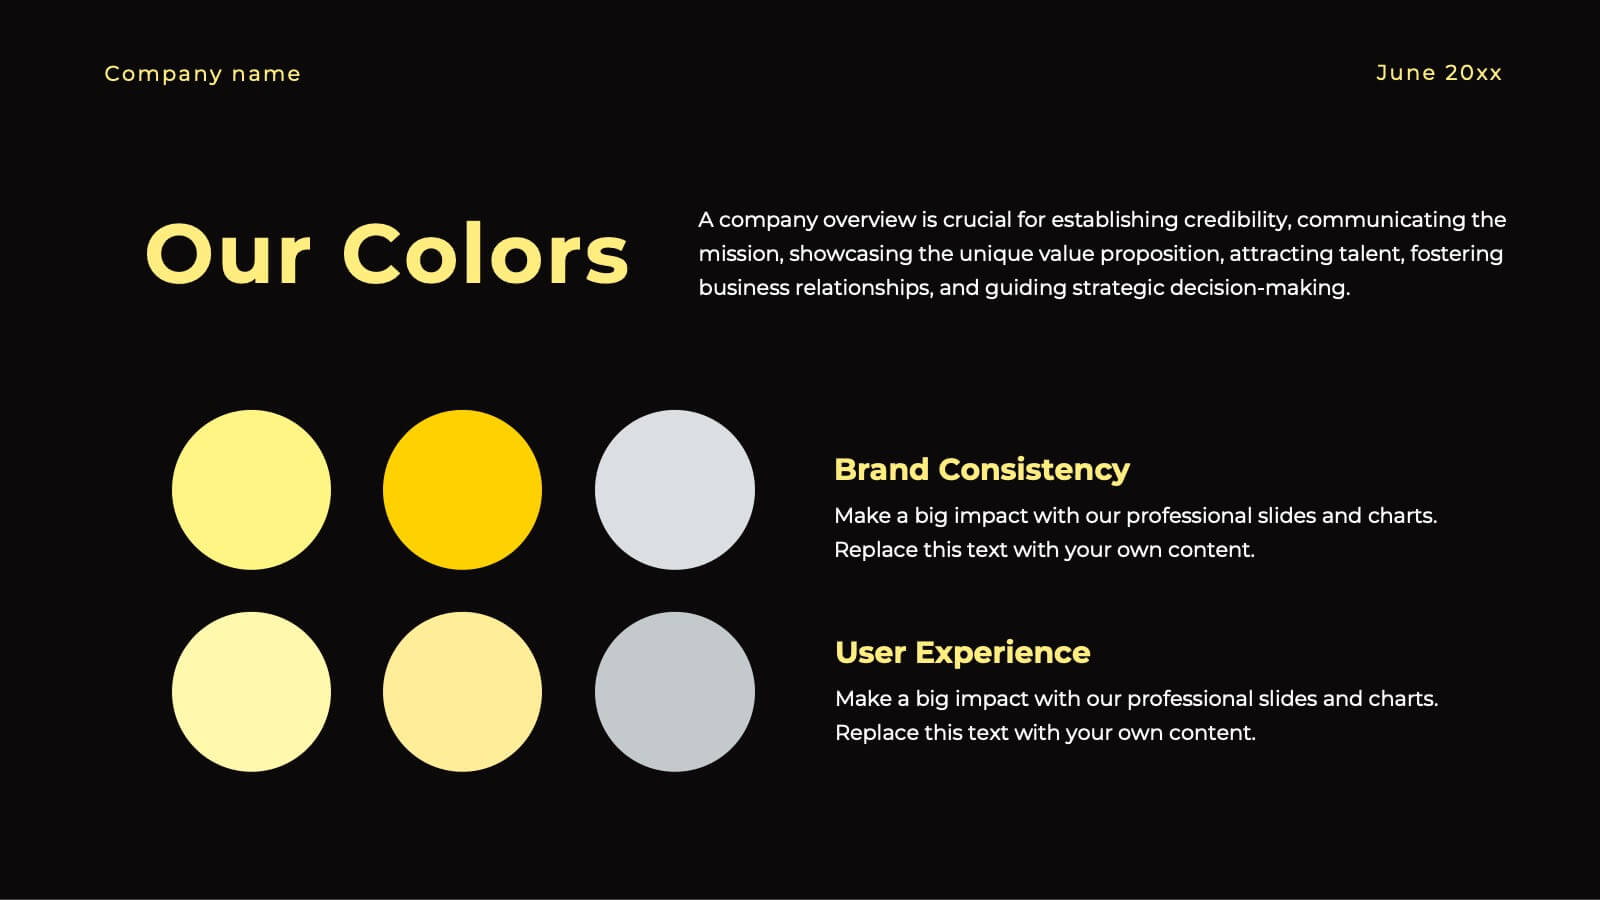
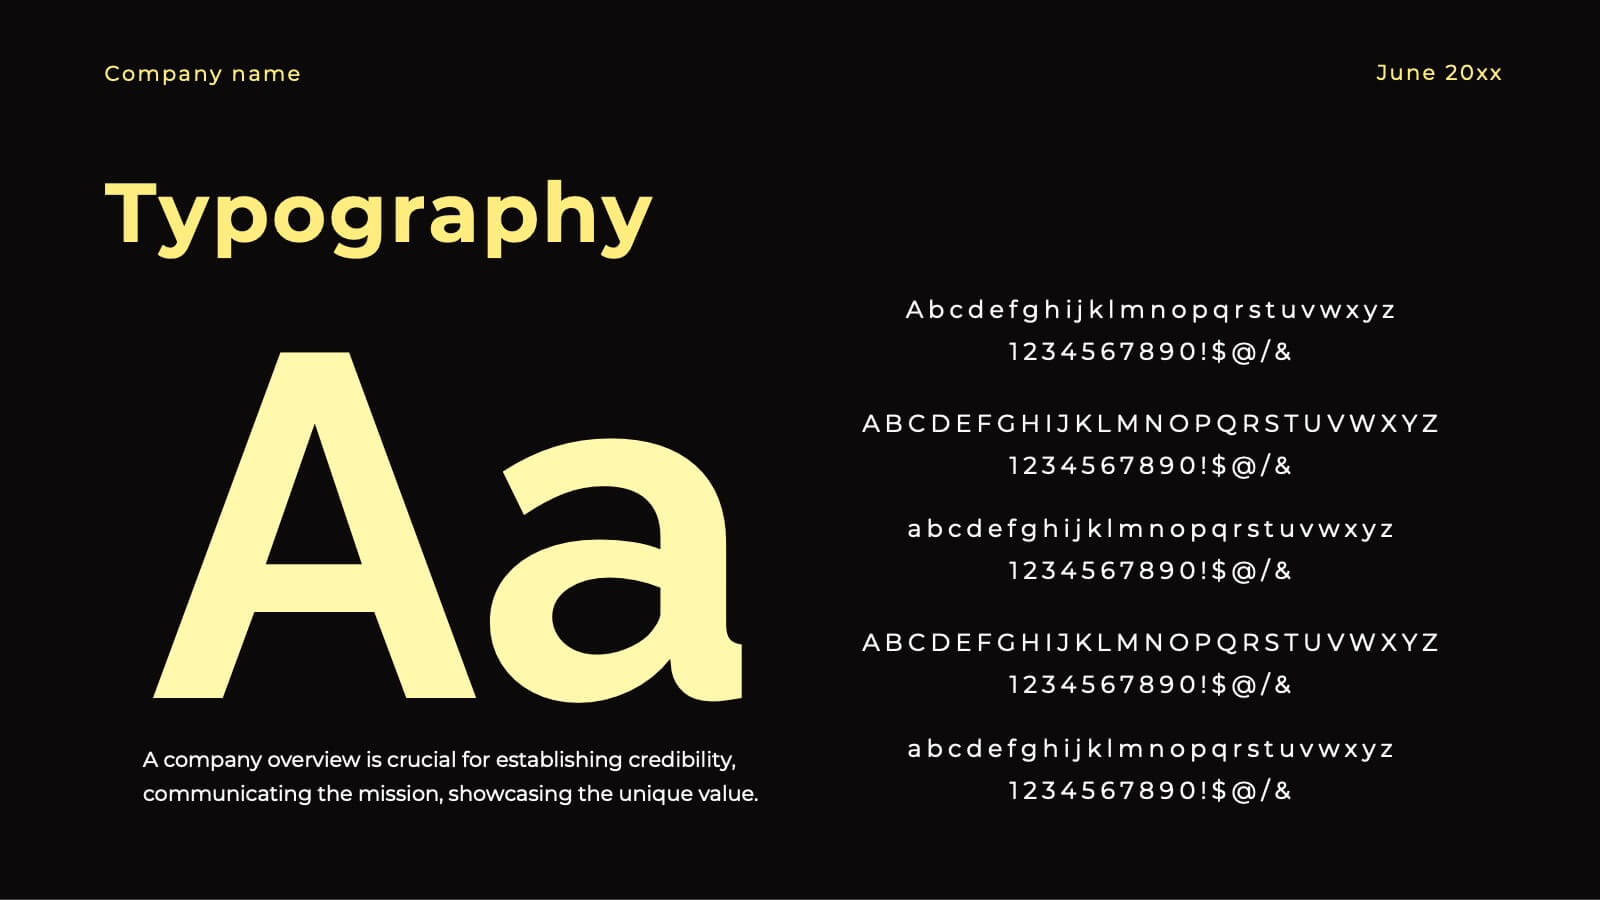
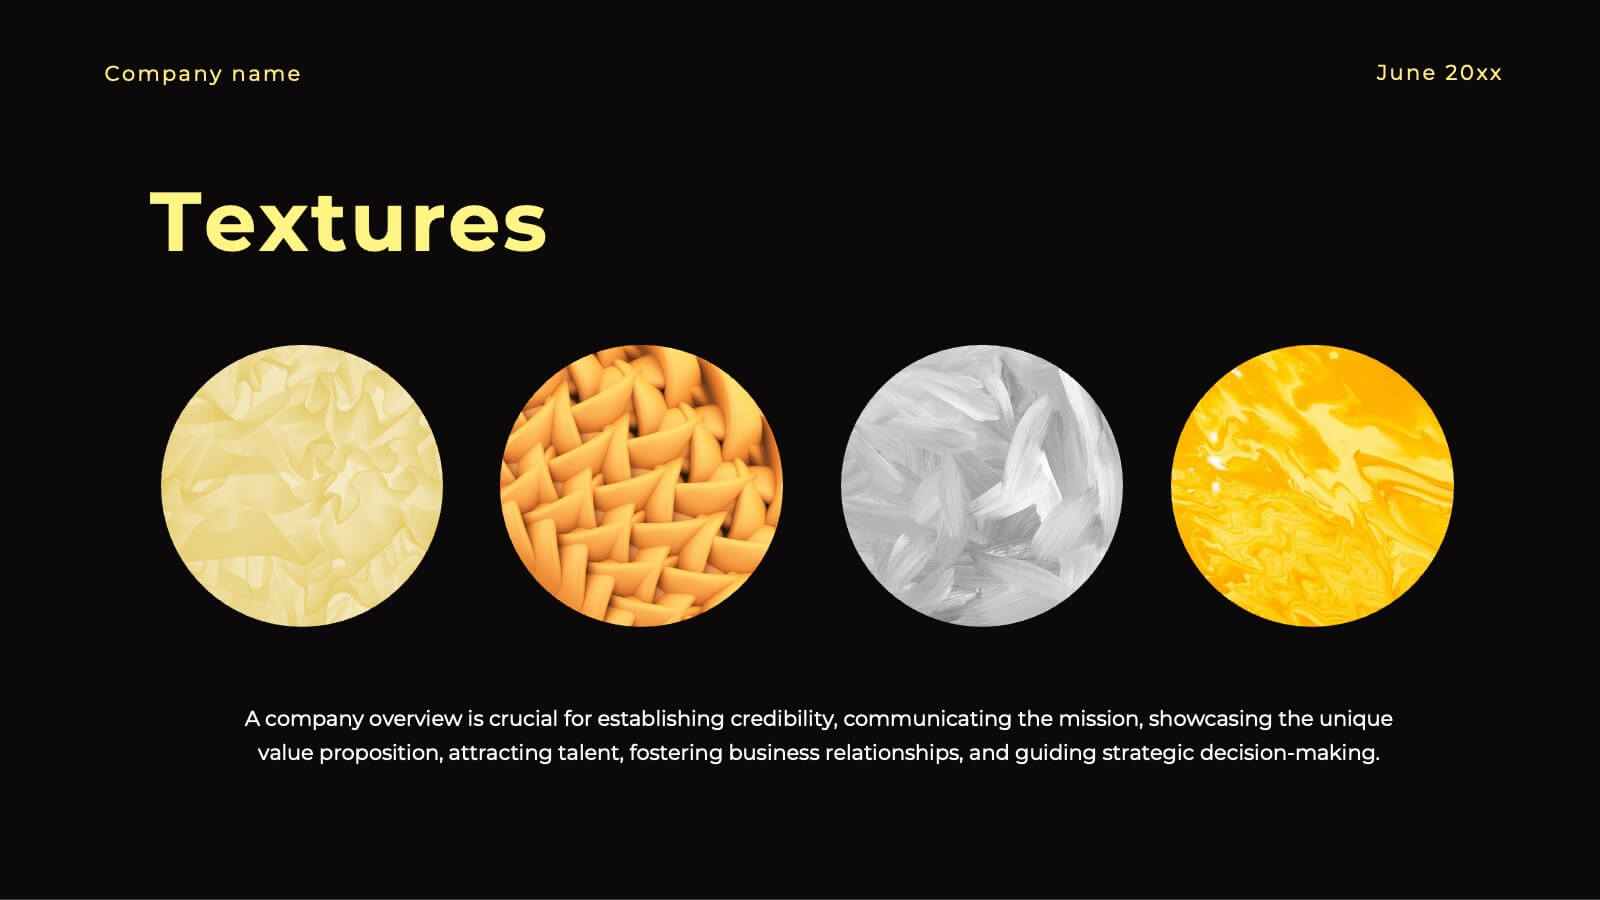
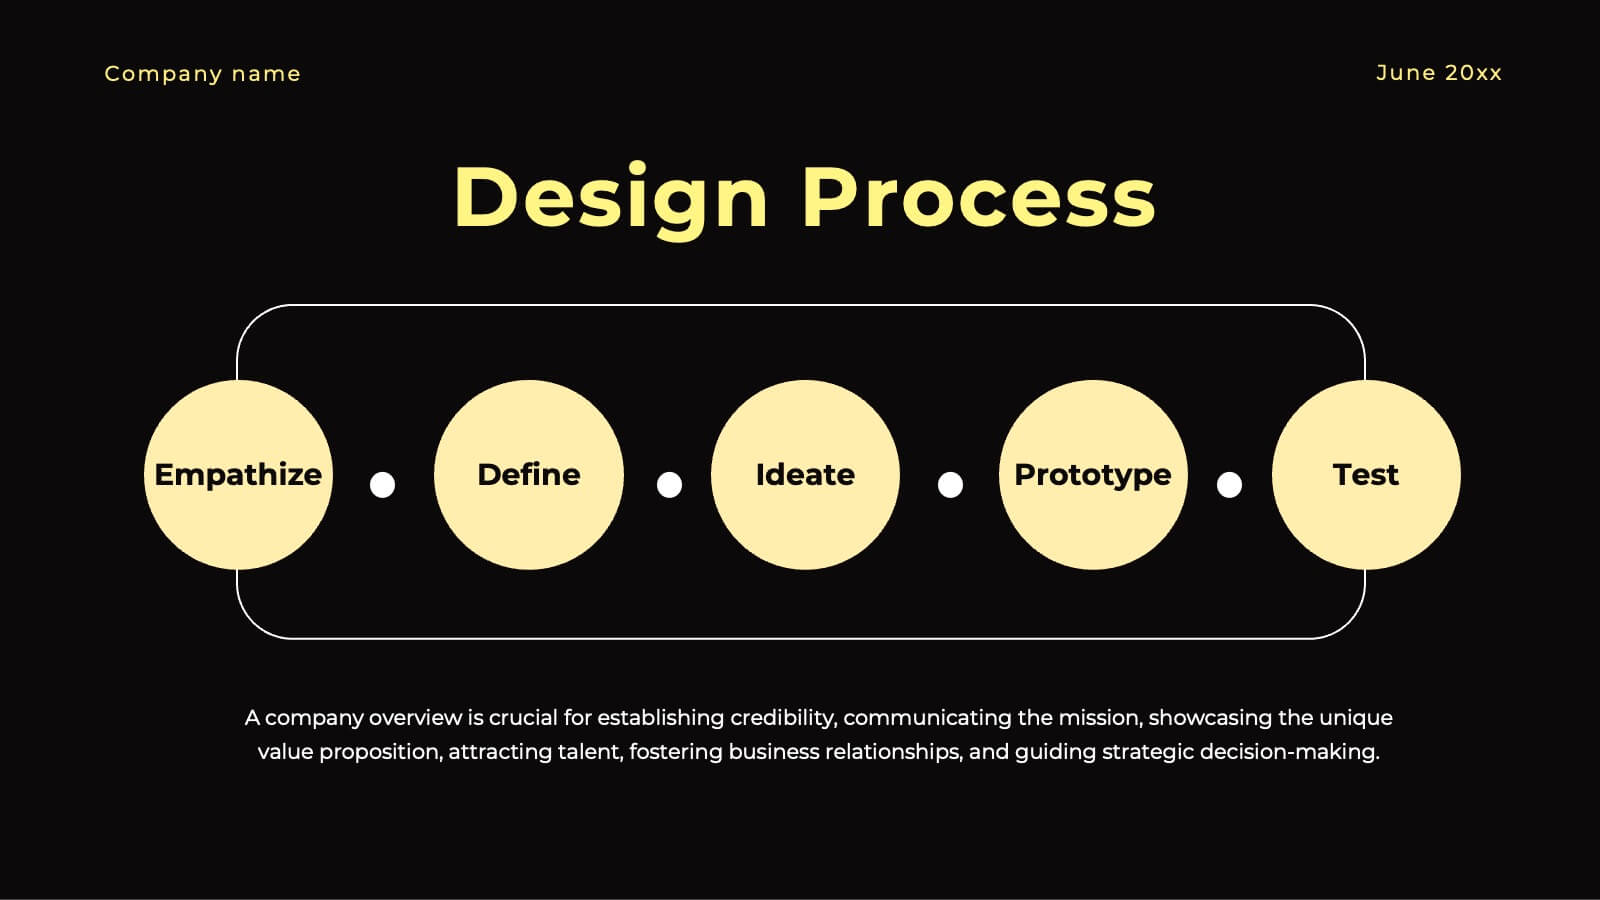
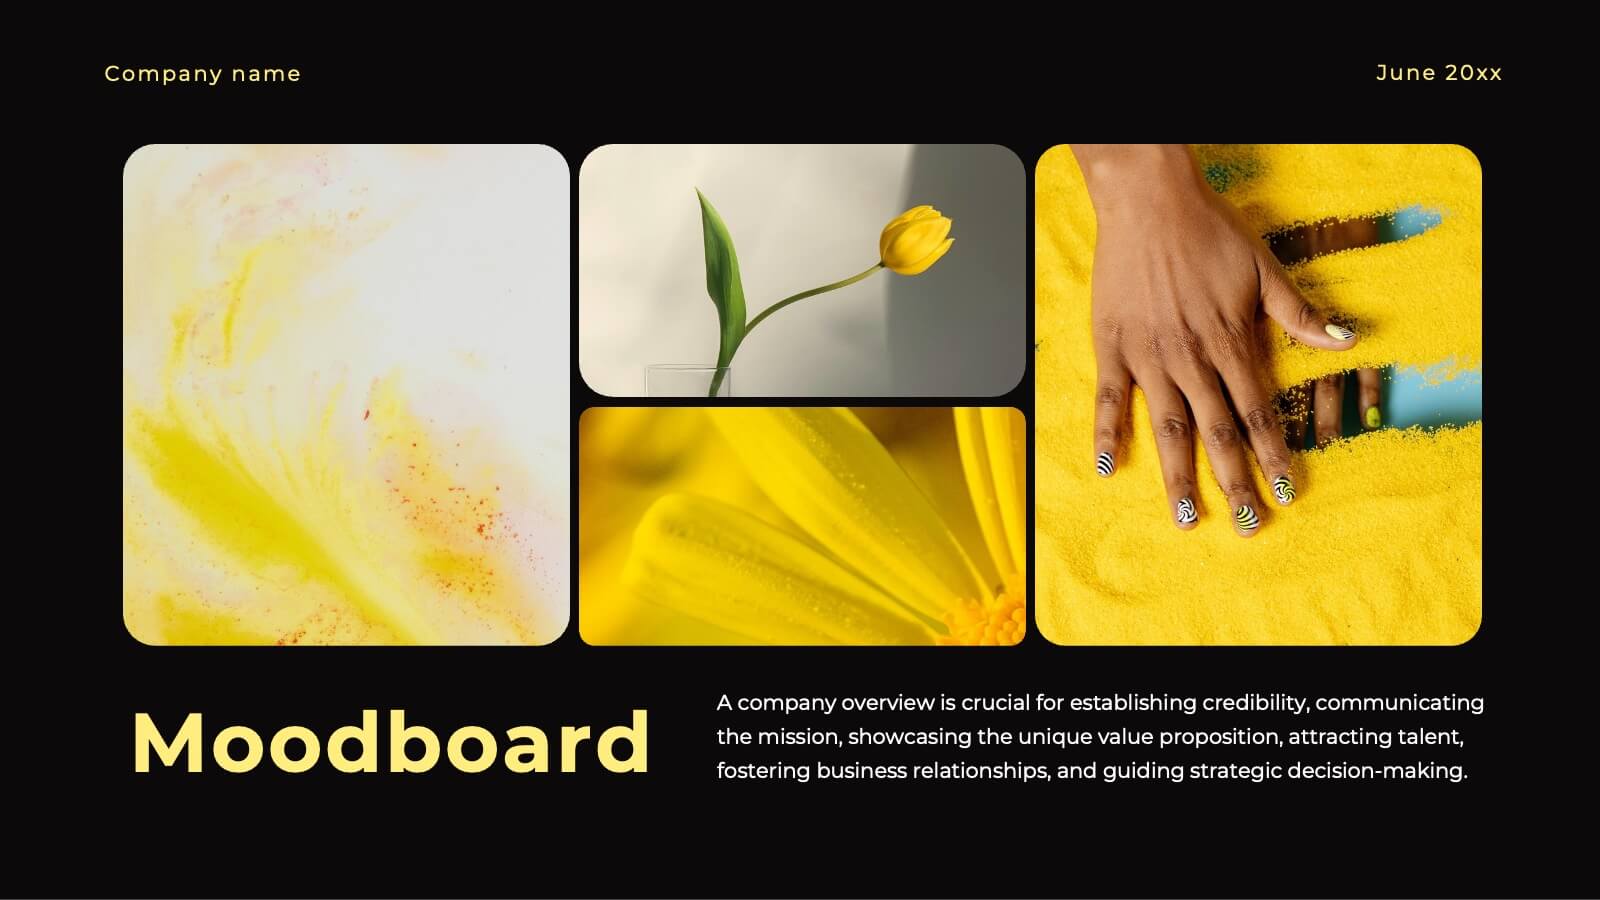
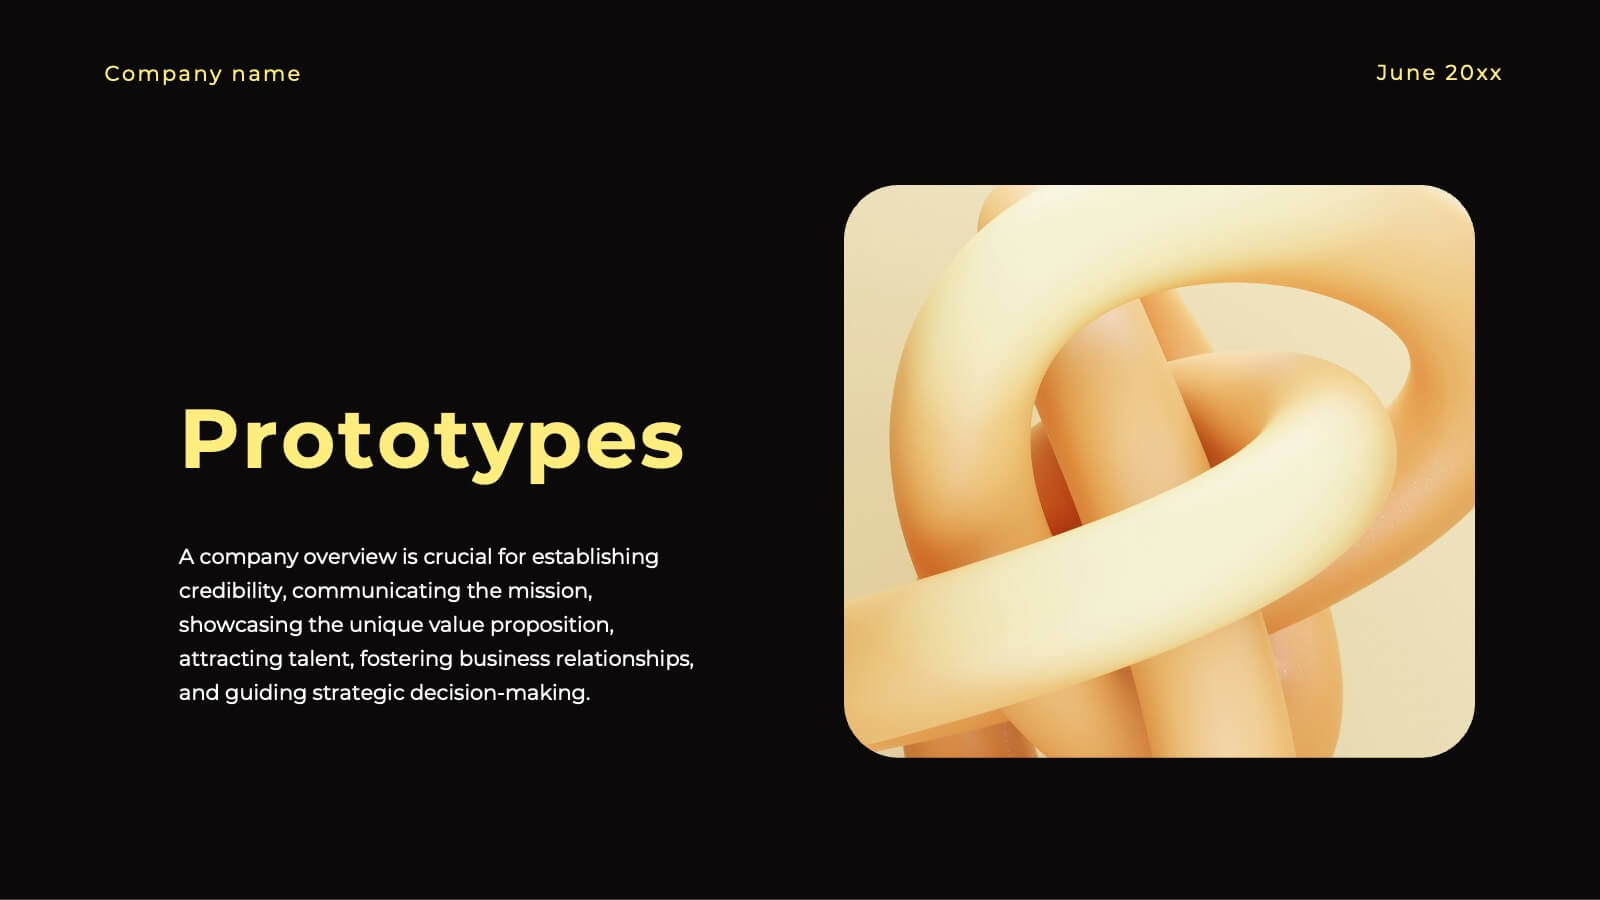
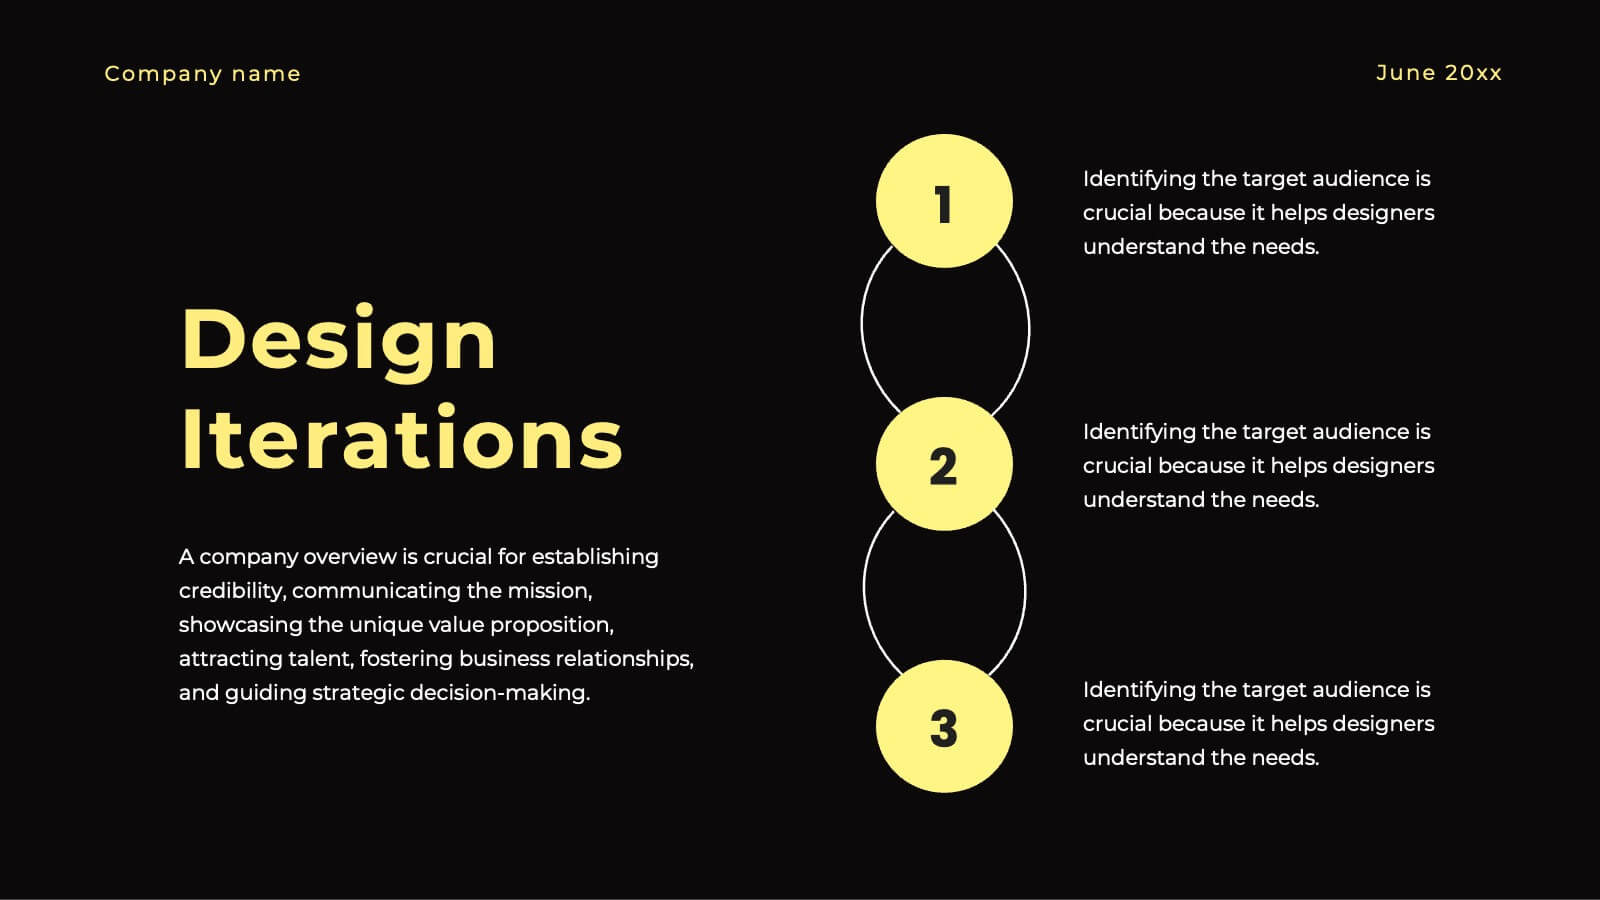
Ignite Creative Design Report Presentation
Unleash your creativity with this stunning design presentation template! Perfect for showcasing concept development, design processes, and final prototypes, it includes slides for typography, color palettes, and project timelines. Captivate your audience with sleek visuals and detailed content. Compatible with PowerPoint, Keynote, and Google Slides for seamless presentations on any platform.


4 diapositivas
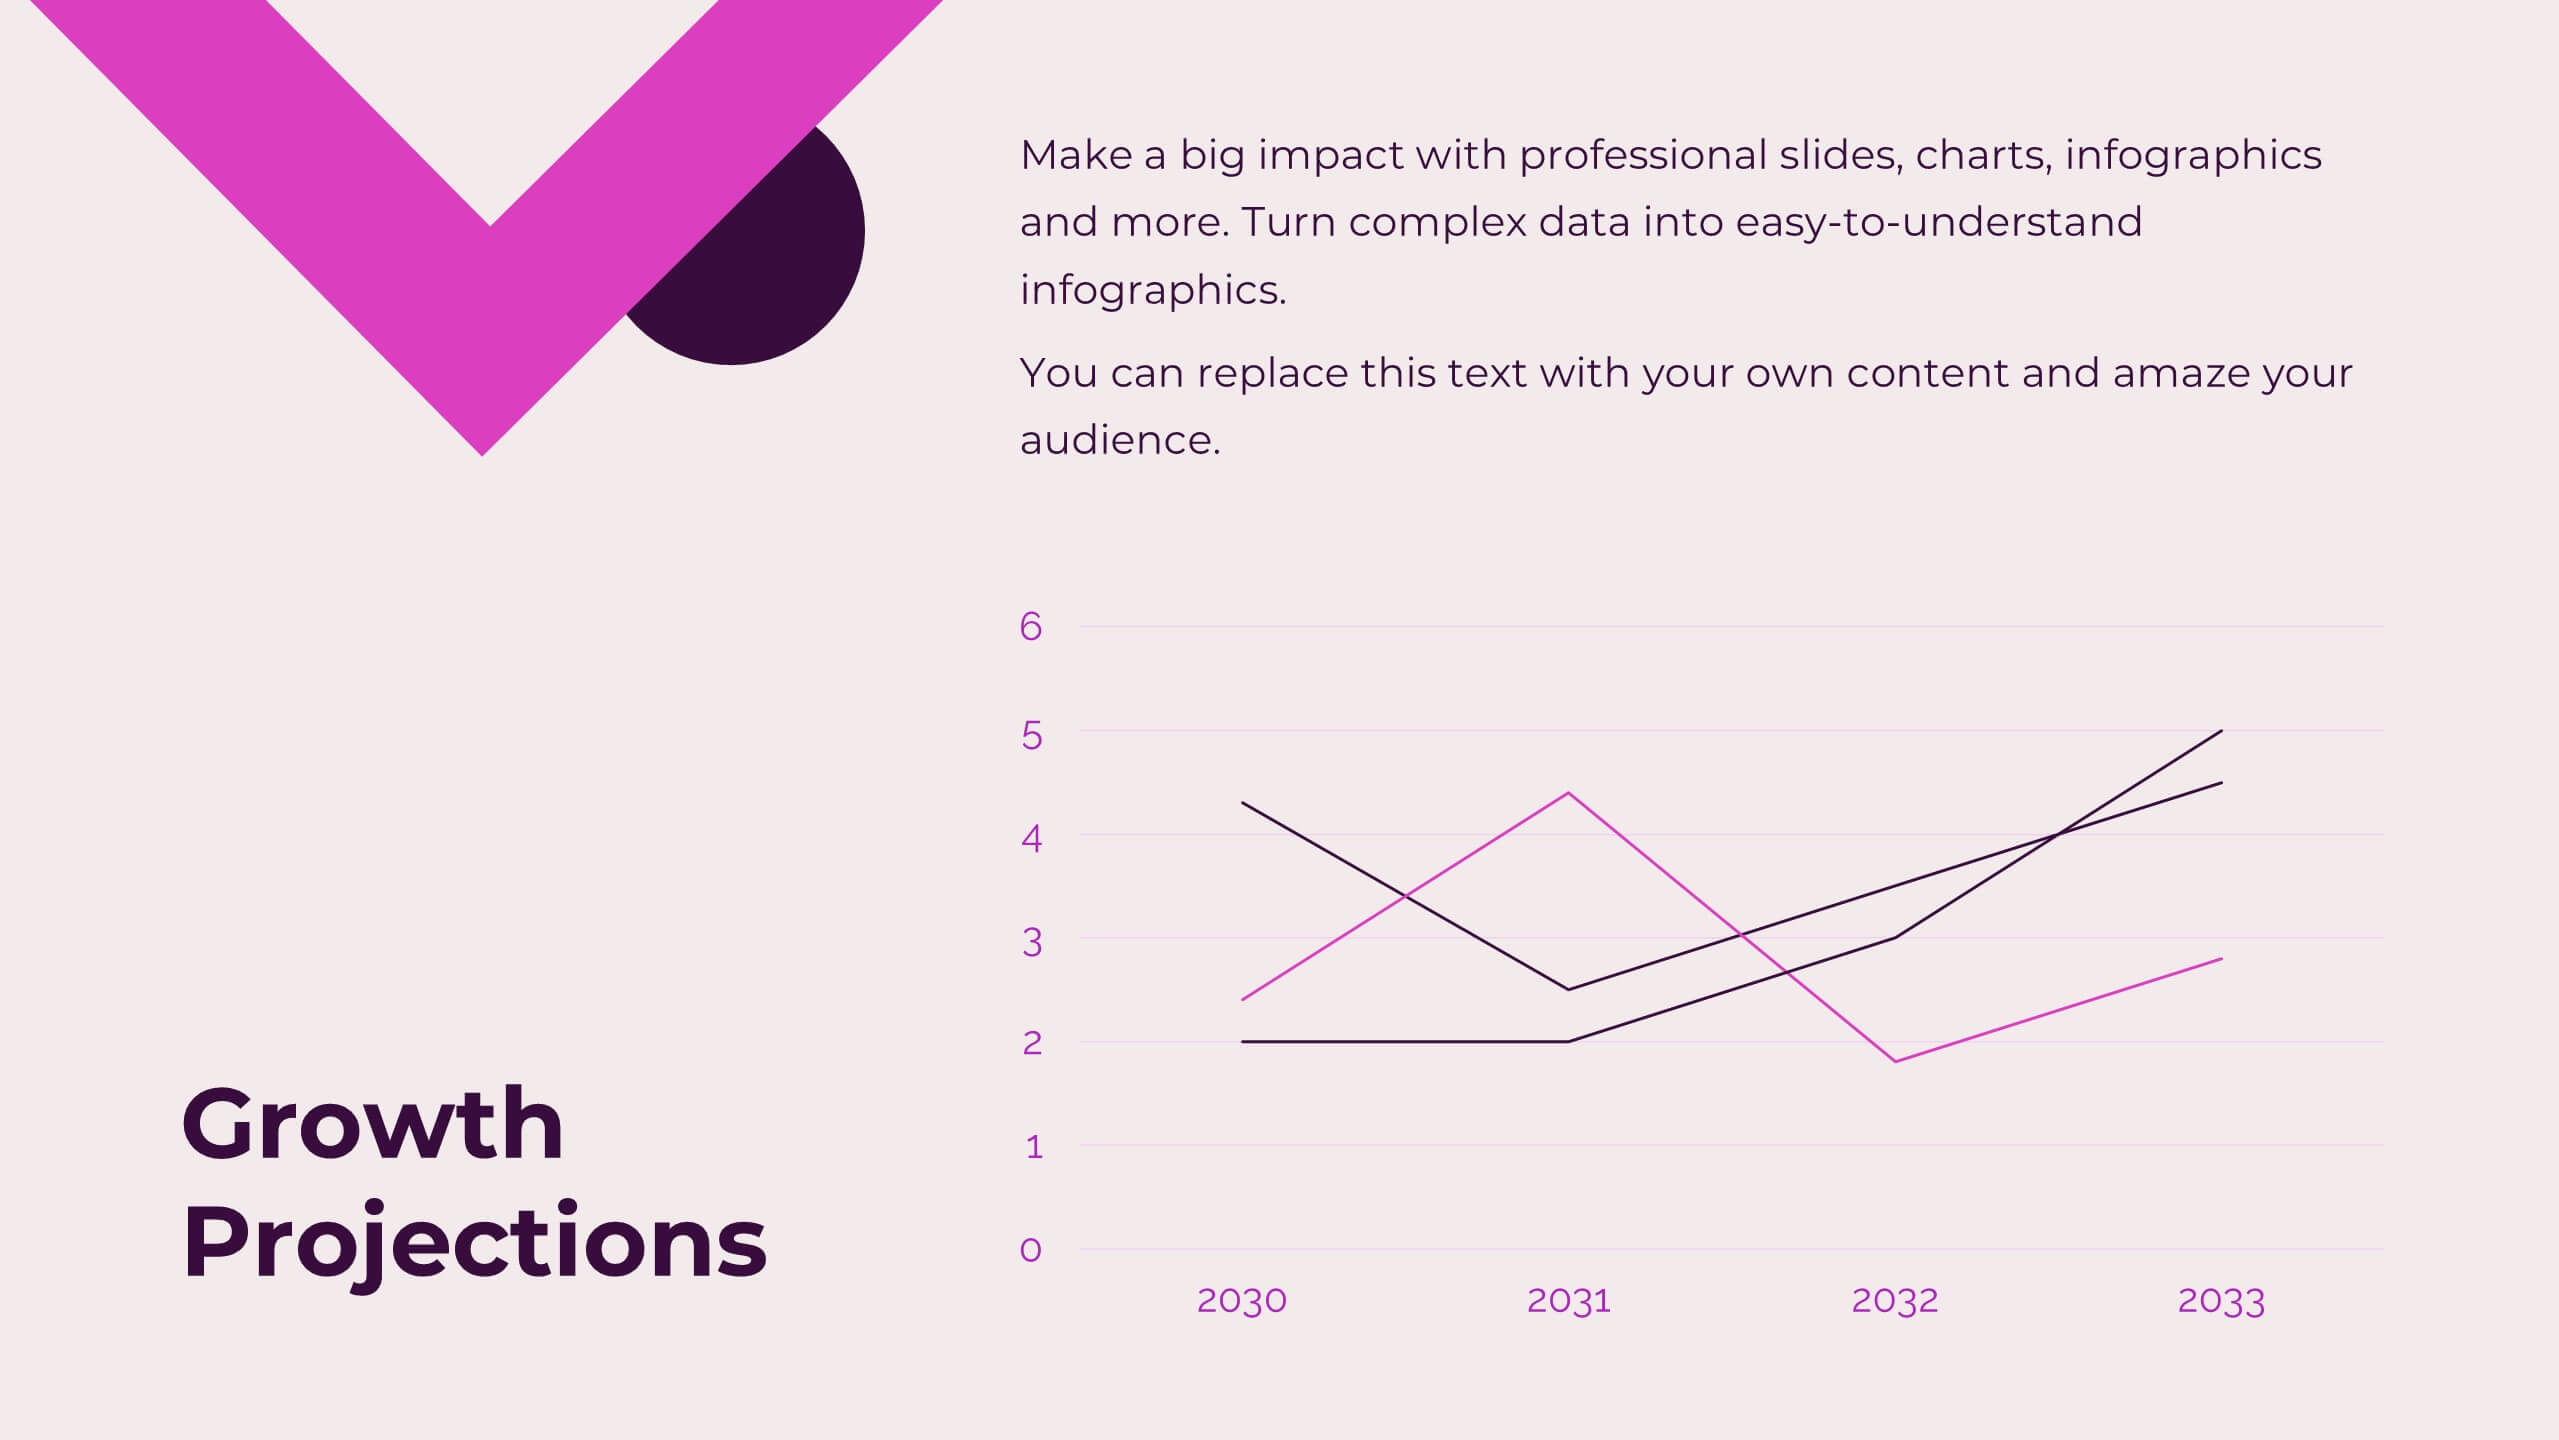
Side-by-Side Comparison Butterfly Chart Presentation
Compare data clearly and effectively with the Side-by-Side Comparison Butterfly Chart Presentation. This layout is perfect for showcasing performance metrics, survey results, or A/B comparisons in a symmetrical, easy-to-read format. Editable in Canva, PowerPoint, Google Slides, and Keynote to match your brand and presentation style effortlessly.


23 diapositivas
Orbit Marketing Strategy Plan Presentation
Elevate your marketing strategy presentations with this vibrant and dynamic template! Perfect for analyzing market trends, identifying target audiences, and outlining strategic objectives. Ideal for marketing professionals aiming to captivate their audience and drive results. Compatible with PowerPoint, Keynote, and Google Slides, this template ensures your strategy is clear, compelling, and effective.


7 diapositivas
Law Infographics Presentation Template
Featuring our Law Infographic template it is a modern and stylish template for making a presentation about law. It comes with a clean design, typography and plenty of space for annotations and is compatible with powerpoint. This template is suitable for a presentation about business, management, finance or marketing. It contains a one page design, illustrations and many different elements to help you build a strong and compelling presentation. Essential and easy to use, this law Infographic template is a great tool for anyone who wants to make an attractive and professional presentation.


23 diapositivas
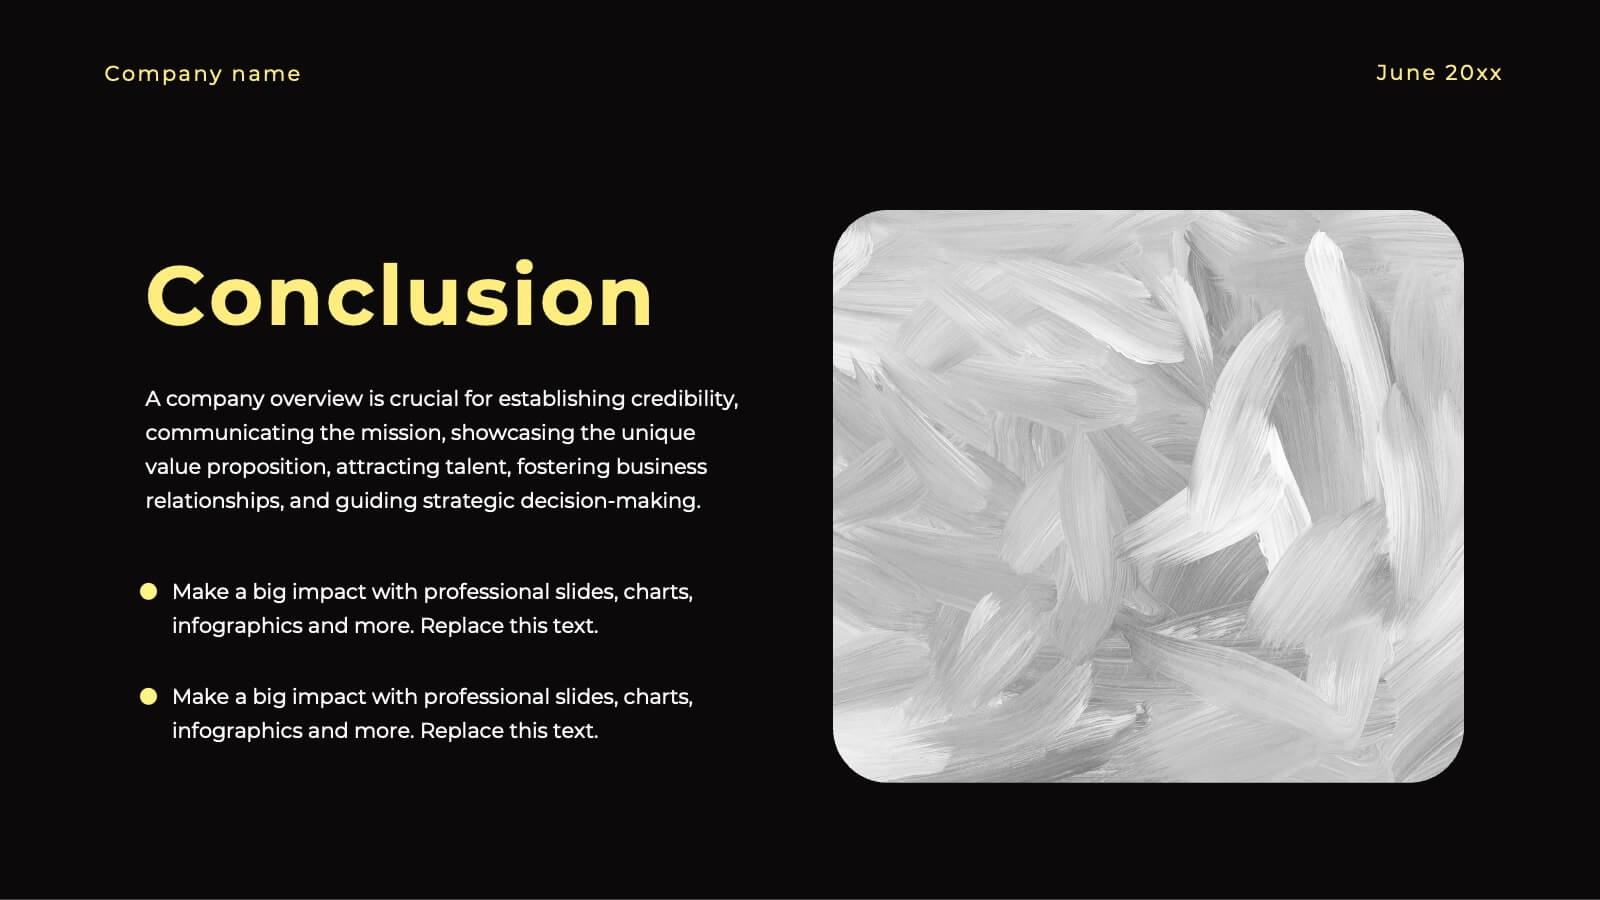
Skycrest Business Idea Pitch Deck Presentation
Present your innovative business idea with this bold pitch deck, featuring sections for problem statement, solution, business model, and financial projections. Ideal for capturing investor attention, this template supports PowerPoint, Keynote, and Google Slides, making it perfect for impactful presentations across multiple platforms.


7 diapositivas
Technology Development Infographic Presentation
Technology has become an integral part of modern society and plays a crucial role in almost every aspect of our lives. This is a high quality, easily editable and fully layered infographic template. It includes many useful elements to add your data such as icons, charts, text boxes, bullet points, and a map to grab your audience’s attention. Showcase how technology has been developed over the years and how it is developing today. You can use this template for your class or for professional presentations. This is a multipurpose template, compatible with PowerPoint, Keynote and Google Slides.
6 diapositivas
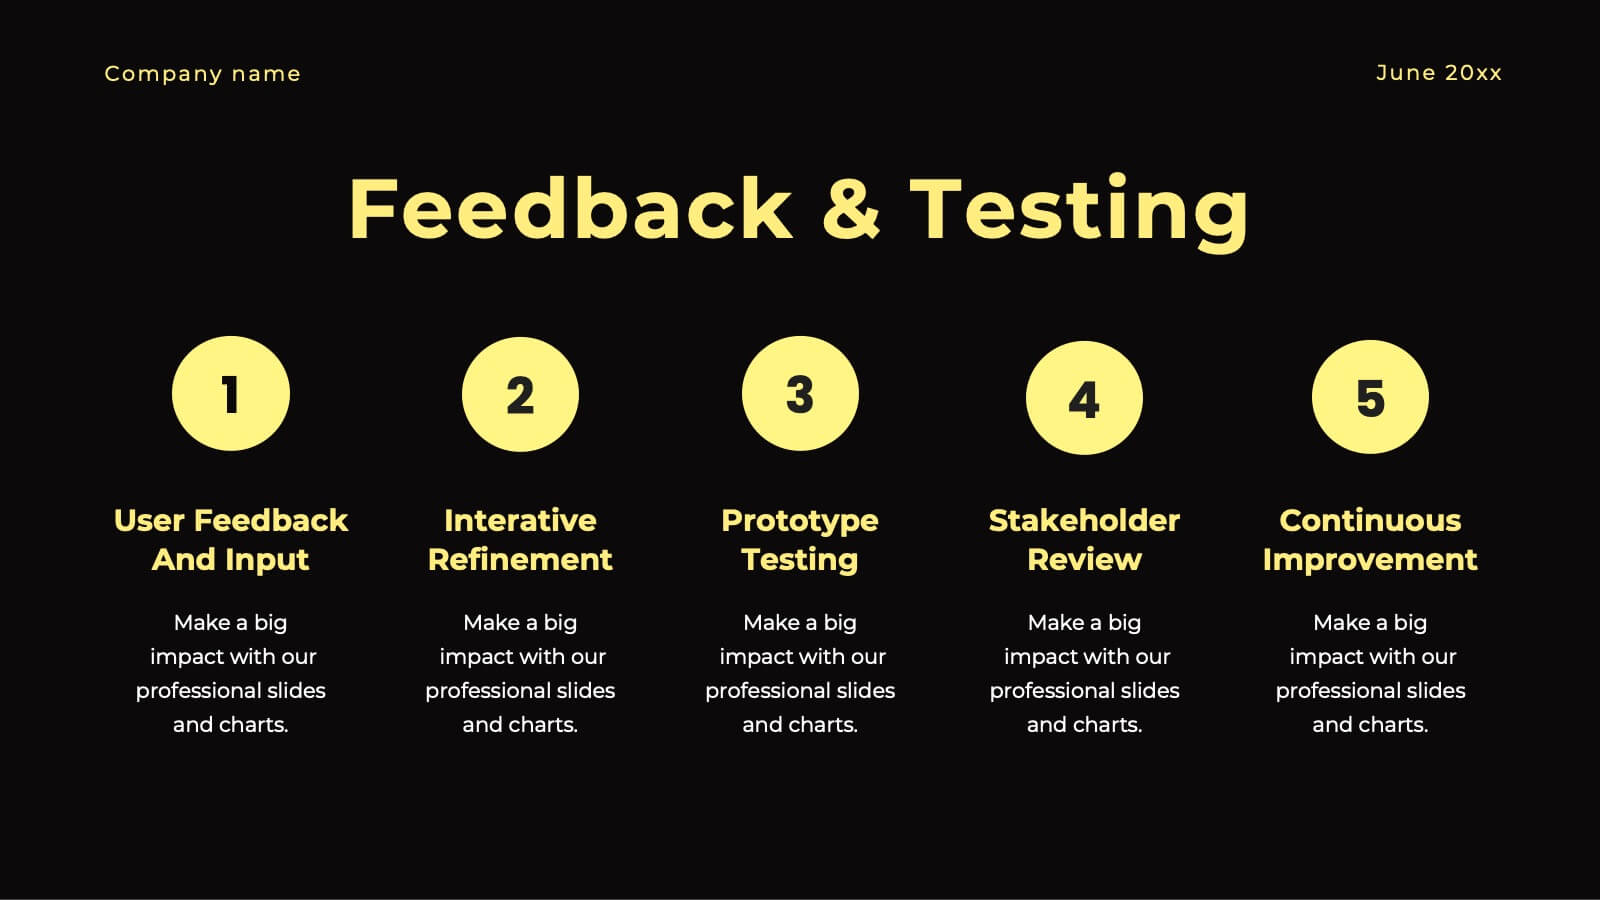
Arrow Mapping for Growth Journey
Showcase progress and strategic development using the Arrow Mapping for Growth Journey Presentation. This vibrant arrow-style roadmap is designed to highlight five key stages—perfect for illustrating phases of growth, milestones, or business transformations. Use it to map out project timelines, organizational development, or customer onboarding flows. Fully editable in PowerPoint, Keynote, and Google Slides, it’s ideal for business strategists, consultants, and marketing teams.


6 diapositivas
Leadership Program Infographic
A leadership program is a structured and intentional learning experience designed to develop and enhance leadership skills and qualities in individuals. This infographic template aims to provide a concise overview of the program's objectives, target audience, curriculum, and expected outcomes. This template includes icons, graphics, and color schemes that align with the organization's branding and make the infographic visually appealing. This infographic serves as an effective marketing tool to attract potential participants, showcase the value of the program, and communicate the positive outcomes of joining the leadership development journey.


6 diapositivas
Strategic Task and To-Do List Slide Presentation
Keep your team aligned and on track with the Strategic Task and To-Do List Slide Presentation. This layout is ideal for showcasing action items, project priorities, and status updates using a visual notepad style. Color-coded sections and checkmark indicators make it easy to communicate task progress. Fully customizable in PowerPoint, Keynote, and Google Slides.


7 diapositivas
Artificial Intelligence Education Infographic Presentation
Artificial Intelligence is an important field of study and development that has the potential to revolutionize many aspects of modern life. A great way to display your ideas in a visual manner, this AI Infographic Template can be used by businesses and corporations who want to communicate their team vision in a clear and dynamic way. This template is completely editable, allowing you to customize it with your own information and photos. It includes icons and graphs to illustrate your points, as well as text boxes and slide titles. It is compatible with Powerpoint, Keynote and Google Slides.


21 diapositivas
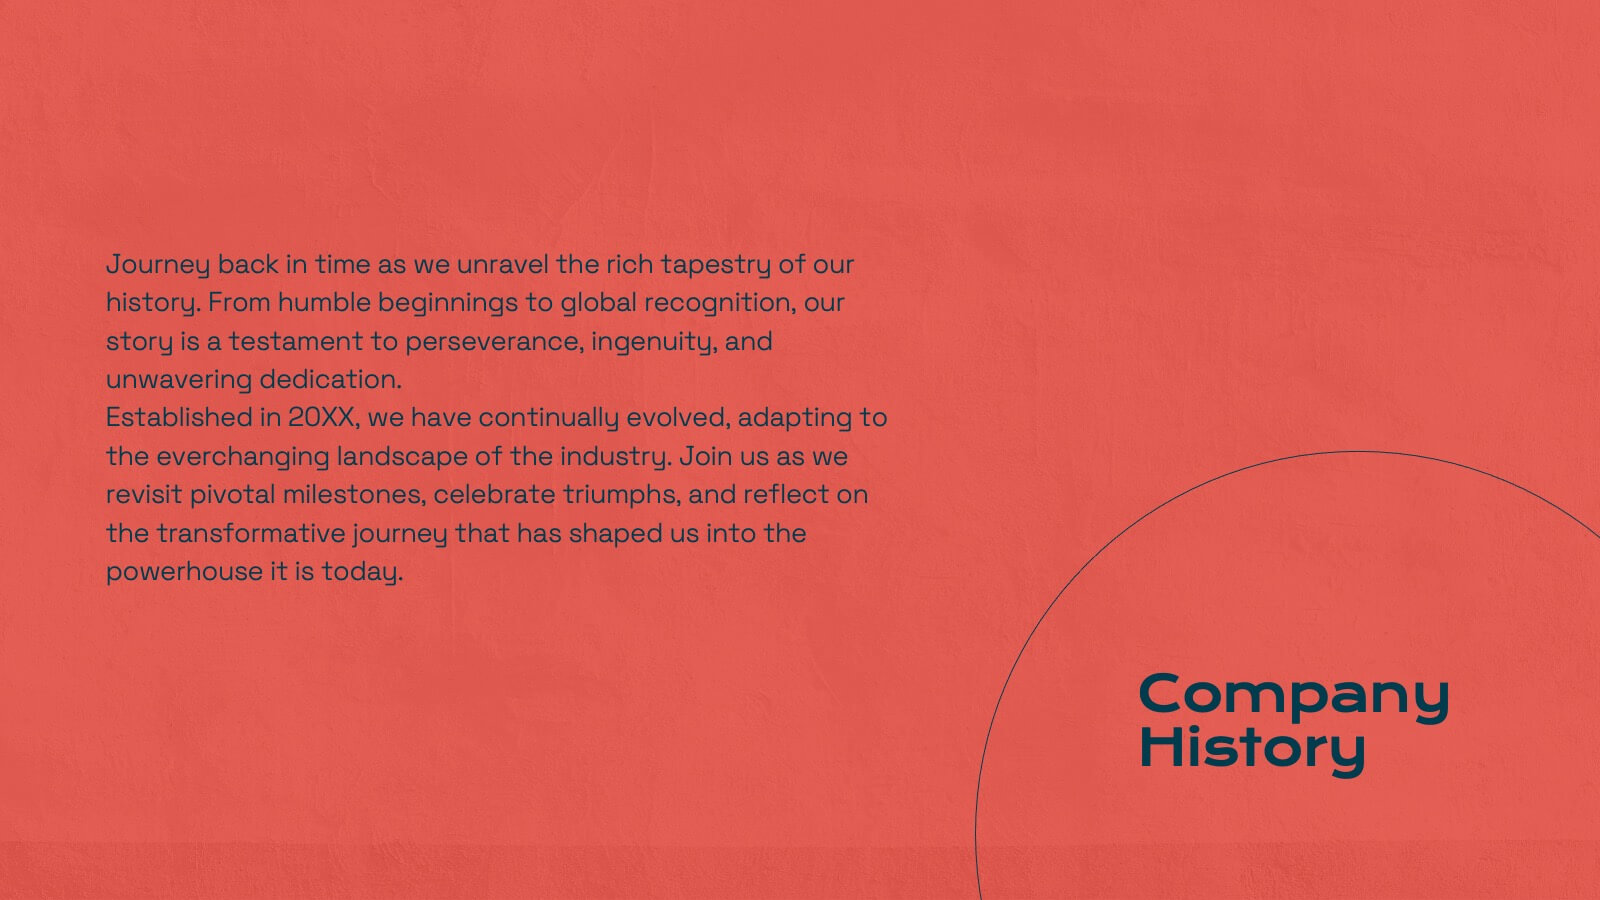
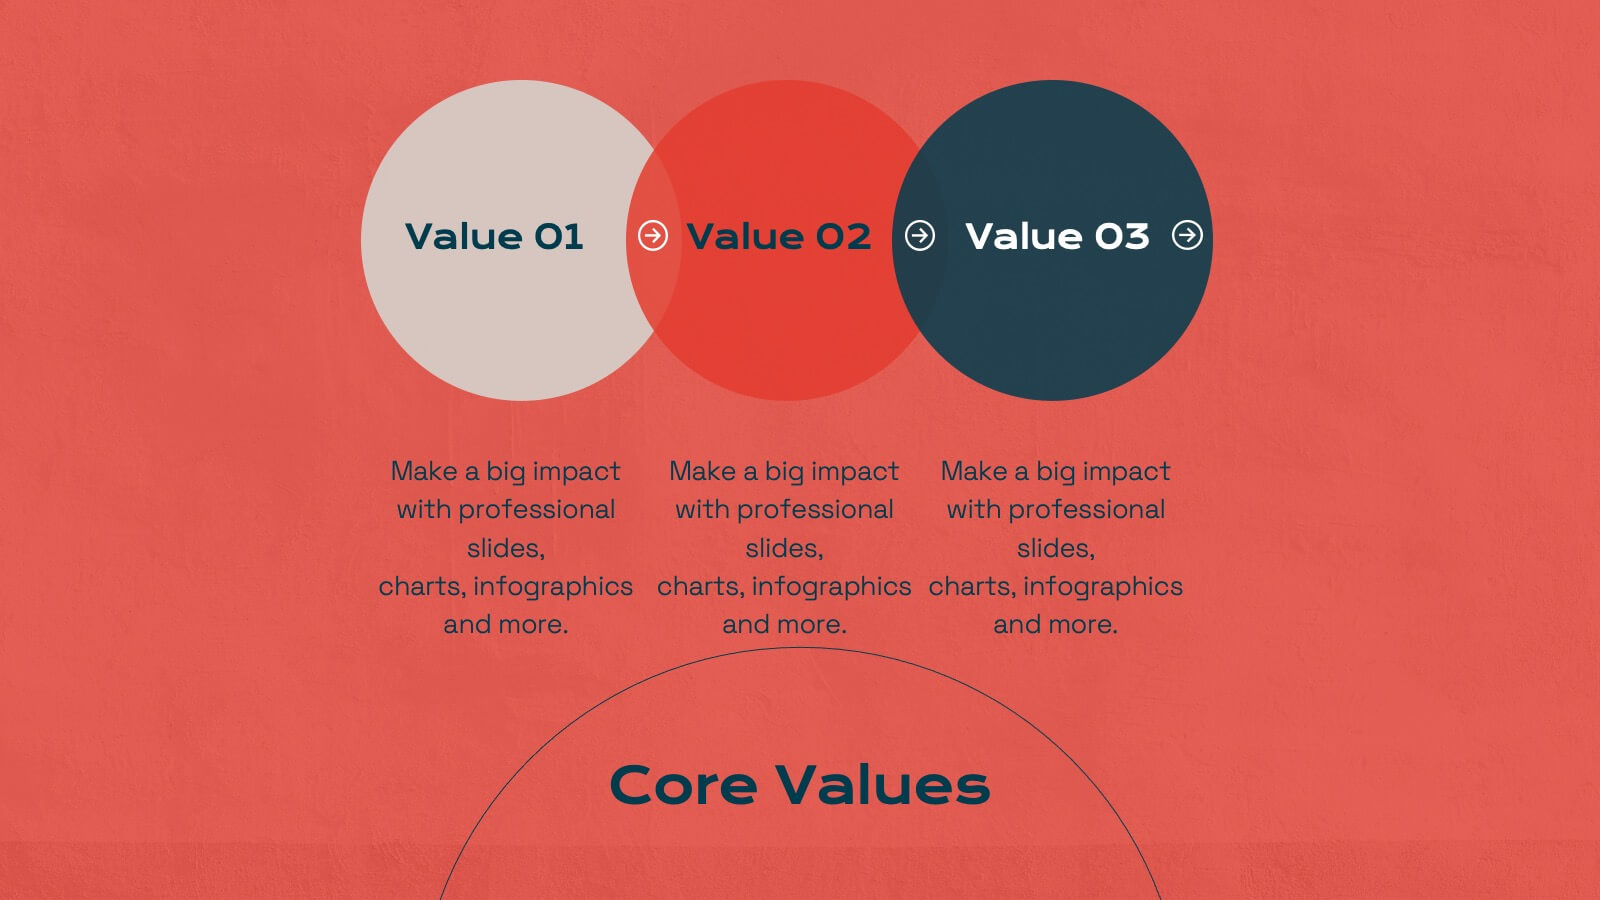
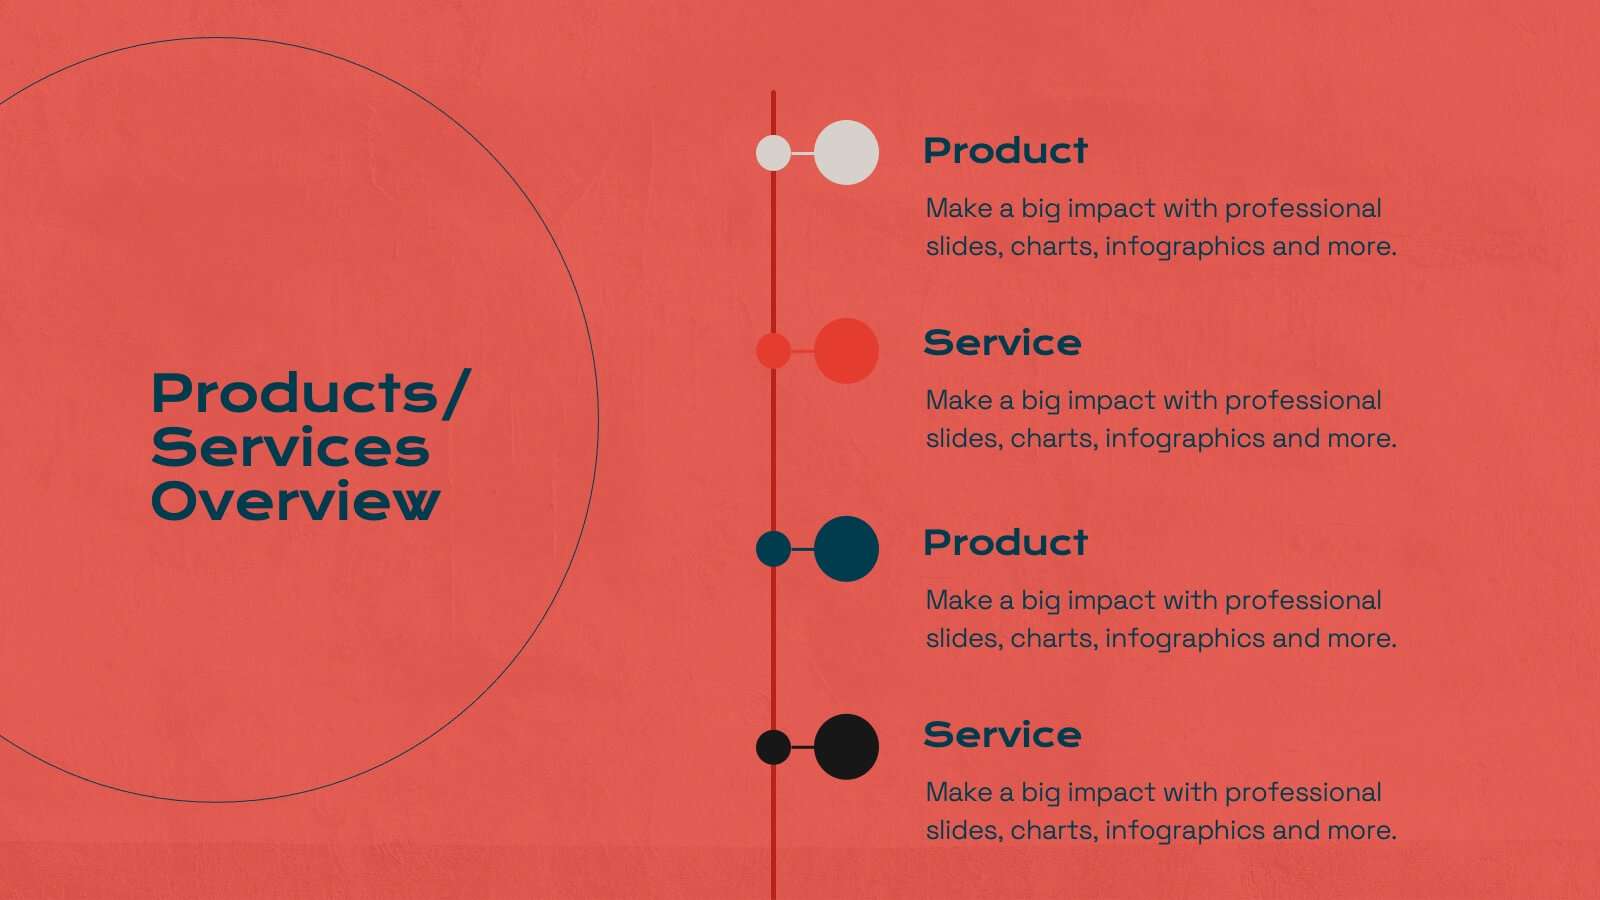
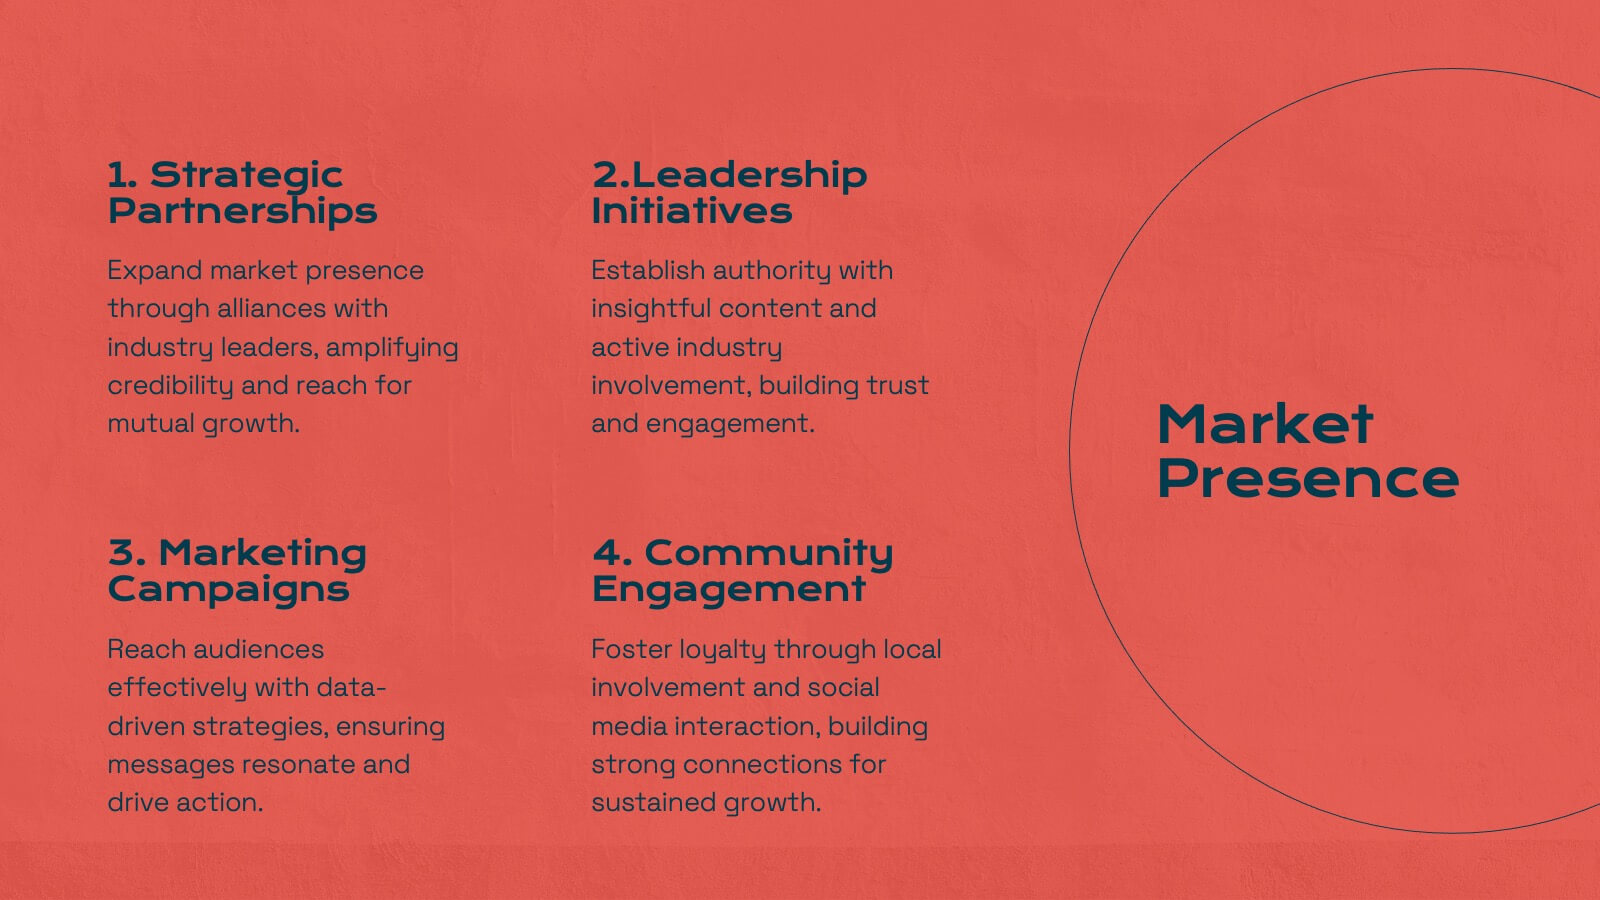
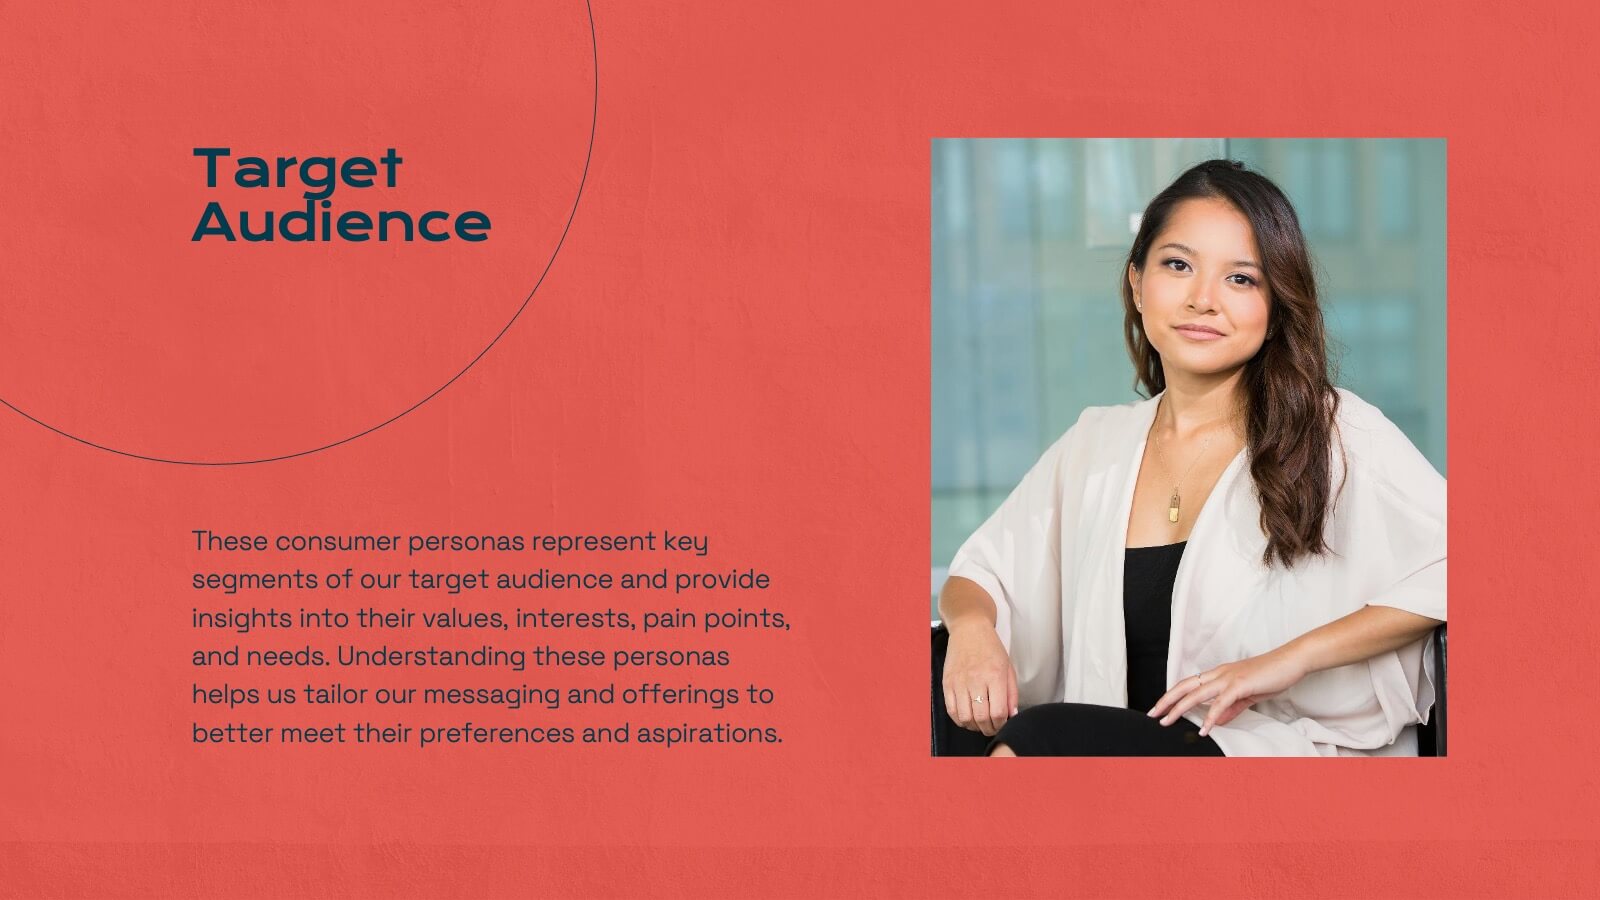
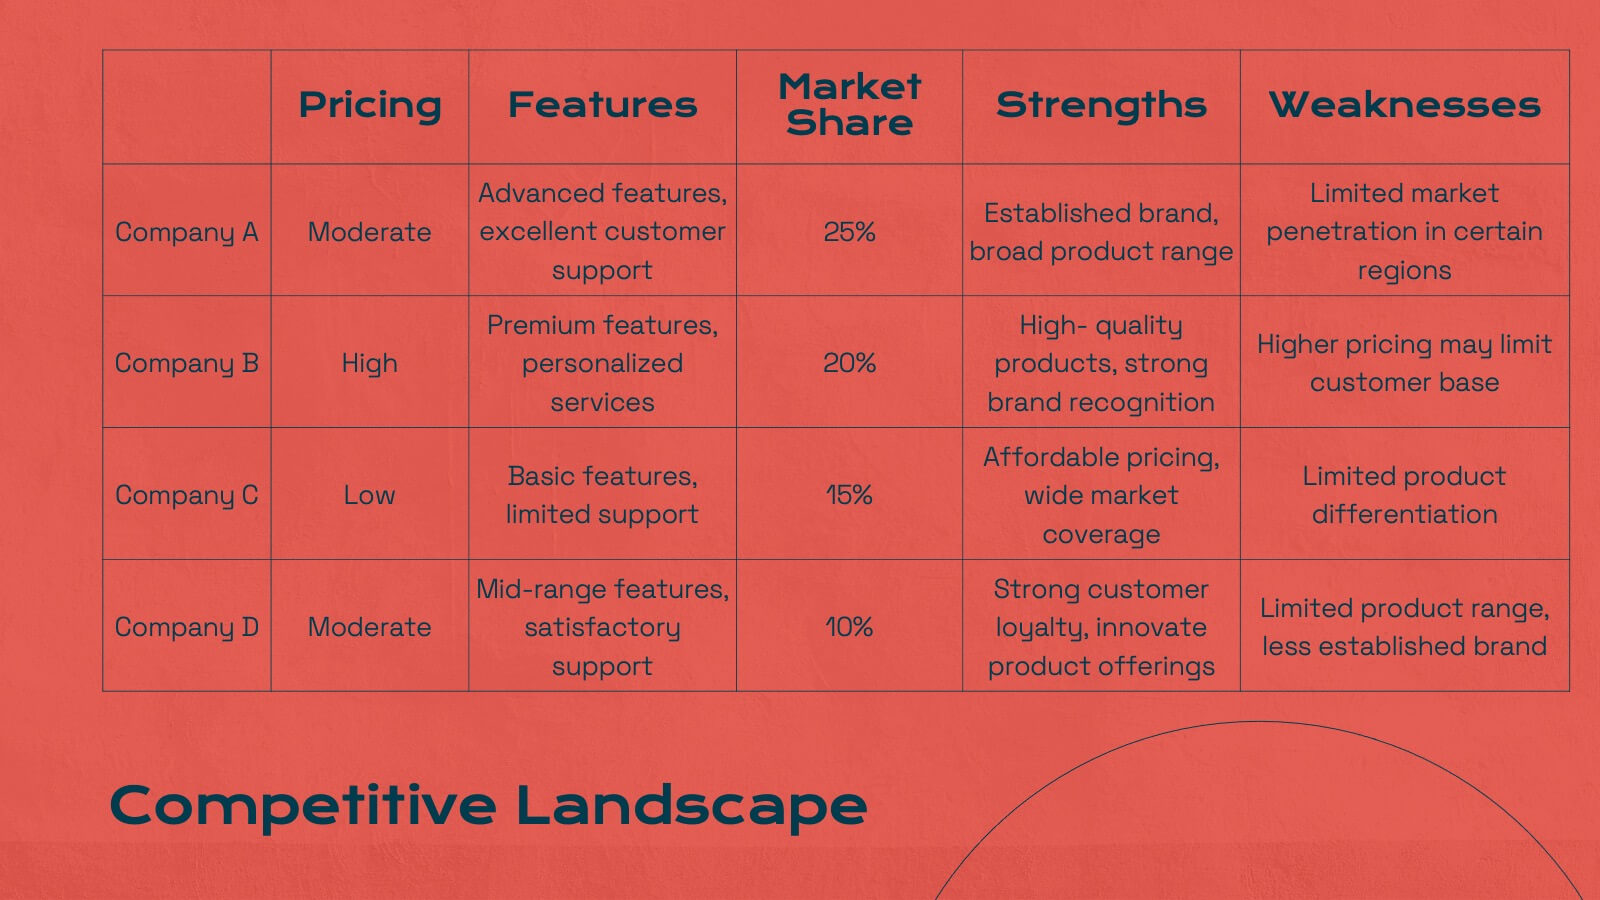
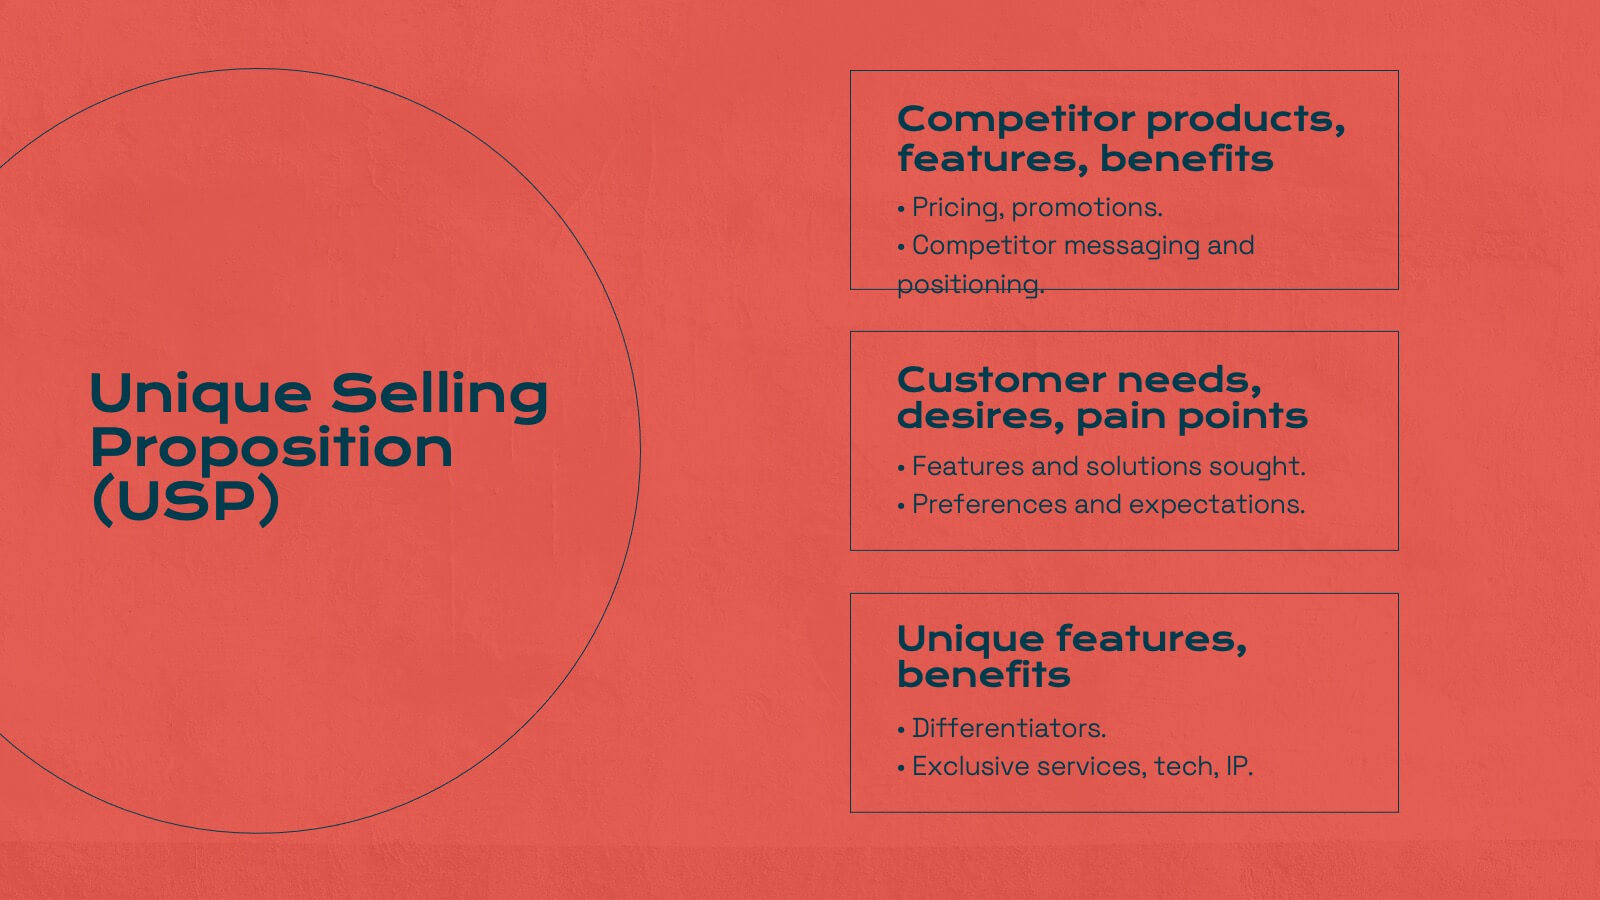
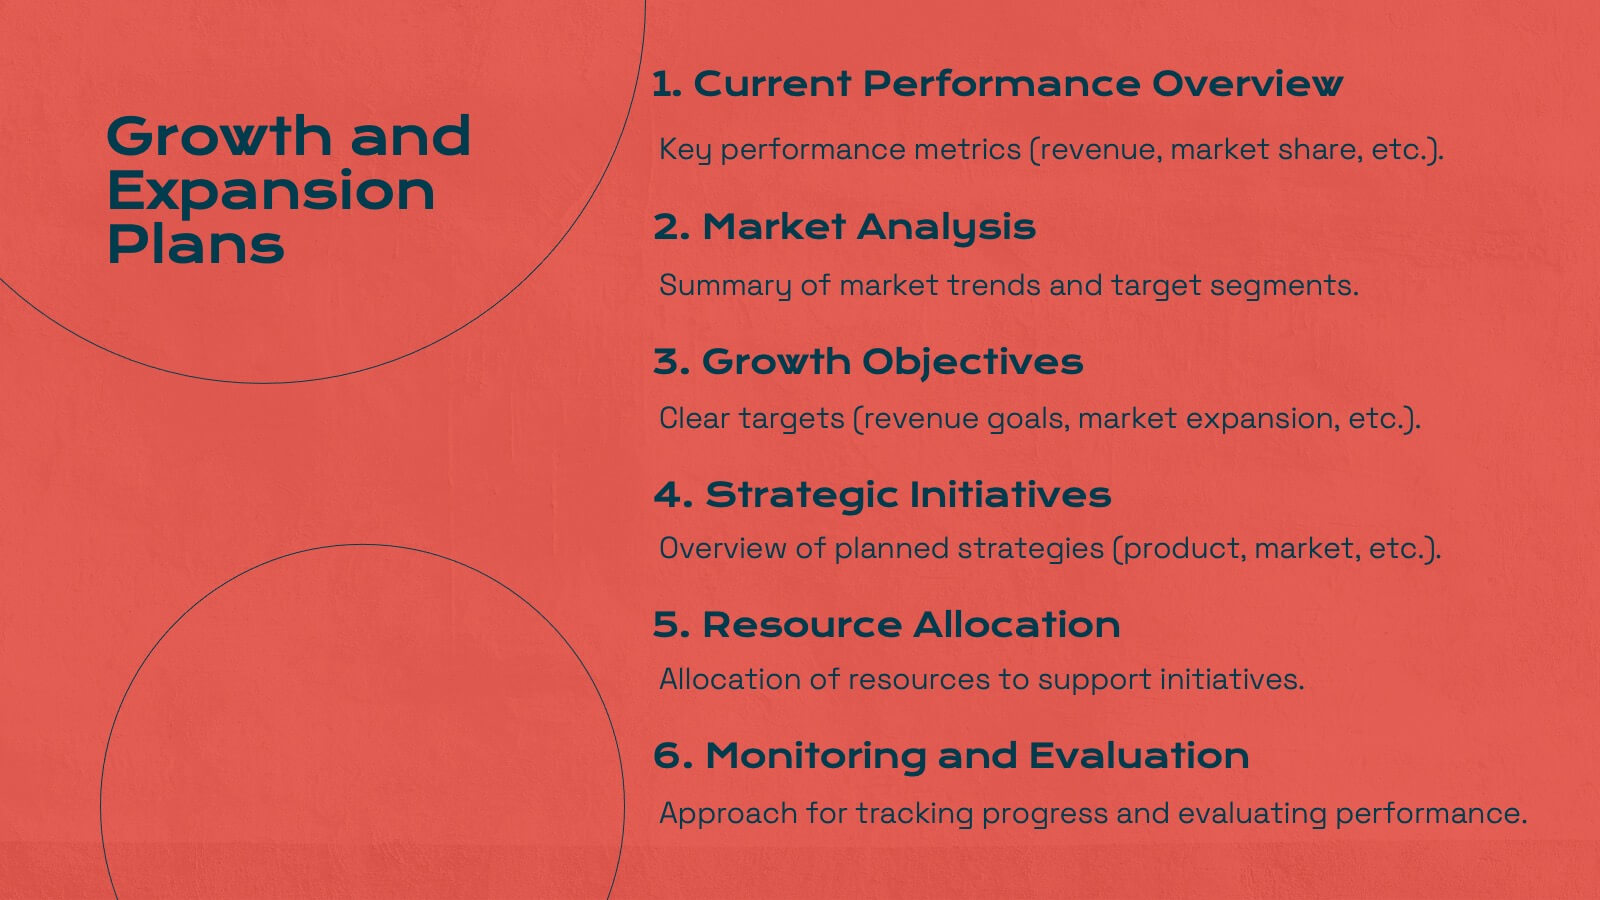
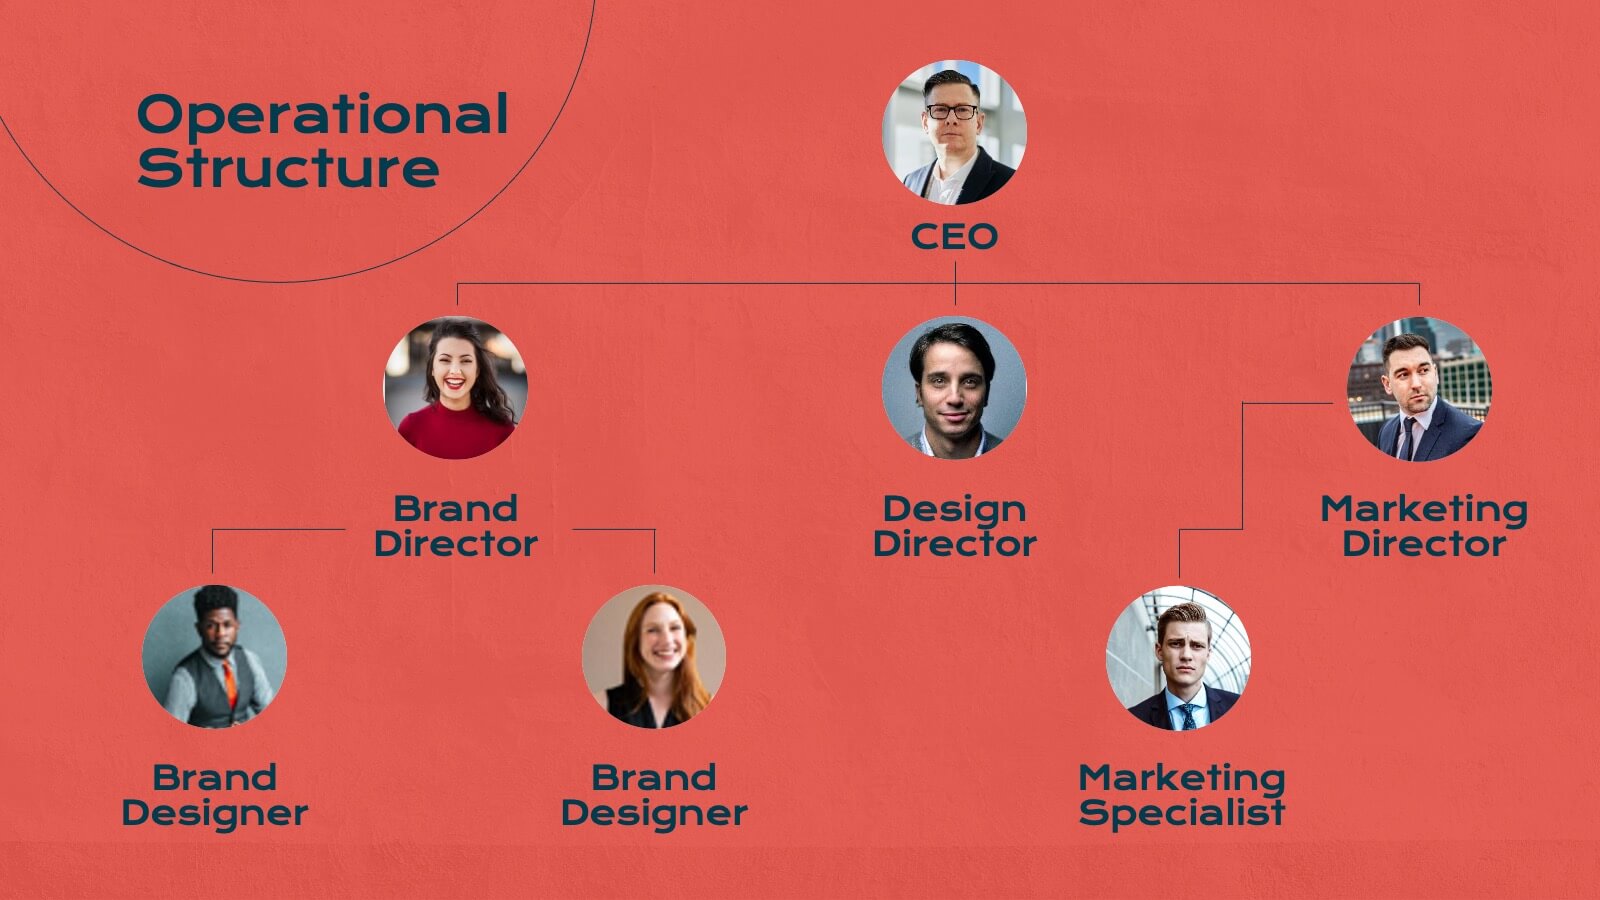
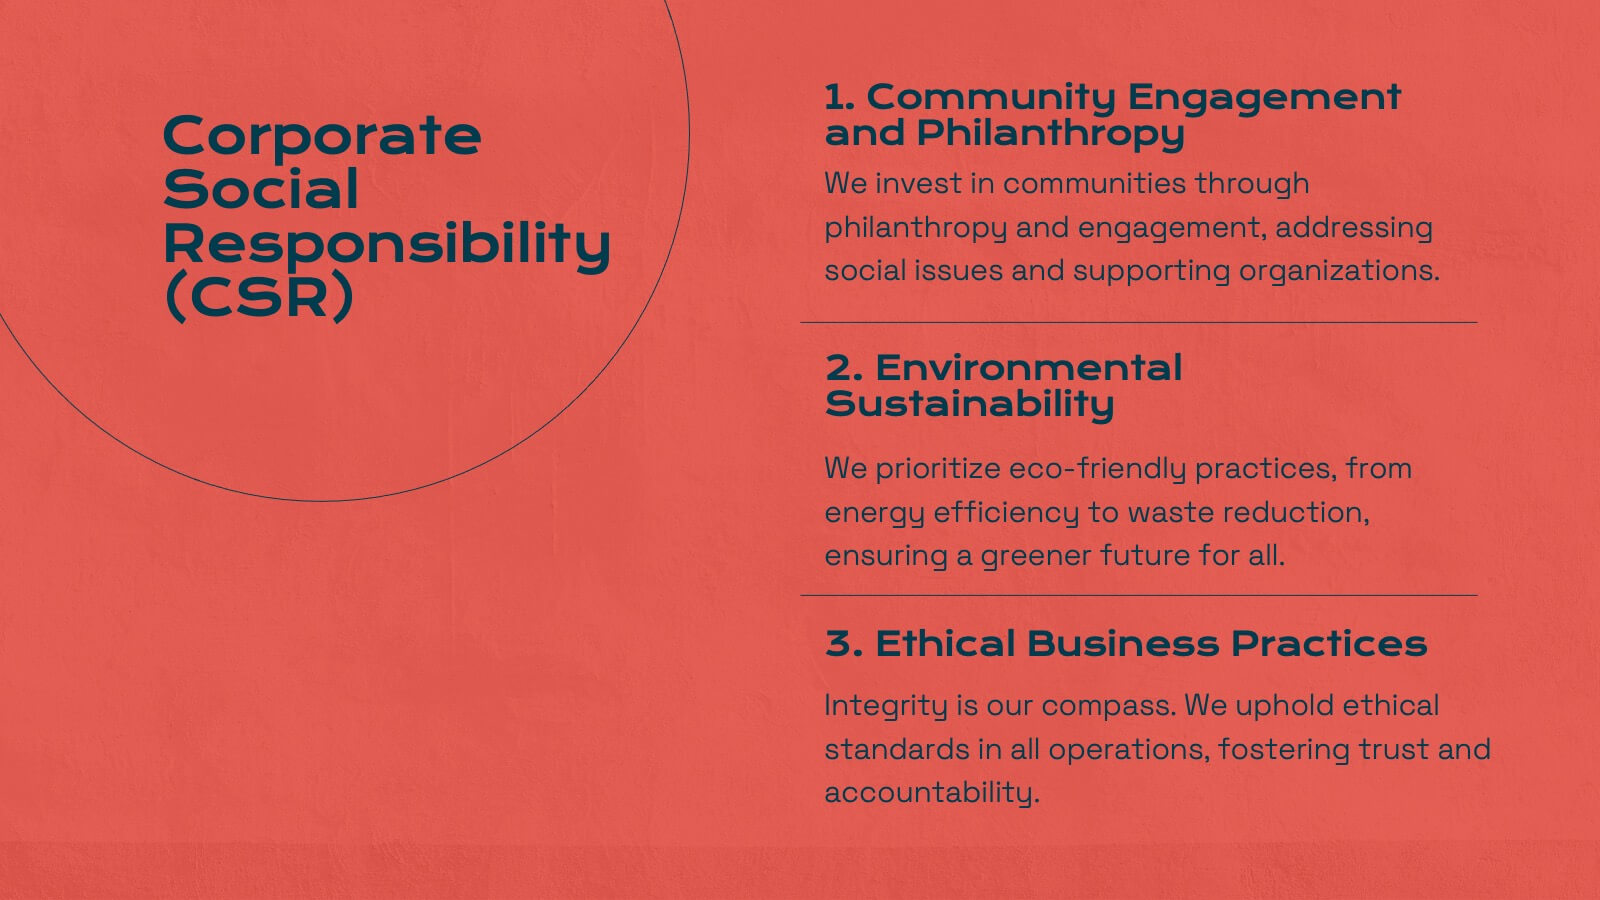
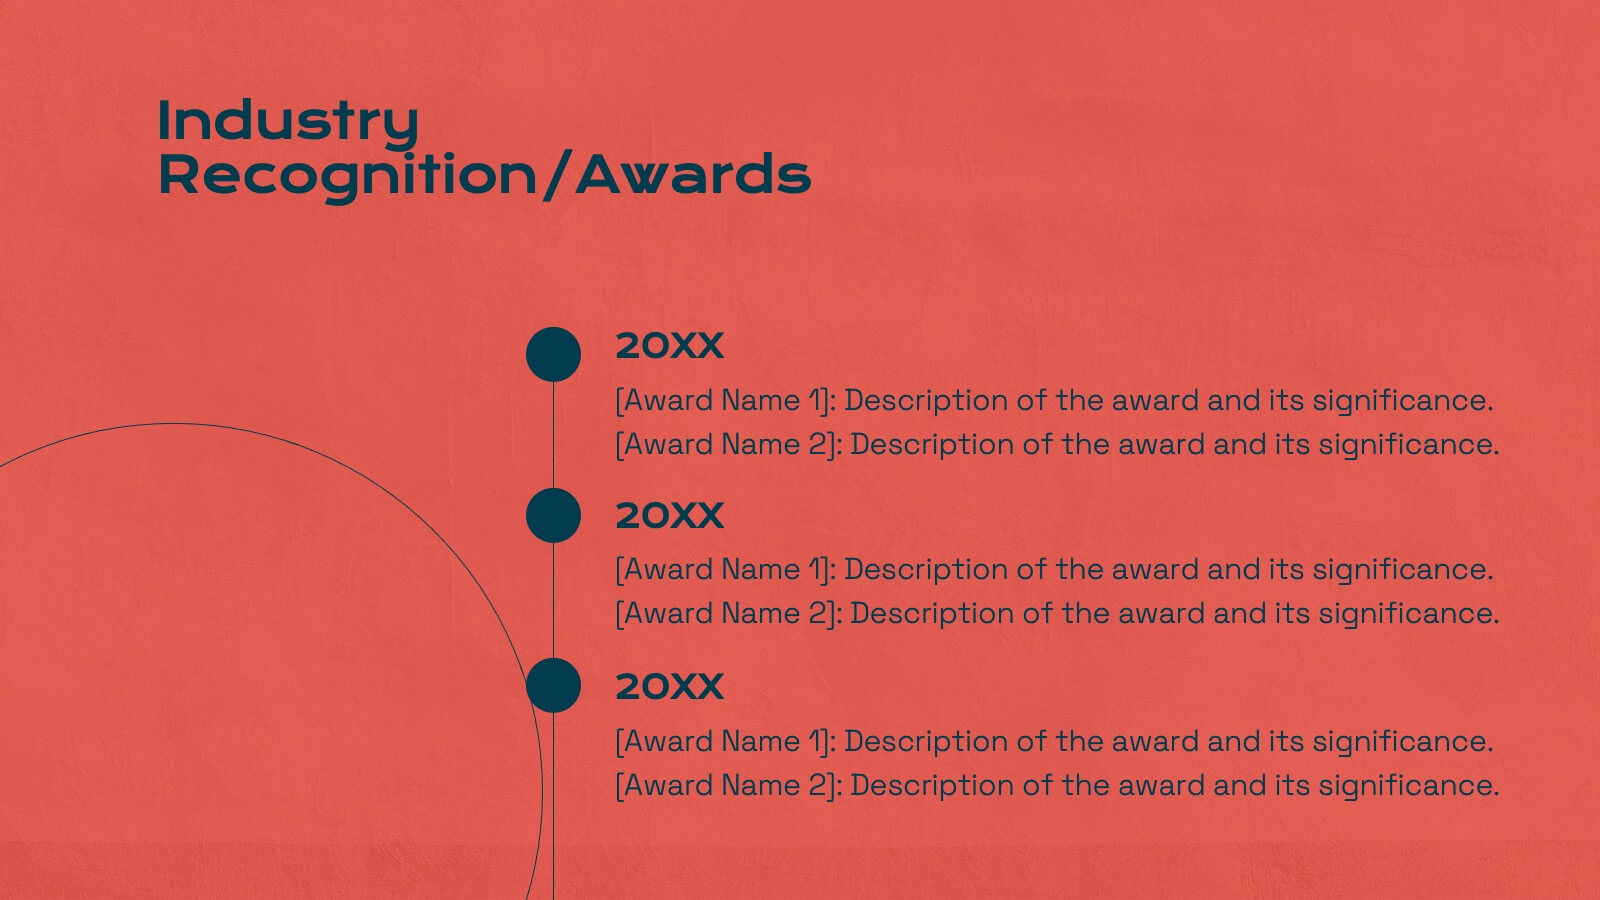
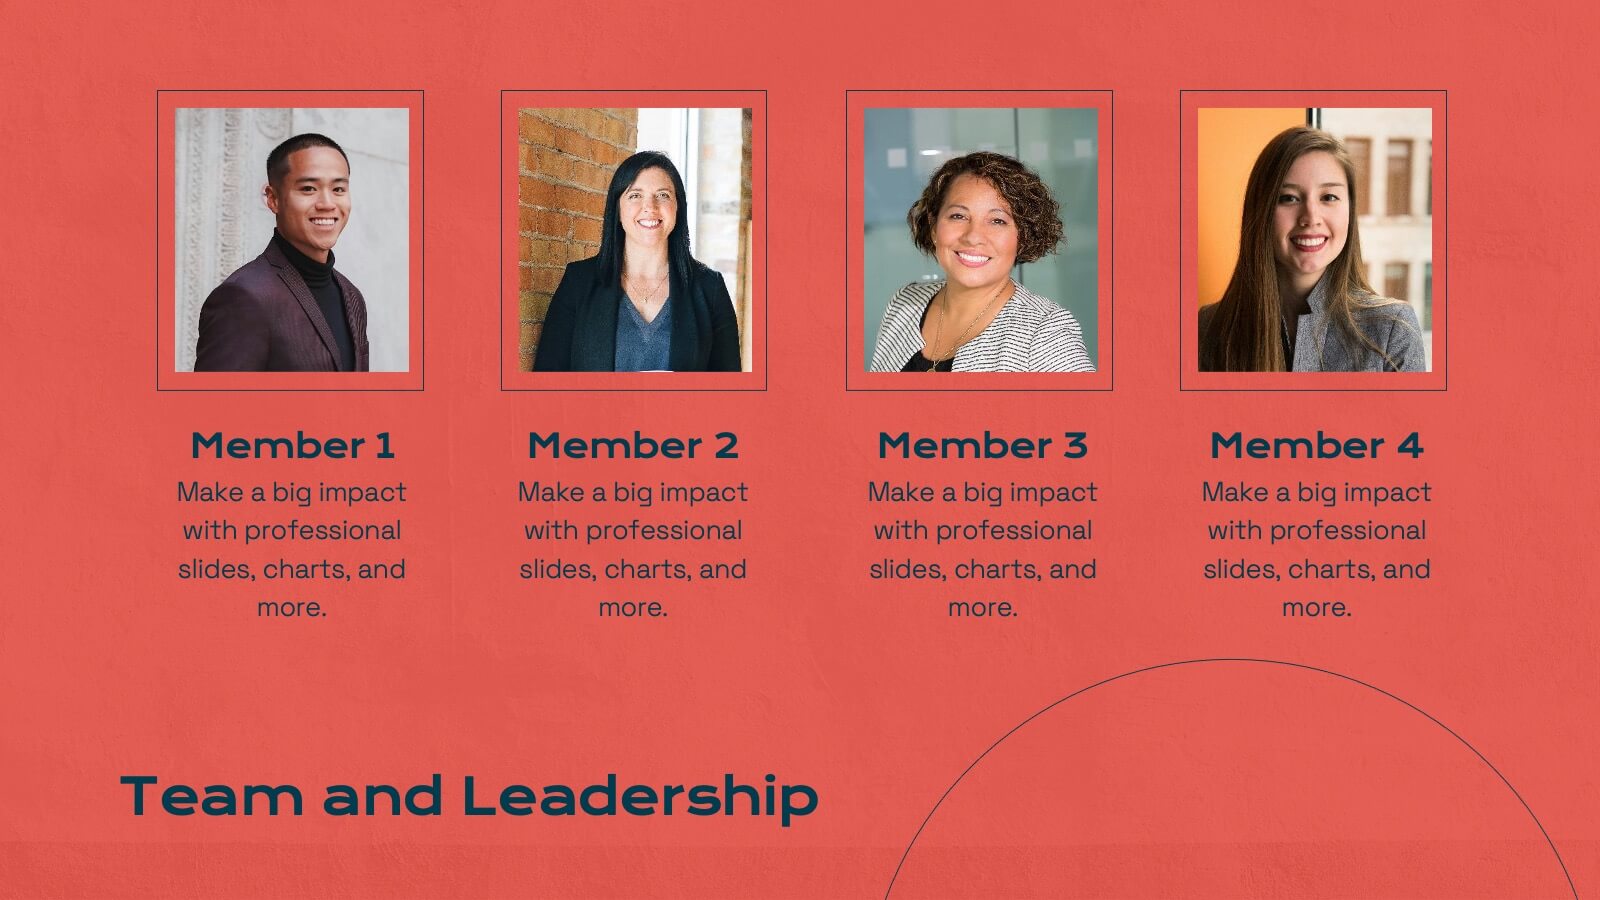
Titan Marketing Research Report Presentation
Energize your marketing research presentations with this bold, vibrant template. Perfect for detailing company history, market presence, and competitive landscapes, it features a striking red design that captures attention. Highlight key insights like target audience, financial highlights, and growth plans to engage your audience. Compatible with PowerPoint, Keynote, and Google Slides, it ensures seamless presentations on any platform.


7 diapositivas
Sports Training Camp Schedule Deck Presentation
Plan and present weekly training programs with this Sports Training Camp Schedule Deck. Featuring a clean, color-coded layout for Monday to Saturday, this slide helps coaches organize sessions clearly. Ideal for team meetings, camp planning, or fitness schedules. Fully editable in PowerPoint, Keynote, and Google Slides for easy customization.


4 diapositivas
Educational Infographic Slide Presentation
Ignite curiosity from the very first slide with a clear, classroom-style visual that makes explanations feel simple and engaging. This presentation helps break down lessons, key concepts, or training points in a way audiences instantly understand. Clean layouts keep the focus on your message. Fully compatible with PowerPoint, Keynote, and Google Slides.