


Características


¿Tienes alguna pregunta?
Recomendar

19 diapositivas
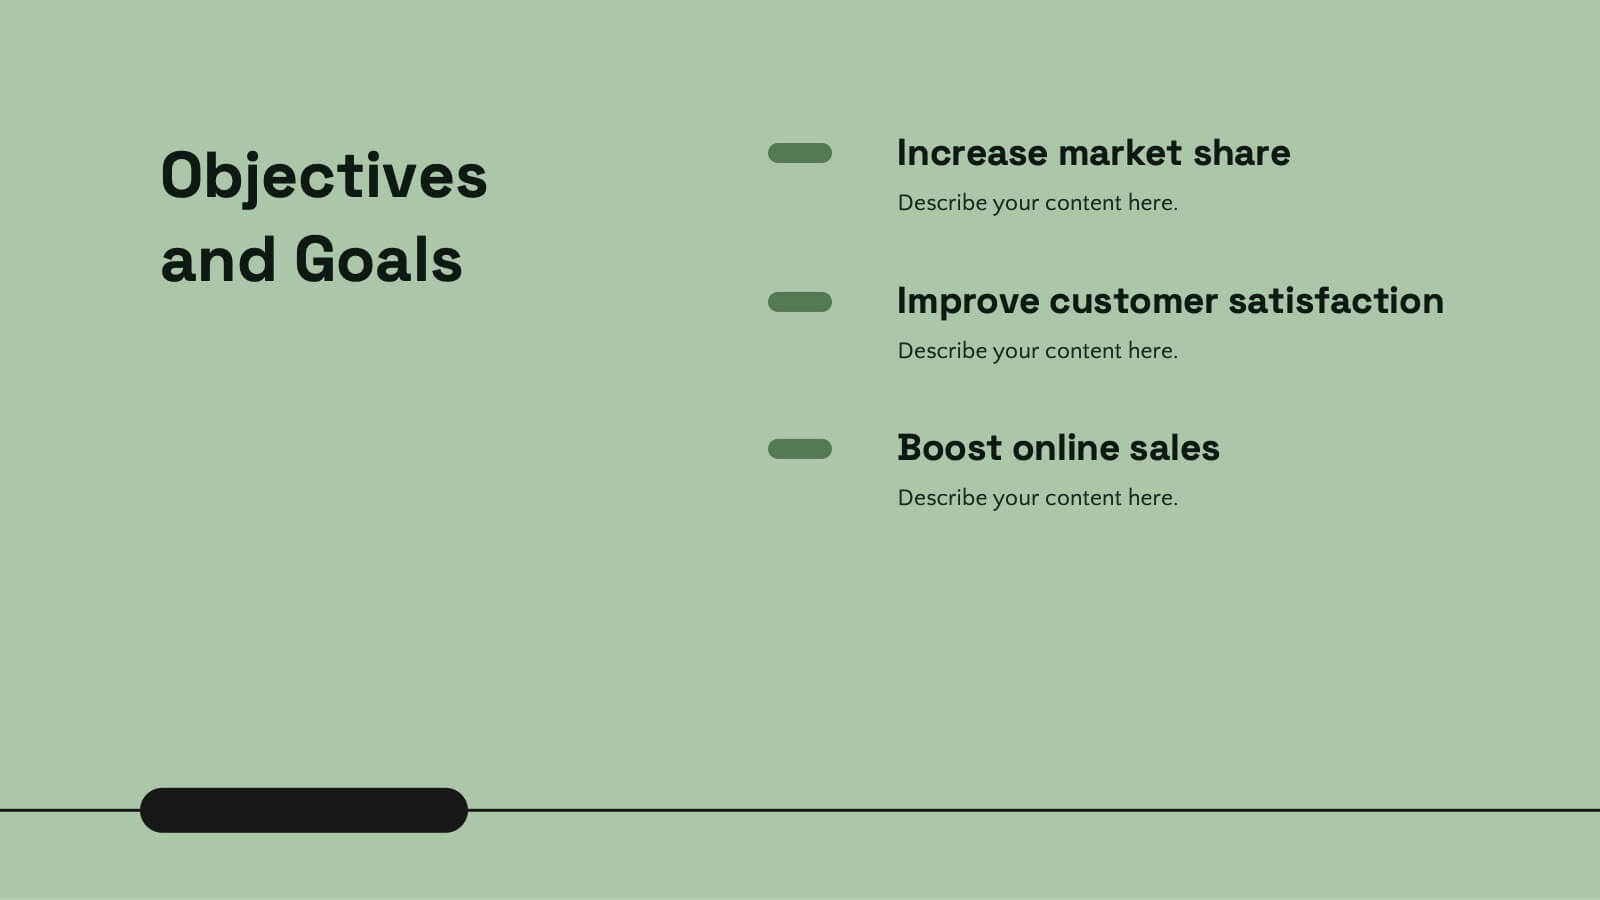
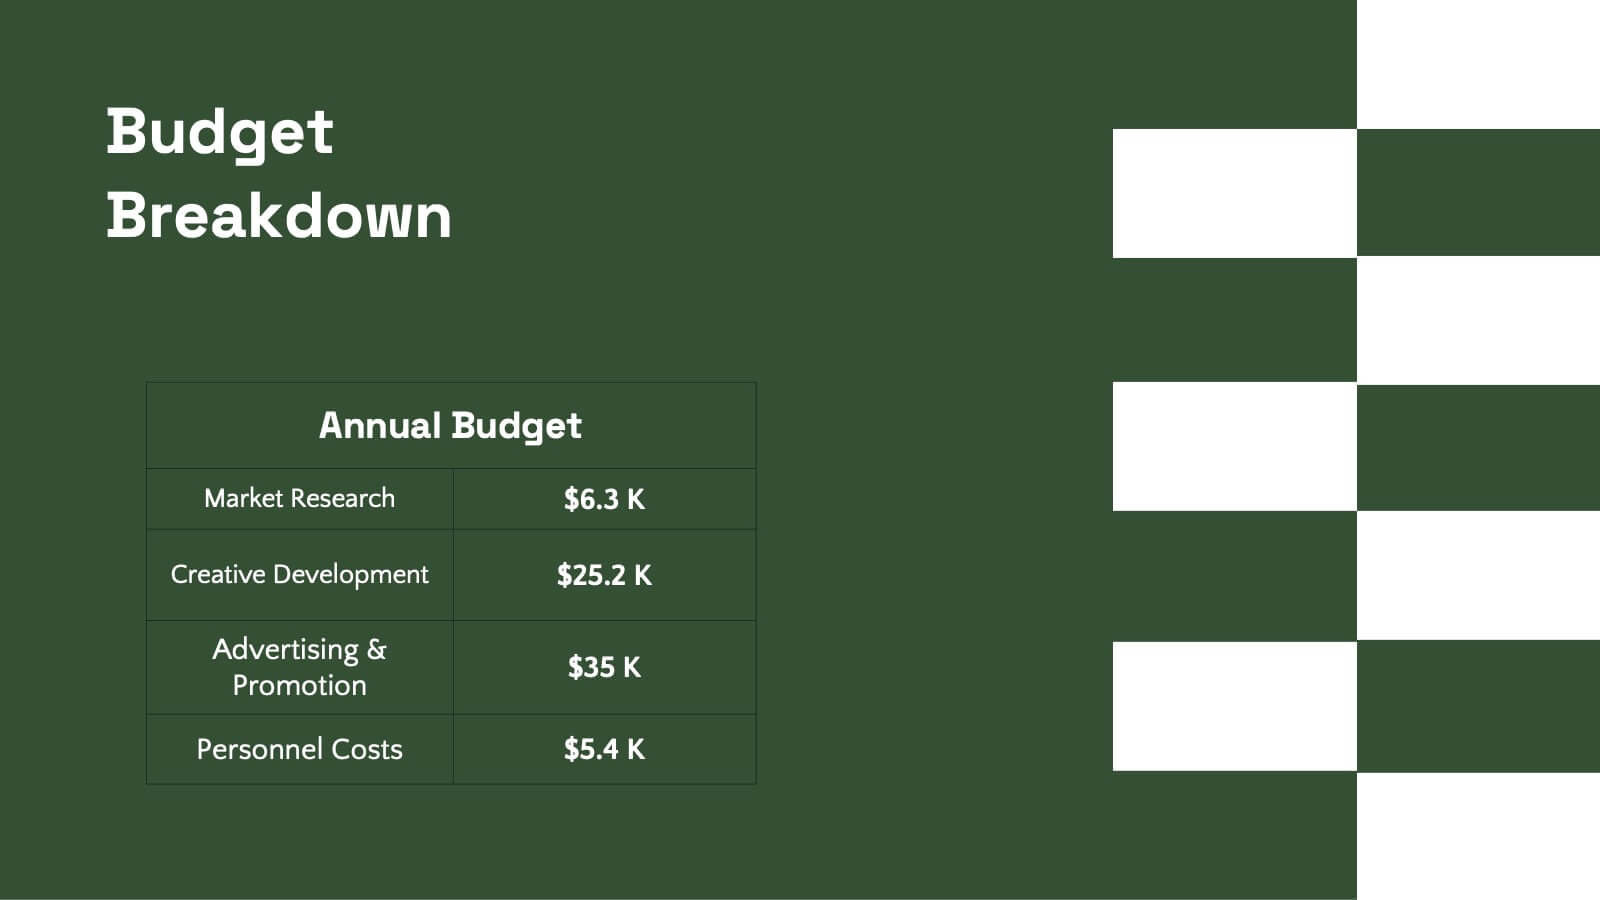
Tidal Design Proposal Presentation
Elevate your pitch with this sleek design proposal template! Perfect for presenting project details, objectives, methodology, and milestones, it ensures your ideas stand out. Impress stakeholders with clear, structured slides and professional aesthetics. Compatible with PowerPoint, Keynote, and Google Slides for a seamless presentation experience across all platforms.


4 diapositivas
Turning Ideas into Impact Presentation
Showcase your transformation journey from concept to achievement with this bold visual layout. The three-step diagram—idea, action, success—makes it ideal for project planning, product development, or strategic execution. Easily editable in PowerPoint, Keynote, and Google Slides for pitch decks, business roadmaps, or innovation workflows. Clean, modern, and impactful.


6 diapositivas
Wellness Program and Health Strategy Presentation
Bring your strategy to life with this clean and creative visual! This presentation template uses a six-part flower design to help you showcase your wellness goals, health strategies, or program pillars with clarity and balance. It’s fully editable and works perfectly in PowerPoint, Keynote, and Google Slides for flexible customization.


7 diapositivas
Buyer Infographic
Discover the power of visual storytelling with our dynamic Infographic Template, designed to bring the buyer's journey to life in full color and engaging detail! Each slide is a palette of opportunity, with bold hues and intuitive layouts that transform standard data into a compelling narrative. This template is a marketer’s dream, perfect for delineating complex buyer behaviors, demographics, and decision processes in an easily digestible format. It leverages striking graphics and concise text to illuminate key insights that drive consumer actions, making it indispensable for presentations, reports, or online content. Customize to your heart’s content, adjusting colors, fonts, and layouts to align perfectly with your branding. Whether you're detailing market trends, consumer feedback, or purchase patterns, this template ensures your data not only informs but also inspires. Ideal for strategists, sales teams, and marketers, it's your secret weapon in crafting stories that not only tell but also sell.


21 diapositivas
Mystorin Market Analysis Report Presentation
Present your market analysis findings with this sleek and professional report presentation template. Covering essential sections such as key highlights, performance metrics, competitor insights, and strategic initiatives, it provides a comprehensive framework for data-driven decisions. Ideal for businesses and analysts. Compatible with PowerPoint, Keynote, and Google Slides for easy customization.


4 diapositivas
IT Network Infrastructure
Simplify the complexity of your digital ecosystem with this IT Network Infrastructure presentation. Designed to visualize connectivity, servers, and system architecture, this layout is perfect for IT teams, consultants, and tech-focused reports. Fully editable in PowerPoint, Keynote, and Google Slides for seamless integration into your workflow.


7 diapositivas
Development Bubble Map Infographic
The Development Bubble Map Infographic you've provided appears to be a visual tool used to organize and represent information in a connected, yet clustered format. Bubble maps are commonly used to illustrate relationships and relative importance among concepts, making them useful for brainstorming, concept mapping, and planning. Each bubble in the map may contain a single concept, idea, or data point, with the size of the bubble often corresponding to the significance or amount of data related to the concept. The connecting lines indicate relationships or pathways between these ideas. Such an infographic could be used in various settings, such as educational environments for teaching, business meetings to discuss project development, or personal planning to visually map out ideas and their interconnections. It helps to visually break down complex systems or concepts into more manageable parts, enabling better understanding and analysis.


6 diapositivas
Airline Business Strategy and Trends Presentation
Navigate your industry insights with clarity using this sleek aviation-themed slide. Perfect for showcasing five core data points or trends, each positioned along a stylized airplane graphic. This layout is ideal for airline professionals, aerospace consultants, and logistics analysts. Fully customizable in PowerPoint, Keynote, and Google Slides.


7 diapositivas
SEO Strategy and Keyword Plan Presentation
Spark your marketing roadmap with a bold, idea-driven layout that makes every action step clear and memorable. This presentation helps you outline search goals, explore keyword opportunities, and map out strategic priorities in a simple, visual flow. Fully compatible with PowerPoint, Keynote, and Google Slides.


4 diapositivas
Boardroom Strategy Meeting Overview Presentation
Align leadership goals and present strategic priorities with the Boardroom Strategy Meeting Overview presentation. Featuring a clean visual of executive collaboration, this template helps organize key discussion points, initiatives, and responsibilities in a structured layout. Ideal for quarterly planning, leadership updates, and strategic alignment sessions. Fully editable in PowerPoint, Keynote, and Google Slides.


6 diapositivas
User Empathy Map Infographic
An Empathy Map is a visual tool used in design thinking and customer-centric approaches to understand the needs, thoughts, feelings, and behaviors of a specific target user or customer. This infographic template is a tool used in user-centered design and product development to better understand and empathize with the needs, thoughts, emotions, and experiences of the target users. It helps teams gain deeper insights into the users' perspectives and develop more user-focused solutions. The infographic consists of four quadrants, each representing different aspects of the user's experience. Compatible with Powerpoint, Keynote, and Google Slides.


8 diapositivas
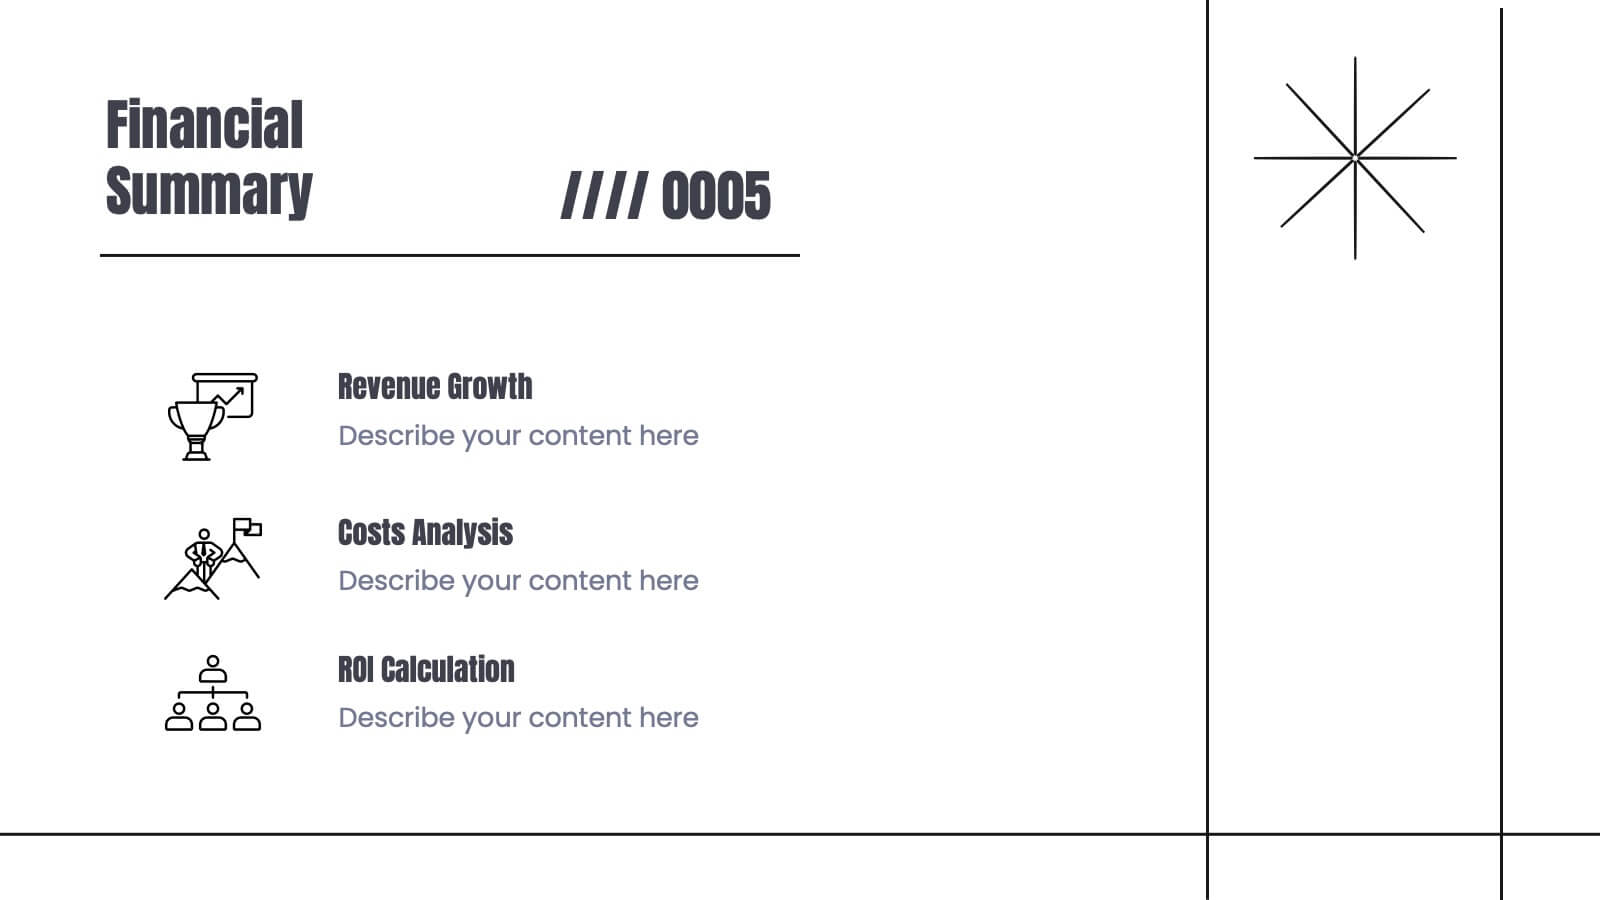
Structured Table of Content for Reports Presentation
Create clarity and flow in your professional reports with this Structured Table of Content for Reports slide. Featuring a sleek column design with three main sections, each block offers space for a title, description, and a matching icon. Ideal for business reviews, strategy documents, and formal proposals. This layout ensures your audience knows exactly what to expect. Fully customizable in PowerPoint, Keynote, and Google Slides.


7 diapositivas
RACI Matrix Process Infographic Presentation
A RACI matrix is a project management tool that is used to clarify and define roles and responsibilities for project tasks and deliverables. Use this template to help you quickly create RACI charts for your next project. Made up of strategic box with shapes, colors, numeric value and text boxes that can be edited easily. This Template is a multipurpose slide as it can be used to present data visually, build a discussion on the topic and influence your audience to take action. Save time and energy with this infographic template, compatible with Powerpoint, Keynote and Google Slides.


5 diapositivas
Meeting Topics and Flow Agenda
Structure your meetings with ease using the Meeting Topics and Flow Agenda Presentation. This modern layout features a circular hub surrounded by five hexagons, each with icons and labeled steps from A to E. Ideal for visualizing agendas, discussion points, or workflow stages. Fully editable in PowerPoint, Keynote, and Google Slides.


6 diapositivas
6-Stage Business Cycle Presentation
The "6-Stage Business Cycle Presentation" template expertly outlines the progression of business processes through a visually appealing circular diagram, perfect for detailed strategic presentations. This template features six interconnected stages, each distinguished by unique colors and intuitive icons, simplifying complex business concepts into digestible segments. Central placeholders allow for concise titles and brief descriptions, enhancing clarity and comprehension. Ideal for business analysts, strategists, and educators, this tool facilitates the effective communication of developmental cycles, operational processes, and strategic evaluations. Use this template in board meetings, workshops, or educational sessions to convey the cyclical nature of business tasks and strategies efficiently.


6 diapositivas
Startup Investment Infographics
The "Startup Investment" infographic template is a sleek and persuasive tool, perfectly crafted for PowerPoint, Keynote, and Google Slides. This template is a crucial asset for entrepreneurs, investors, and business consultants who are keen on presenting the essentials of startup financing, investment strategies, and growth opportunities in an impactful way. This template efficiently encapsulates the startup investment landscape, highlighting key areas like funding stages, investor types, valuation methods, and return on investment. It's designed to articulate the dynamics of startup funding, making it an invaluable tool for pitch presentations, investor meetings, and financial planning discussions. The design is as dynamic as the startup ecosystem itself, with a color scheme that is both vibrant and professional. This not only makes the presentation visually compelling but also signifies the energy, innovation, and potential associated with startup investments. Whether used in a boardroom, a startup incubator, or an investment seminar, this template ensures that your insights into "Startup Investment" are communicated with clarity, confidence, and visual appeal.

22 diapositivas
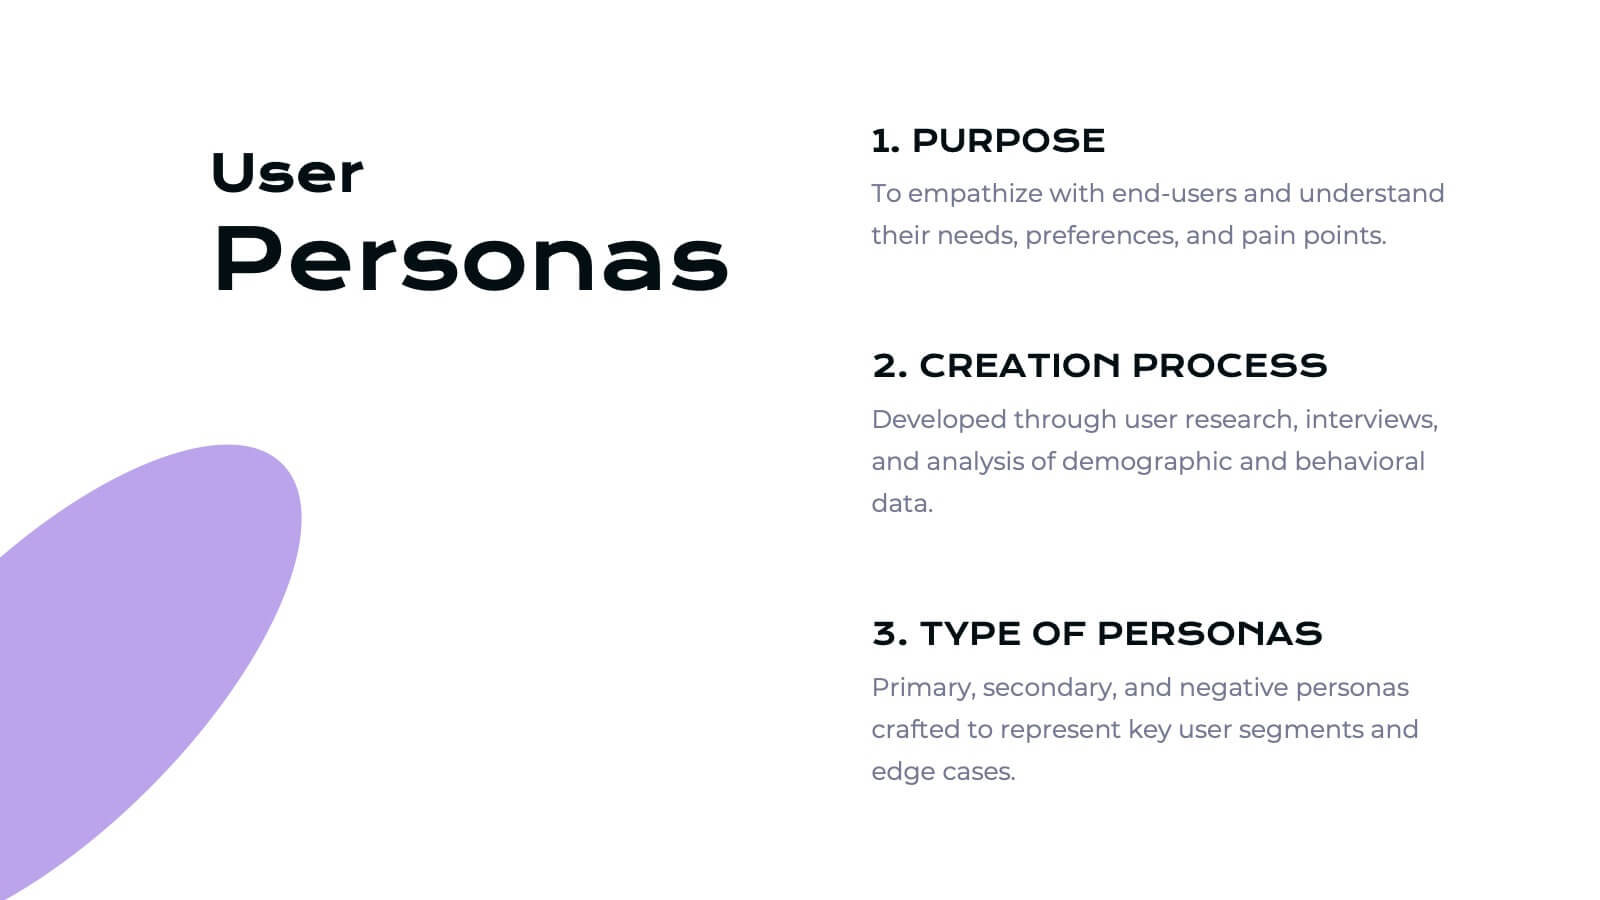
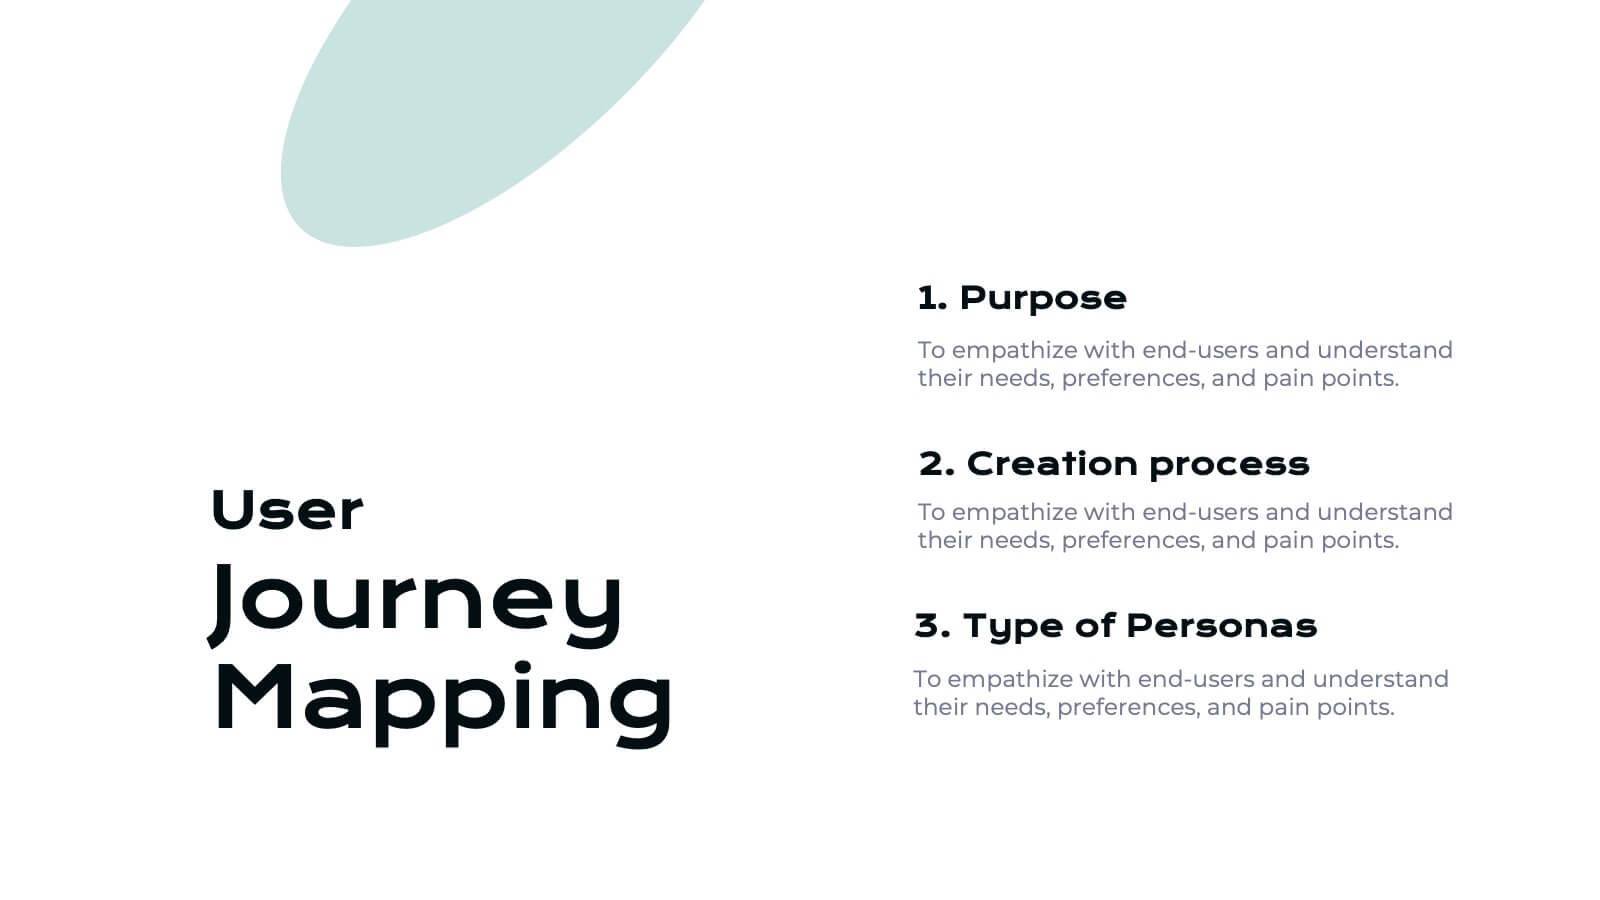
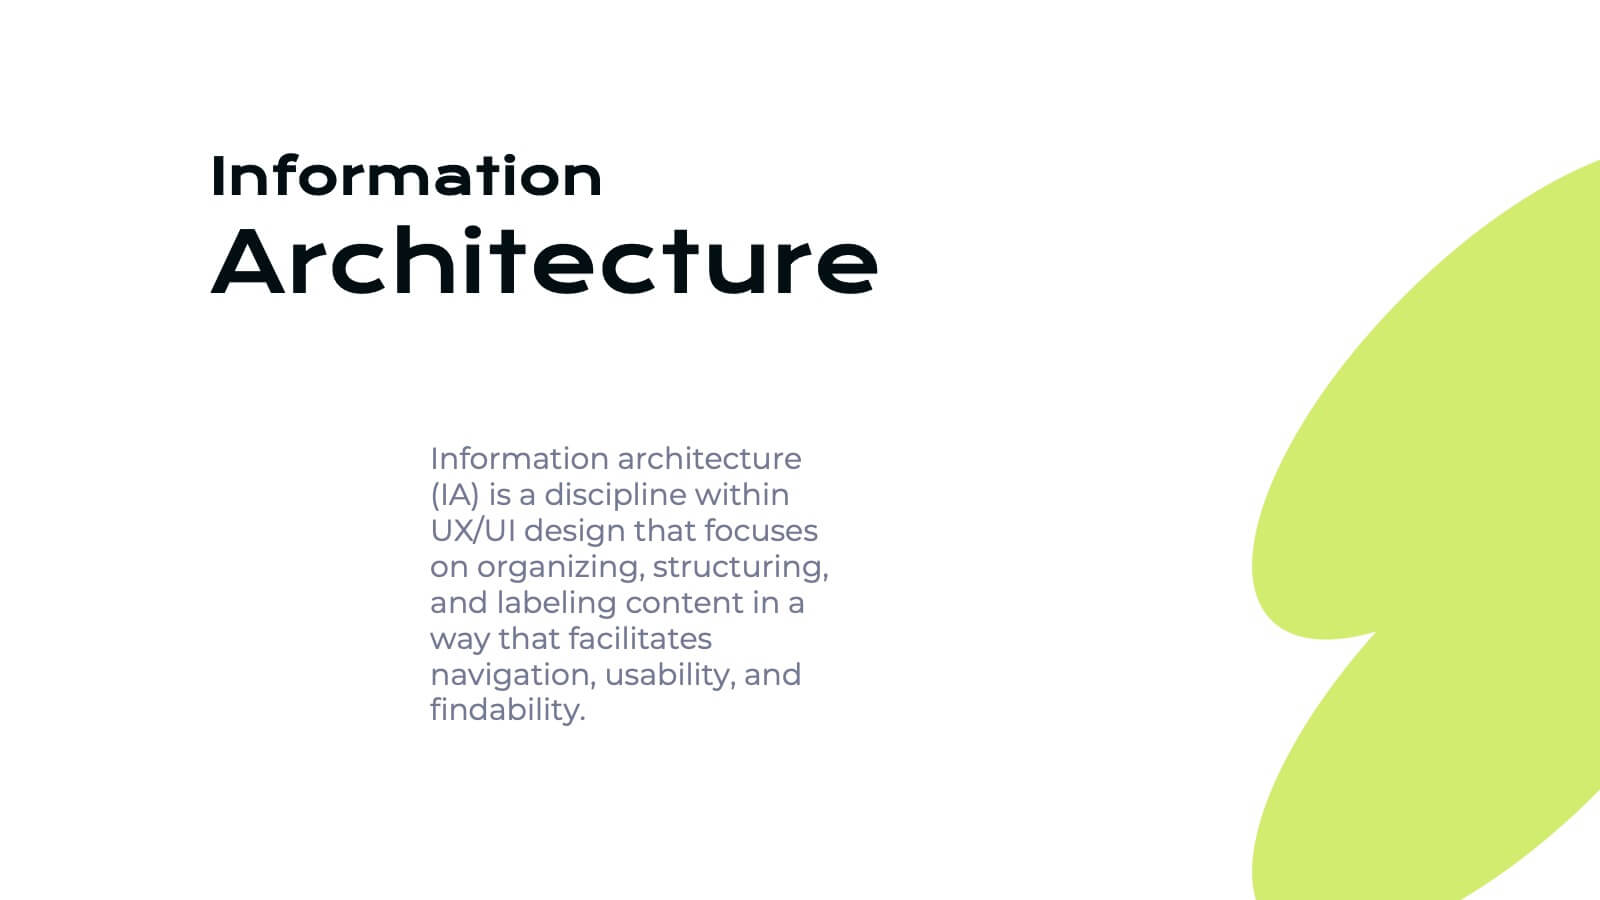
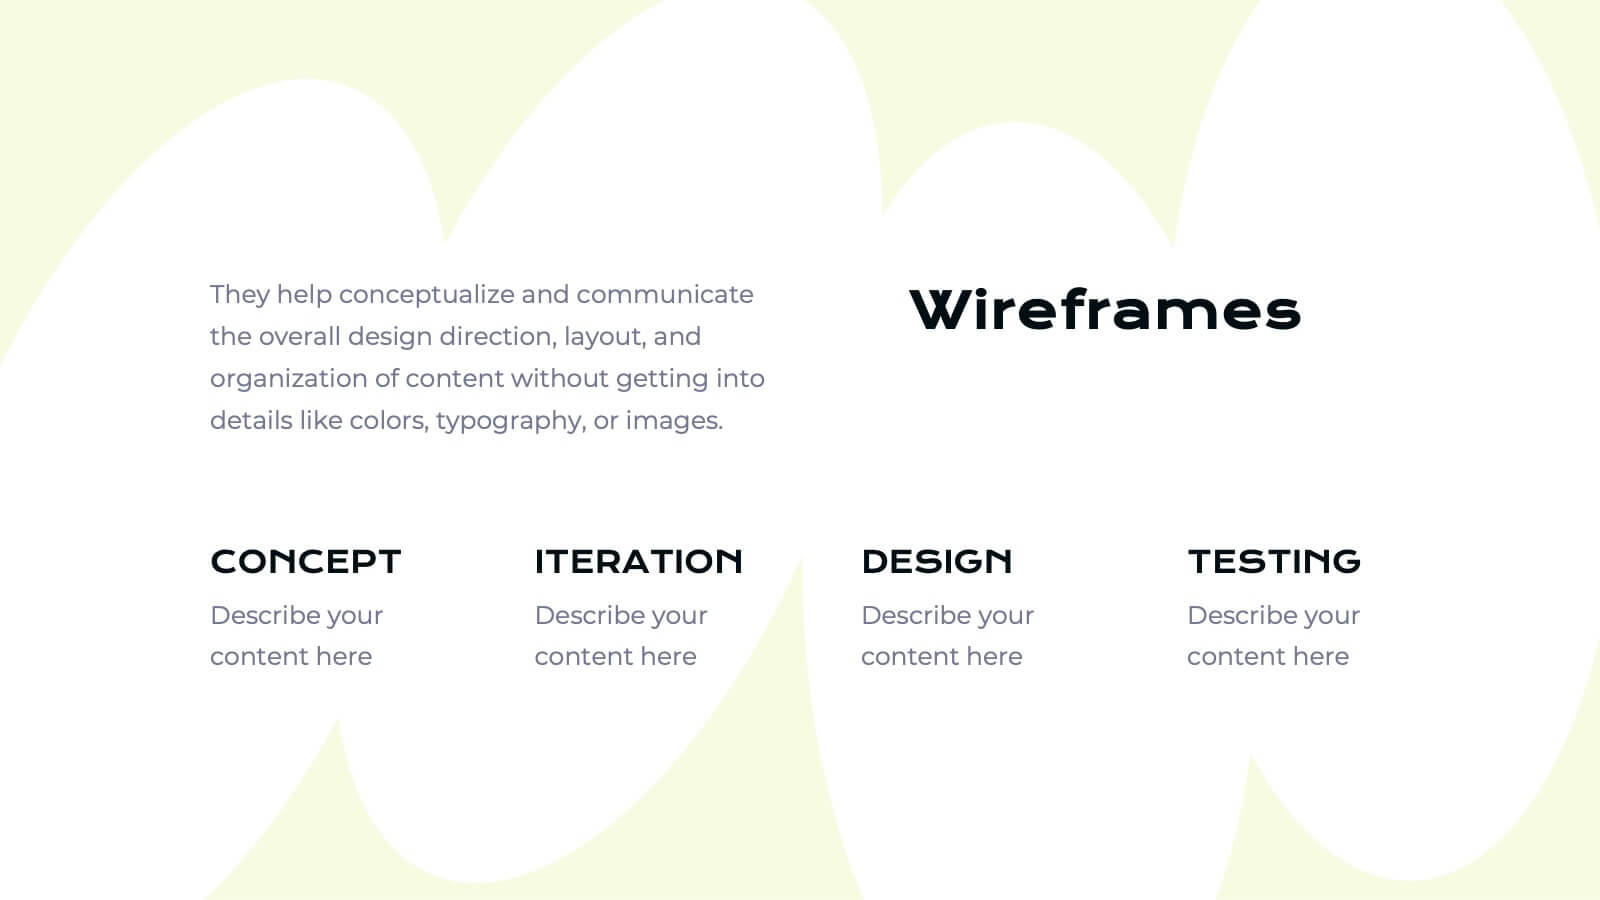
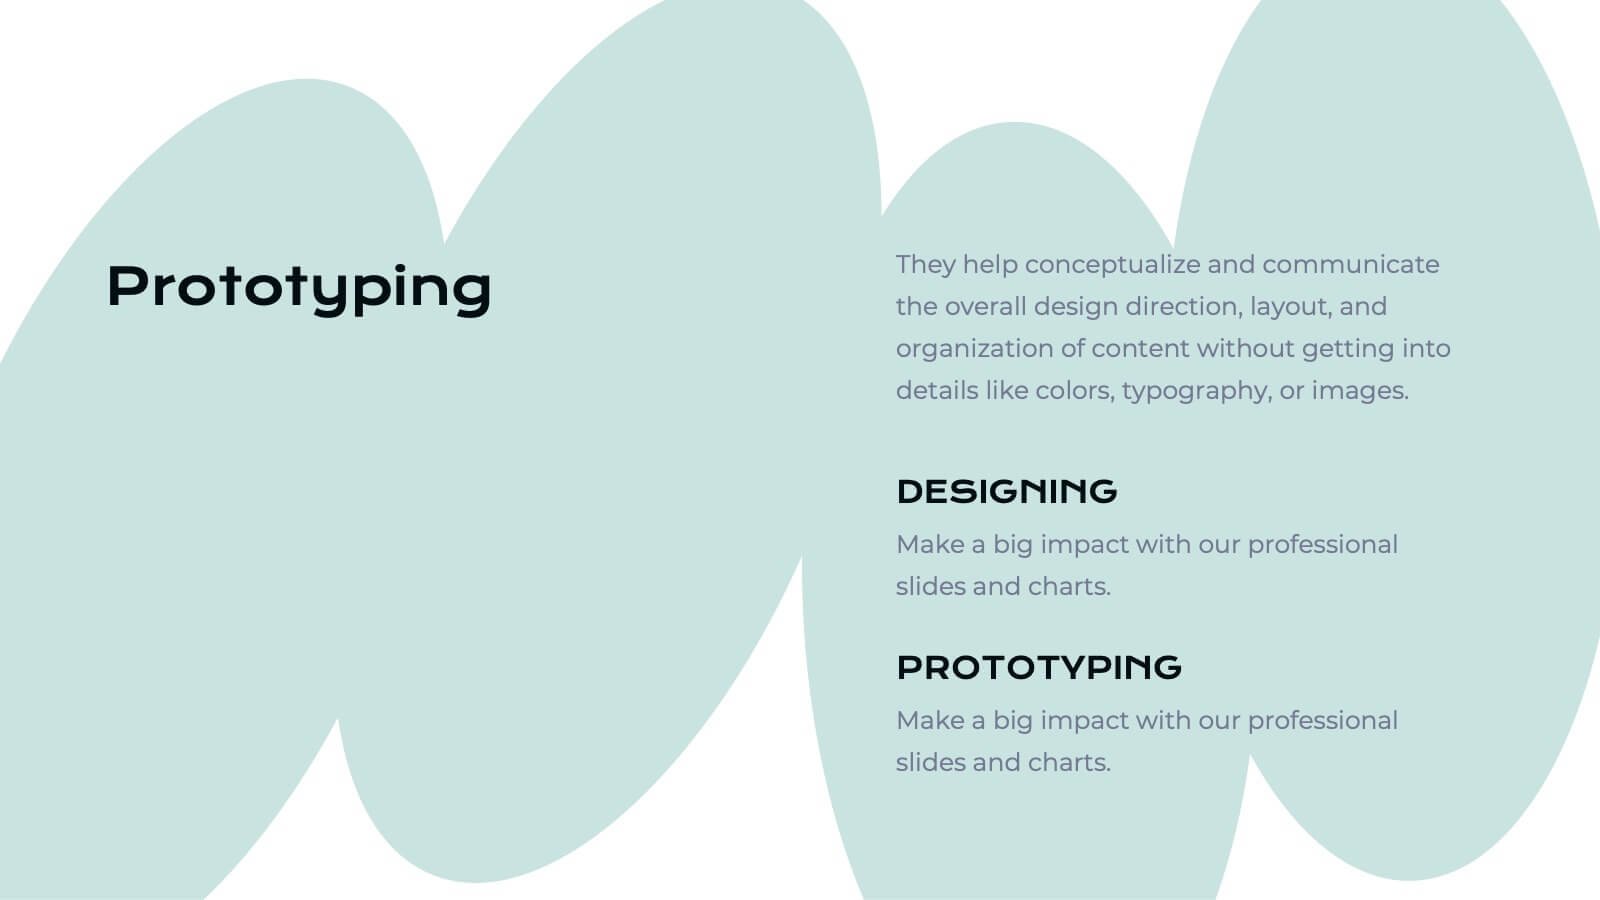
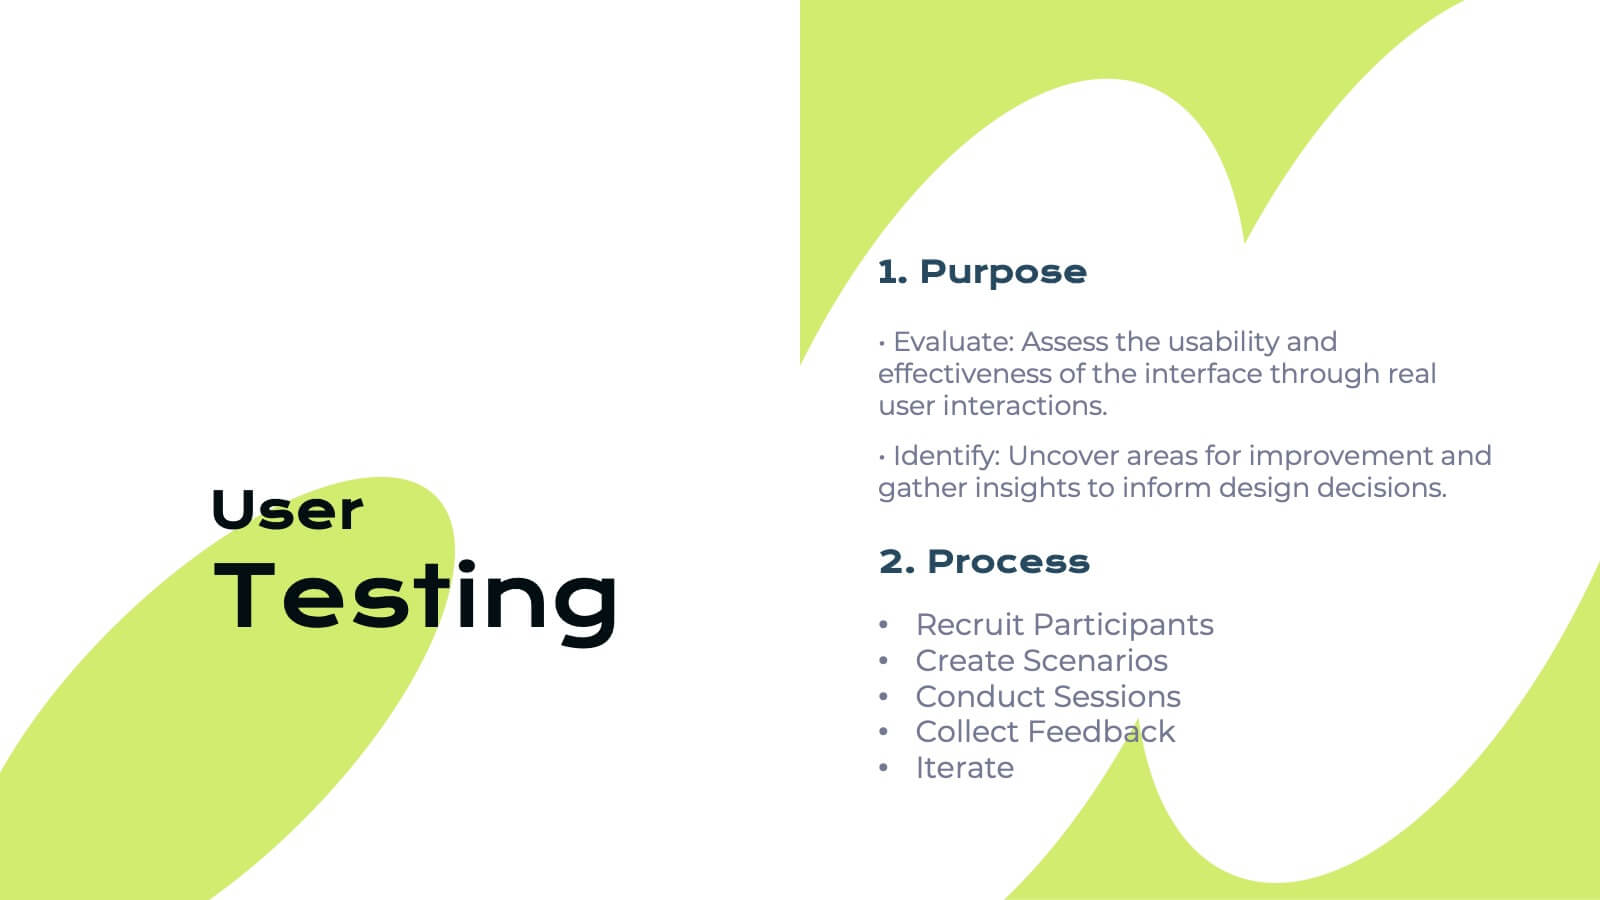
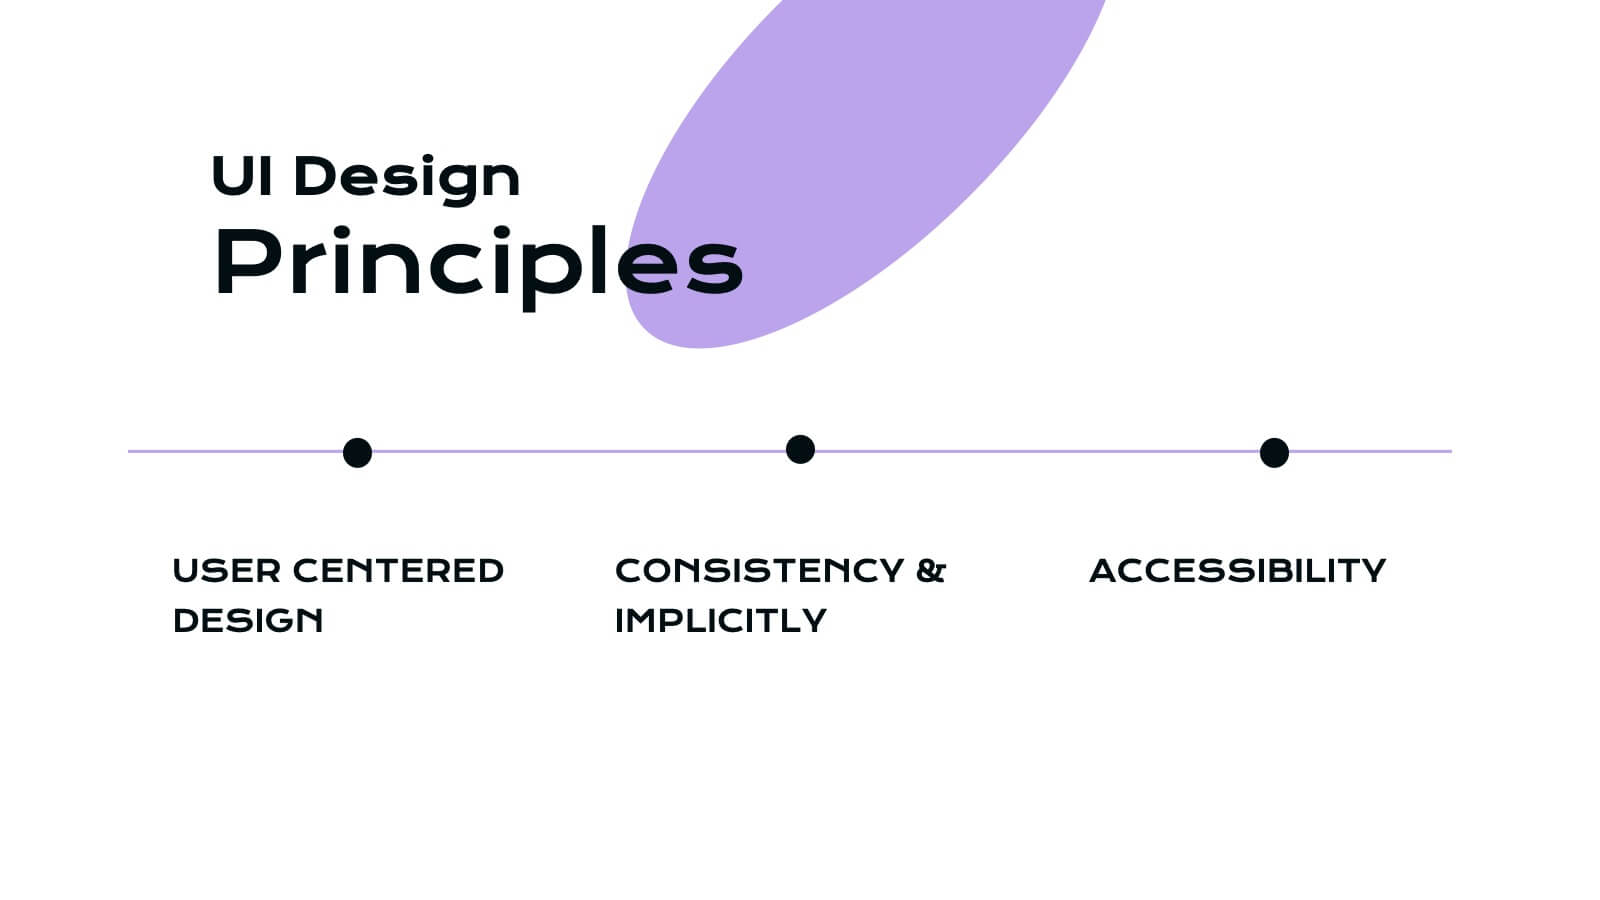
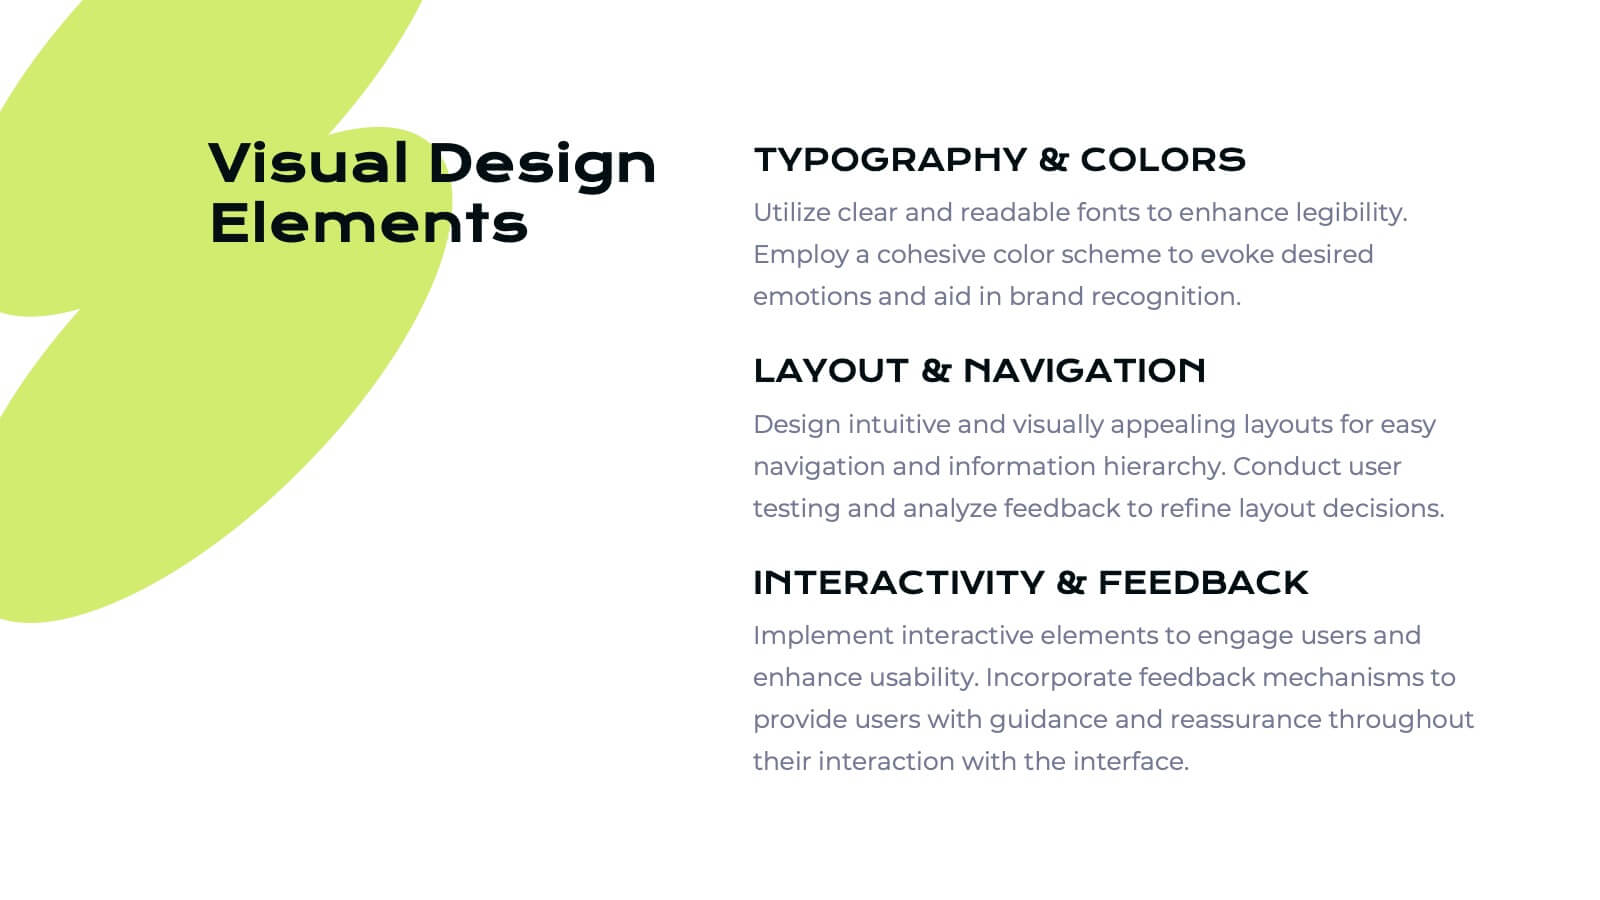
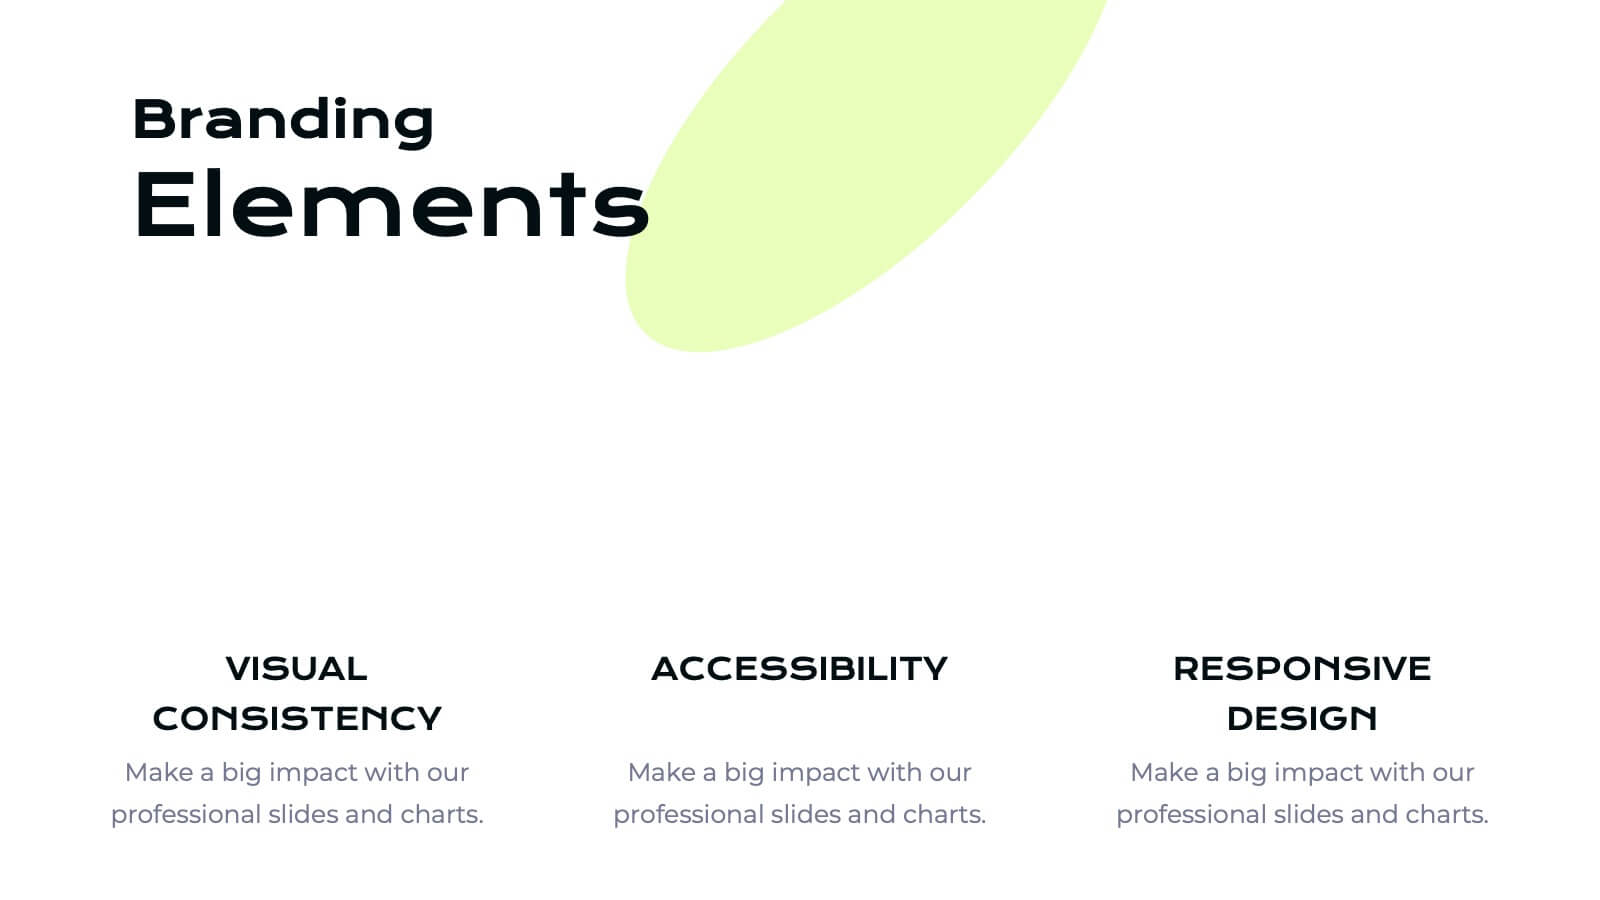
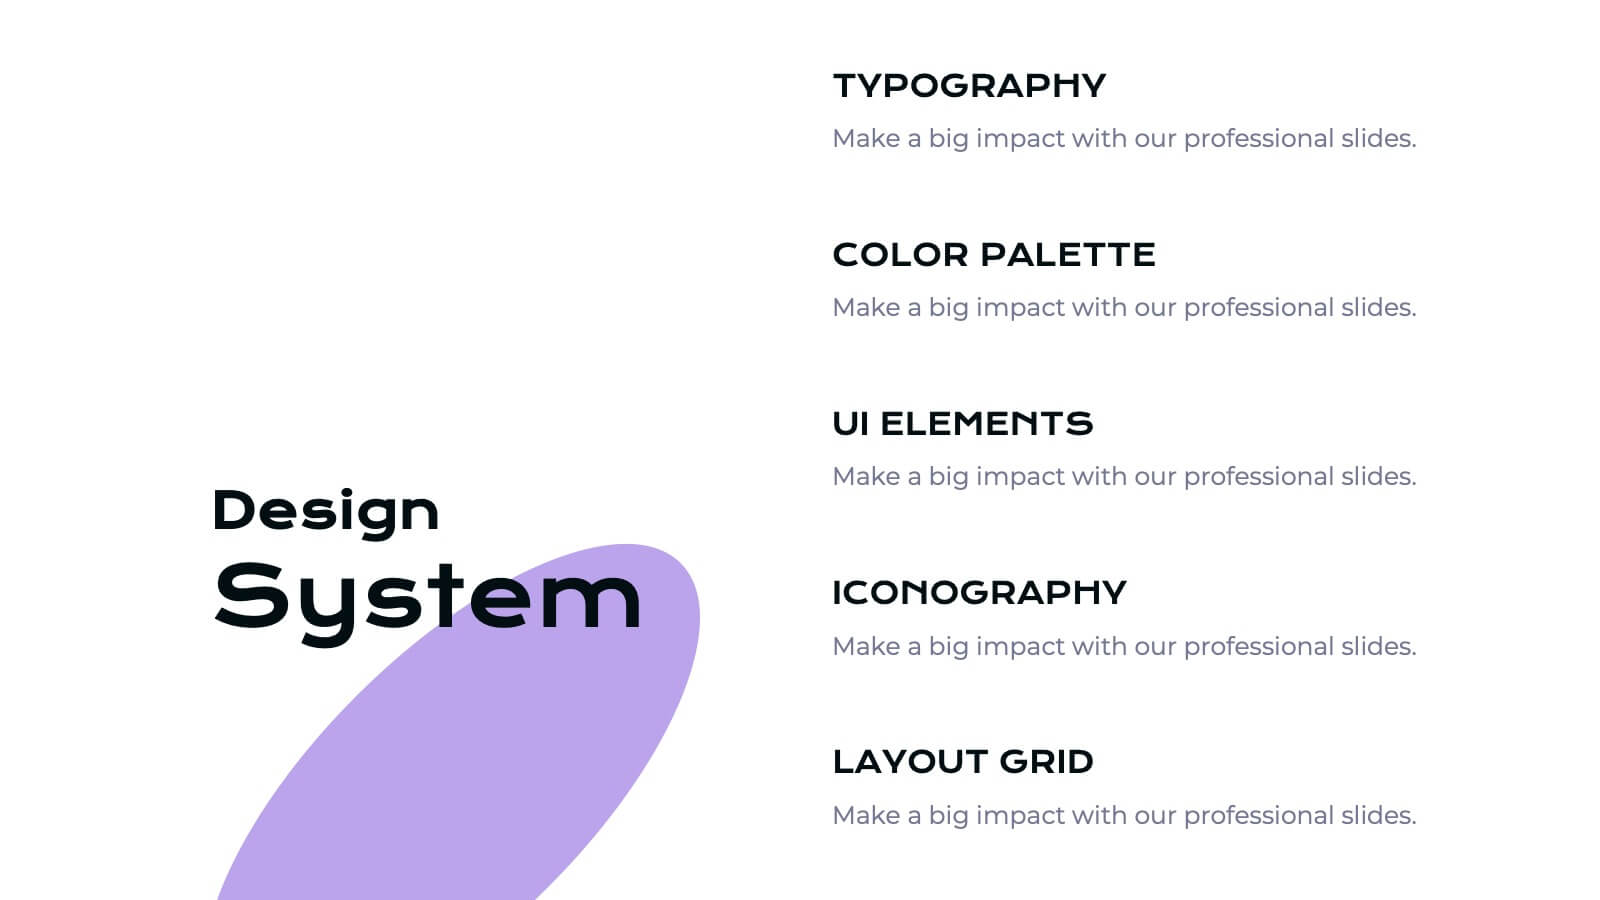
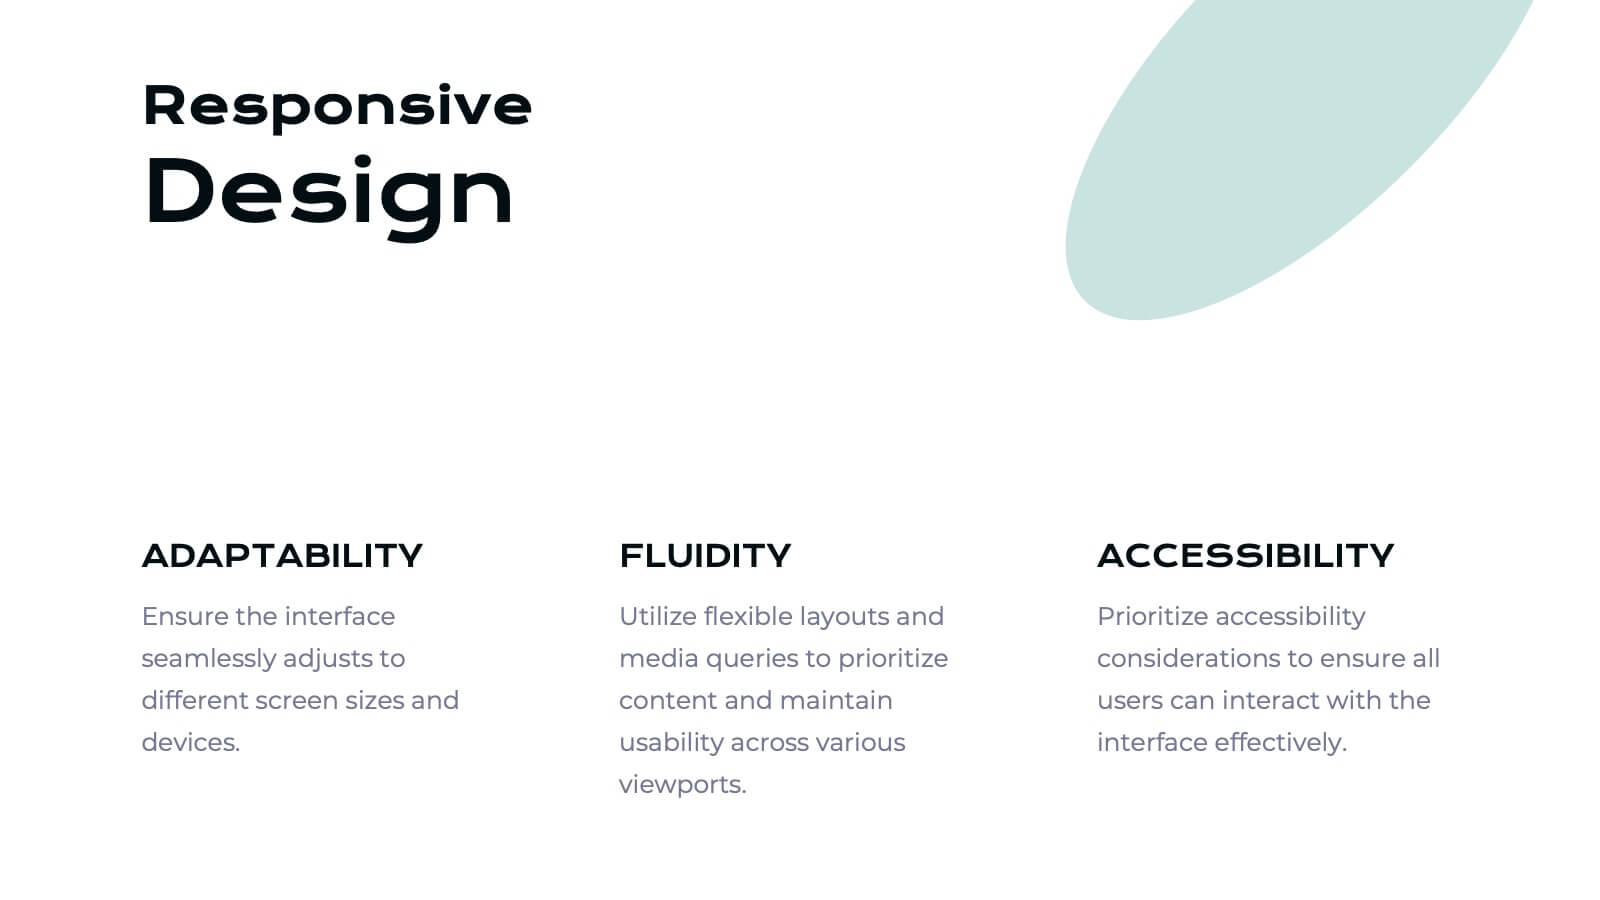
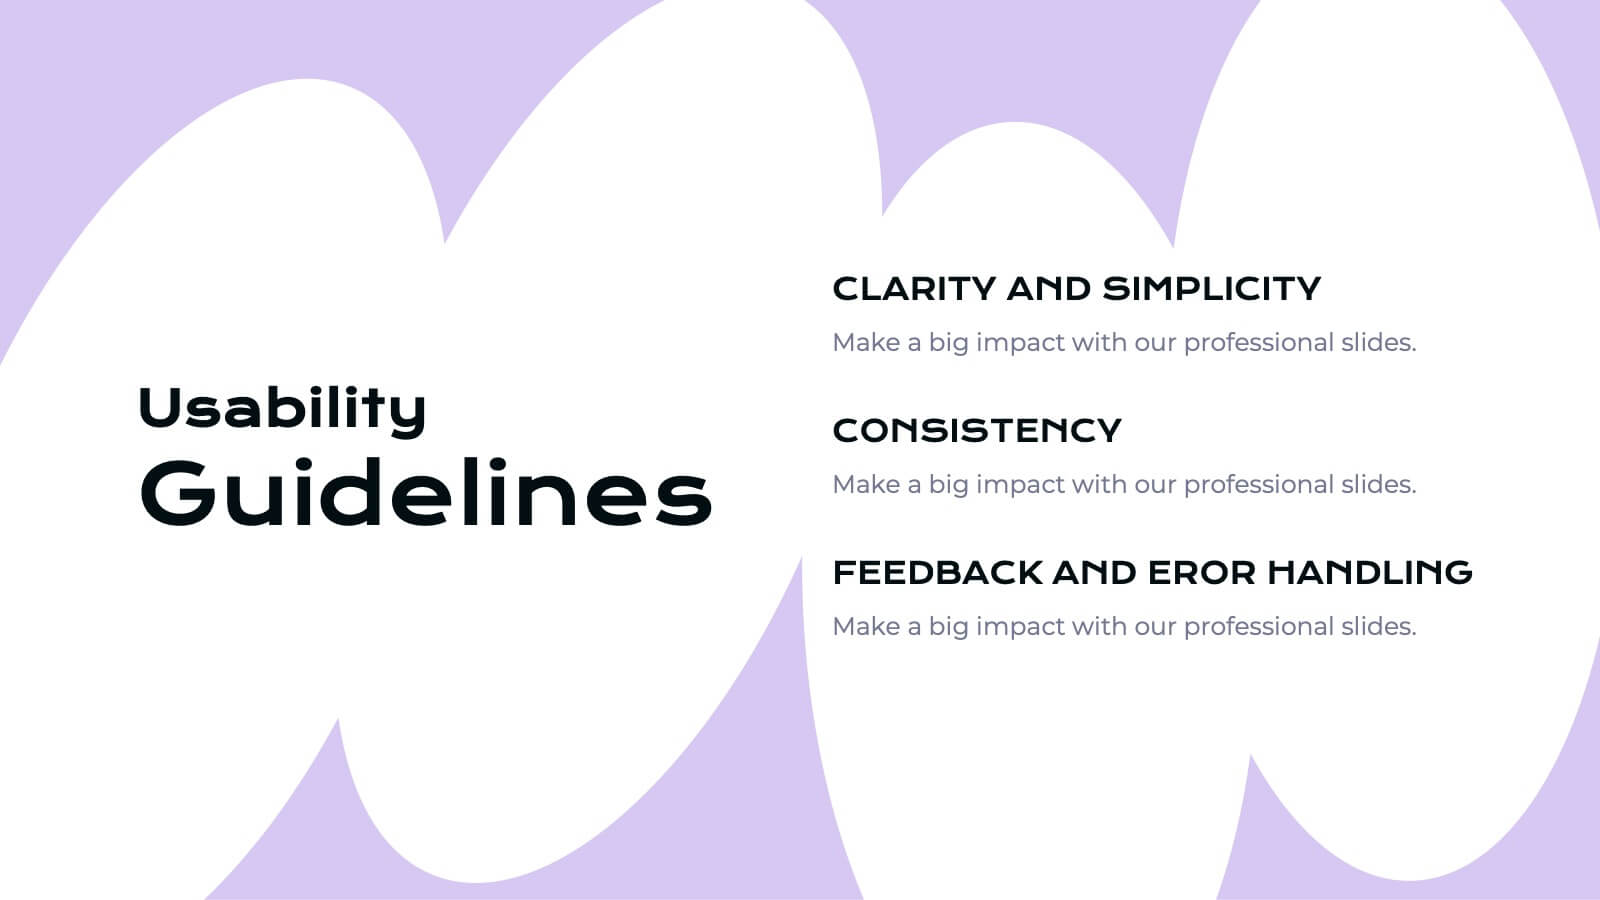
Ifrit User Experience Proposal Presentation
Unleash the power of great design with this fiery Ifrit-inspired presentation, perfect for delivering your user experience proposal! This template lets you showcase your UX strategies, research, and design process in a visually striking and well-organized format. Impress stakeholders with every slide. Compatible with PowerPoint, Keynote, and Google Slides.