


Características


¿Tienes alguna pregunta?
Recomendar


6 diapositivas
Corporate Vision and Mission Presentation
Present your company’s purpose with clarity using this Corporate Vision and Mission Presentation. Featuring modern visuals, bold typography, and image placeholders, this layout highlights your strategic goals effectively. Perfect for company profiles, startup decks, or internal briefings. Fully editable in PowerPoint, Keynote, and Google Slides for seamless customization.


8 diapositivas
Credit Card Comparison Presentation
The "Credit Card Comparison" presentation template visualizes the differences between credit and debit card options in a straightforward and engaging way. Featuring side-by-side comparisons, the template allows for easy insertion of key points such as fees, benefits, and suitability for different user profiles, making it an excellent tool for financial educators, advisors, and banking professionals. The template’s design ensures that the content is accessible and relatable, making complex financial concepts easier to grasp for the audience. This makes it ideal for presentations aimed at educating consumers about financial choices or for internal training within financial institutions.


4 diapositivas
Veterinary Services and Animal Care Presentation
Deliver professional insights with compassion using the Veterinary Services and Animal Care presentation. This slide features a clean, pet-centered illustration layout ideal for showcasing services such as treatment, grooming, preventive care, and boarding. Each section includes editable icons and placeholder text, making it easy to customize for veterinary clinics, pet hospitals, or animal wellness campaigns. Fully compatible with PowerPoint, Keynote, and Google Slides.


3 diapositivas
Strategic Planning and Business Model Presentation
Present your business roadmap with clarity using this Strategic Planning and Business Model slide. Featuring a modular grid layout, it allows you to break down initiatives, objectives, and action items into digestible segments. Perfect for business strategy sessions, planning workshops, or executive reports. Fully editable in PowerPoint, Canva, and Google Slides.


6 diapositivas
OKR Goal-Setting Framework
Clarify your goals and drive performance with this OKR-based layout that maps Objectives, Key Activities, and Results in a clear, actionable format. Ideal for teams, managers, and performance reviews. Each section is fully editable to match your organizational strategy. Compatible with PowerPoint, Keynote, and Google Slides.


5 diapositivas
Understanding Customer Needs with Empathy Map Presentation
Gain deeper customer insights with the Understanding Customer Needs with Empathy Map Presentation. This template simplifies user research by visually organizing customer thoughts, behaviors, and emotions into a clear layout. Perfect for UX teams, product designers, and marketers aiming to craft user-centric strategies. Fully editable in PowerPoint, Keynote, Canva, and Google Slides.


5 diapositivas
Organizational Management Frameworks Overview Presentation
Clarify reporting lines and decision-making roles with the Organizational Management Frameworks Overview Presentation. This clean and color-coded hierarchy chart helps visualize team structure, leadership levels, or departmental breakdowns. Ideal for organizational design, onboarding, or strategic alignment discussions, each placeholder is fully customizable to reflect your company’s framework. Compatible with PowerPoint, Keynote, and Google Slides—perfect for HR professionals, managers, and consultants seeking structure and clarity.


4 diapositivas
Minimal Company Profile Deck Presentation
Make a bold first impression with this sleek, minimal layout designed to showcase your company’s vision, services, and team with clarity and style. Perfect for startups or established brands, it balances professionalism and creativity effortlessly. Fully editable and compatible with PowerPoint, Keynote, and Google Slides for seamless customization.


26 diapositivas
Agile Project Management Presentation
Elevate your project management approach with our Agile Project Management presentation template. Compatible with PowerPoint, Keynote, and Google Slides, it's designed to adapt to any presentation environment effortlessly. Ideal for project managers, team leaders, and agile enthusiasts, this template is engineered to illustrate the flexibility and efficiency of agile methodologies in project execution. Our Agile Project Management template is a powerful tool for demonstrating the benefits of agile processes, including increased adaptability, improved stakeholder engagement, and enhanced product quality. With a series of well-organized slides, it guides you through the agile journey, from project inception to completion. The template offers a diverse range of slides that cover all facets of agile project management, including sprint planning, daily stand-ups, and retrospectives. This template is not just visually appealing but also rich in content, providing ample space to detail out roles, responsibilities, and timelines. It ensures that your team and stakeholders are aligned with the project goals, making complex information accessible and understandable. Unlock the potential of your projects with this SEO-optimized template, and become the go-to source for agile project management strategies.


5 diapositivas
Hierarchical Pyramid Diagram Presentation
The "Hierarchical Pyramid Diagram Presentation" template is designed to effectively represent organizational structures, data hierarchies, or step-by-step processes. This versatile template features a layered pyramid structure, enabling clear visualization of relationships and dependencies between different levels or components within a system. Ideal for business presentations, strategy discussions, and educational materials, this template aids in conveying complex information in a straightforward and visually appealing manner. The use of distinct colors for each level enhances readability, making it easier to identify and discuss each segment in detail during presentations.


5 diapositivas
Digital Marketing Plan Presentation
Build momentum for your online strategy with a clean, structured layout that turns complex ideas into clear, stackable steps. This presentation helps outline goals, channels, and campaign actions in a visual flow that’s easy to follow and adapt. Fully customizable for PowerPoint, Keynote, and Google Slides.


5 diapositivas
Poaching Effects Infographics
Navigate the critical issue of wildlife endangerment with our poaching effects infographics. Crafted in earthy tones of brown and tan, this informative and creatively styled vertical template sheds light on the harsh realities of illegal wildlife hunting. Whether you're an environmental activist, an educator, or part of an ecological research team, this infographic is structured to resonate with your audience, offering compelling visuals and thematic icons that starkly represent the consequences of poaching. It's more than a presentation; it's a call to global action, crucial for anyone advocating for wildlife preservation and aiming to inspire change through storytelling.


6 diapositivas
Mental Health Infographics
The "Mental Health" infographic template, suitable for PowerPoint, Keynote, and Google Slides, is an essential resource for healthcare professionals, educators, and mental health advocates. This sensitive and informative template is designed to communicate important aspects of mental health in a compassionate and accessible manner. This template covers critical topics such as mental health awareness, coping strategies, and support resources. It is structured to facilitate discussions on mental well-being, making it an invaluable tool for educational presentations, awareness campaigns, and support group discussions. Featuring a calming and empathetic design, the template uses a soothing color scheme with pastel shades of light blue, green, and lavender. This creates a serene and understanding atmosphere that is supportive of mental health topics. Whether used in a clinical setting, classroom, or community workshop, this template ensures that information about mental health is presented in a sensitive, informative, and visually appealing way.


7 diapositivas
Creative Tables Of Content Infographic
A creative table of contents is a visually appealing and innovative way of presenting the structure and contents of a document, report, book, or any written work. Our infographic template is an aesthetically pleasing and insightful map to your content landscape. This infographic is not just a guide; it's a visually engaging journey through your ideas and topics, promising a delightful and organized user experience. Fully customizable and compatible with Powerpoint, Keynote, and Google Slides. This creative table of contents uses design elements, colors, typography, and graphics to make it engaging and eye-catching.


19 diapositivas
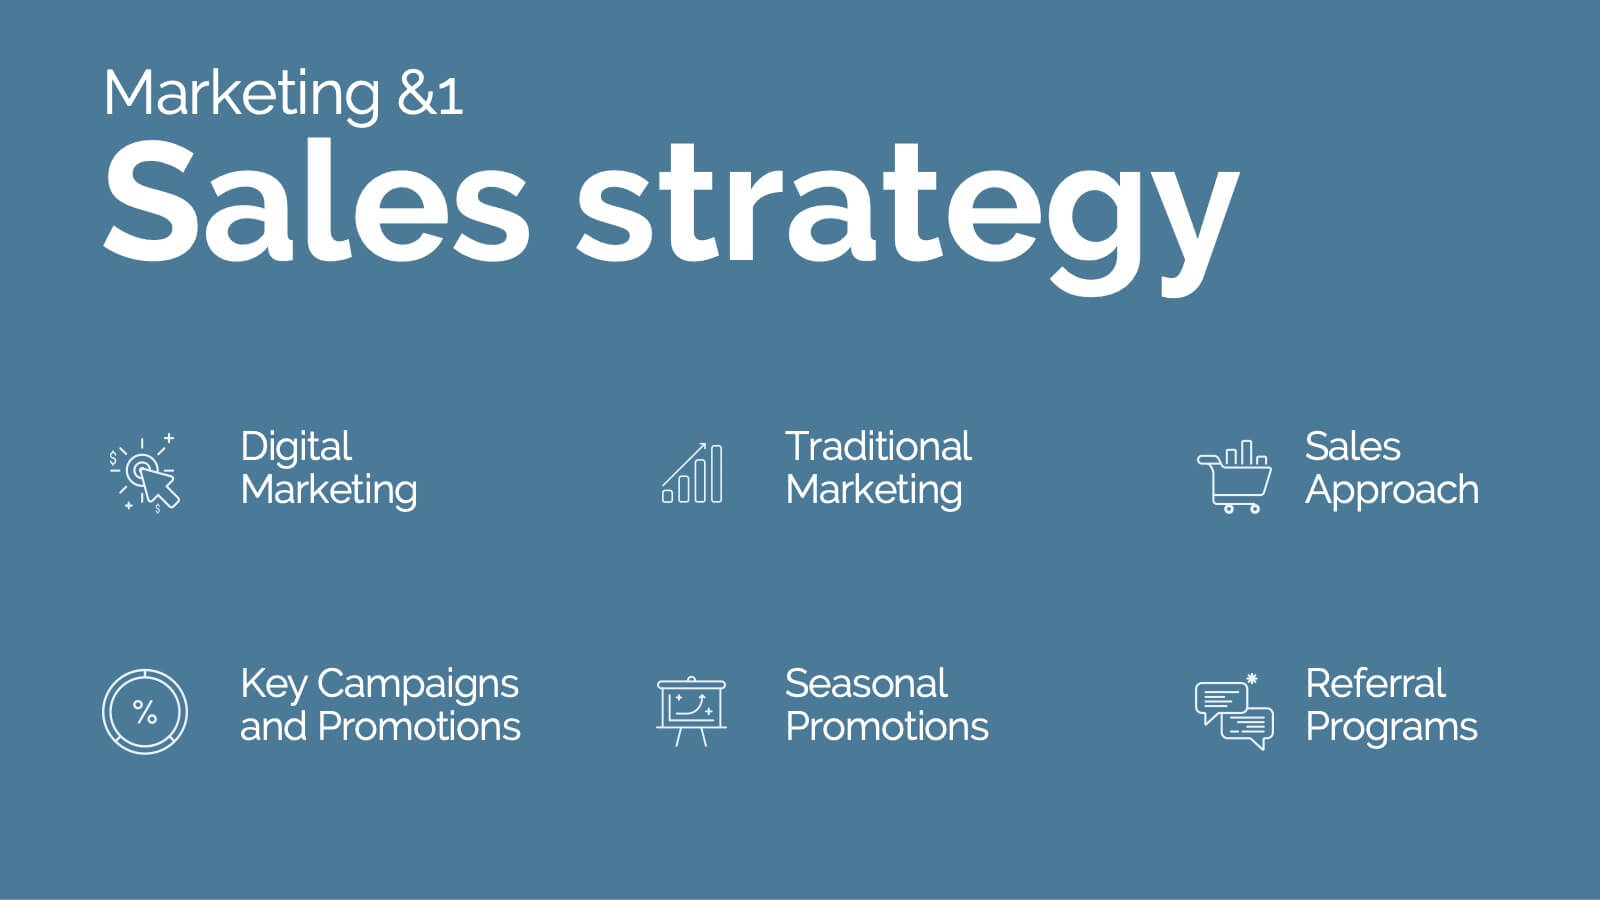
Kinetic Sales Forecast Presentation
Forecast your sales with style using this vibrant template! Perfect for detailing company overview, sales process, team, and strategy. Includes sections for case studies, pricing, and future opportunities. Ideal for sales teams to impress stakeholders. Compatible with PowerPoint, Keynote, and Google Slides.


20 diapositivas
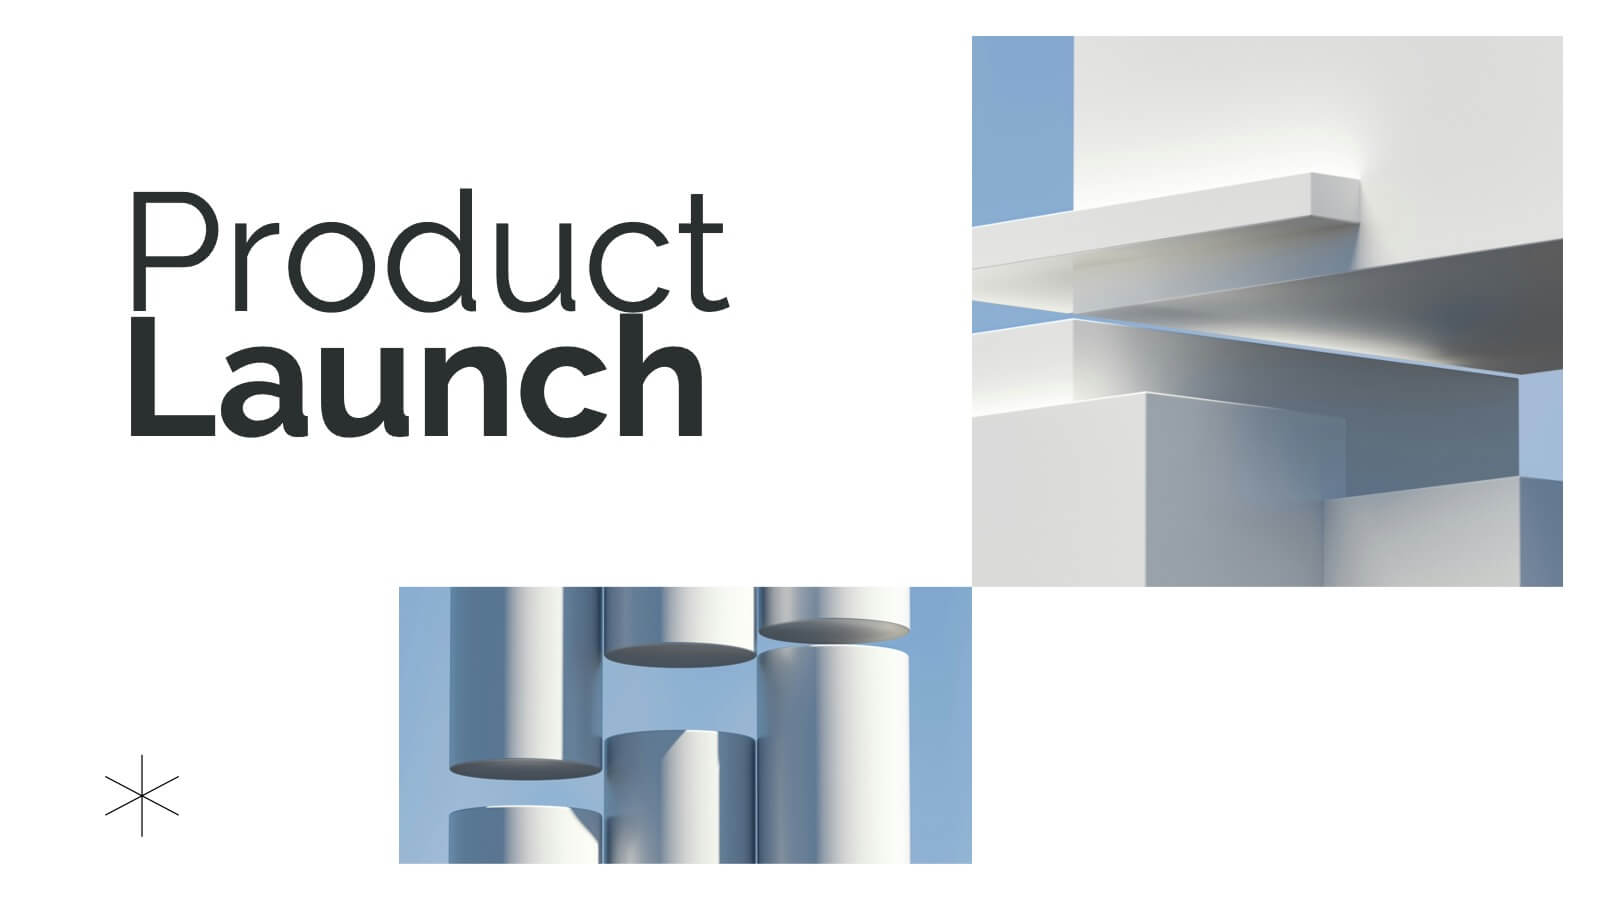
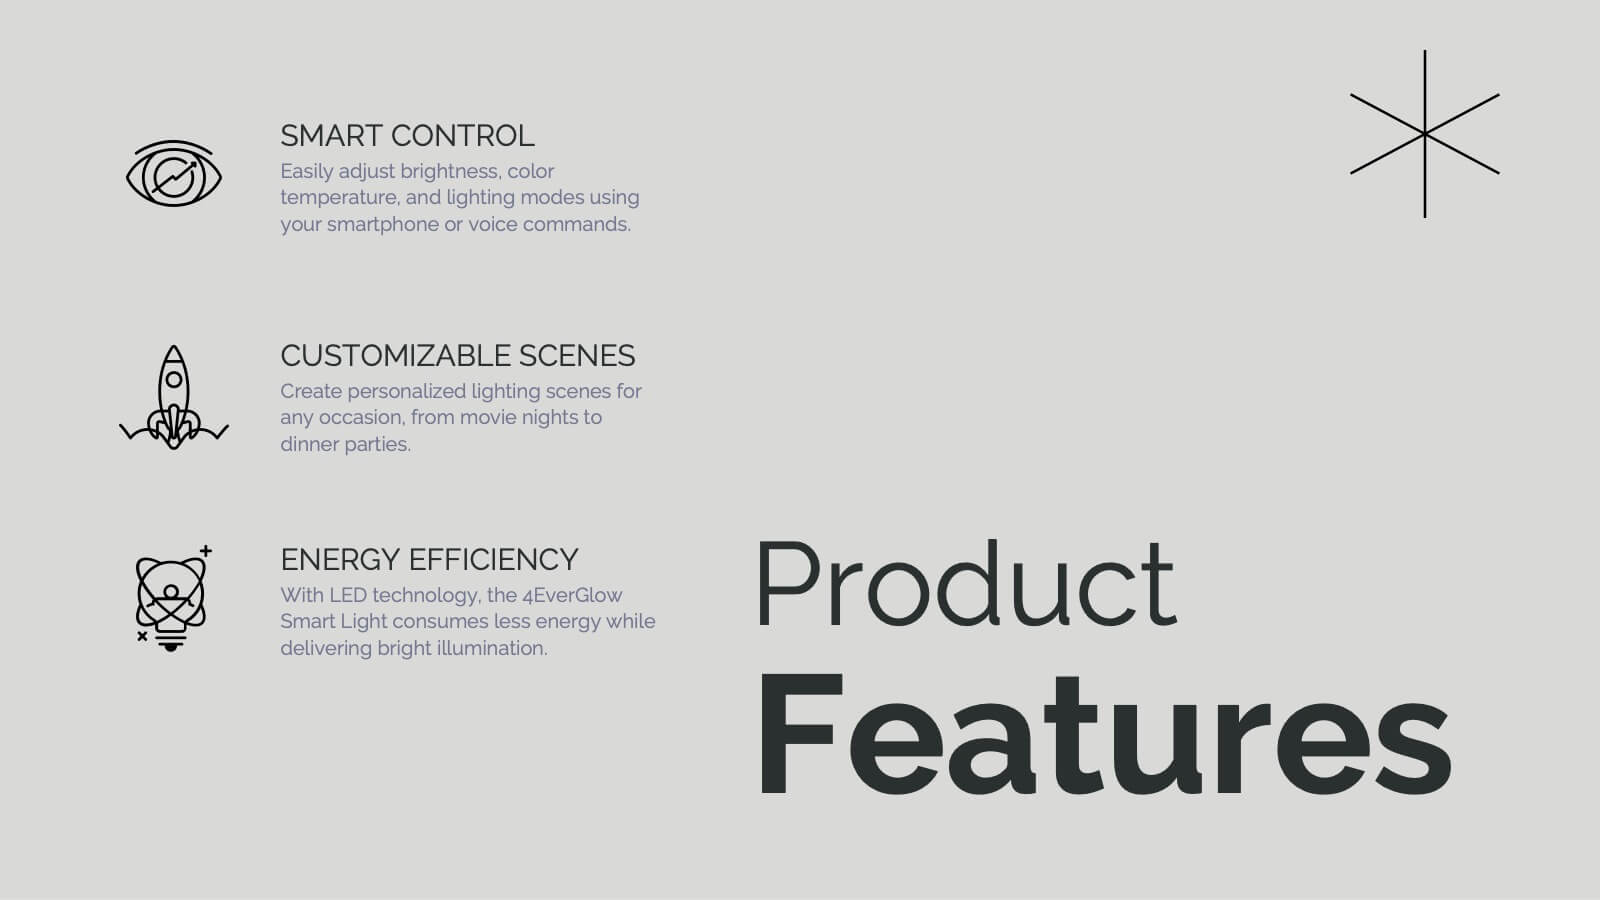
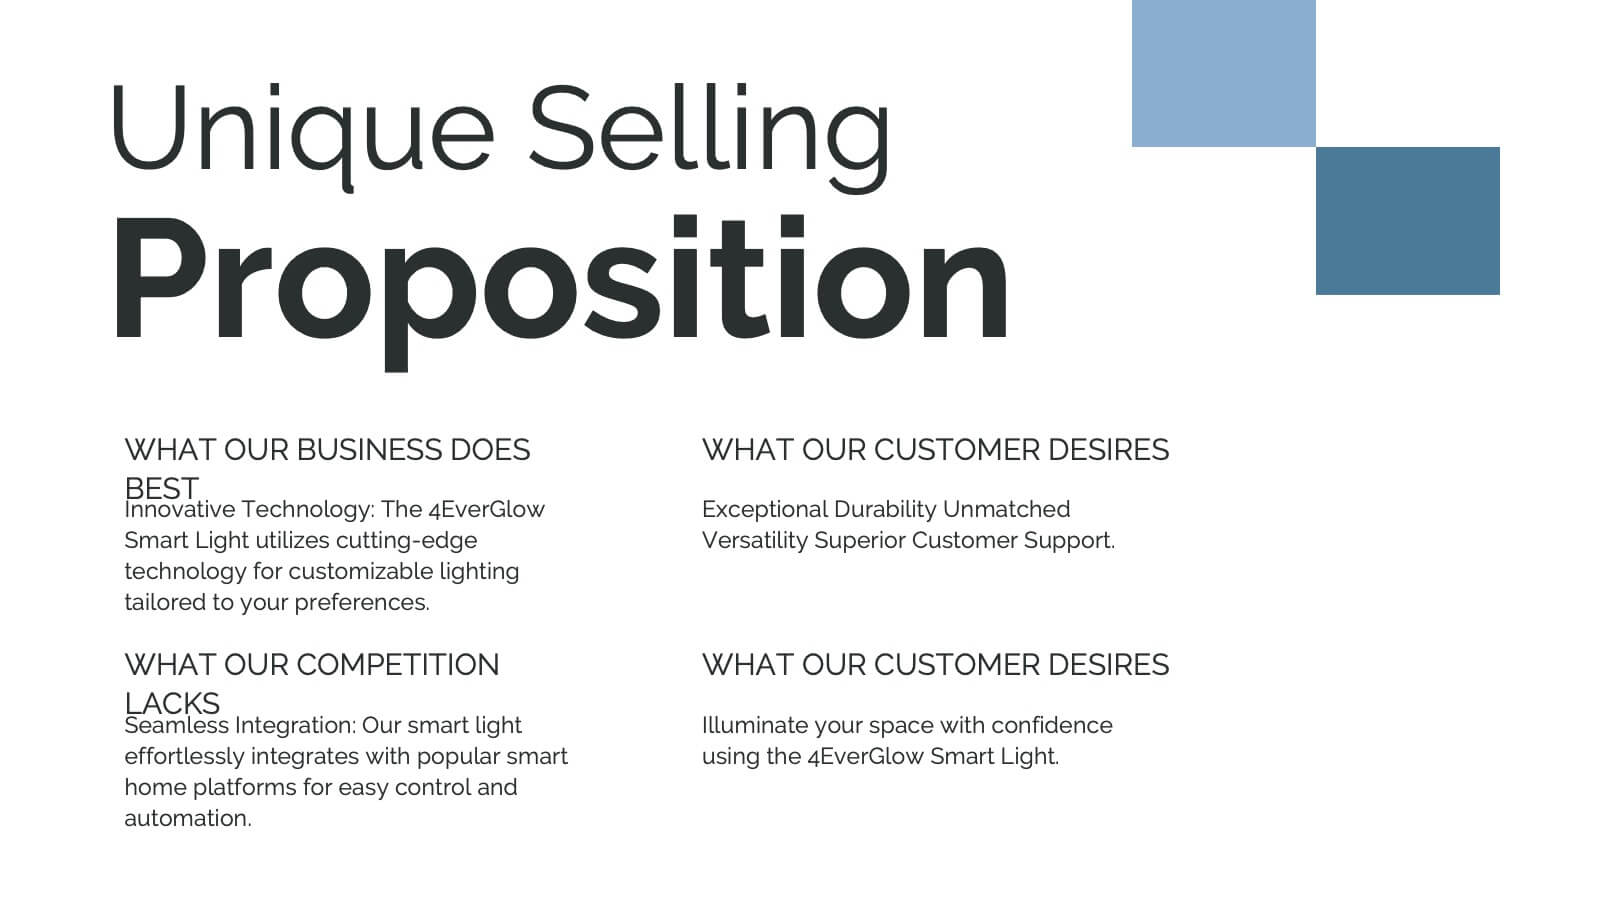
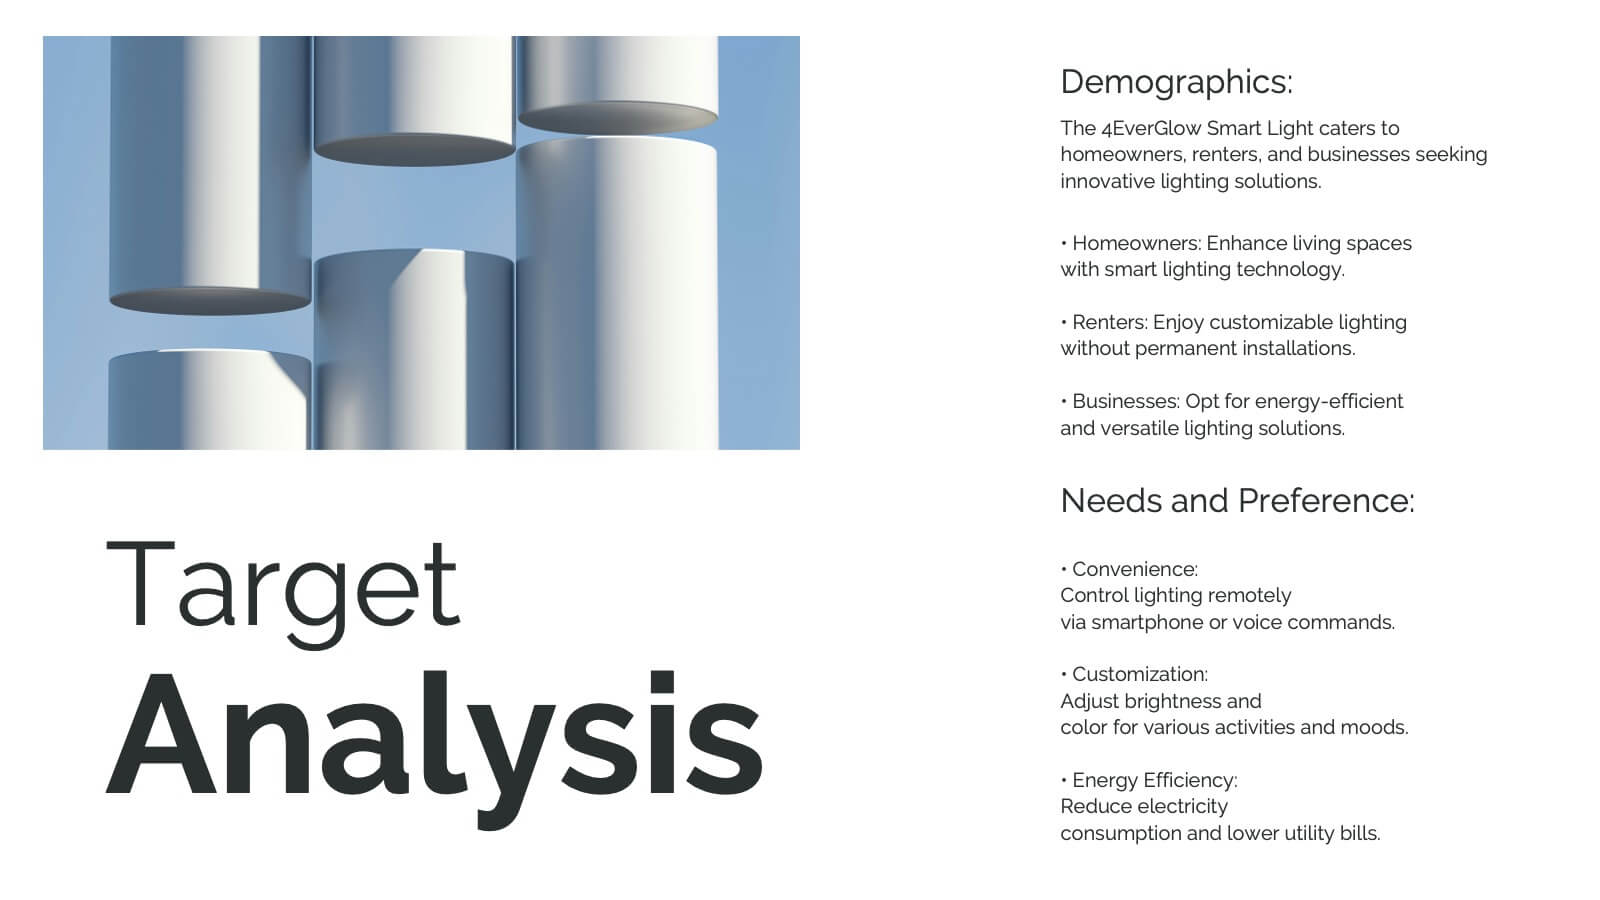
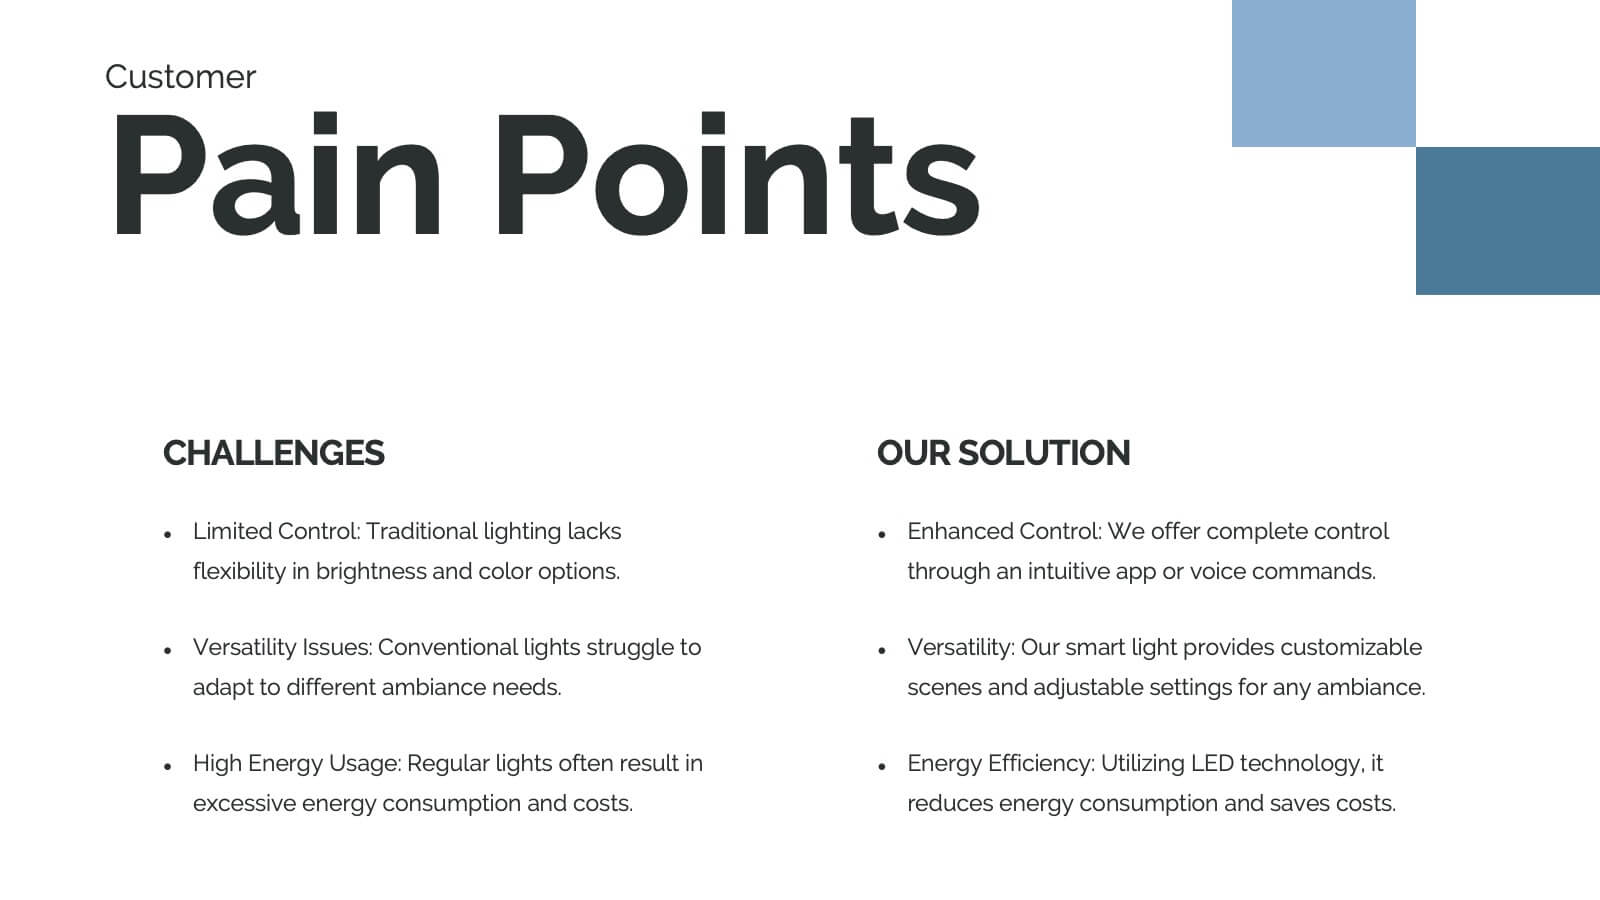
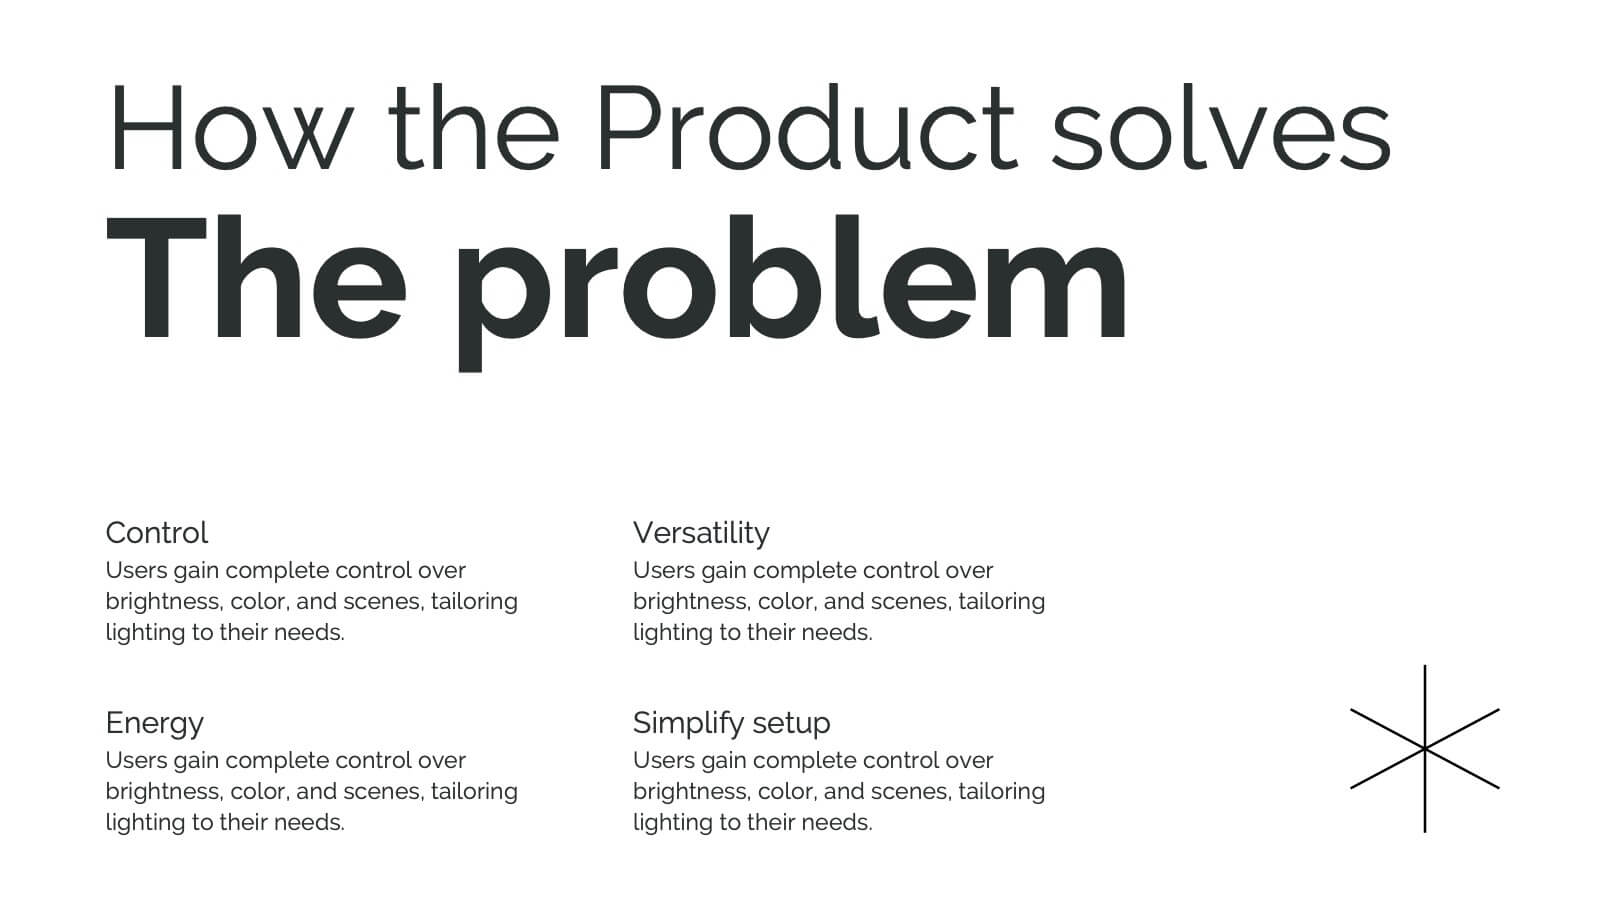
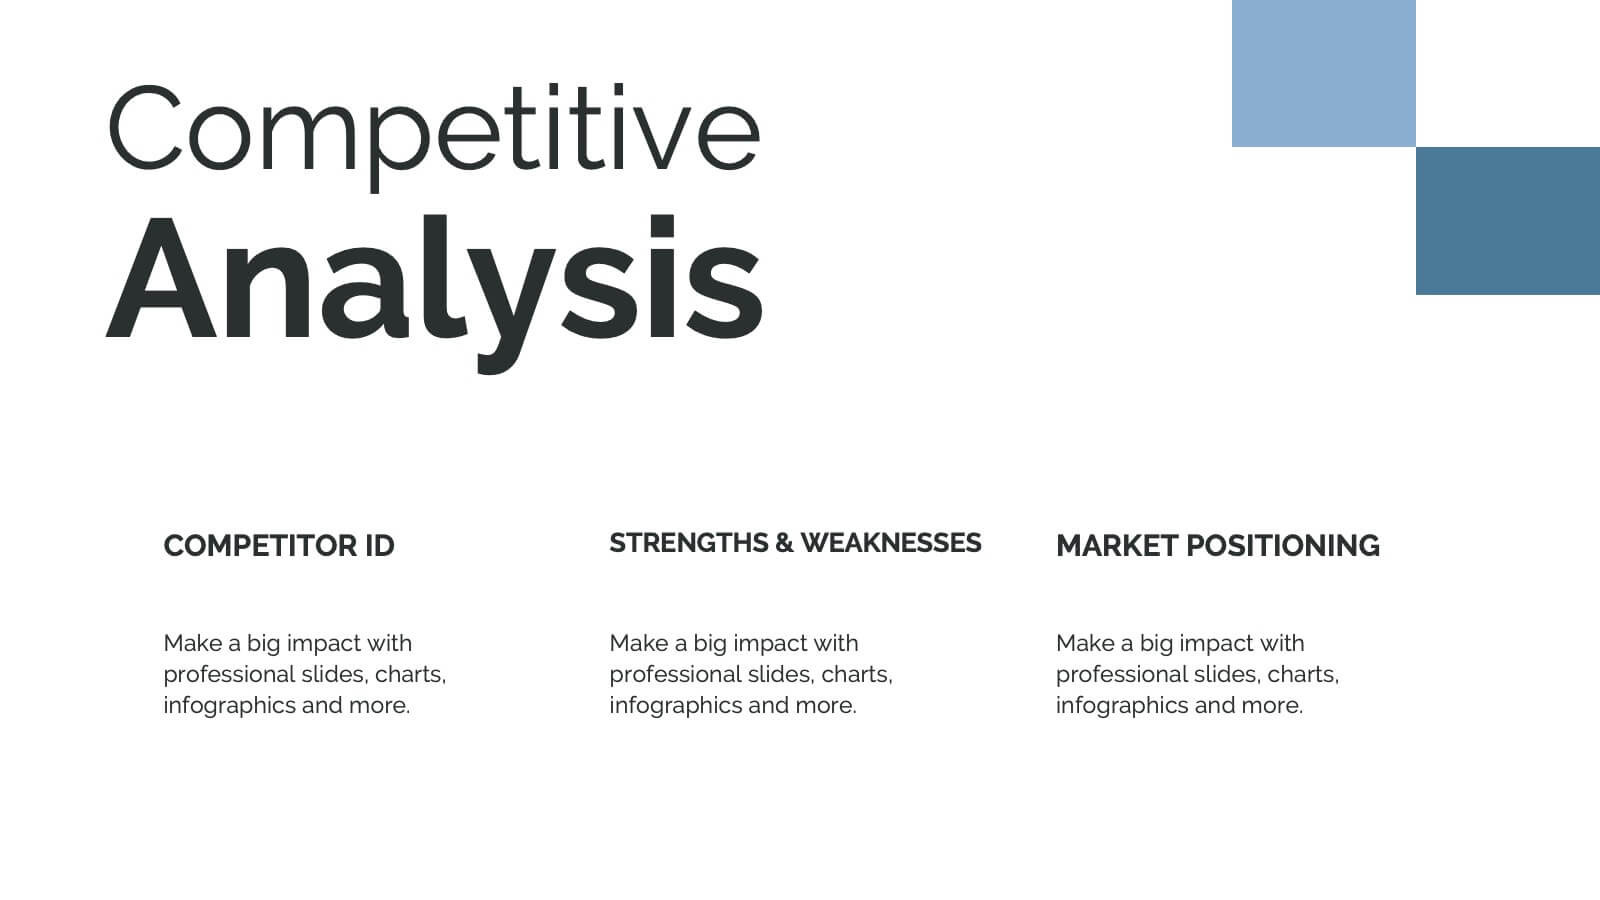
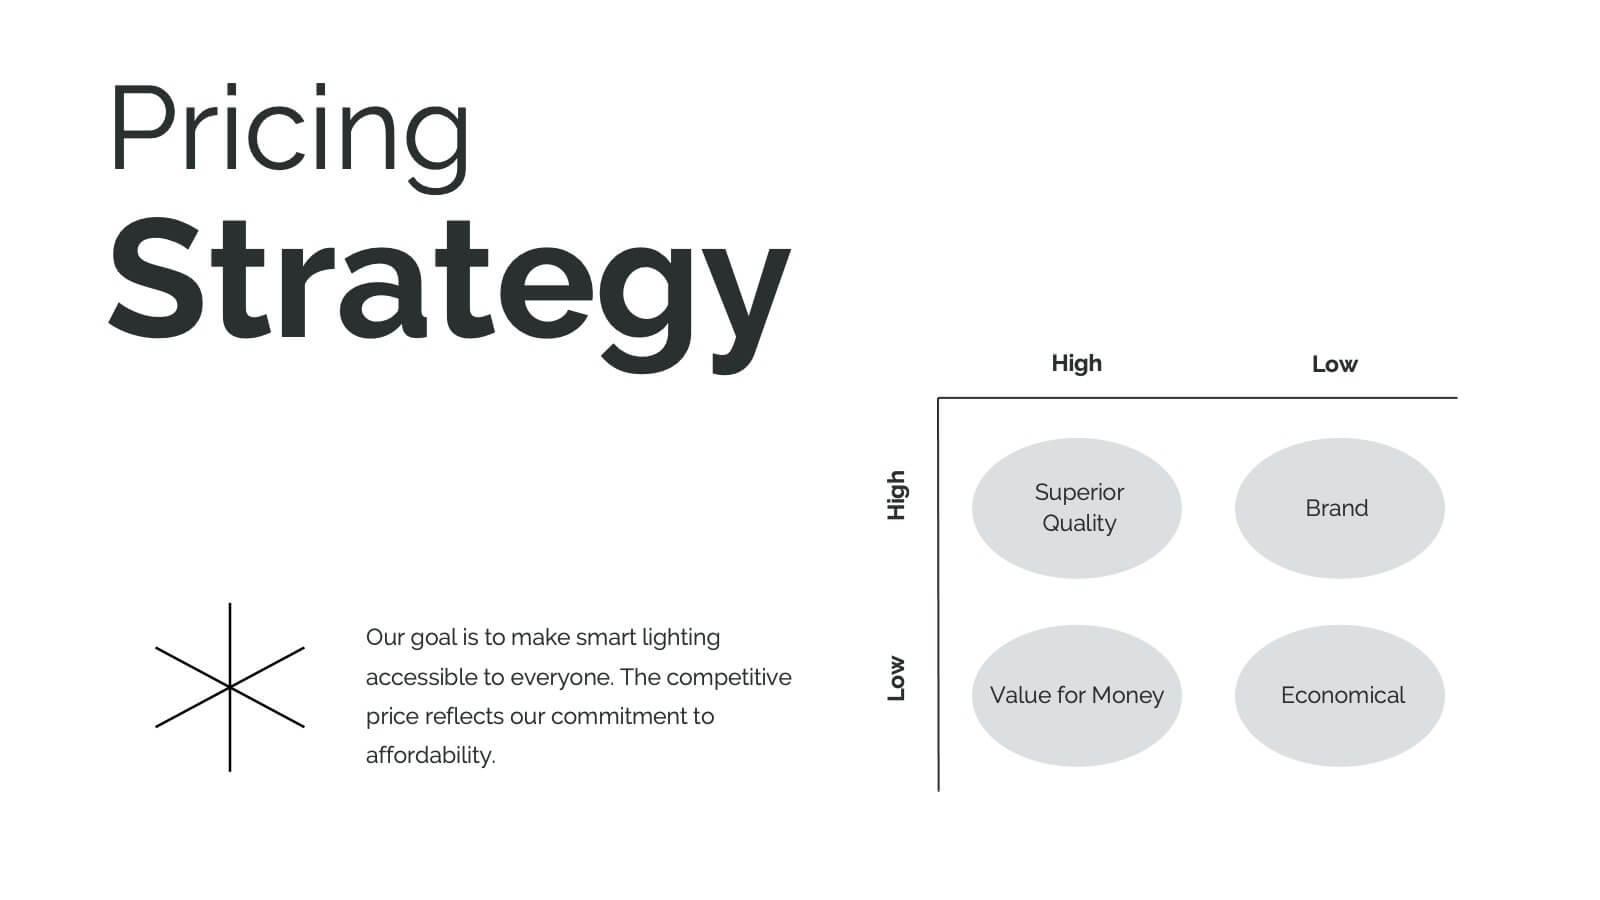
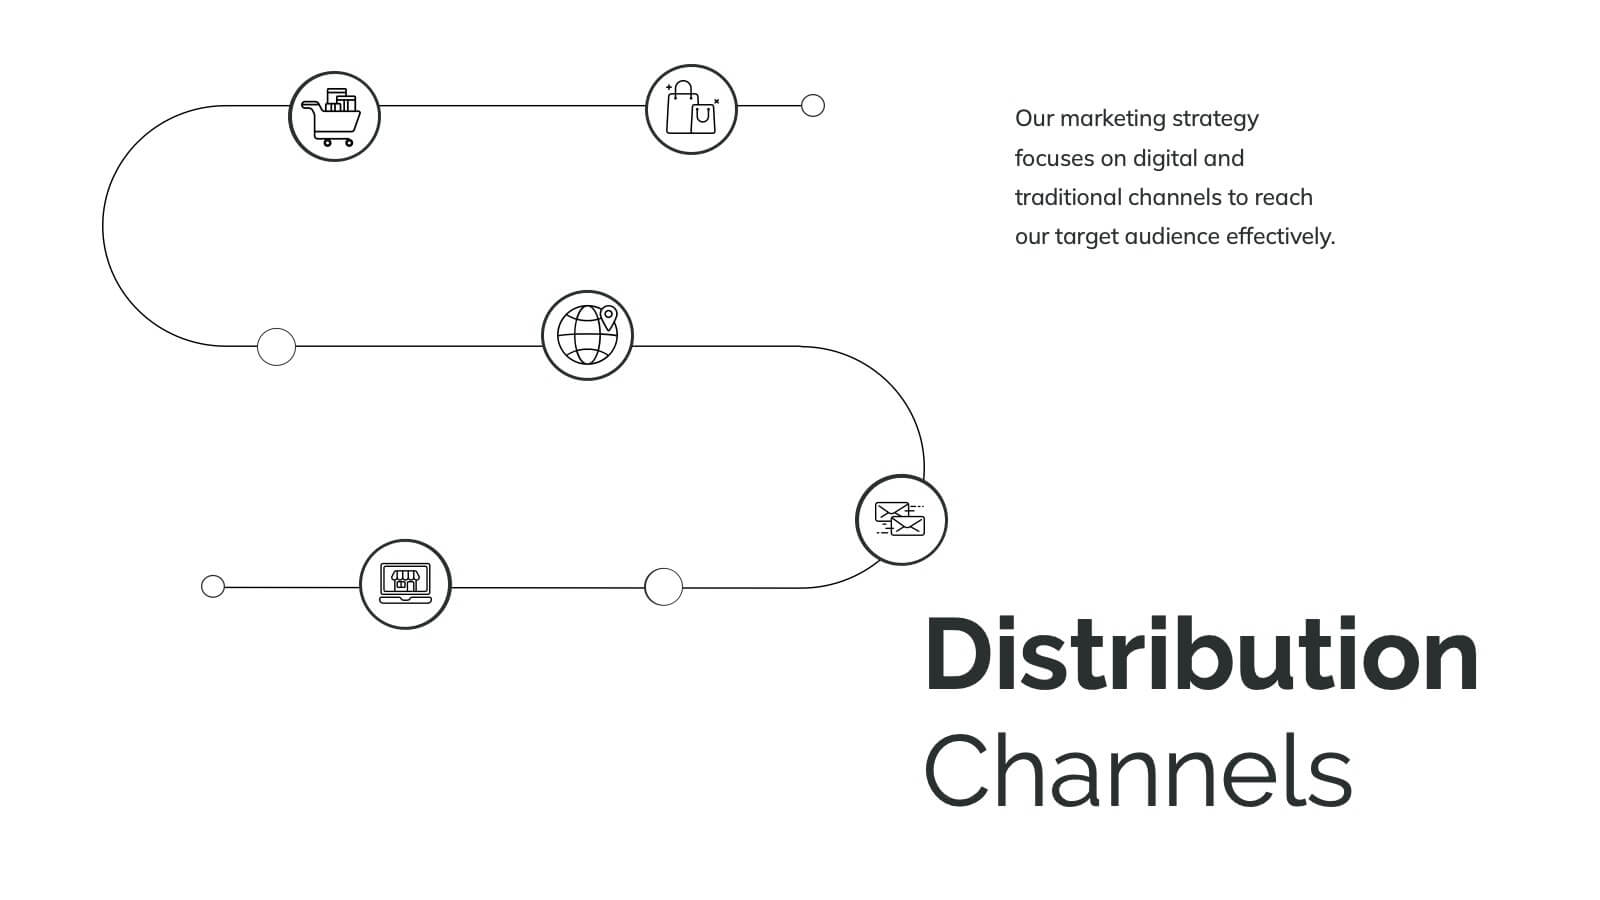
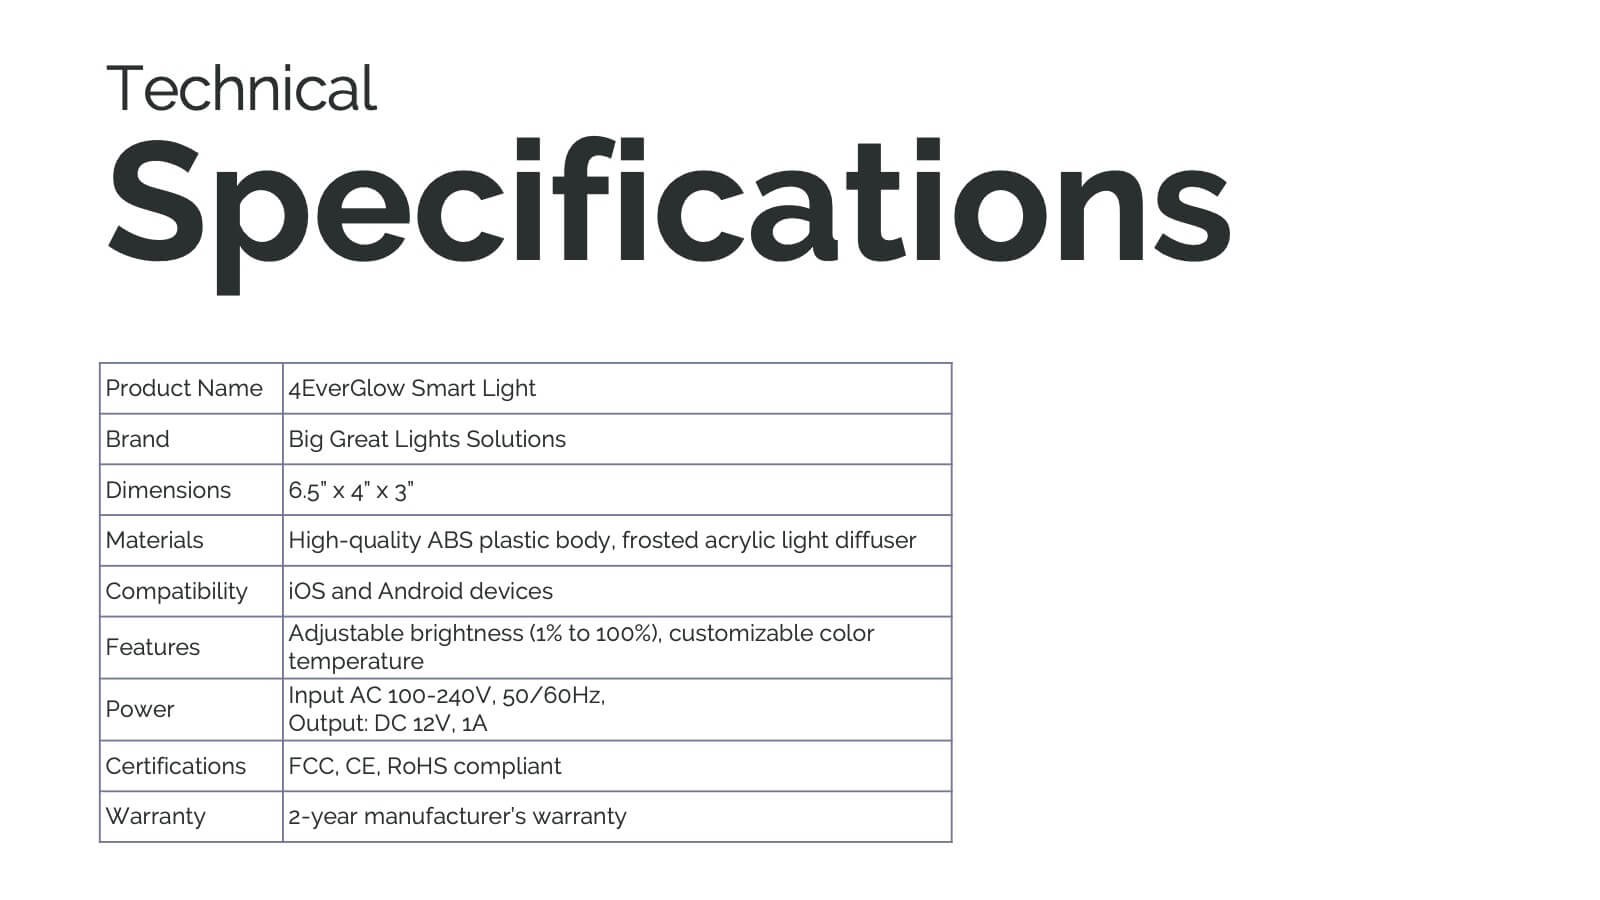
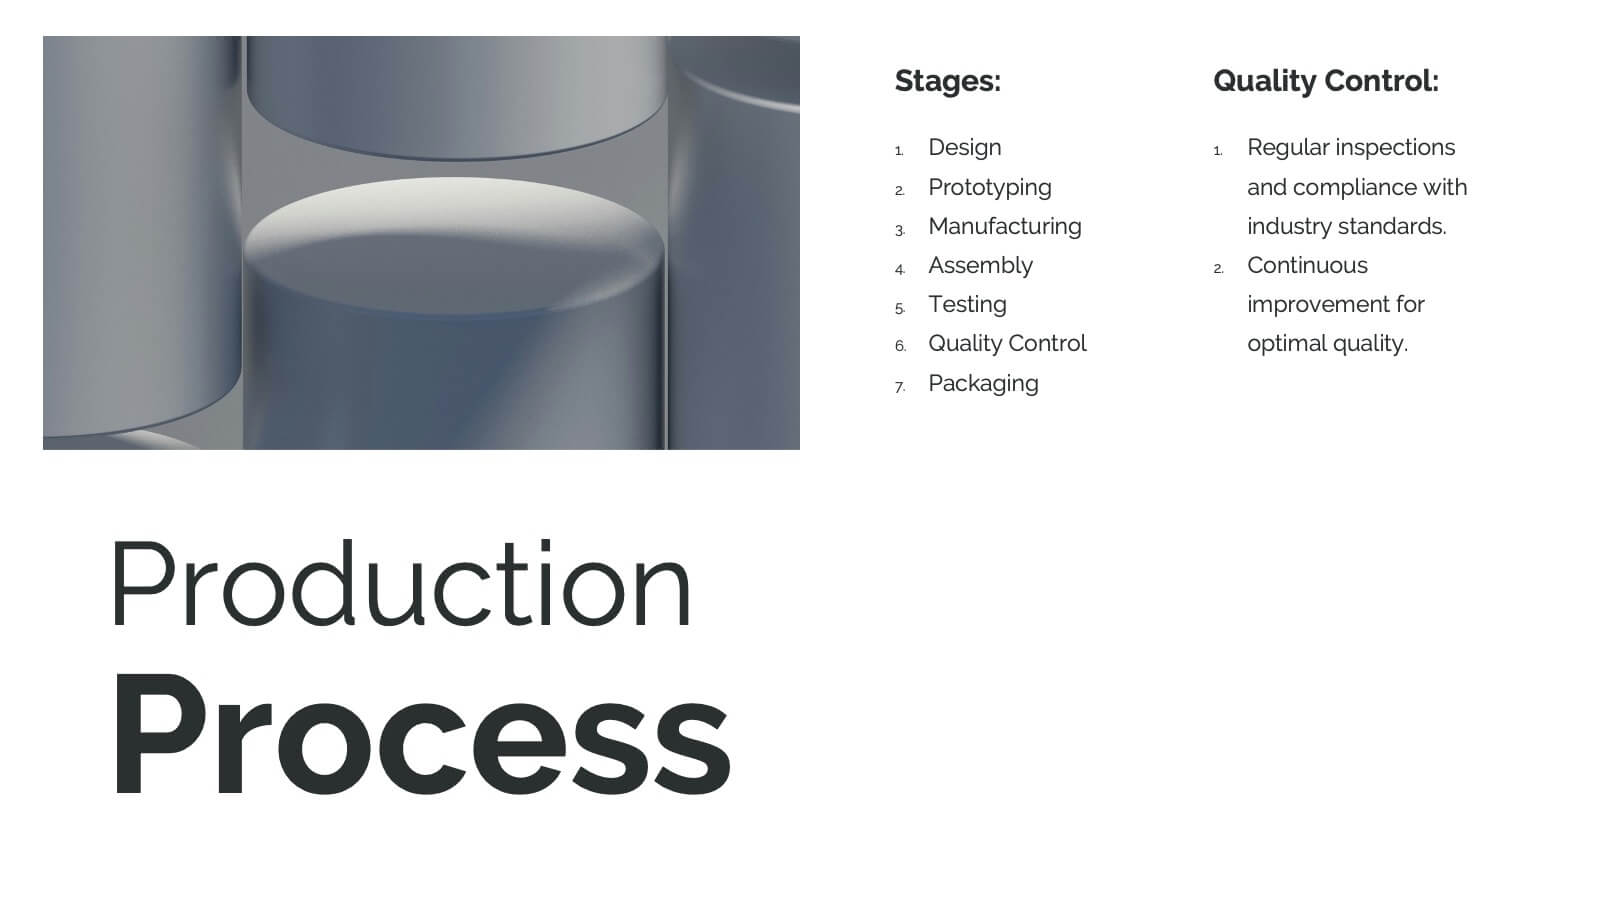
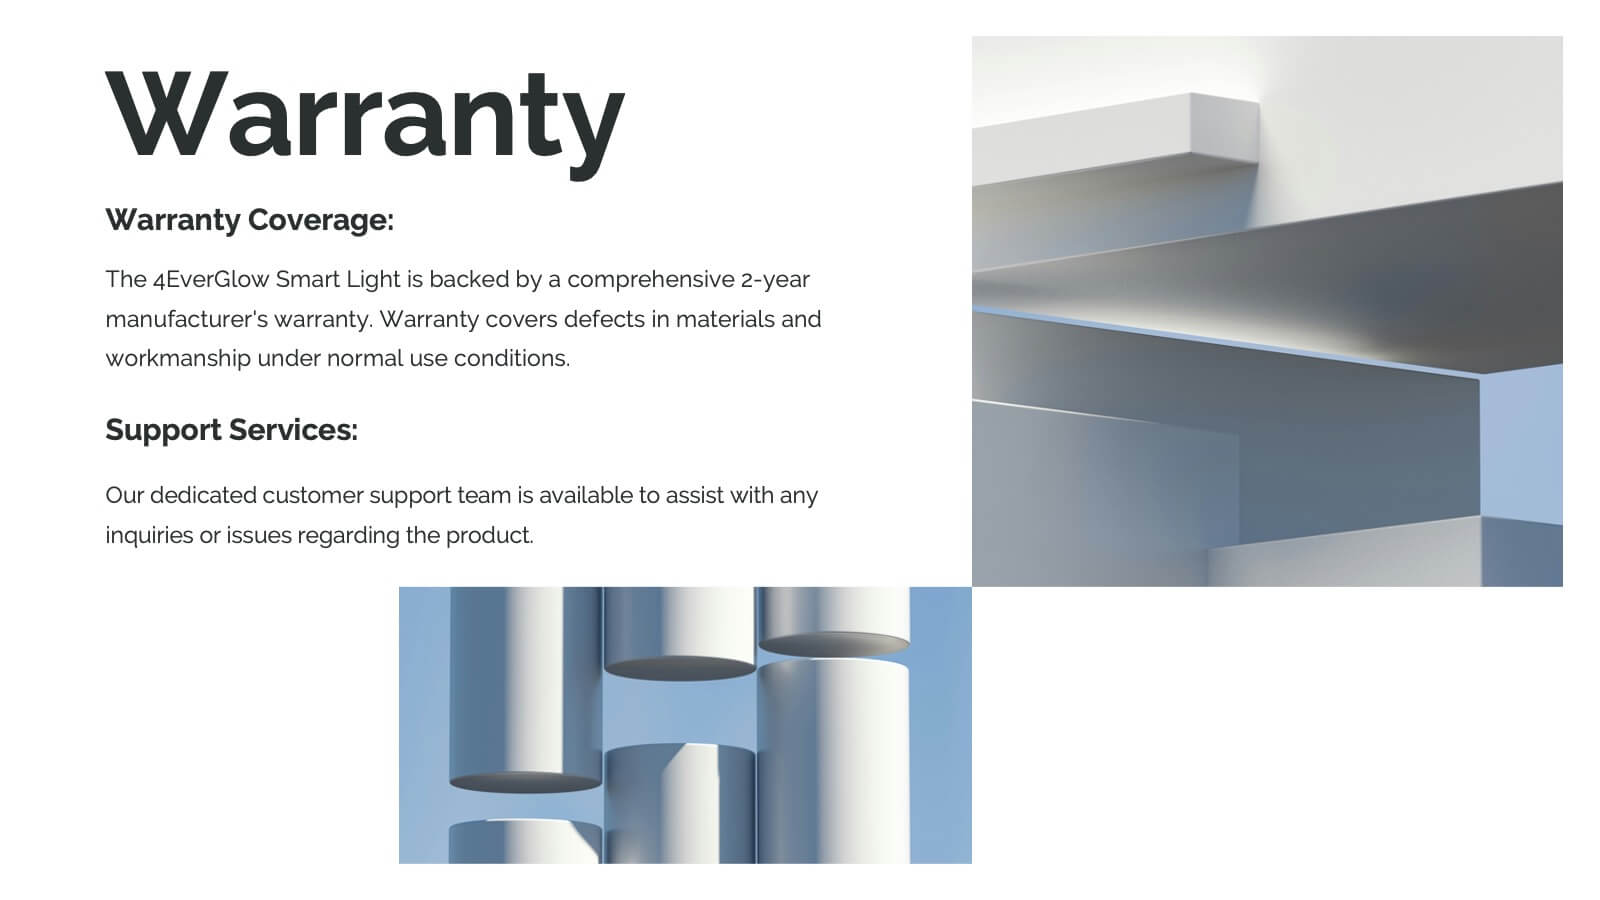
Hydra Product Launch Presentation
Unveiling your latest product has never been easier or more captivating! This comprehensive presentation template covers every aspect of your product's journey—from launch to competitive analysis. Engage your audience with detailed slides on features, target analysis, and pricing strategy. Seamlessly compatible with PowerPoint, Keynote, and Google Slides for maximum flexibility and impact.


6 diapositivas
Business Calendar and Monthly Overview Presentation
Bring structure to your chaos with a bold and colorful visual planner! This easy-to-use layout helps track tasks, deadlines, or projects across multiple months in one glance. Ideal for team coordination or solo planning. Fully editable and compatible with PowerPoint, Keynote, and Google Slides for seamless calendar-based presentations.