


Características


¿Tienes alguna pregunta?
Recomendar


4 diapositivas
HR Management Strategy Presentation
An engaging, structured design that turns complex planning into a clear, visual story. This presentation guides audiences through essential strategic steps, helping teams understand goals, processes, and people-centered initiatives with ease. Clean icons and modern layouts keep every point focused and professional. Fully compatible with PowerPoint, Keynote, and Google Slides.


5 diapositivas
Human Capital Planning Overview Presentation
Streamline workforce strategies with the Human Capital Planning Overview Presentation. This structured template helps visualize talent development, succession planning, and HR workflows in clear, step-by-step layouts. Perfect for HR leaders, consultants, and executives. Fully editable in PowerPoint, Keynote, and Google Slides for seamless customization to match your team or organization.


4 diapositivas
Service Plan Pricing Matrix Presentation
Present your pricing options clearly with this Service Plan Pricing Matrix Presentation. Designed for easy comparison, this layout highlights four tiers—Basic, Standard, Professional, and Expert—with bold pricing, checklists, and CTA buttons. Ideal for service providers, SaaS, and agencies. Fully editable in Canva, PowerPoint, Keynote, and Google Slides.


4 diapositivas
Editable Cause and Effect Diagram Presentation
Bring clarity to every insight with a bold visual layout that makes connections between actions and outcomes easy to follow. This presentation helps you explain root causes, outline impacts, and guide decision-making with clean, structured graphics. Ideal for reports, planning, and analysis. Fully compatible with PowerPoint, Keynote, and Google Slides.


24 diapositivas
Minerva UX Design Presentation
Elevate your UX design presentations with this comprehensive template, featuring sections for project overview, user research, wireframes, prototyping, and usability testing. Showcase design systems, branding guidelines, and accessibility considerations with ease. Perfect for demonstrating a user-centered approach. Compatible with PowerPoint, Keynote, and Google Slides for seamless customization.


7 diapositivas
Short Term Goals Infographic Presentation
Short-term Goals are important because they provide a clear focus and direction for individuals or organizations to achieve their long-term objectives. Get started on your goals in no time with this template. It is professional, clean and has everything you need to create a presentation. It's a good choice for career advancement and pitches. This template is designed to help your audience visualize the impact of your goals. Use this template as a base to brainstorm your vision and objectives with your team. The goal-oriented design will bring awareness and create excitement about your goals.


5 diapositivas
Strategic Blue Ocean Shift Presentation
Dive into bold new thinking with a slide that makes strategic transformation feel clear, focused, and actionable. This presentation breaks down key decisions that help teams shift from competitive pressure to value innovation, making complex choices easy to visualize and present. Fully compatible with PowerPoint, Keynote, and Google Slides.


6 diapositivas
Data Table Format Presentation
Bring clarity to your data with a clean, modern layout that helps your audience compare details at a glance. This presentation is perfect for pricing, feature breakdowns, or structured business insights, keeping information organized and easy to read. Fully compatible with PowerPoint, Keynote, and Google Slides.


10 diapositivas
Risk Evaluation and Control Measures Presentation
Showcase your strategy for minimizing business risks with the Risk Evaluation and Control Measures Presentation. This upward arrow layout helps illustrate progressive risk management stages—from identification to control. Ideal for business continuity plans, audits, and compliance reporting. Fully customizable in Canva, PowerPoint, Keynote, and Google Slides.


21 diapositivas
Shadowrise Product Roadmap Presentation
Plan and present your product journey effectively with this detailed roadmap presentation! It covers key areas like market analysis, product features, use cases, pricing strategies, and distribution channels, ensuring a clear path to success. Perfect for product teams, stakeholders, or investor meetings, this template is fully compatible with PowerPoint, Keynote, and Google Slides.


8 diapositivas
Three Phase 30-60-90 Strategy Presentation
Give your roadmap a dynamic, flowing rhythm with a clean three-phase layout that makes each milestone feel clear, actionable, and easy to present. This presentation helps you outline priorities, track progress, and communicate strategic goals with confidence and simplicity. Fully editable and compatible with PowerPoint, Keynote, and Google Slides.


6 diapositivas
Modern Treatment Plans in Medicine Presentation
Highlight six key elements of your healthcare strategy with the Modern Treatment Plans in Medicine Presentation. This clean, grid-style layout uses pill-shaped icons and vibrant colors to present treatments, initiatives, or categories. Ideal for breaking down complex medical plans. Fully customizable in Canva, PowerPoint, Keynote, and Google Slides.


8 diapositivas
Geographic South America Template Presentation
Explore your data through a clean, professional map that highlights key insights and regional details across South America. Ideal for presenting demographics, business distribution, or performance metrics, this design combines clarity with impact. Fully compatible with PowerPoint, Keynote, and Google Slides for easy editing and seamless presentation.


5 diapositivas
Management Framework Structure Presentation
Bring your ideas to life with a dynamic slide that maps out clear stages of leadership, planning, and execution. This layout helps you break down complex management structures into simple, visual steps that any audience can follow. Fully editable and easy to customize in PowerPoint, Keynote, and Google Slides.


5 diapositivas
Transportation Industry Market Trends Presentation
Visualize industry shifts and delivery dynamics with this road-themed presentation layout. Featuring a stylized highway path and moving vehicle graphic, this template helps you break down four key market trends in a clear, visual progression. Each stop on the route includes editable icons and text blocks for streamlined storytelling. Perfect for logistics analysts, transportation planners, and consultants. Fully customizable in PowerPoint, Keynote, and Google Slides.


6 diapositivas
Root Cause Investigation Framework Presentation
Uncover the "why" behind your challenges with the Root Cause Investigation Framework Presentation. Designed around the classic fishbone (Ishikawa) diagram, this slide helps teams visually identify and organize contributing factors across multiple categories. With editable sections and bold color coding, it’s ideal for quality management, Six Sigma, and process improvement. Compatible with PowerPoint, Keynote, and Google Slides.


22 diapositivas
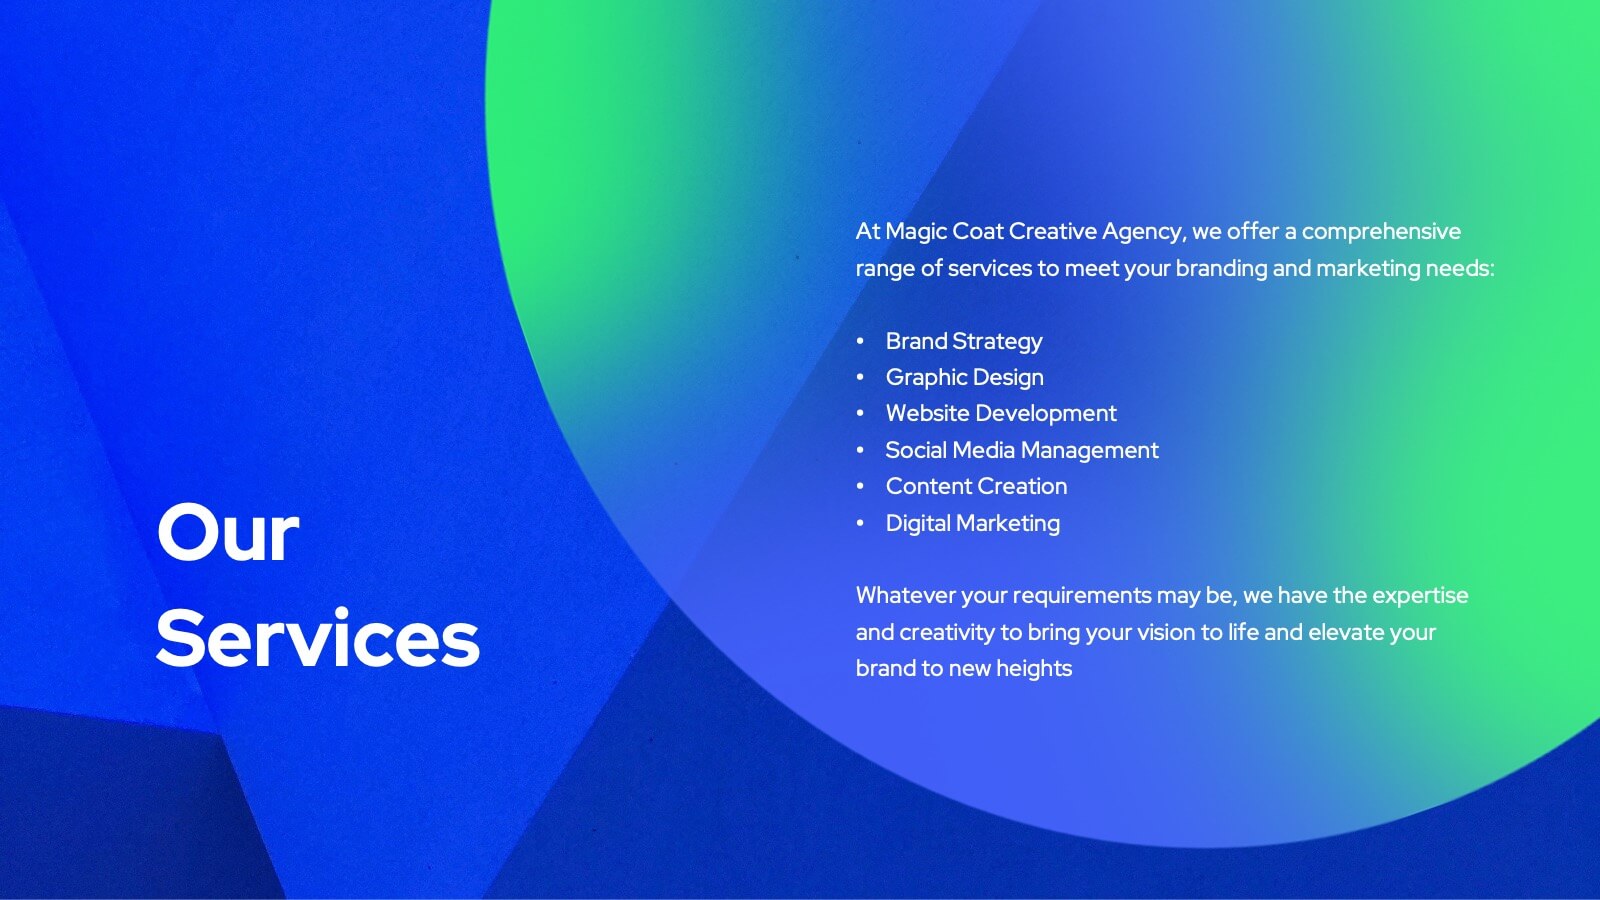
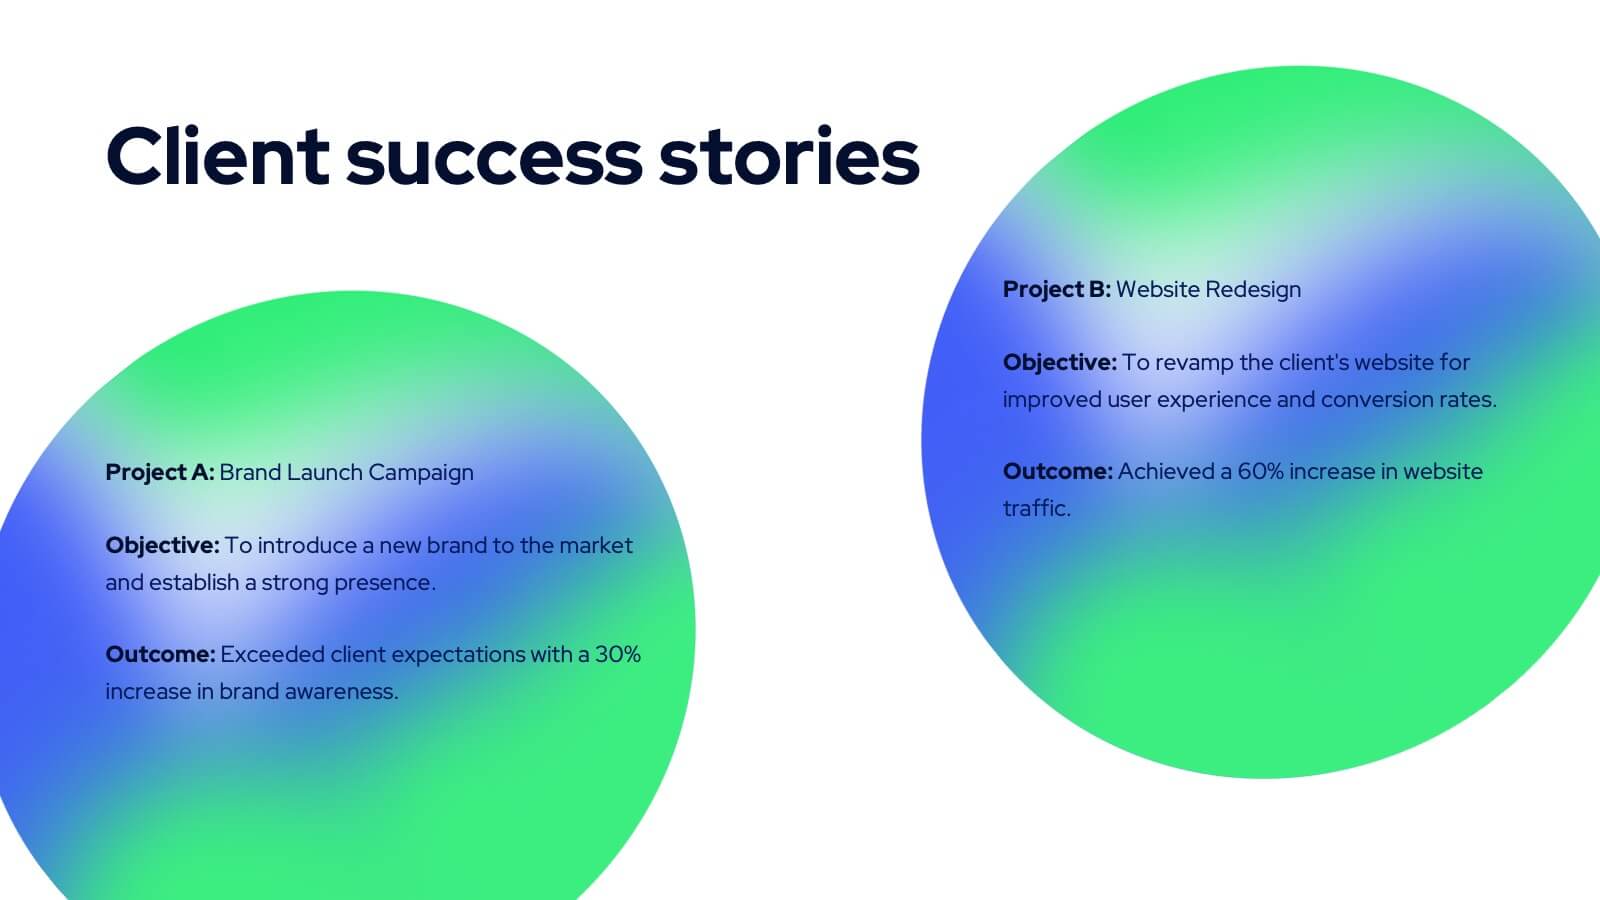
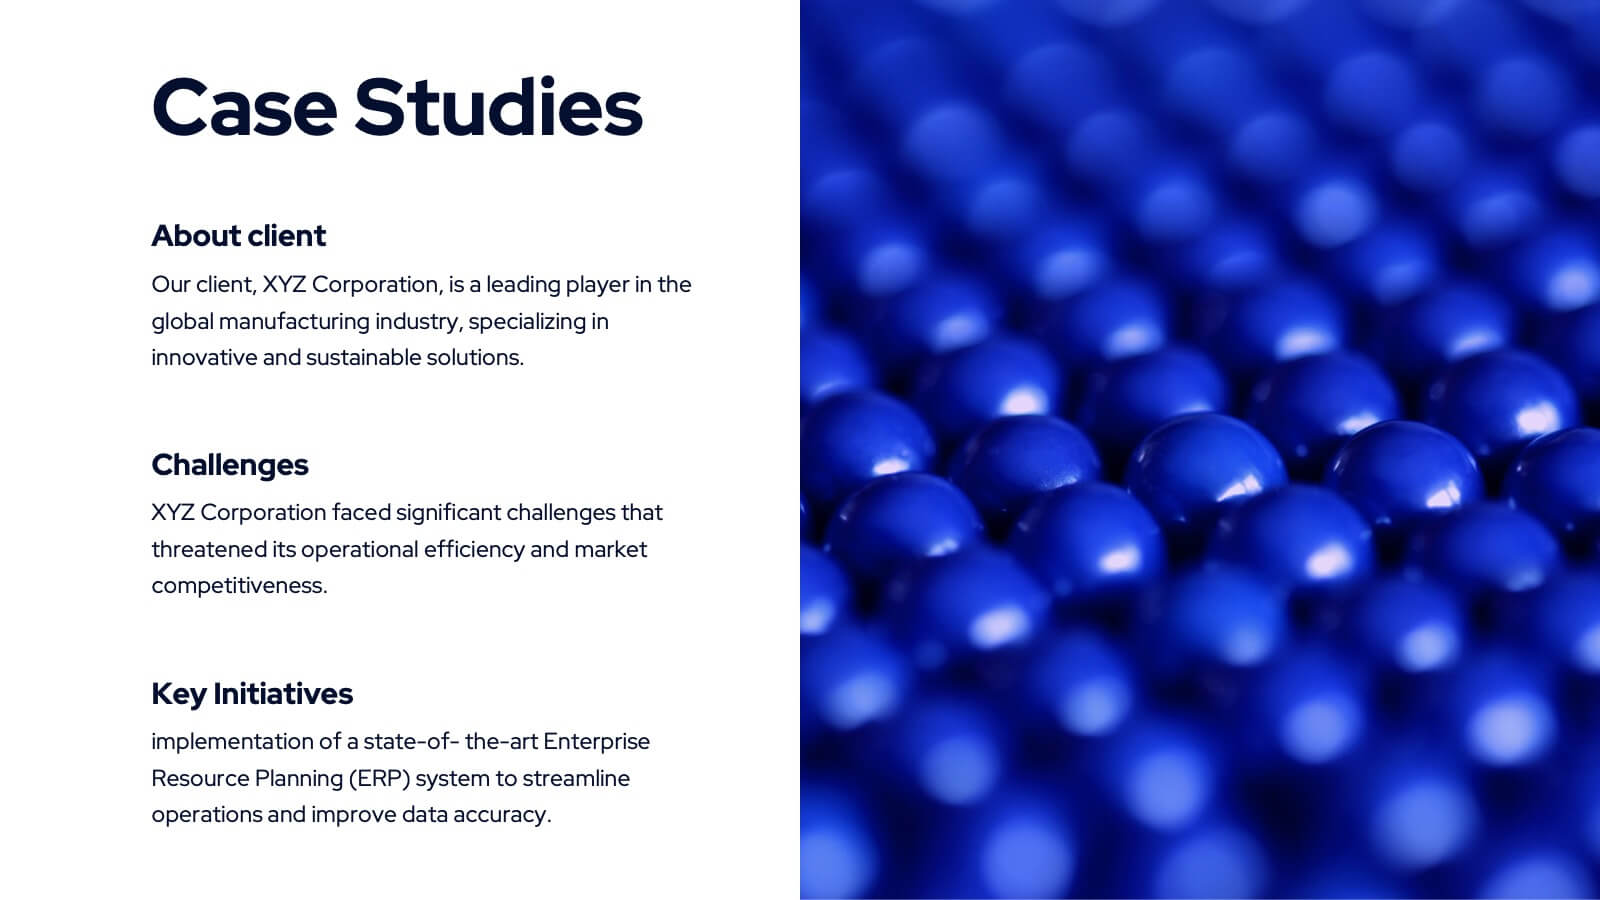
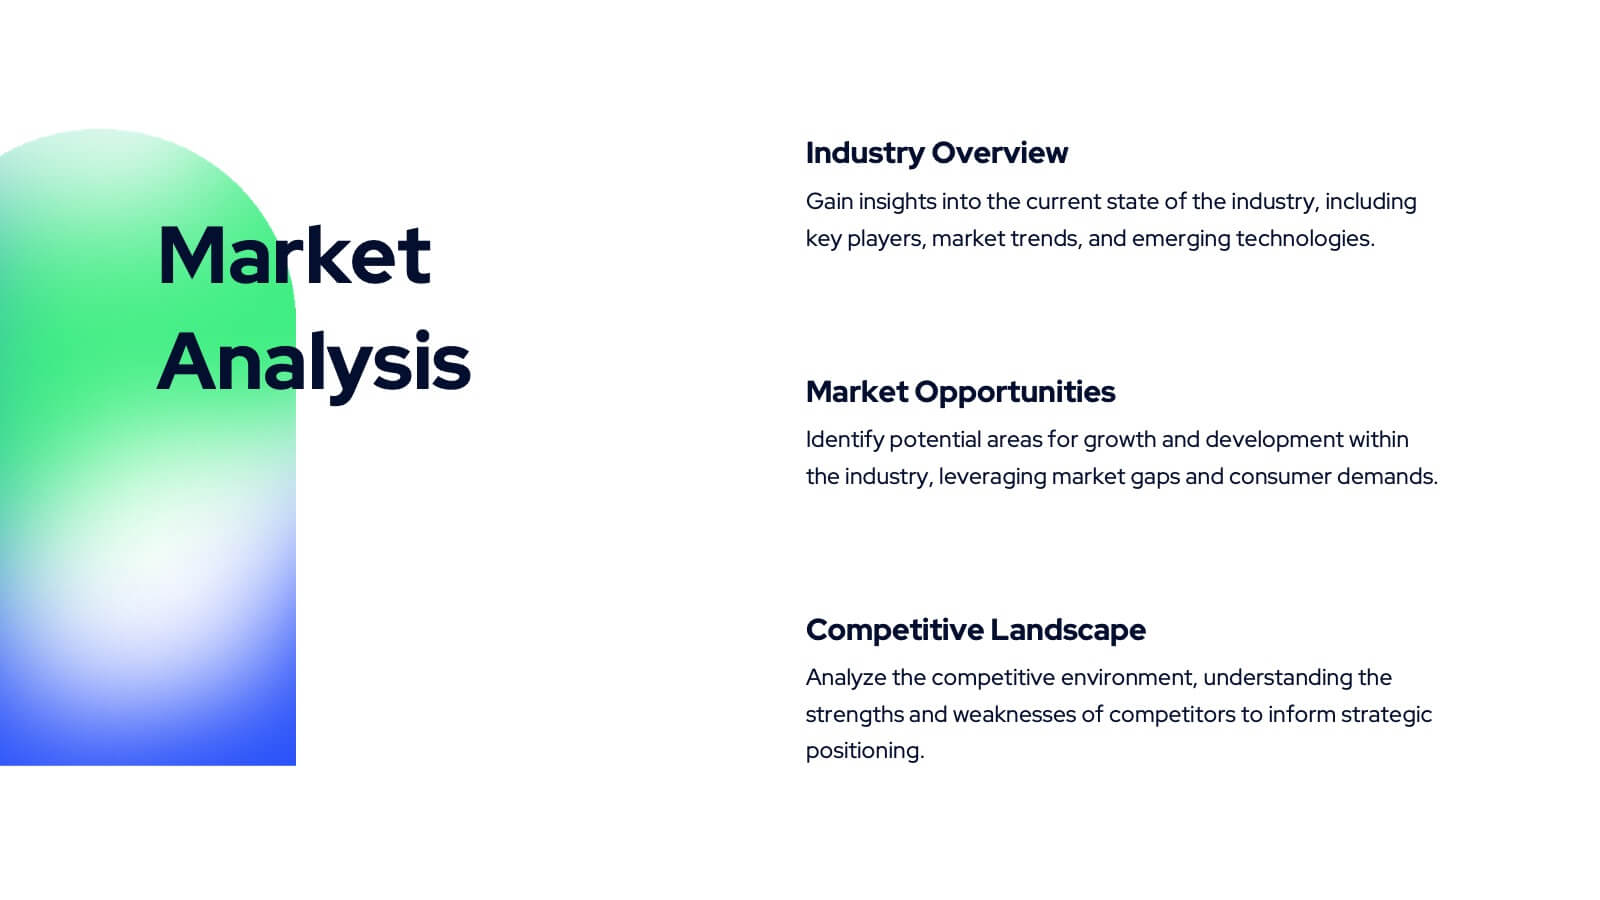
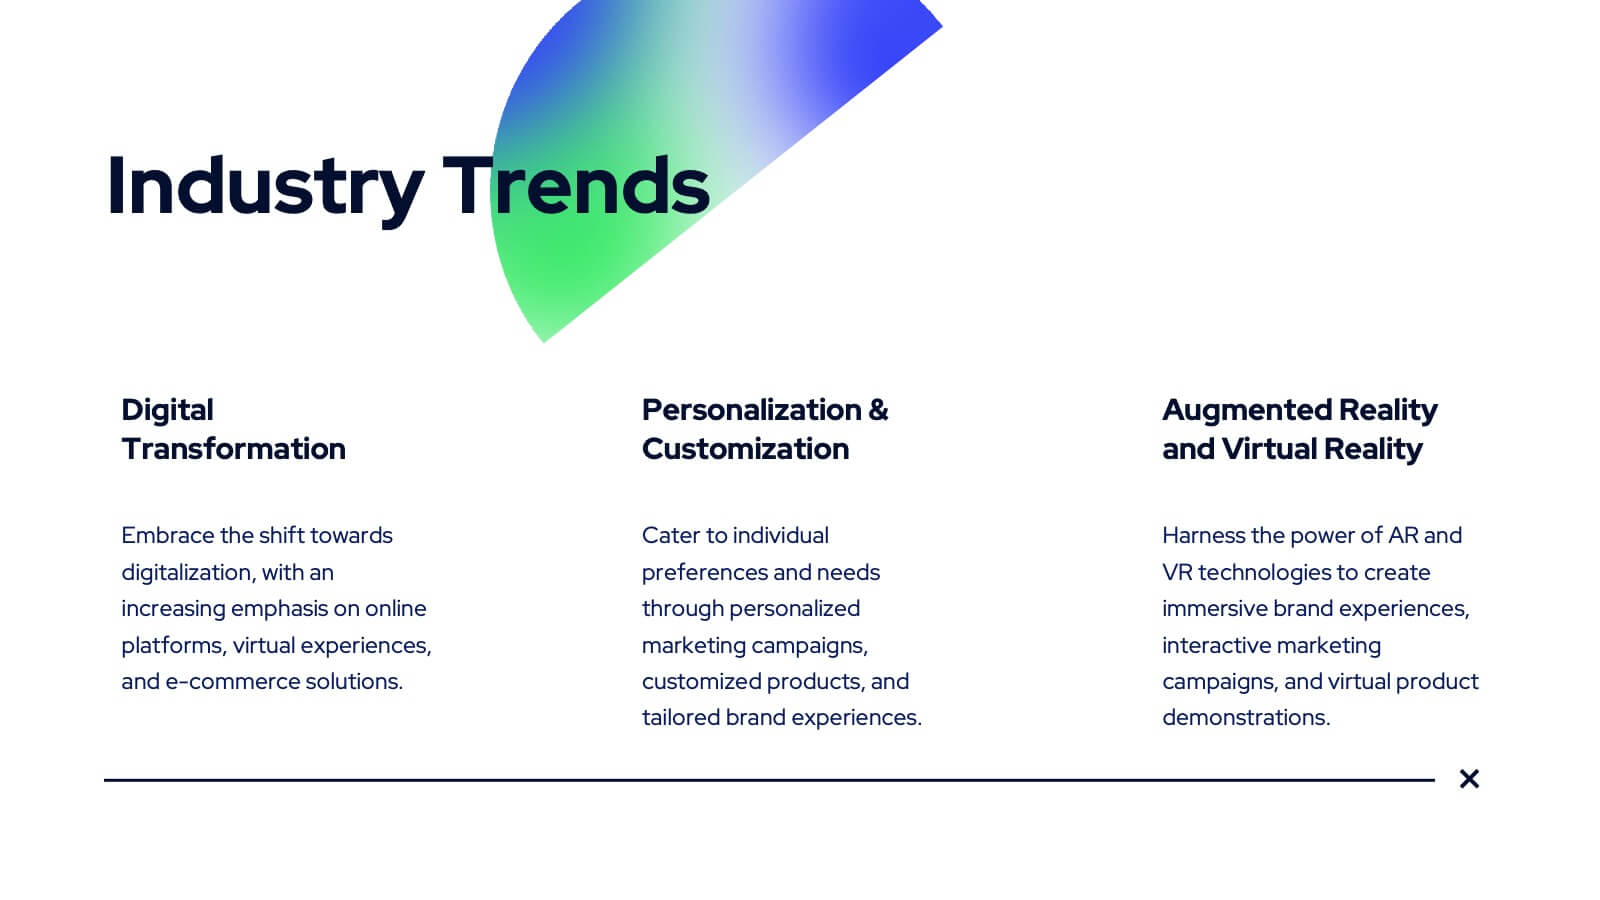
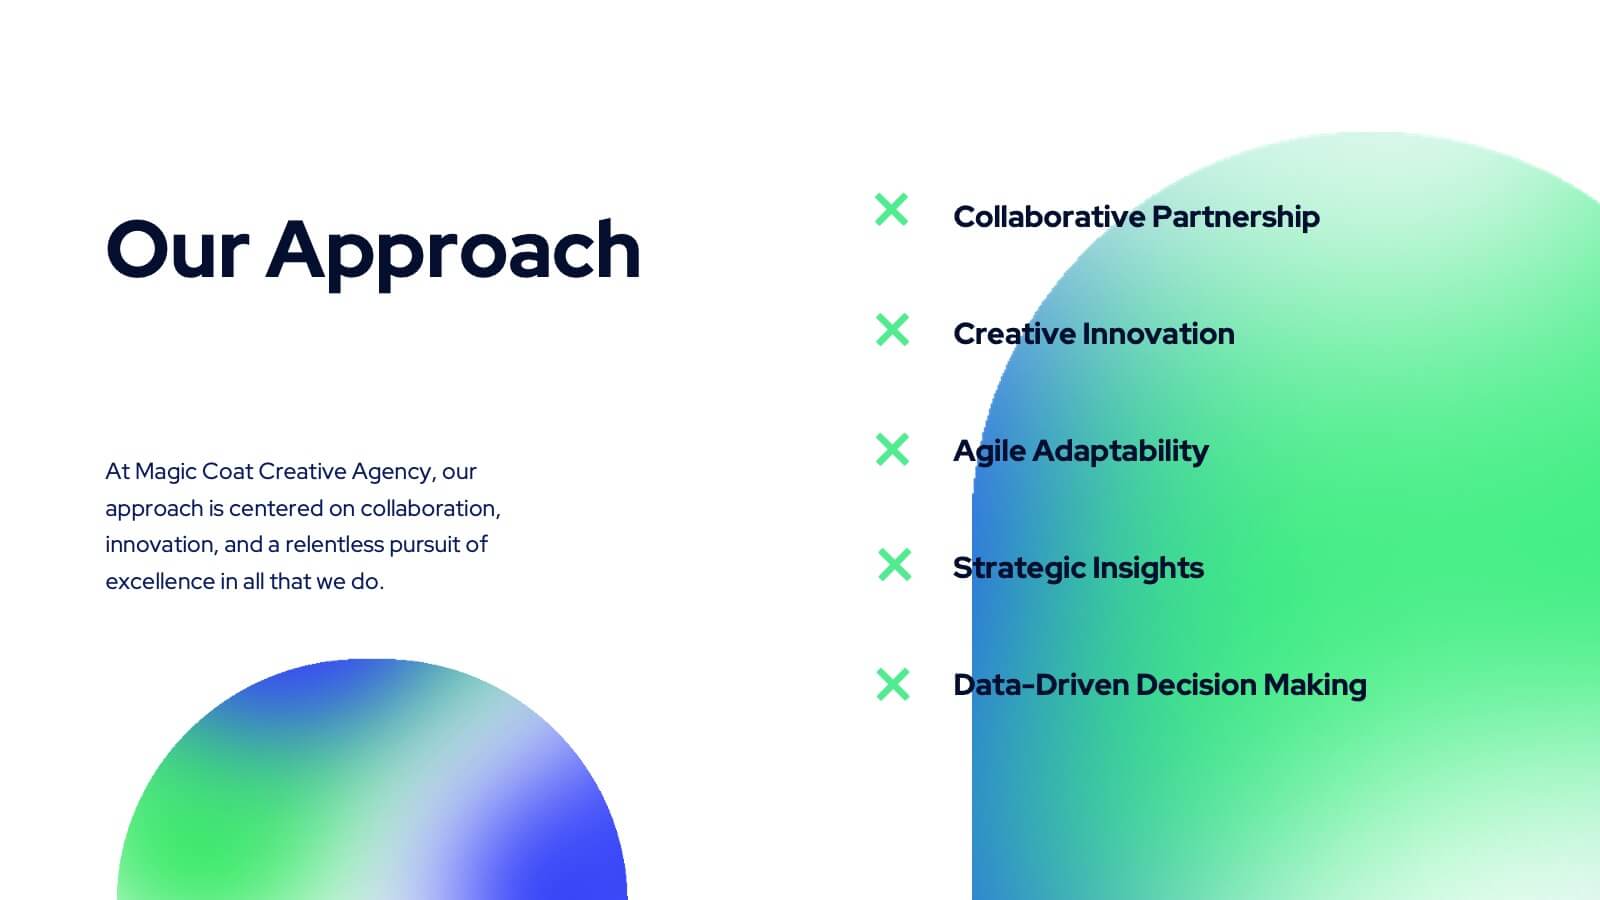
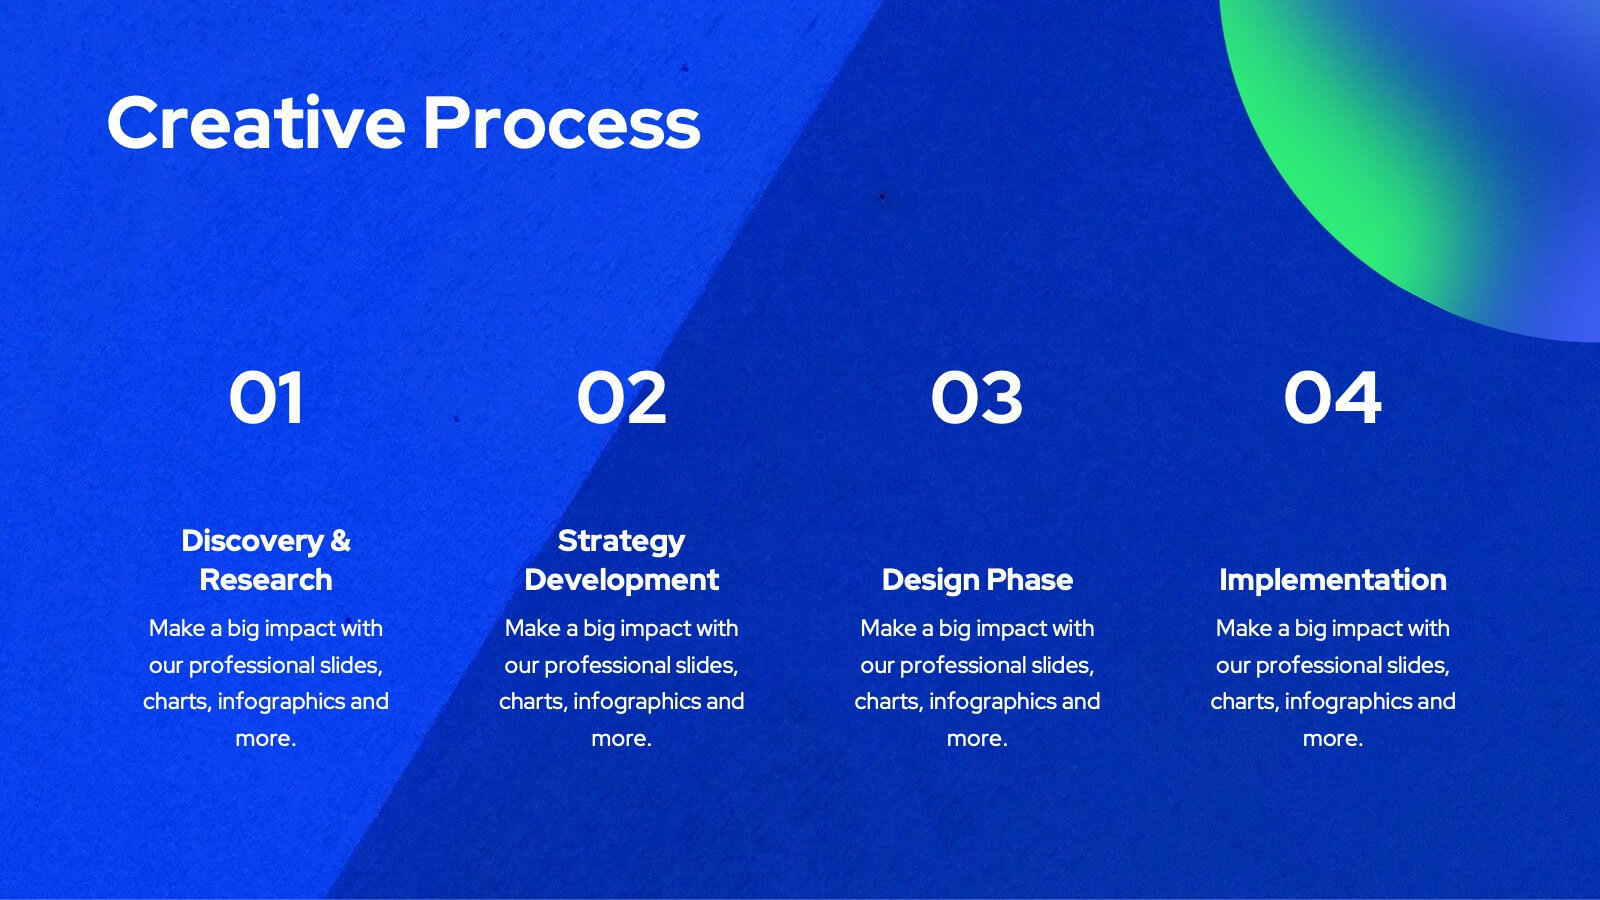
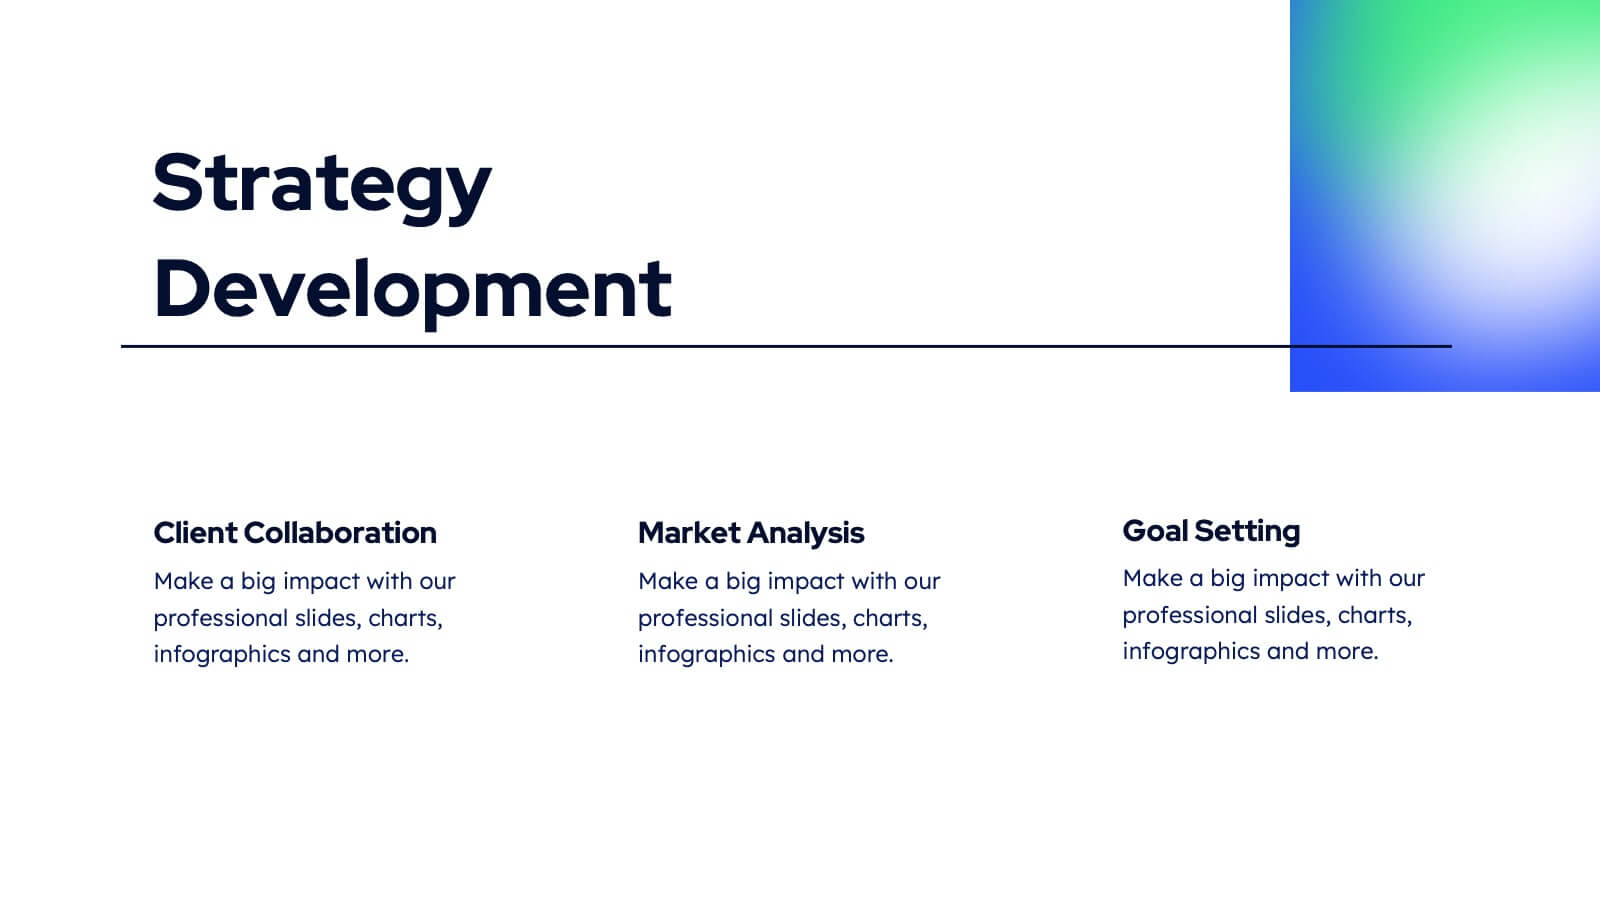
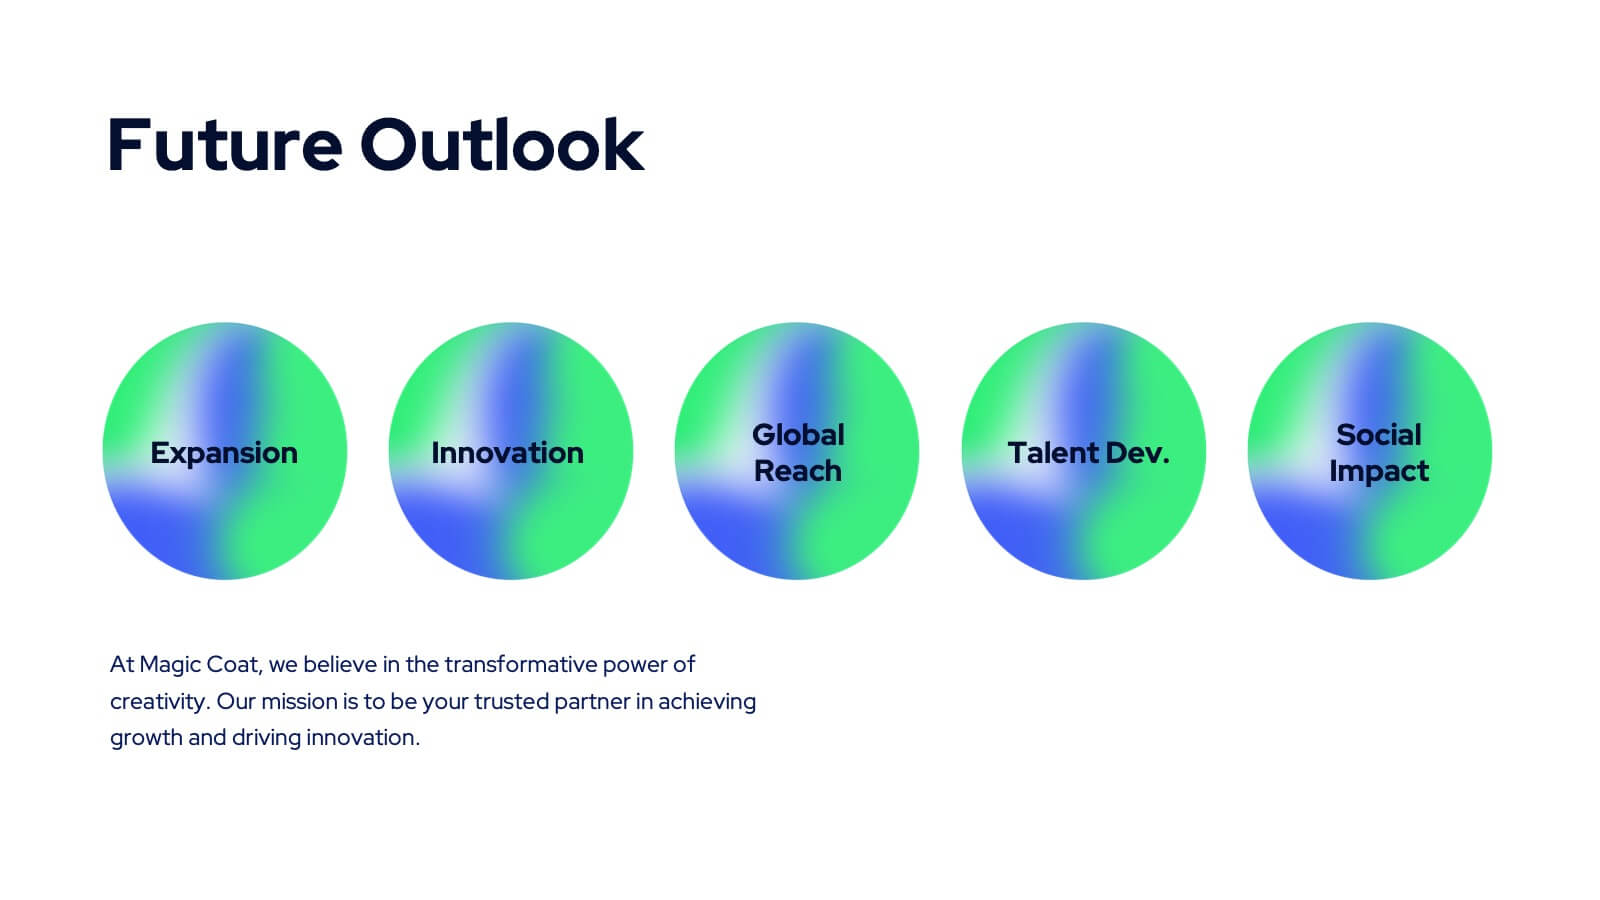
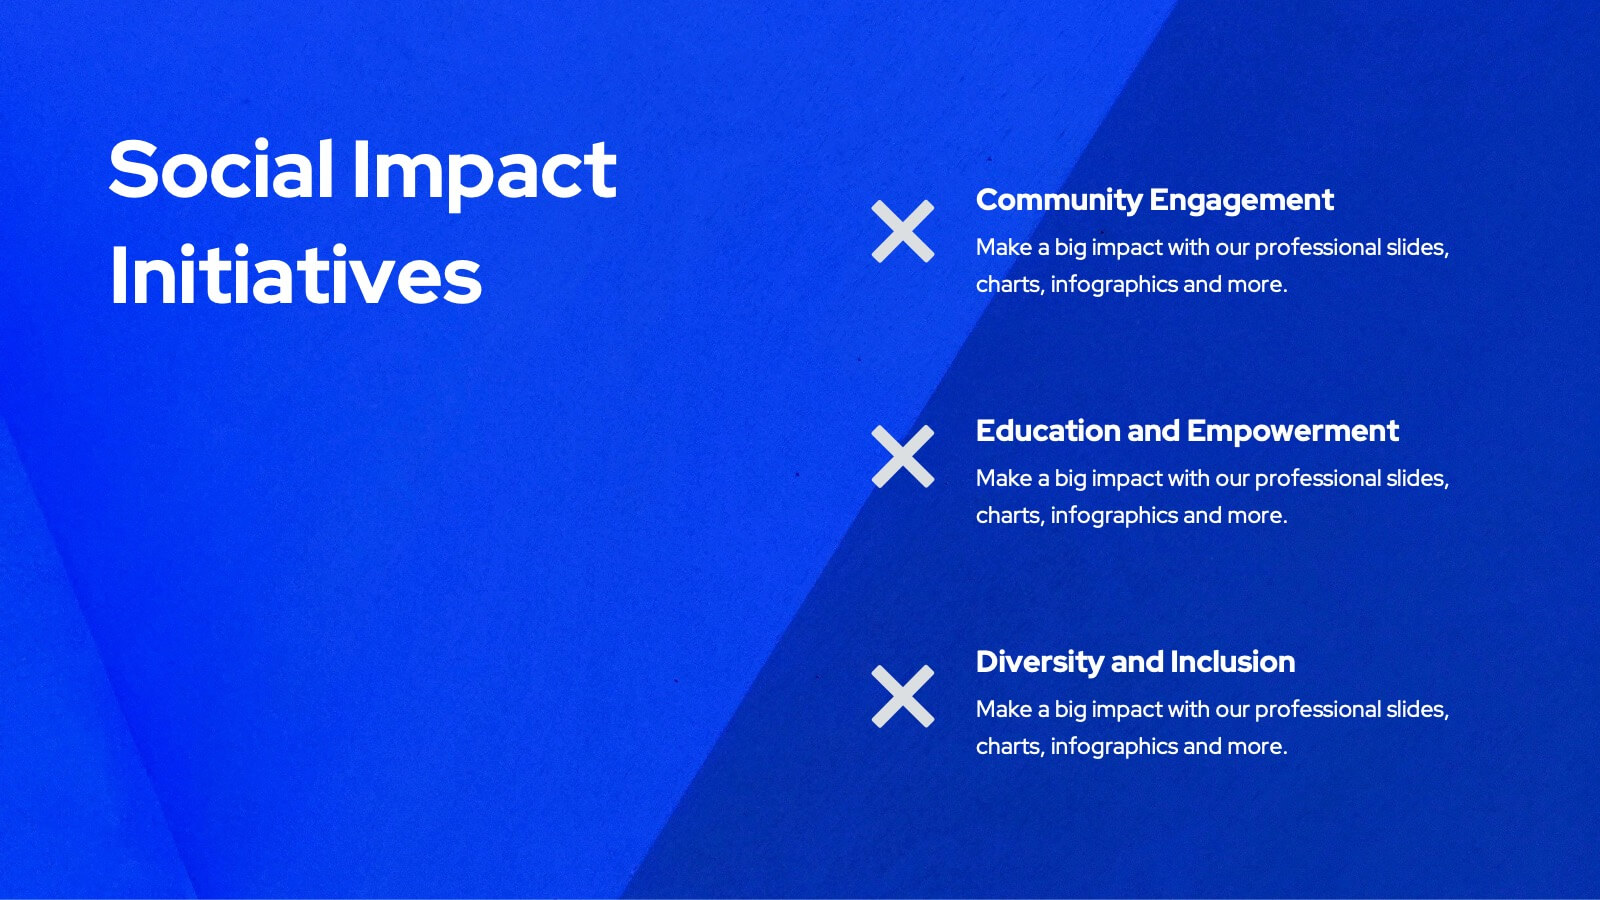
Tanzanite Full-Service Agency Project Plan Presentation
Showcase your agency's strengths with this bold and modern portfolio presentation template! From client success stories and case studies to market analysis and strategy development, this template highlights your expertise and approach. Perfect for agencies looking to present their services, creative processes, and partnerships. Compatible with PowerPoint, Keynote, and Google Slides, making it easy to impress any audience.