


Características


¿Tienes alguna pregunta?
Recomendar


6 diapositivas
Conversion Funnel Infographic Presentation
Optimize your marketing strategy with this Conversion Funnel Infographic template. Clearly illustrate lead generation, customer retention, and sales processes in a structured format. Fully editable to match your branding—customize colors, icons, and text effortlessly. Compatible with PowerPoint, Keynote, and Google Slides for a smooth presentation experience.


7 diapositivas
Business 3D Infographic
Bring a new dimension to your business presentations with our 3D Business Infographics. These dynamic visuals are perfect for professionals and educators who want to add depth to their data representation and make complex information more accessible. Our 3D Business Infographics collection features a range of formats, from layered pyramids to multidimensional bar graphs, allowing for innovative depictions of hierarchies, relationships, and progressions. Whether you're illustrating strategic frameworks, financial analysis, or project milestones, these graphics can enhance understanding and engagement. Customizable for any business context, these infographics are designed to stand out in reports, presentations, or educational materials. Their SEO-friendly nature ensures that your content is more likely to be seen and shared, extending your reach. Use these 3D infographics to make a strong visual impact that communicates your business concepts with clarity and creativity.


5 diapositivas
Creative Geometric Layouts Presentation
Give your content a fresh, modern spark with bold geometric elements that guide attention and create a clean visual rhythm. This presentation helps you structure ideas clearly, highlight key sections, and maintain a polished, creative look throughout your slides. Fully editable and compatible with PowerPoint, Keynote, and Google Slides.


6 diapositivas
Digital Marketing Agency Infographic
Digital marketing refers to the use of digital channels, platforms, and technologies to promote products, services, or brands to a target audience. This infographic can help showcase the services your agency offers, your expertise, and the benefits of choosing your agency for digital marketing needs. This template is fully customizable and compatible with Powerpoint, Keynote, and Google Slides. Use icons, illustrations, and images to represent different digital marketing services and concepts. Create sections that detail the various digital marketing services your agency provides.


6 diapositivas
Airline Business Strategy and Trends Presentation
Navigate your industry insights with clarity using this sleek aviation-themed slide. Perfect for showcasing five core data points or trends, each positioned along a stylized airplane graphic. This layout is ideal for airline professionals, aerospace consultants, and logistics analysts. Fully customizable in PowerPoint, Keynote, and Google Slides.


20 diapositivas
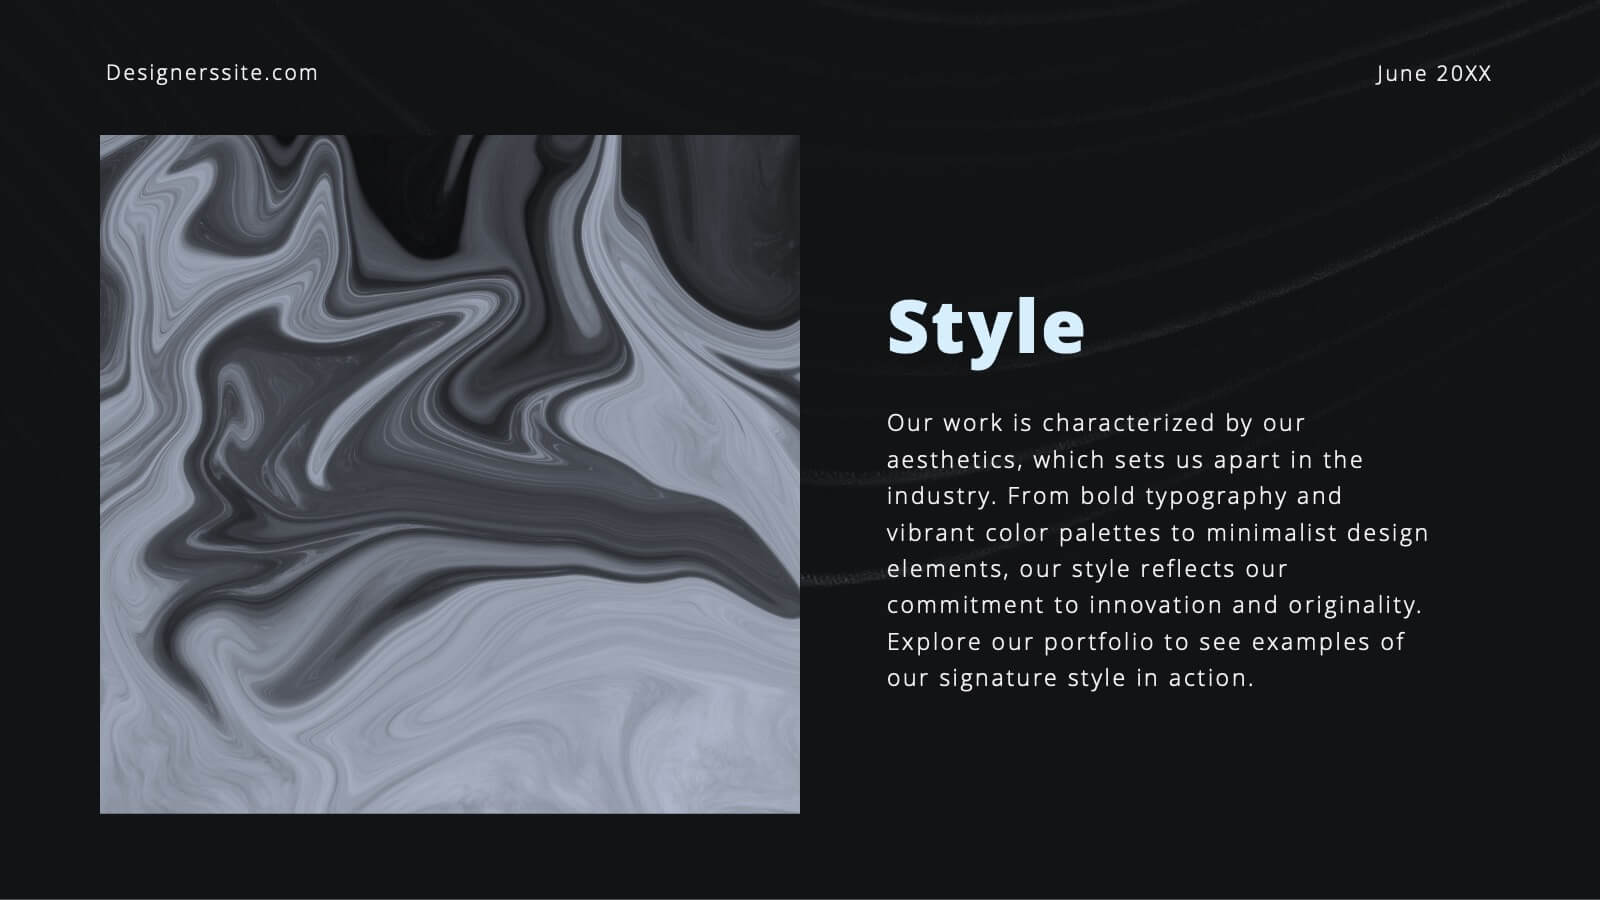
Bravo Creative Portfolio Presentation
Showcase your creative prowess with this sleek, modern portfolio presentation template. Perfect for highlighting featured projects, client testimonials, and your creative process, this template ensures your work shines. Its stylish design and professional layout make it ideal for impressing potential clients and collaborators. Compatible with PowerPoint, Keynote, and Google Slides, it's versatile for any platform.


7 diapositivas
Company Insurance Infographic Presentation
An Insurance Infographic is a visual representation of data related to the insurance industry. You can educate consumers on insurance policies, coverage options, and industry trends. This template includes a combination of data, statistics, and graphics that help explain key concepts related to insurance. You can use this infographic to include information on different types of insurance policies, claims, premiums, and industry-specific trends. Designed in Powerpoint, Keynote, and Google Slides this is a powerful tool for communicating complex insurance concepts in a simple and engaging way.


14 diapositivas
Business Innovation and Idea Development Presentation
Drive Business Innovation and Idea Development with this dynamic and structured template, perfect for illustrating creative processes, strategic growth, and idea execution. Designed with a lightbulb-themed layout, this presentation helps break down complex concepts into clear, engaging sections. Fully customizable and compatible with PowerPoint, Keynote, and Google Slides, making it an essential tool for entrepreneurs, teams, and business leaders looking to present ideas with impact.


7 diapositivas
Future Vision Infographic
Chart a course towards a visionary future with our Future Vision Infographic Template. This dynamic template is designed to help organizations articulate and visualize their long-term goals and strategies in a clear and compelling way. Each slide offers a unique blend of geometric designs and bold color palettes, ideal for engaging stakeholders and inspiring action. Perfect for corporate presentations, strategic meetings, or digital showcases, this template allows you to lay out your vision with precision. It guides viewers through your roadmap to success, highlighting key milestones and the innovative steps you plan to take. Customize each element to echo your organizational identity and values, ensuring that your future aspirations resonate deeply with your audience. Whether you're aiming to motivate your team, attract investors, or inform your partners, our Future Vision template provides a robust foundation for powerful storytelling and strategic clarity.


26 diapositivas
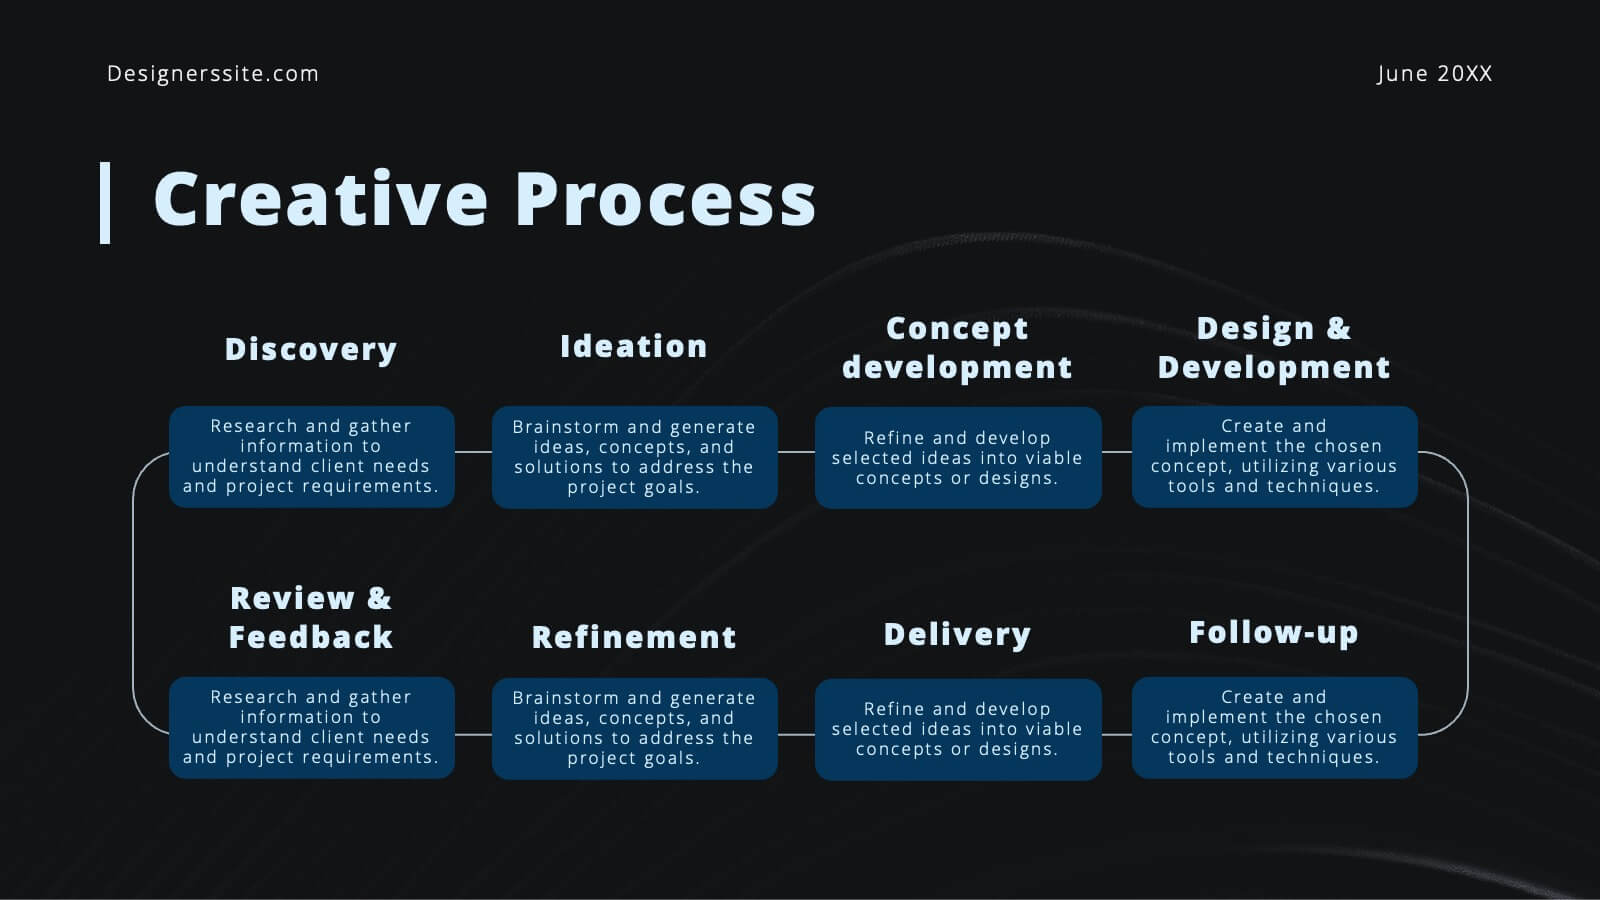
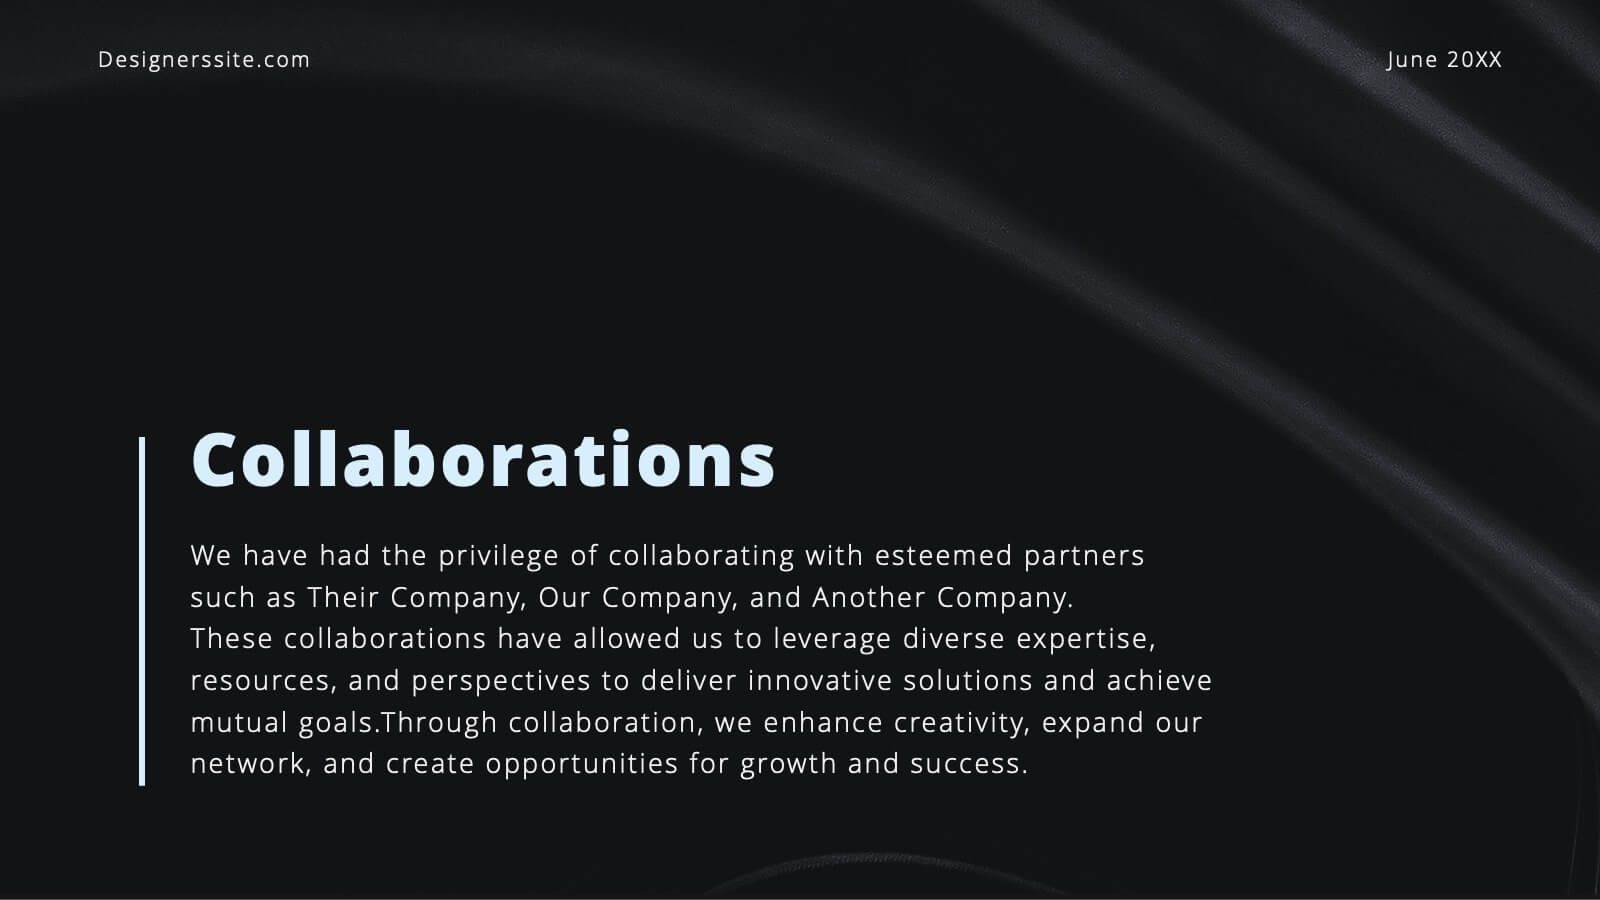
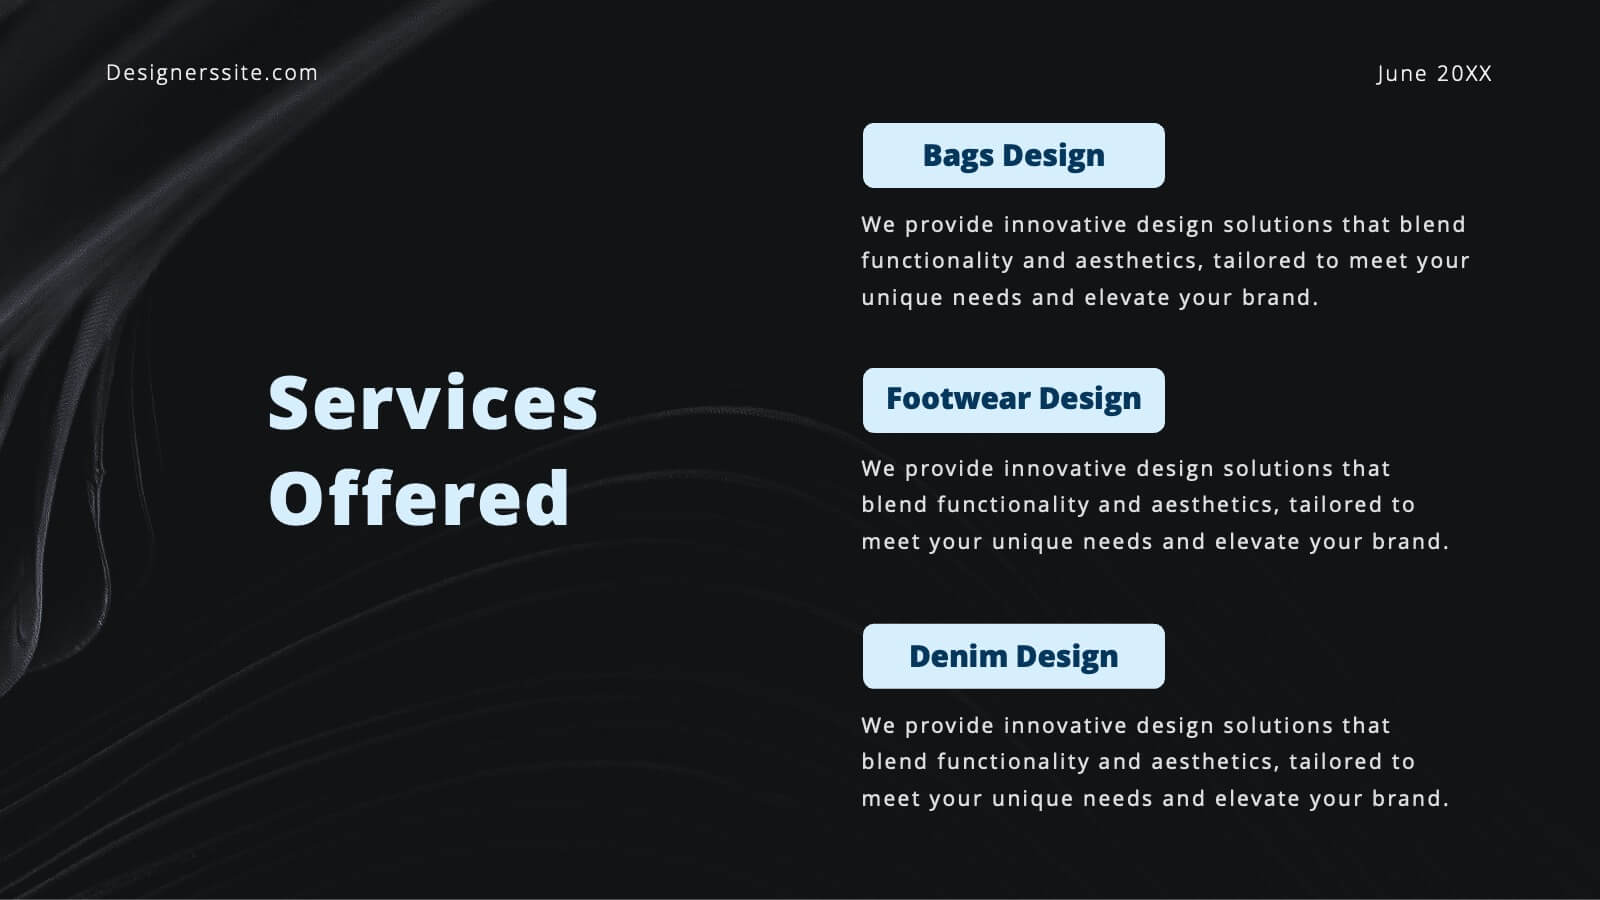
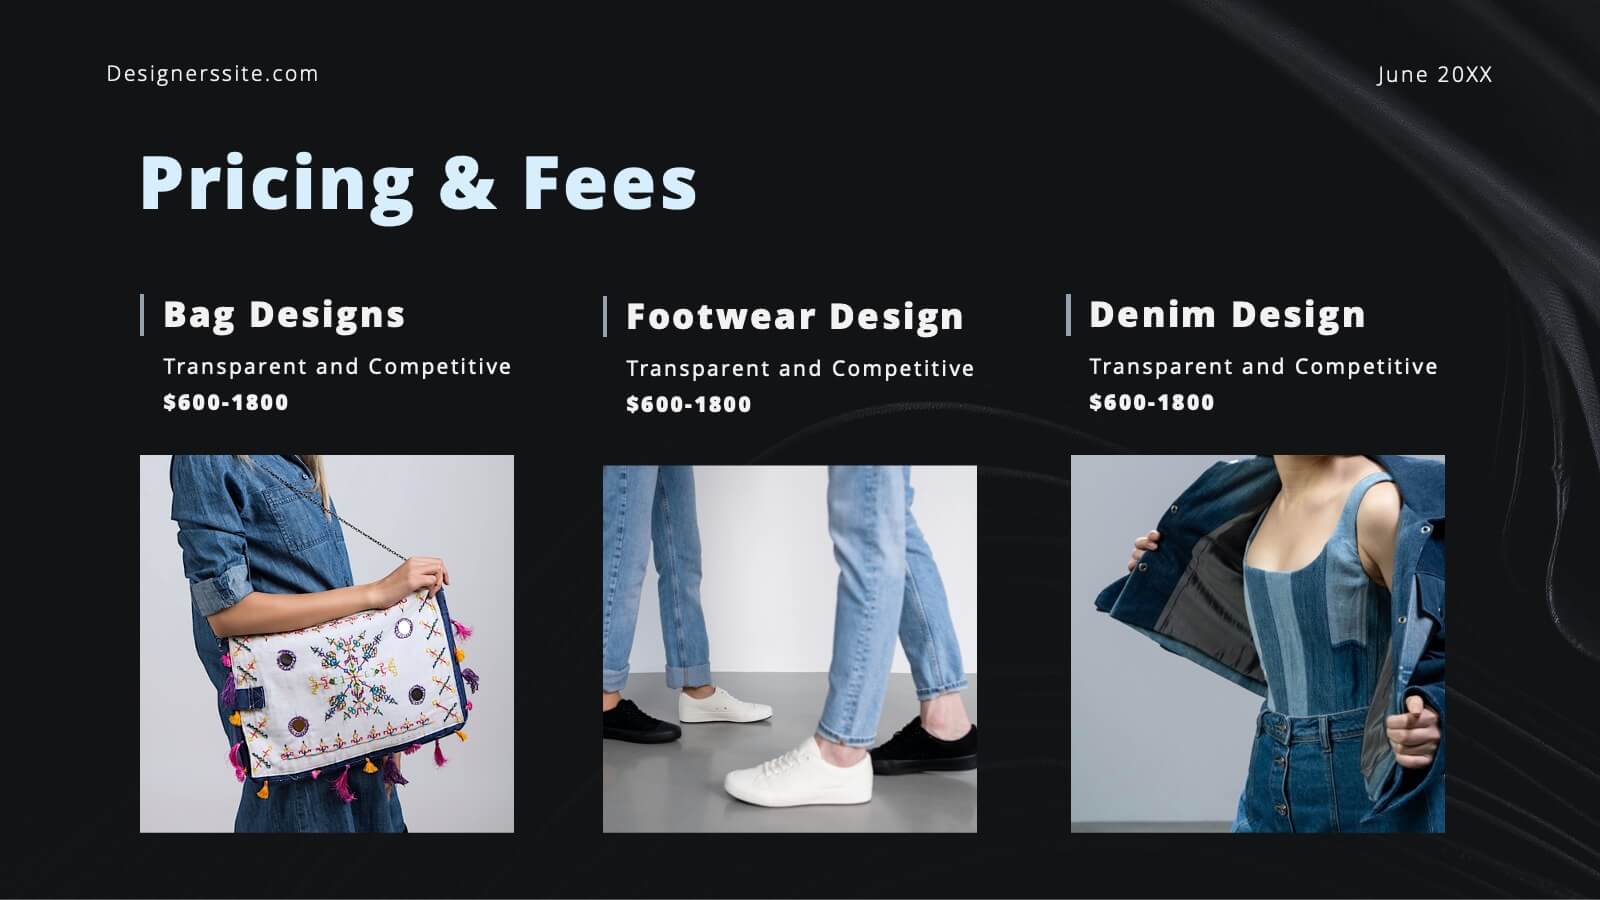
Navigating the Creative Industry Presentation
Unlock the secrets to success in the creative industry with this dynamic and visually engaging presentation. Covering essential topics like career pathways, industry trends, collaboration strategies, and personal branding, this template helps you present insights with clarity and impact. Fully customizable and compatible with PowerPoint, Keynote, and Google Slides for a seamless experience.


5 diapositivas
Business Innovations Strategy Presentation
Bring your next big idea to life with this modern, visually engaging presentation. Perfect for showcasing creative strategies, innovation frameworks, and growth opportunities, it helps you present your concepts with clarity and flow. Fully customizable and compatible with PowerPoint, Keynote, and Google Slides for a smooth professional experience.


6 diapositivas
5-Step Investment Planning Presentation
Guide your audience through a clear, structured journey with a modern layout that turns each financial step into a simple, visual milestone. This presentation helps you explain goals, outline processes, and communicate actionable insights with ease and clarity. Fully editable and compatible with PowerPoint, Keynote, and Google Slides.


6 diapositivas
6-Stage Business Cycle Presentation
The "6-Stage Business Cycle Presentation" template expertly outlines the progression of business processes through a visually appealing circular diagram, perfect for detailed strategic presentations. This template features six interconnected stages, each distinguished by unique colors and intuitive icons, simplifying complex business concepts into digestible segments. Central placeholders allow for concise titles and brief descriptions, enhancing clarity and comprehension. Ideal for business analysts, strategists, and educators, this tool facilitates the effective communication of developmental cycles, operational processes, and strategic evaluations. Use this template in board meetings, workshops, or educational sessions to convey the cyclical nature of business tasks and strategies efficiently.


6 diapositivas
Regional Finance Infographic
Regional finance plays a vital role in fostering economic growth, attracting investments, and improving the overall well-being of communities within a specific region. This infographic template focuses on financial trends, insights, and data related to specific regions or countries. It is designed to help businesses, organizations, or financial professionals analyze and understand the financial landscape of a particular region. The data-driven content in this template is suitable for businesses or individuals seeking insights to make informed decisions regarding investments, market entry, or financial planning in a specific region.


6 diapositivas
Agile Delivery Framework for Projects Presentation
Visualize agile project phases with this spiral delivery framework slide. Ideal for project managers and scrum teams to outline each step in a continuous delivery process. Features six clearly labeled stages, icons, and bold colors. Fully editable in PowerPoint, Keynote, and Google Slides for clear, structured agile workflow presentations.


6 diapositivas
Revenue Growth Sales Slide Presentation
Showcase your business success with this Revenue Growth Sales Slide Presentation. The upward-curved arrow design highlights five key milestones, each with customizable titles, icons, and color accents. Perfect for illustrating sales performance, growth metrics, or financial forecasts. Easy to edit in PowerPoint, Keynote, or Google Slides—ideal for sales teams, analysts, and executives.


5 diapositivas
Global Warming Impacts Infographics
Global Warming refers to the long-term increase in Earth's average surface temperature due to human activities, primarily the emission of greenhouse gases. This is a visually engaging infographic template that highlights the impacts of global warming on the environment, ecosystems, and human societies. This template is made to create an understanding of the consequences of climate change and raise awareness about the urgent need for action. The eye-catching visuals and impactful messaging, make these infographics ideal for presentations, educational material, or awareness campaigns related to global warming and environmental sustainability.