


Características


¿Tienes alguna pregunta?
Recomendar


7 diapositivas
Budget Forecasting Spreadsheet Infographic
Step into the strategic realm of budget forecasting with our detailed infographic. Cast in the reliability of blue, the vibrancy of orange, and the optimism of yellow, our template is a beacon of financial foresight. Equipped with precise infographics, intuitive icons, and adaptable image placeholders, it transforms financial data into a predictive narrative. Flawlessly tailored for Powerpoint, Keynote, or Google Slides. An essential tool for financial analysts, business strategists, accountants, or any professional navigating the future financial terrains of their organization. Forecast with confidence; let every slide be a roadmap to financial prudence.


21 diapositivas
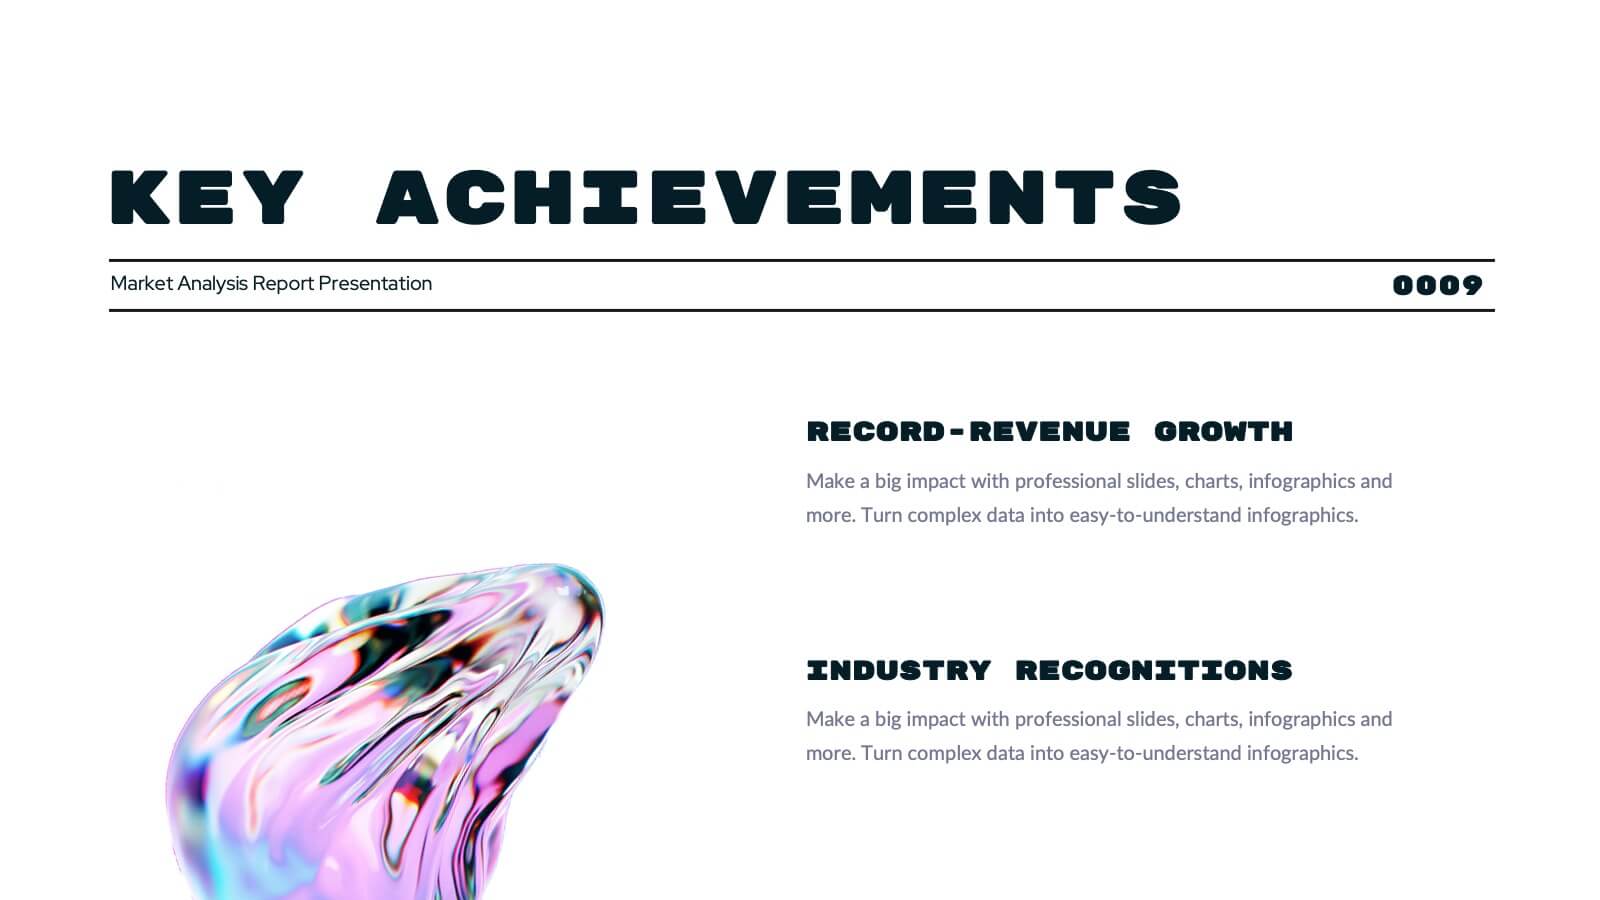
Turquoise Market Analysis Report Presentation
This sleek report presentation template covers essential sections like key performance metrics, market analysis, and strategic initiatives. It’s designed for a professional yet modern look, perfect for showcasing updates and insights. Compatible with PowerPoint, Keynote, and Google Slides, it’s ideal for delivering engaging and impactful business reports.


6 diapositivas
Blue Ocean Trade Infographic
The Blue Ocean strategy is a concept that focuses on creating uncontested market spaces rather than competing in existing market segments. This captivating infographic template showcases the concept of blue ocean trade and its impact on business growth and innovation. It provides an engaging and informative overview of the blue ocean strategy, highlighting its key principles and benefits for businesses. This template provides a comprehensive overview of blue ocean trade and serves as an inspiring resource for those seeking innovative business strategies. Fully compatible with Powerpoint, keynote, and Google Slides.


5 diapositivas
Strategic Matrix Grid Analysis Presentation
Clarify your strategic insights with the Strategic Matrix Grid Analysis Presentation. This layout uses a 2x2 quadrant design to showcase four key categories or scenarios—ideal for SWOT, risk vs. reward, product positioning, or capability mapping. Clean labels, icons, and text areas help break down each quadrant’s significance. Fully editable in PowerPoint, Google Slides, Keynote, and Canva.


25 diapositivas
Hollowfern Brand Identity Presentation
Showcase your brand's unique essence with this structured and visually appealing brand identity presentation template. Highlight key elements like brand values, logo design, color palettes, and typography, providing a cohesive foundation for your brand's image. Dive deeper into the brand tone, consumer personas, and competitive positioning to ensure clarity and alignment with your target audience. This template offers dedicated sections for market analysis, unique selling proposition, and brand guidelines, helping you communicate your strategy with professionalism. Whether you're crafting a social media presence, building a website, or refining packaging designs, this template empowers you to stay consistent and compelling. Fully compatible with PowerPoint, Google Slides, and Keynote, it's tailored for seamless customization and presentation across platforms.


7 diapositivas
Communication Styles Infographic
Dive into the diverse world of communication with our communication styles infographic. Set against a palette of blue, yellow, and white, this template offers a visual exploration of different communication methods and their nuances. Whether it's assertive, passive, aggressive, or passive-aggressive, understanding these styles is vital in both personal and professional settings. Ideal for corporate trainers, educators, students, or anyone aiming to improve their interpersonal skills. Crafted for clarity and compatibility, this infographic is an excellent addition to PowerPoint, Keynote, and Google Slides, ensuring your presentations resonate with both substance and style.


5 diapositivas
Target Audience Analysis Slide Presentation
Discover who your audience truly is with this clear and visually balanced layout designed to simplify audience insights. Perfect for marketing plans, presentations, and strategy reports, it helps you visualize key demographics and behaviors effortlessly. Fully customizable and compatible with PowerPoint, Keynote, and Google Slides for easy editing.


7 diapositivas
Solution Infographics Presentation Template
Featuring our solution Infographic template, We have a solution for your presentation problems. Give your next presentation the edge with this template, that allows you to present the perfect solutions to your audience. All the content is completely customizable and the built-in icons can be replaced with your own text and illustrations. Choose from the various themes available, and make it fit your needs. This template contains all the elements needed to make your infographic presentation pop! graphs, photos and a minimal style makes this design perfect for any kind of project.


6 diapositivas
Business Task Checklist Presentation
Bring order and focus to your workflow with a clean, structured layout that tracks progress and priorities at a glance. Ideal for project updates, task planning, or performance reviews, this presentation makes organization effortless. Fully compatible with PowerPoint, Keynote, and Google Slides for easy customization and professional use.


6 diapositivas
Meeting and Event Planning Schedule Presentation
Plan smarter and meet deadlines with the Meeting and Event Planning Schedule Presentation. This organized layout helps teams visualize phases, dates, and key activities at a glance—perfect for scheduling workshops, meetings, or launch events. Fully customizable in PowerPoint, Keynote, and Google Slides.


8 diapositivas
Benefits Table Template
Optimize your presentation of complex options with our "Benefits Table Template." Designed to clearly distinguish between different plans, this template enables you to showcase Plan A, Plan B, and Plan C with ease. Each column is distinctively colored and detailed to ensure your audience can grasp the variances in benefits at a glance. Ideal for comparing packages, costs, or strategic choices in a corporate setting, this template helps clarify decision-making processes. Compatible with PowerPoint, Keynote, and Google Slides, it is an invaluable tool for business analysts, sales teams, and marketers aiming to communicate effectively with their stakeholders.


10 diapositivas
Project Lifecycle Planning Overview Presentation
Guide your team through every project stage with the Project Lifecycle Planning Overview Presentation. Featuring a four-phase circular flow layout, this template helps visualize key milestones—from initiation to completion. Ideal for project managers, consultants, and strategic teams. Fully customizable and compatible with PowerPoint, Keynote, Google Slides, and Canva.


6 diapositivas
Best Pricing Tables Infographics
Maximize your product or service presentation with our Best Pricing Tables infographic template. This template is fully compatible with popular presentation software like PowerPoint, Keynote, and Google Slides, allowing you to easily customize it to showcase your pricing structures effectively. The Best Pricing Tables infographic template offers a visually appealing platform to display different pricing tiers, features, and benefits. Whether you're a business owner, marketer, or sales professional, this template provides a user-friendly canvas to create pricing tables that captivate your audience. Optimize your pricing strategy with this SEO-optimized Best Pricing Tables infographic template, thoughtfully designed for clarity and ease of use. Customize it to highlight competitive advantages, discounts, and special offers, helping you convert potential customers into loyal clients. Start crafting your personalized pricing tables today to boost your sales and revenue!


5 diapositivas
Financial Plan Infographics
A financial plan provides a roadmap for achieving financial goals, managing income and expenses, mitigating risks, building wealth, and preparing for the future. These infographic templates are designed to help individuals and businesses present their financial plans and strategies in a clear and concise manner. Use this to create a financial report, a business presentation, or to provide financial guidance, this template will help you communicate key financial information effectively. Compatible with Powerpoint, Keynote, and Google Slides, this makes is easy to customize with your information.


2 diapositivas
Modern Business Cover Slide Presentation
Stand out with this bold and contemporary cover slide. The layout features dynamic geometric shapes and an integrated photo section, perfect for making a memorable first impression. Whether you're presenting to clients or stakeholders, this slide combines style and structure to deliver your brand message clearly. Fully customizable and easy to edit in PowerPoint, Keynote, and Google Slides.


5 diapositivas
Construction Projects Infographics
Construction projects refer to the process of planning, designing, and building structures, infrastructure, or facilities. These vertical infographics are visually appealing and informative resources designed to showcase various aspects of construction projects. It provides a comprehensive overview of the construction industry, highlighting key statistics, trends, and best practices. The template showcases different types of construction projects. It includes visuals and brief descriptions to illustrate the unique characteristics and requirements of each type. Compatible with Powerpoint, Keynote, and Google Slides.


30 diapositivas
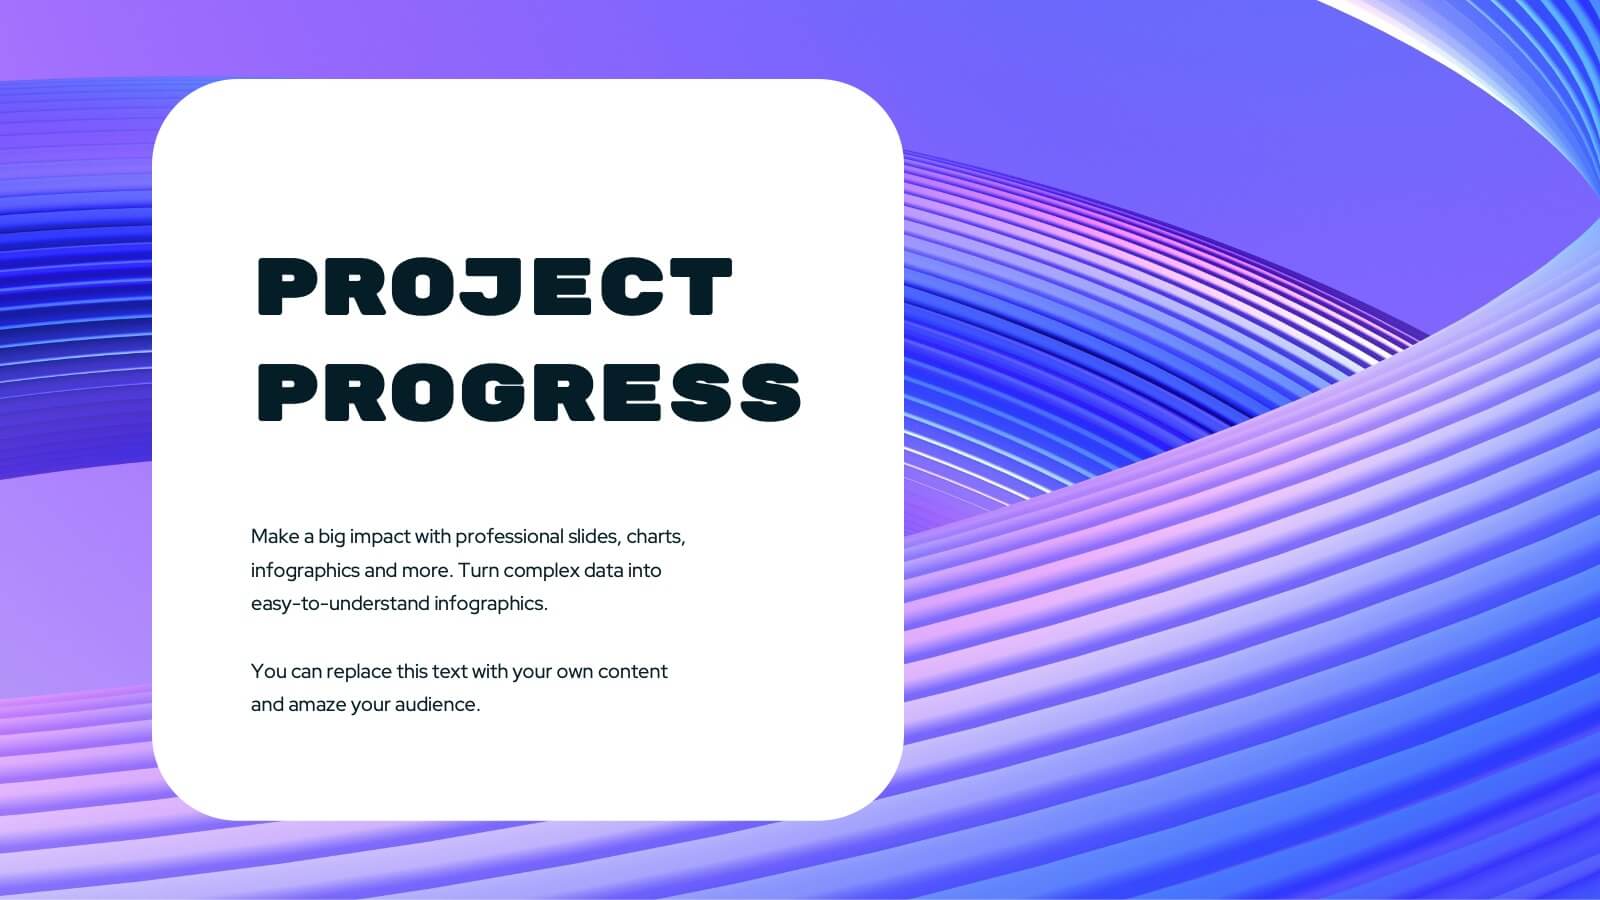
Quintara Rebranding Project Plan Presentation
Revamp your brand with confidence using this dynamic rebranding project plan presentation. Covering key aspects like brand positioning, market analysis, visual identity, and unique selling propositions, this template helps you craft a compelling brand strategy. Fully customizable and compatible with PowerPoint, Keynote, and Google Slides for a seamless, professional presentation experience.