


Características


¿Tienes alguna pregunta?
Recomendar


5 diapositivas
Investment Opportunity Business Case
Visualize the value behind your proposal with this key-themed layout, ideal for presenting compelling reasons to invest. Each section highlights a unique point, making it easy to walk stakeholders through critical benefits and insights. Fully editable and compatible with PowerPoint, Keynote, and Google Slides.


28 diapositivas
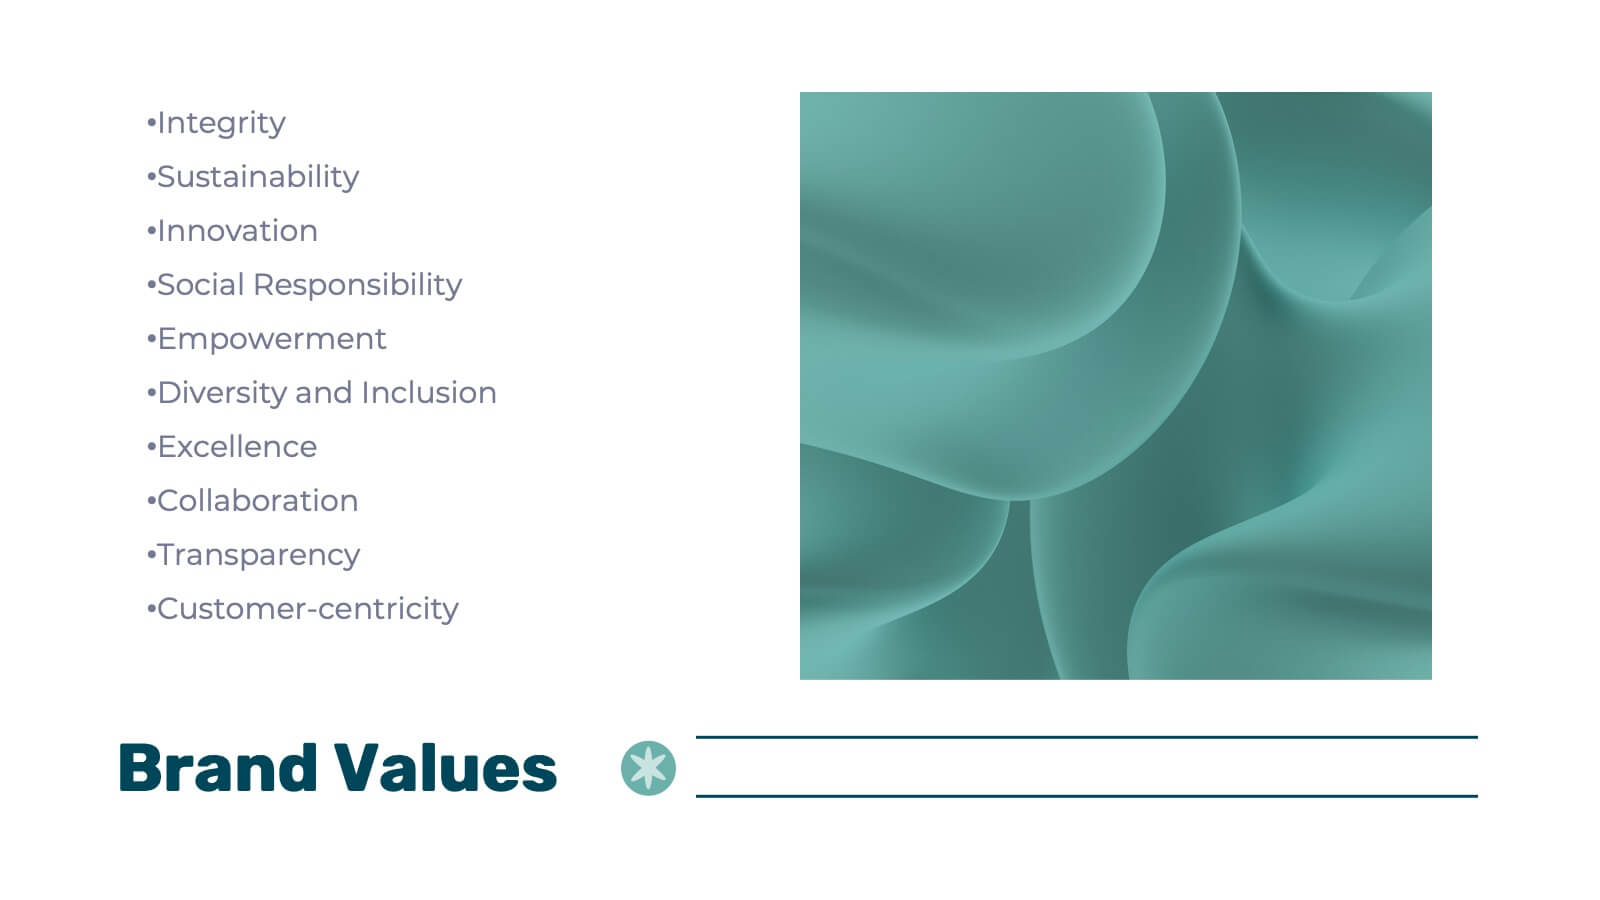
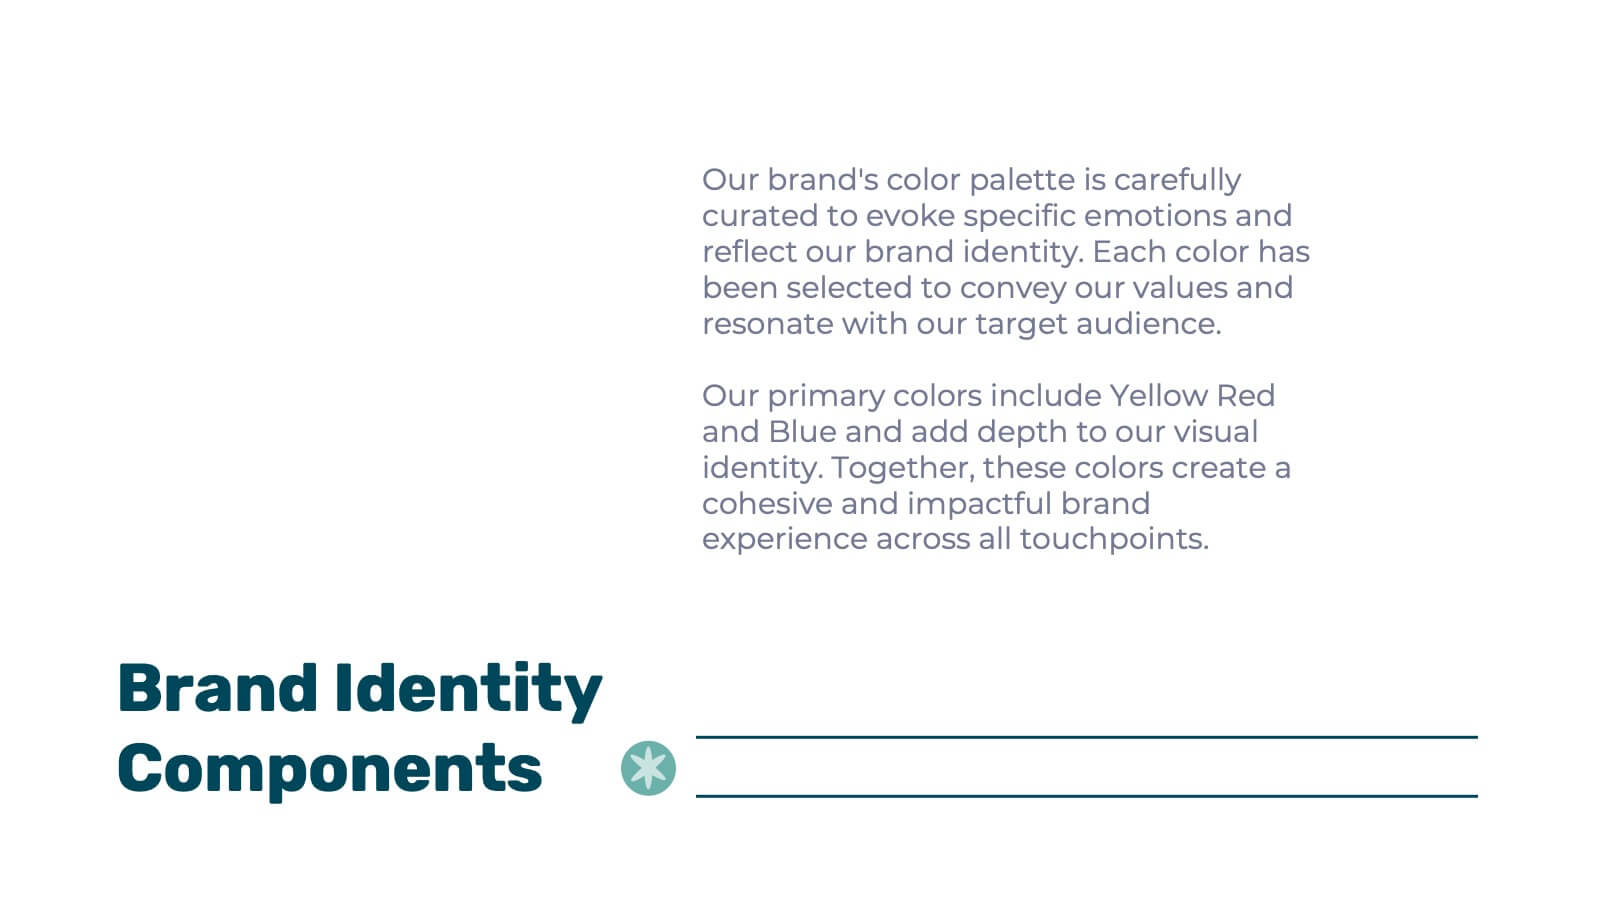
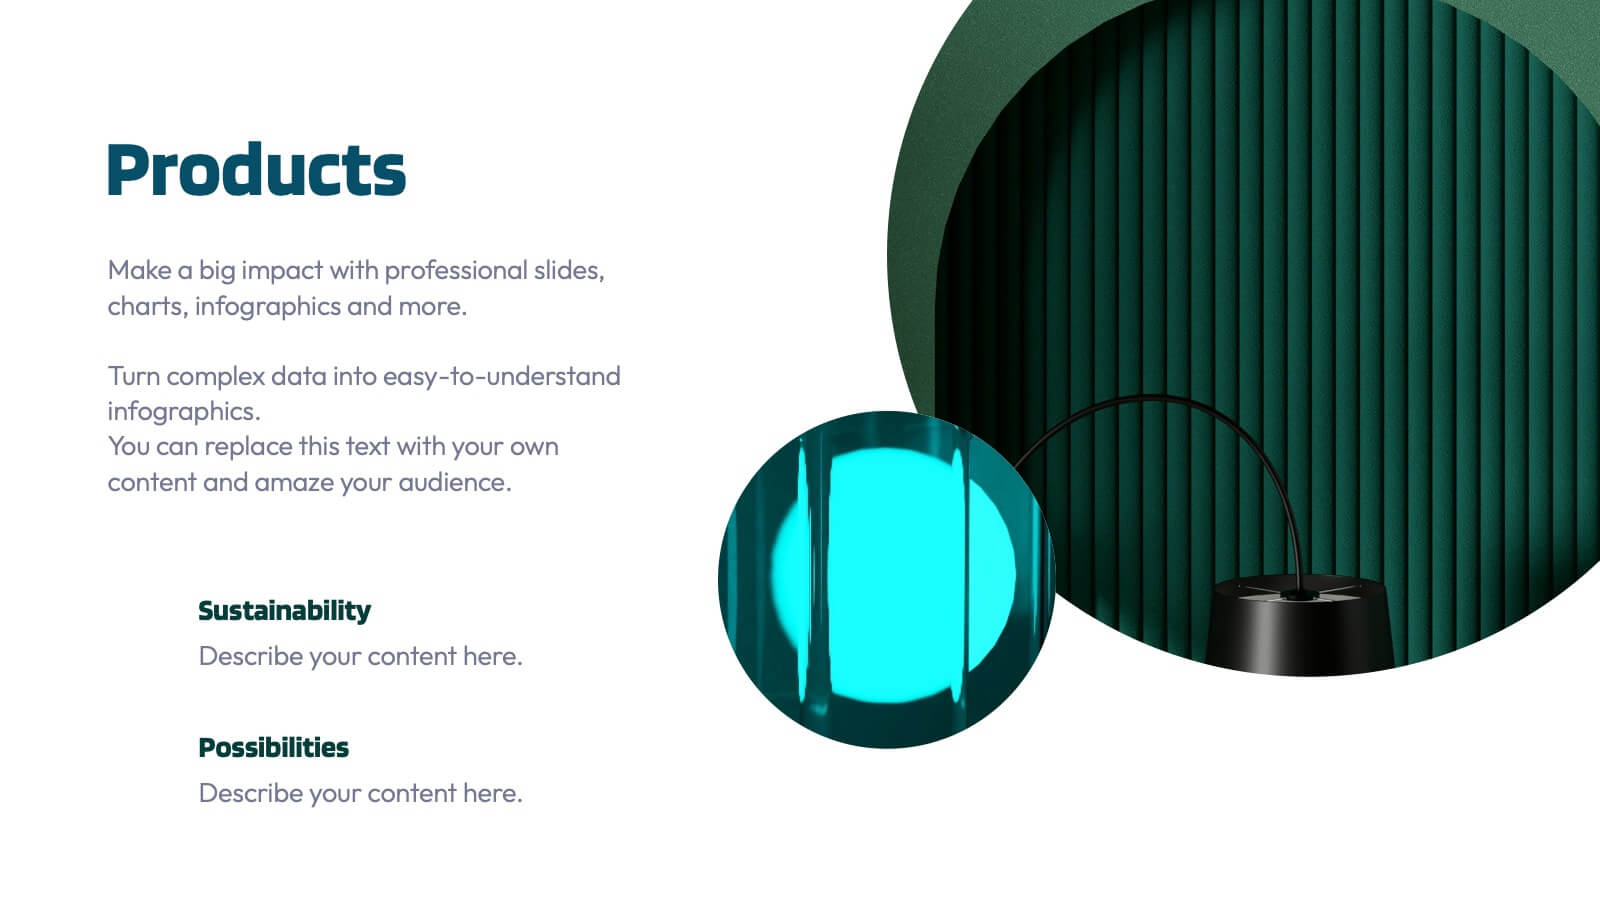
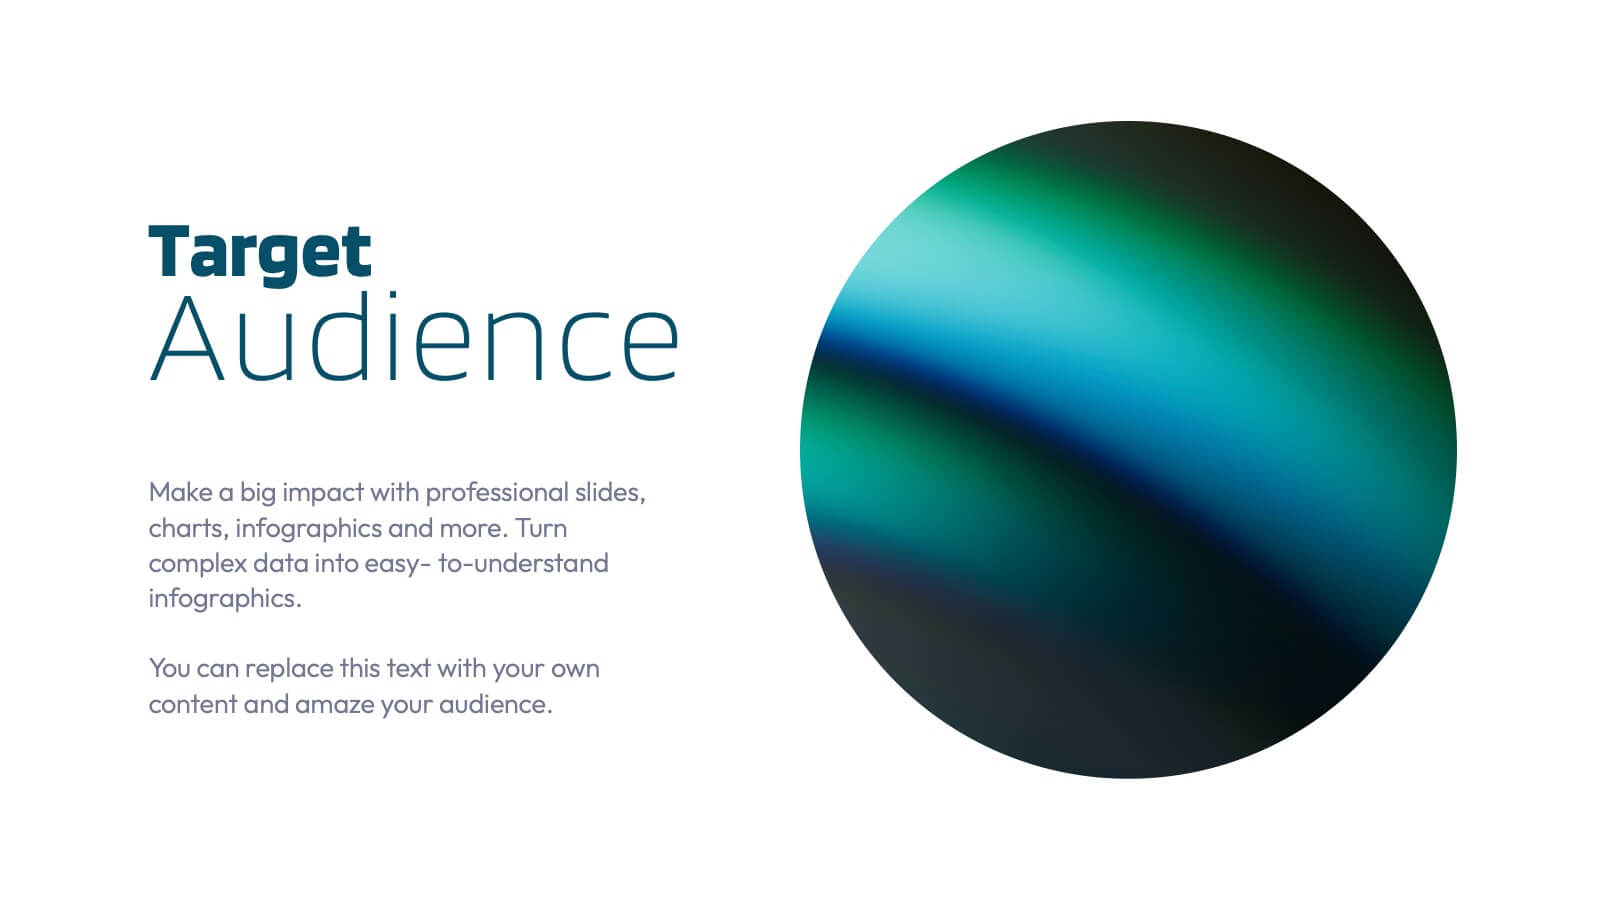
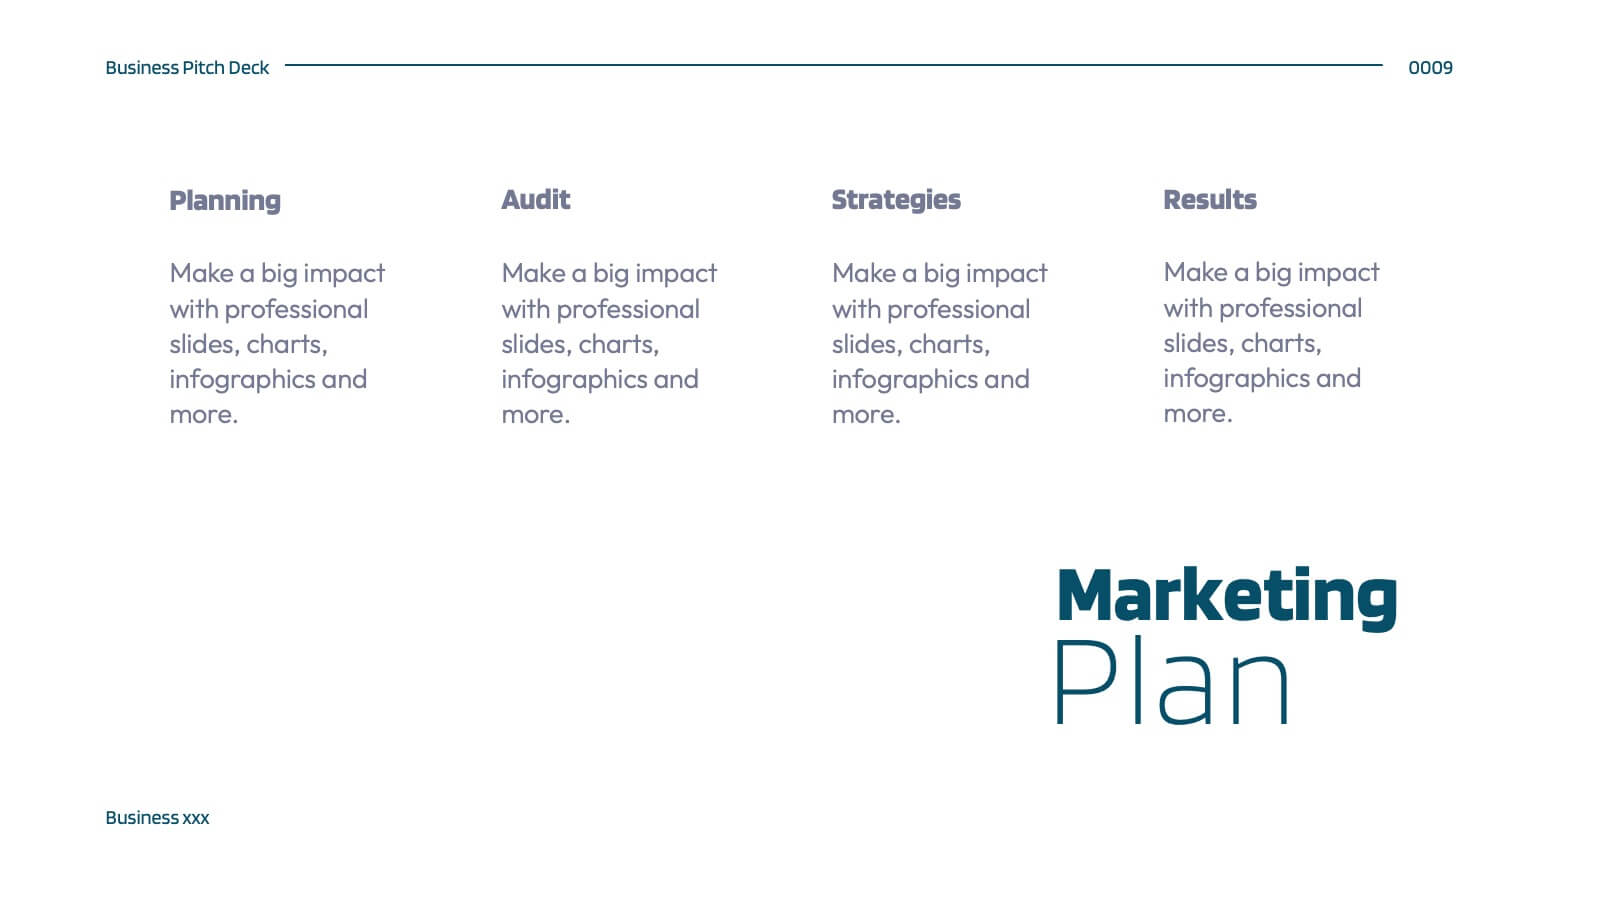
Hawking Brand Strategy Report Presentation
Introduce your brand's vision with this polished and professional strategy report presentation template. Designed for businesses, marketers, and branding agencies, it features comprehensive sections for communicating your brand identity, goals, and market positioning. This template highlights areas such as brand philosophy, target audience insights, competitive analysis, and visual identity systems. Showcase your brand’s unique selling proposition with engaging slides dedicated to colors, typography, logos, and packaging. With layouts tailored for presenting data, strategies, and case studies, you’ll ensure every aspect of your brand resonates clearly. Compatible with PowerPoint, Google Slides, and Keynote, this template is fully customizable to match your style and branding needs. Its clean, modern design and easy-to-edit structure make it a versatile choice for strategy reports, pitches, or team presentations. Elevate your branding efforts and communicate your story with confidence and clarity.

22 diapositivas
Hellenic Small Business Pitch Deck Presentation
Unleash the spirit of entrepreneurship with this captivating Hellenic-themed presentation! Designed specifically for small business pitches, this template allows you to showcase your business concept, market analysis, and financial plans with elegance and clarity. Its vibrant visuals will engage your audience and leave a lasting impression. Compatible with PowerPoint, Keynote, and Google Slides.


5 diapositivas
Employee Training Needs Presentation
Spark growth and strengthen team performance with a clear visual guide that highlights skill gaps, development priorities, and learning pathways. This presentation helps HR and managers map essential competencies and plan impactful training programs. Perfect for performance reviews and workforce planning. Fully compatible with PowerPoint, Keynote, and Google Slides.


22 diapositivas
Arcflare Digital Agency Strategy Plan Presentation
Create a powerful strategy with this digital agency plan presentation! It features key sections like market analysis, industry trends, campaign execution, and client testimonials, helping you communicate your approach clearly. Perfect for strategy meetings or client pitches, this template is fully compatible with PowerPoint, Keynote, and Google Slides.


8 diapositivas
Employee Training and Development Presentation
Optimize your team's growth with the 'Employee Training and Development' presentation template. This layout strategically organizes training modules, showcasing clear pathways for skills enhancement and career progression. Compatible with PowerPoint, Keynote, and Google Slides, it's ideal for delivering engaging and instructional corporate training sessions.


19 diapositivas
Fableia Marketing Research Report Presentation
Deliver data-driven insights with a professional and visually engaging marketing research report presentation. This template is tailored for marketing professionals, agencies, and businesses looking to showcase research findings with precision and clarity. Highlight key sections such as market trends, consumer behavior analysis, and campaign performance using dynamic visuals and well-structured layouts. Share your insights on emerging technologies, social media strategies, and customer targeting with easy-to-edit graphs, charts, and infographics. Use dedicated slides for SEO analytics, value propositions, and recommendations to present actionable strategies that resonate with your audience. This template is fully customizable and works seamlessly with PowerPoint, Google Slides, and Keynote, ensuring you can adapt it to your unique needs. Present your research with confidence and leave a lasting impact on stakeholders and decision-makers.


5 diapositivas
Customer Behavior and Demographics Presentation
Break down customer segments with clarity using this behavior and demographics infographic set. Featuring colorful cylinder diagrams and intuitive labels, these slides are ideal for presenting consumer insights, age groups, behavior trends, and buyer types. Fully editable in PowerPoint, Keynote, and Google Slides—perfect for marketers, analysts, and business development teams.


20 diapositivas
Oscillation Project Proposal Presentation
This project proposal template is designed to captivate your audience with a bold purple and yellow color scheme, adding a modern flair to your presentation. It includes comprehensive sections like company overview, objectives and goals, methodology, deliverables, and budget breakdown. Perfect for clearly communicating your project vision and strategy, this template streamlines your content while highlighting your professional approach. Compatible with PowerPoint, Keynote, and Google Slides, it provides versatility for seamless delivery across platforms.


5 diapositivas
Projects Milestone Timeline Presentation
Kickstart your story with a clean, engaging timeline that makes every achievement feel purposeful and easy to follow. This presentation helps you outline major milestones, track progress, and communicate project goals with clarity and structure. Ideal for planning, reporting, and strategy sessions. Fully compatible with PowerPoint, Keynote, and Google Slides.


4 diapositivas
Sports Metrics and Training Goals Presentation
Track, analyze, and present athletic performance with the Sports Metrics and Training Goals template. Featuring bar charts and a sports court graphic, this design is ideal for visualizing statistics, strategies, and progress. Fully customizable in Canva, PowerPoint, and Google Slides to align with your team’s branding and performance objectives.


21 diapositivas
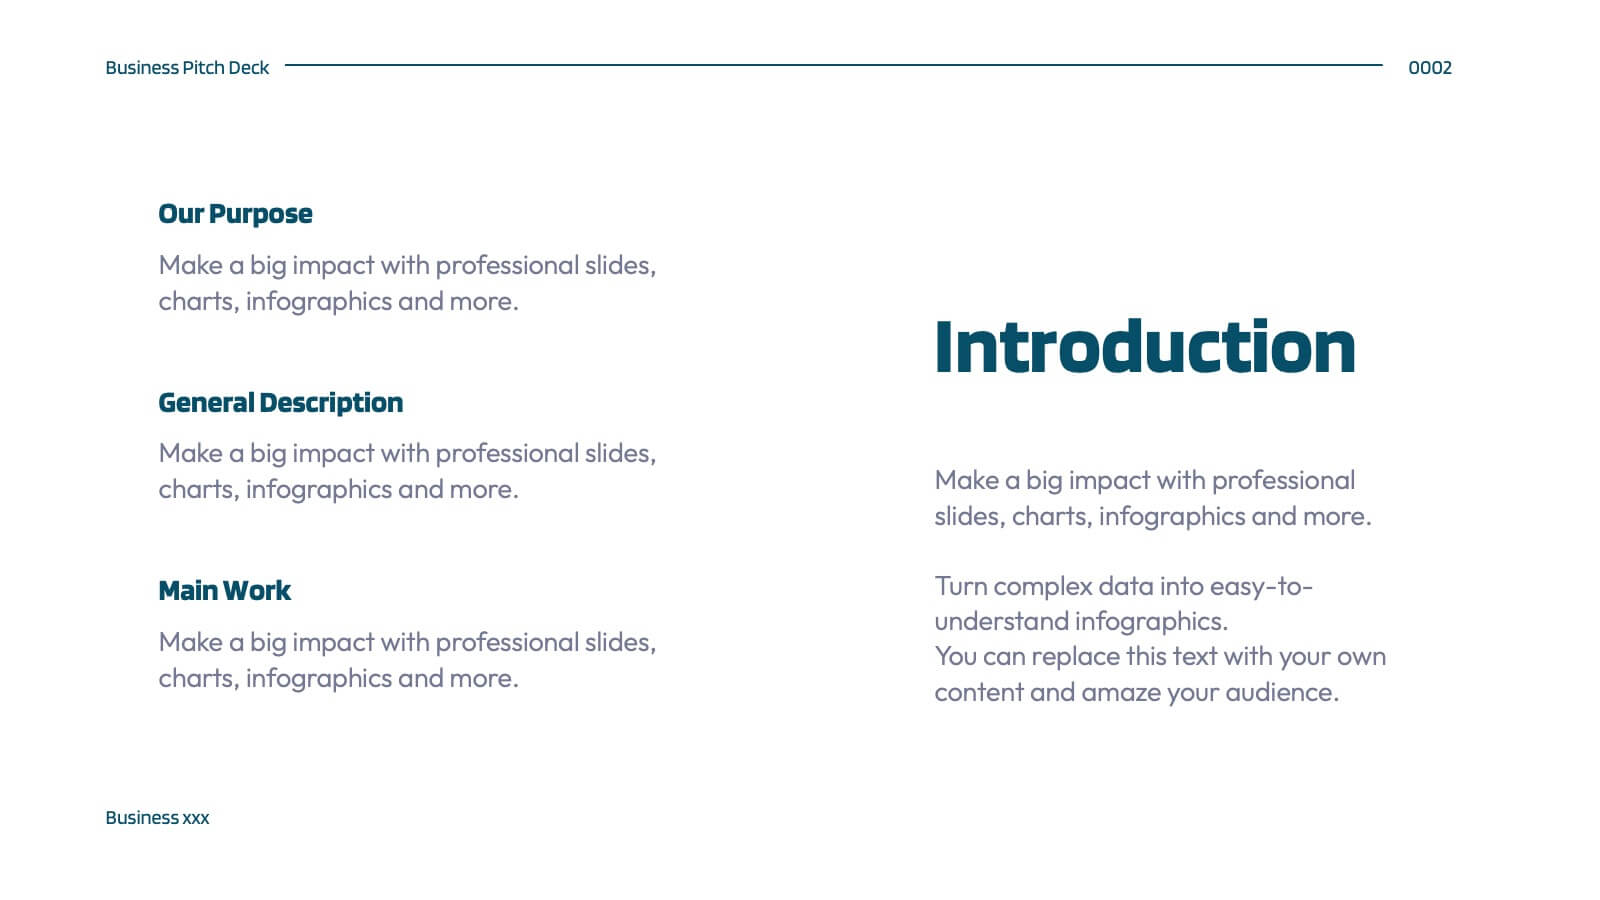
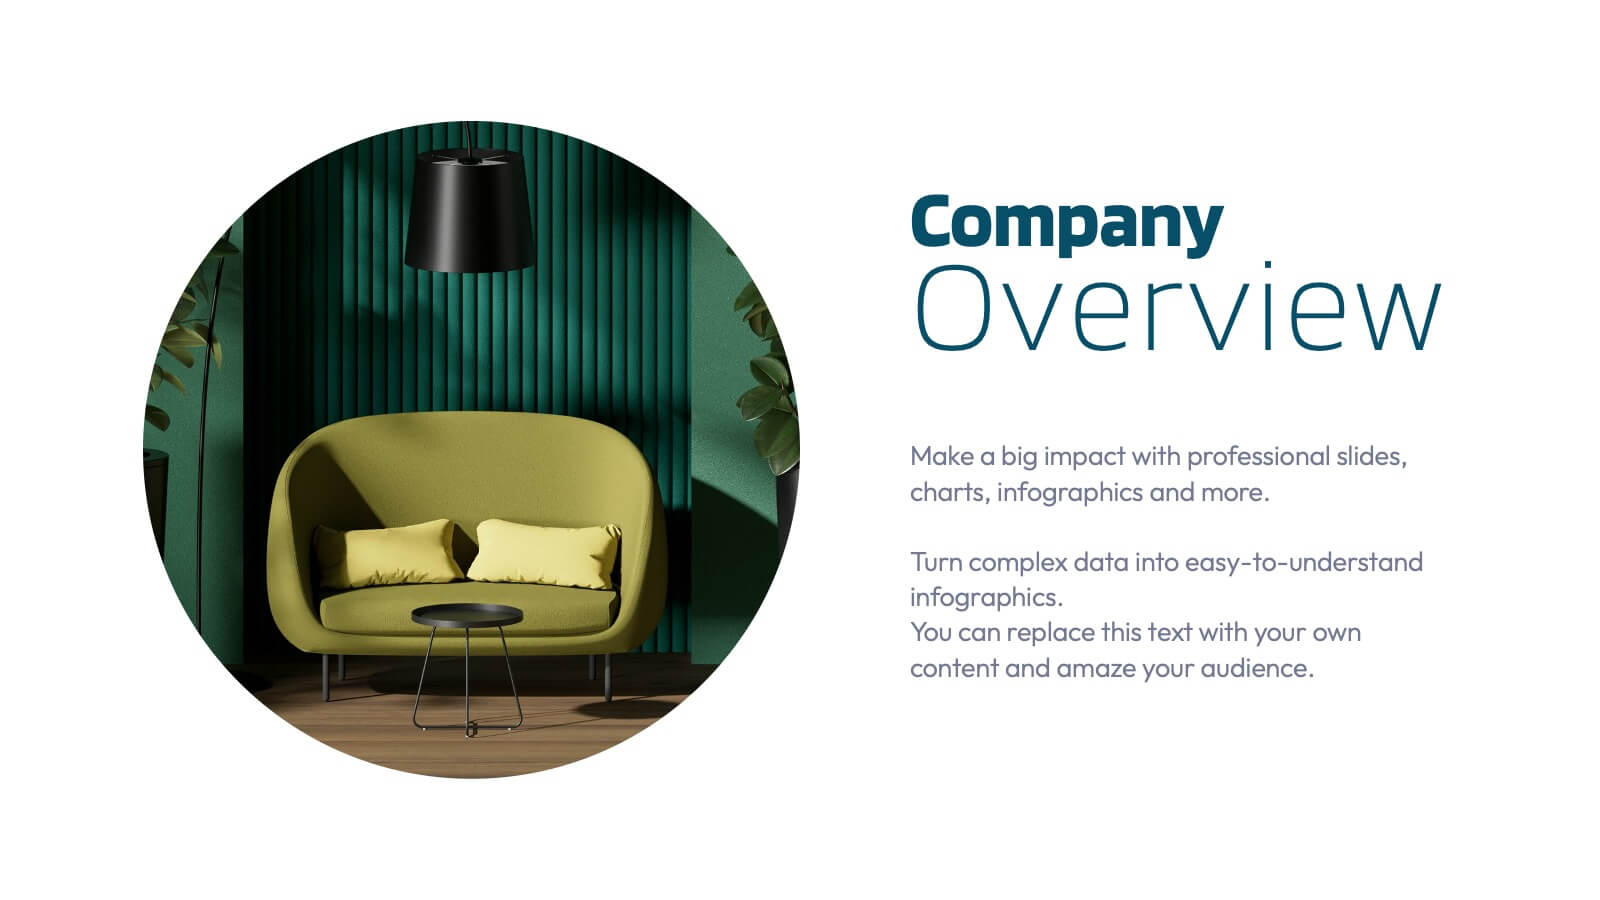
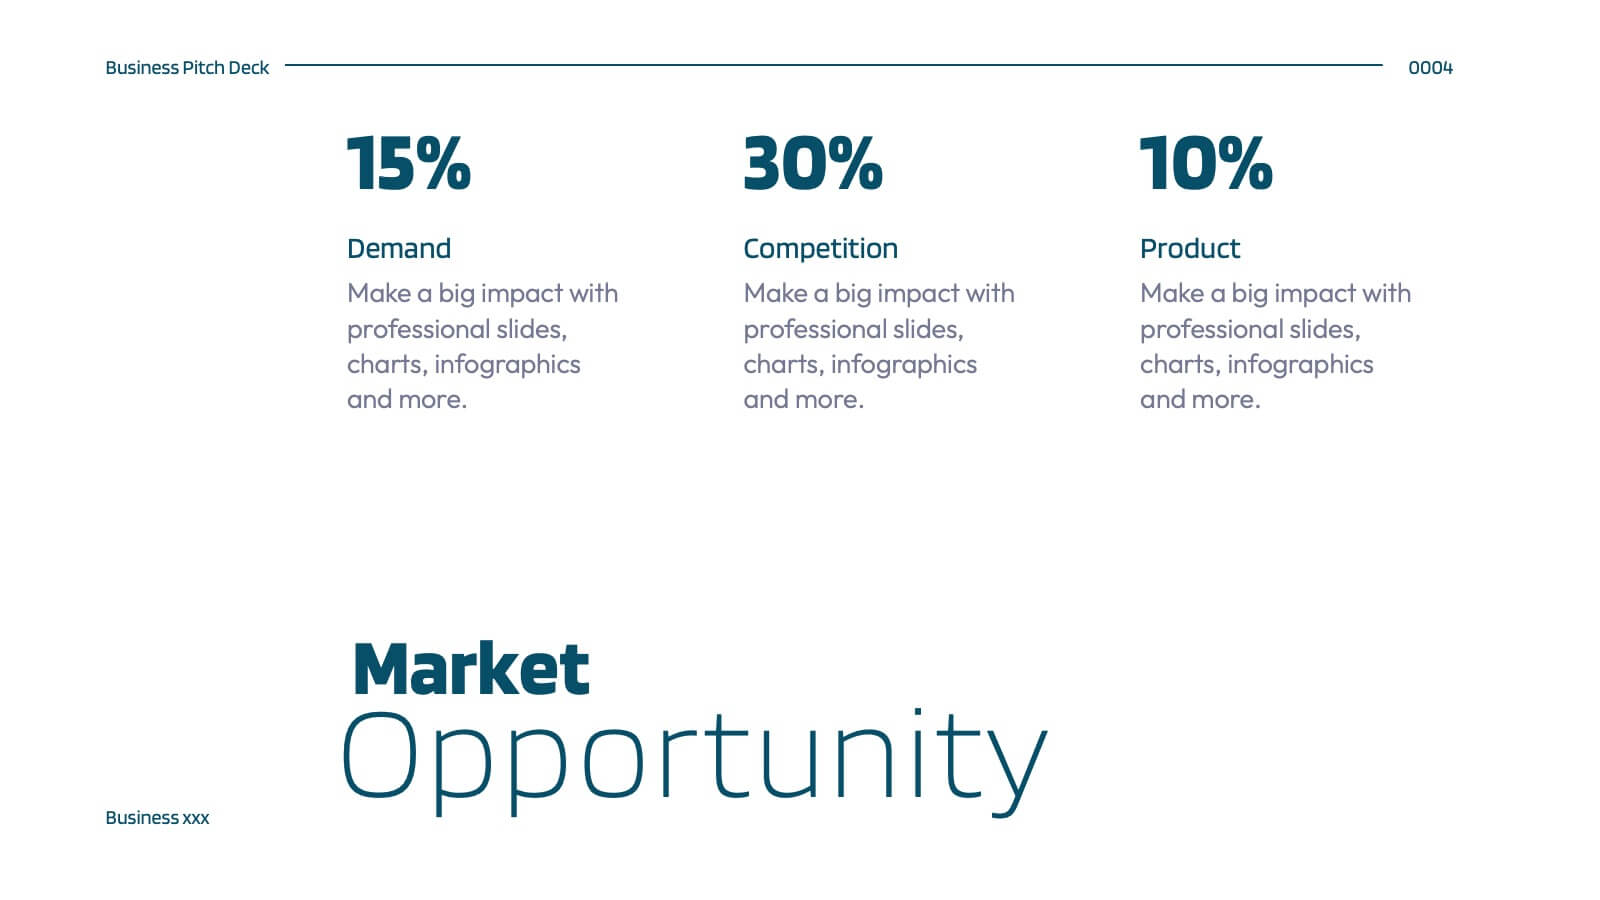
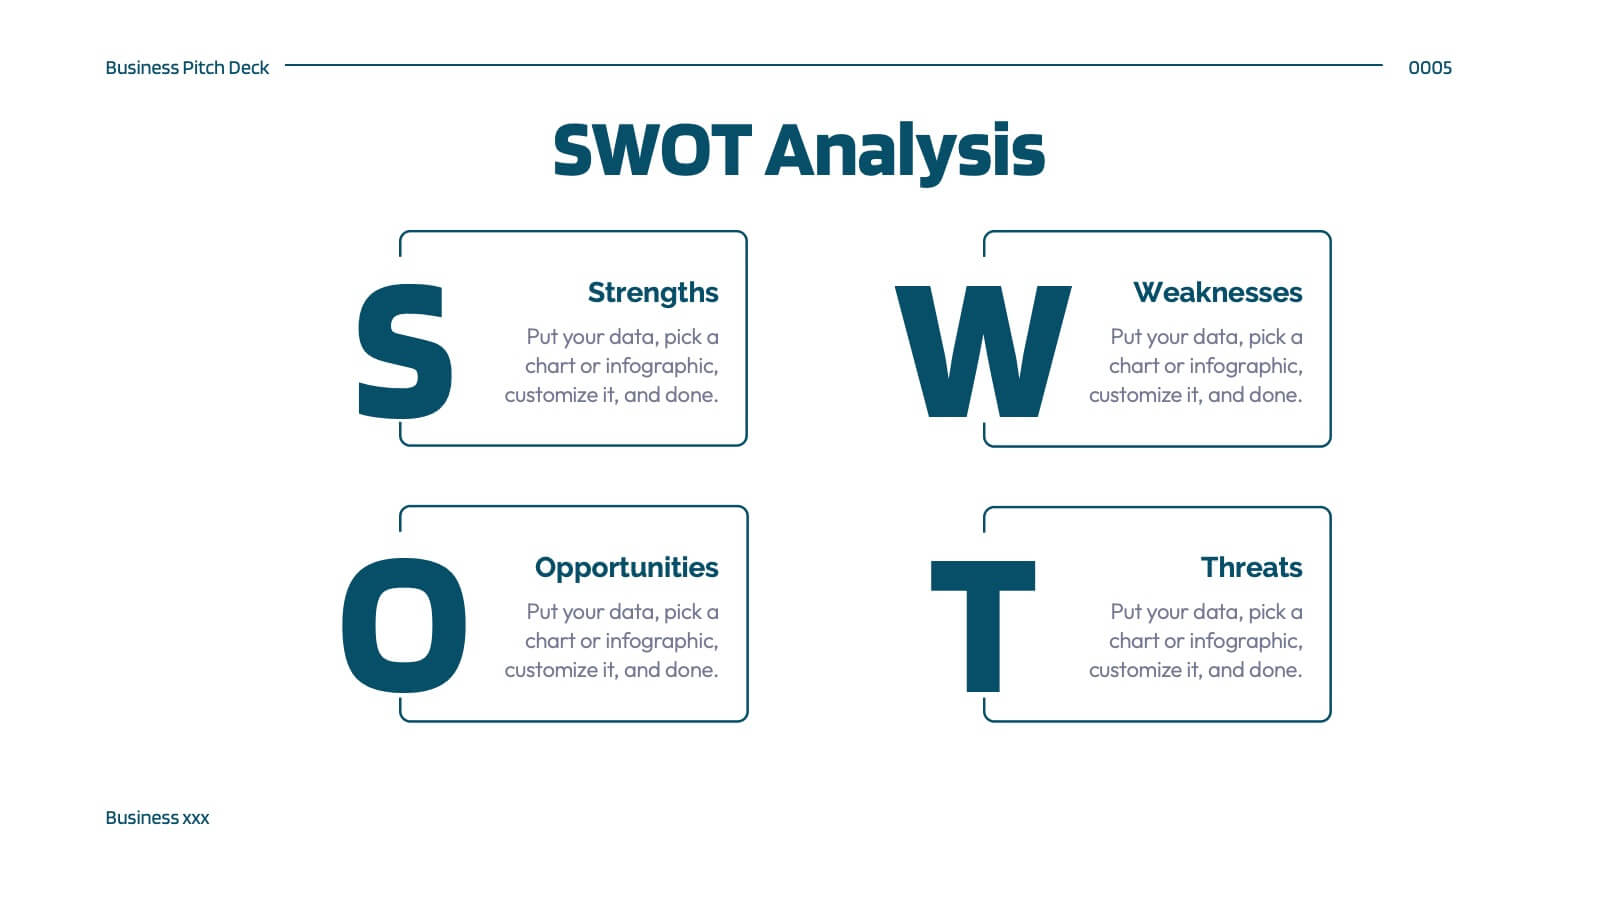
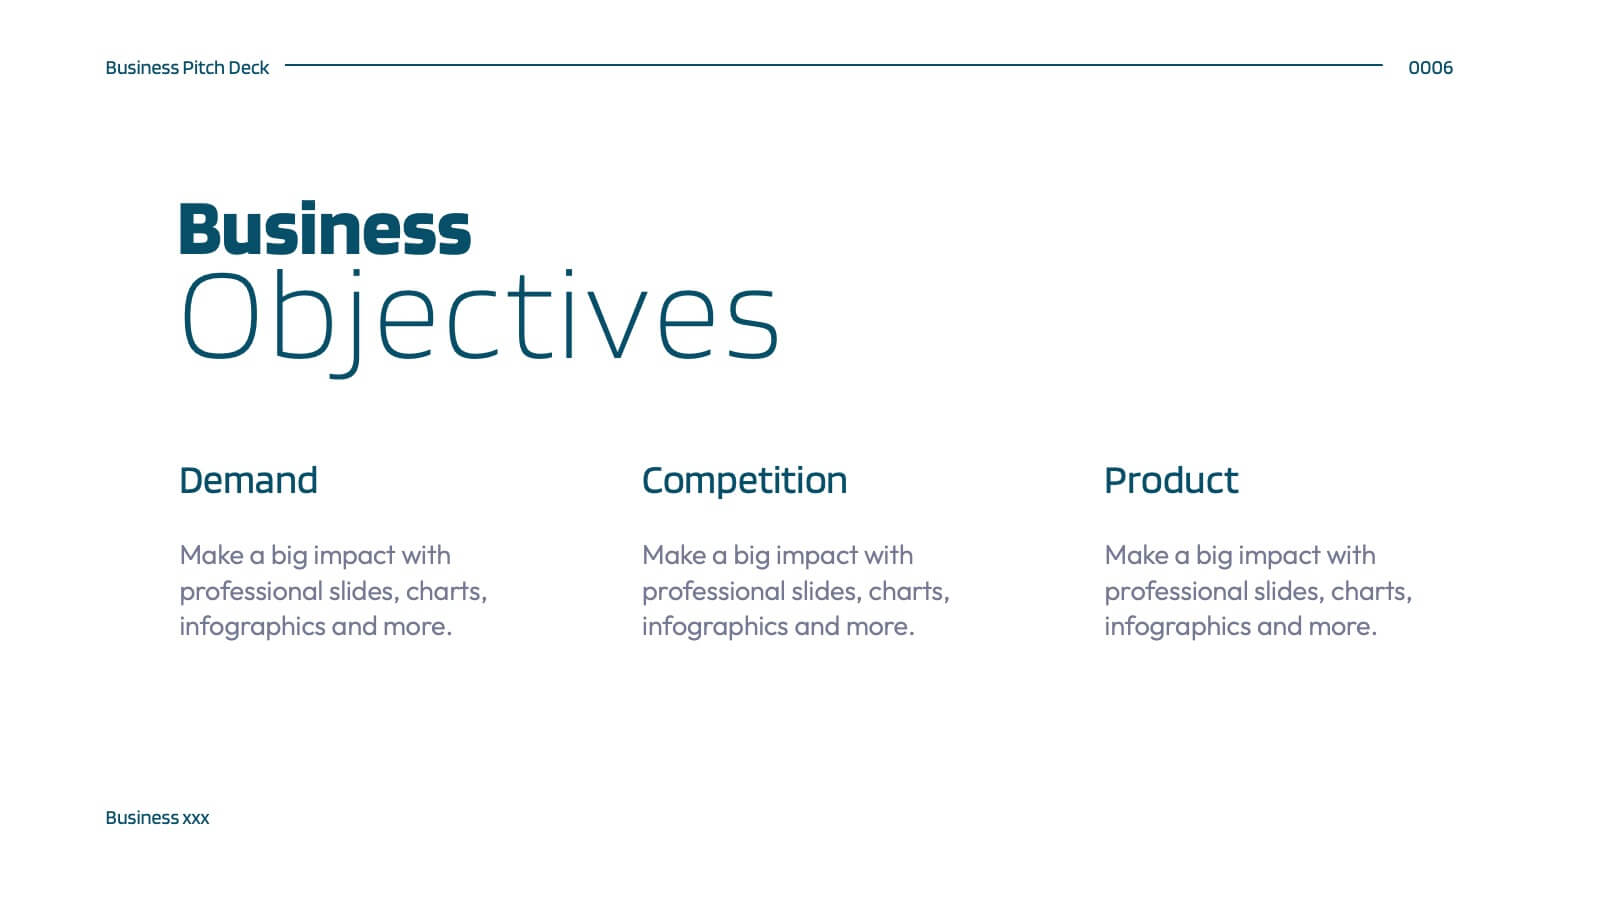
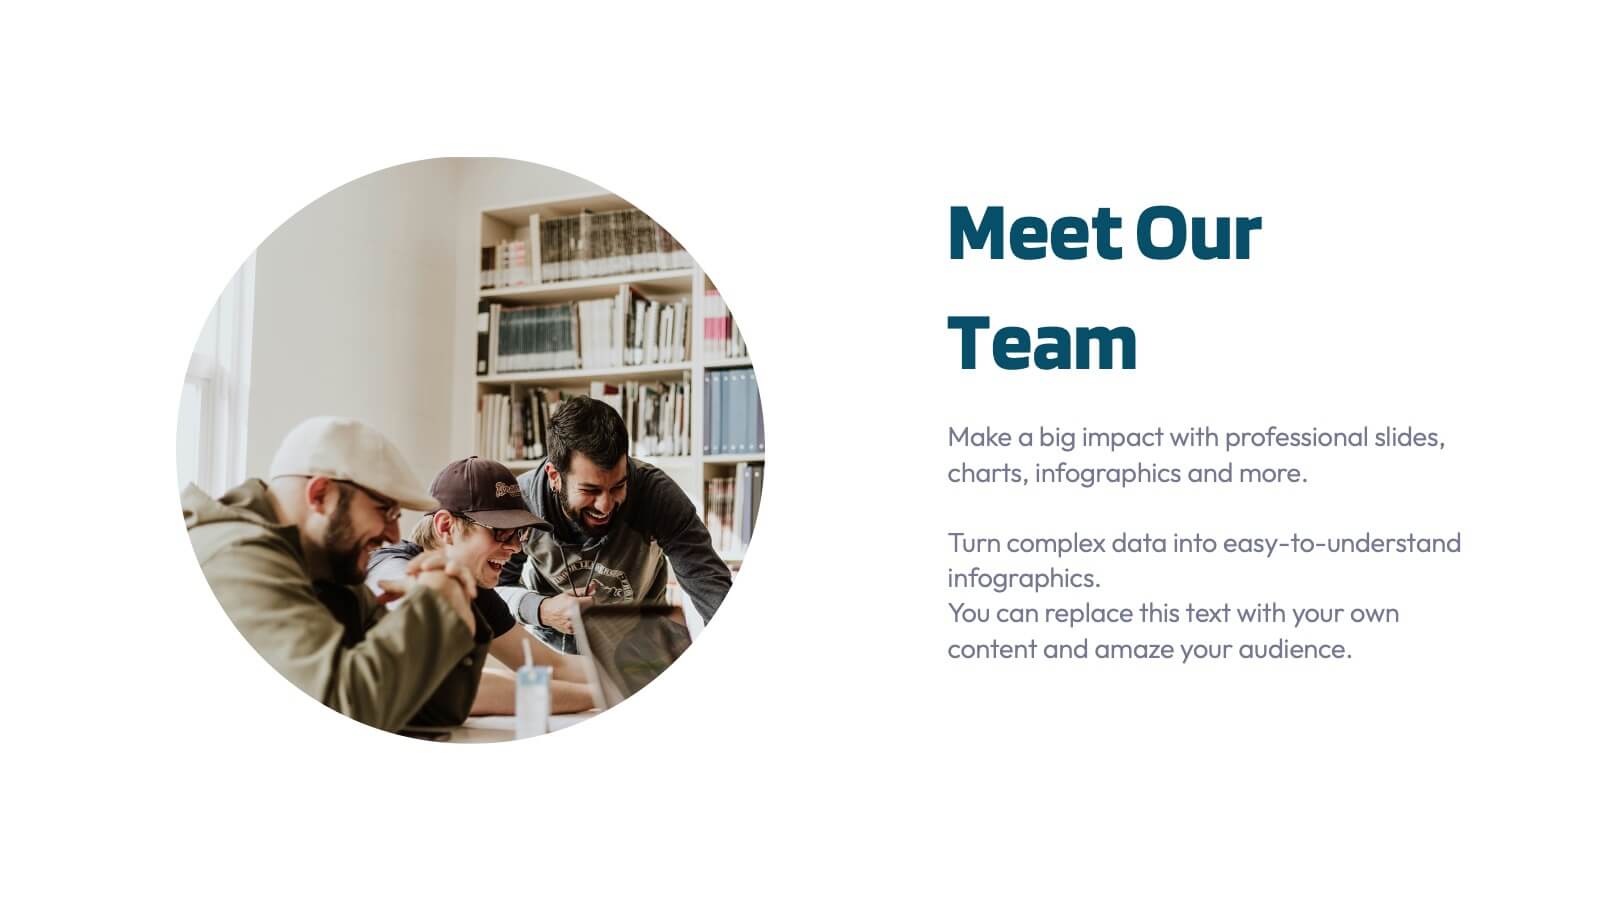
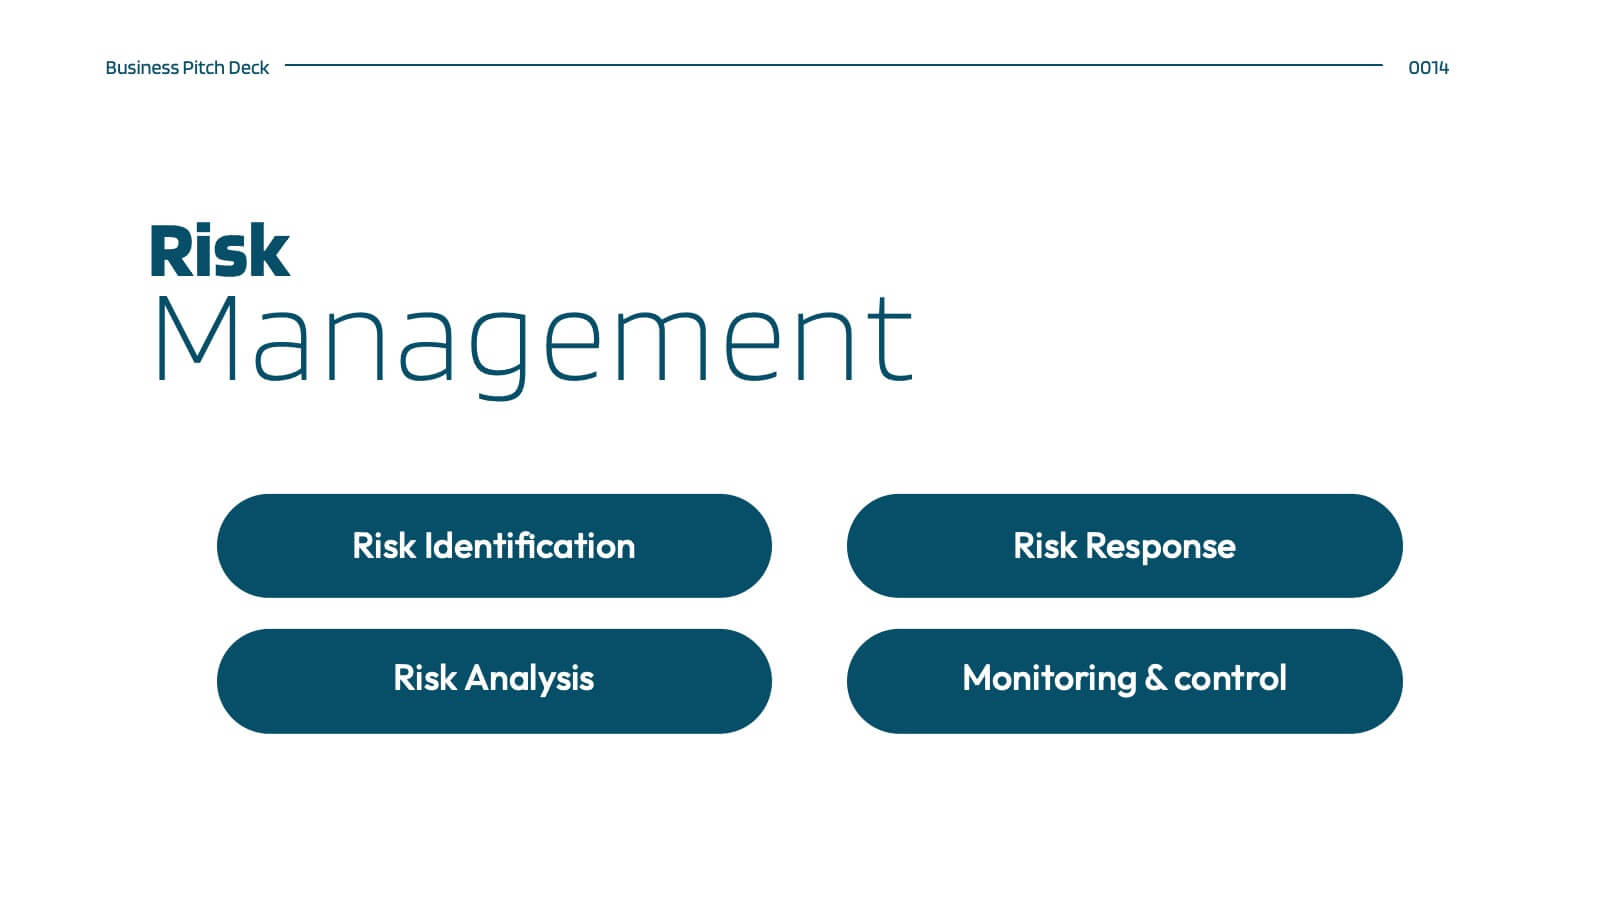
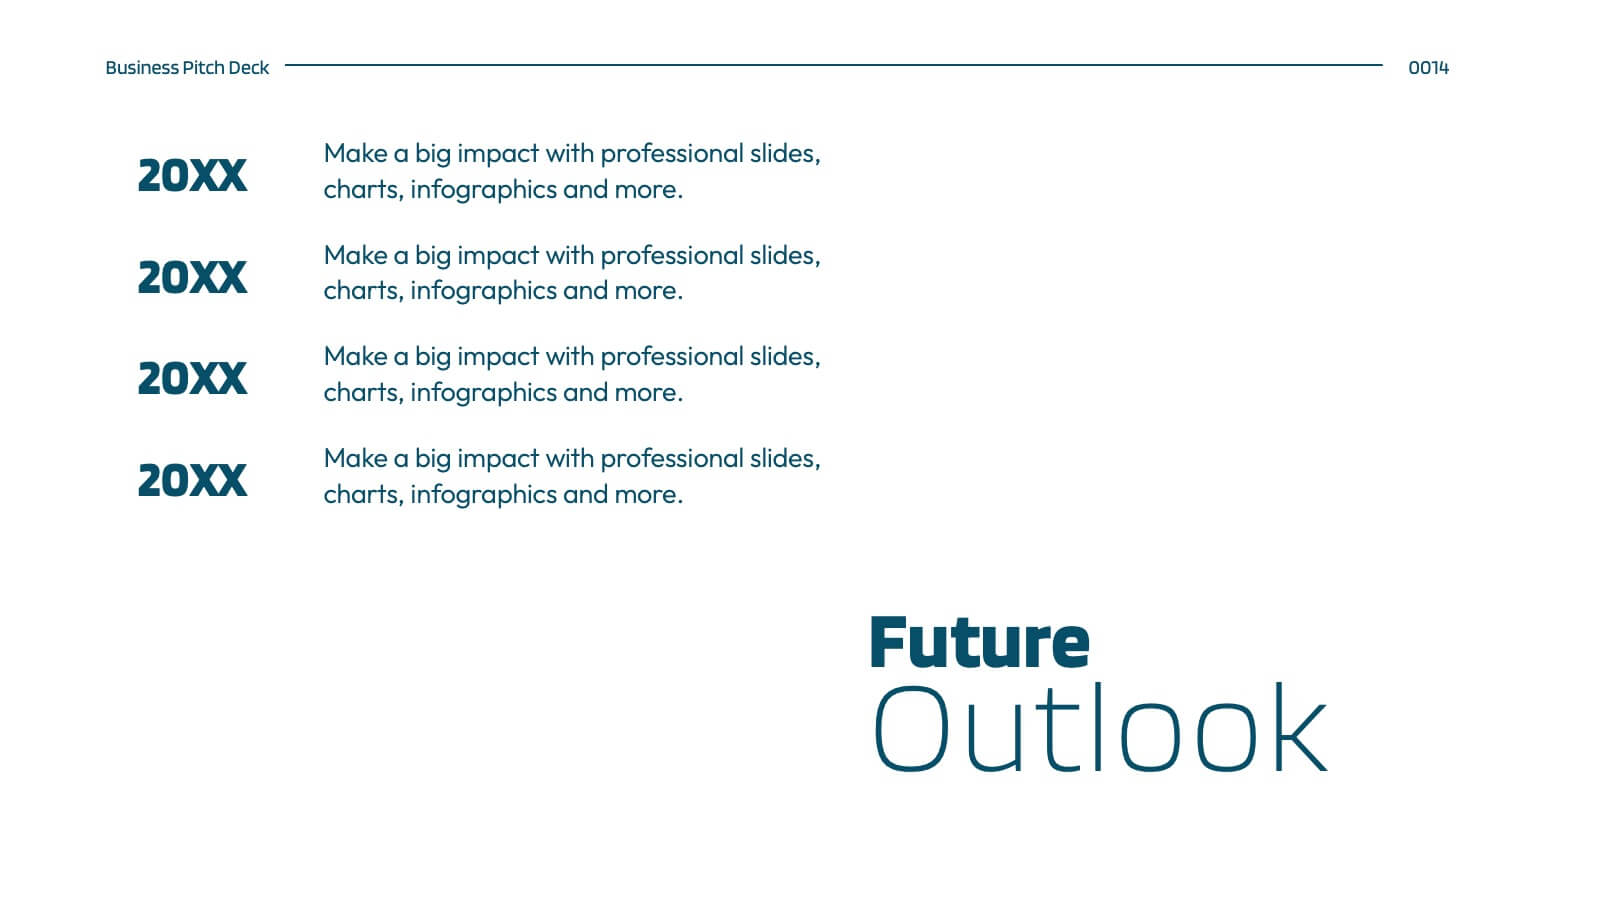
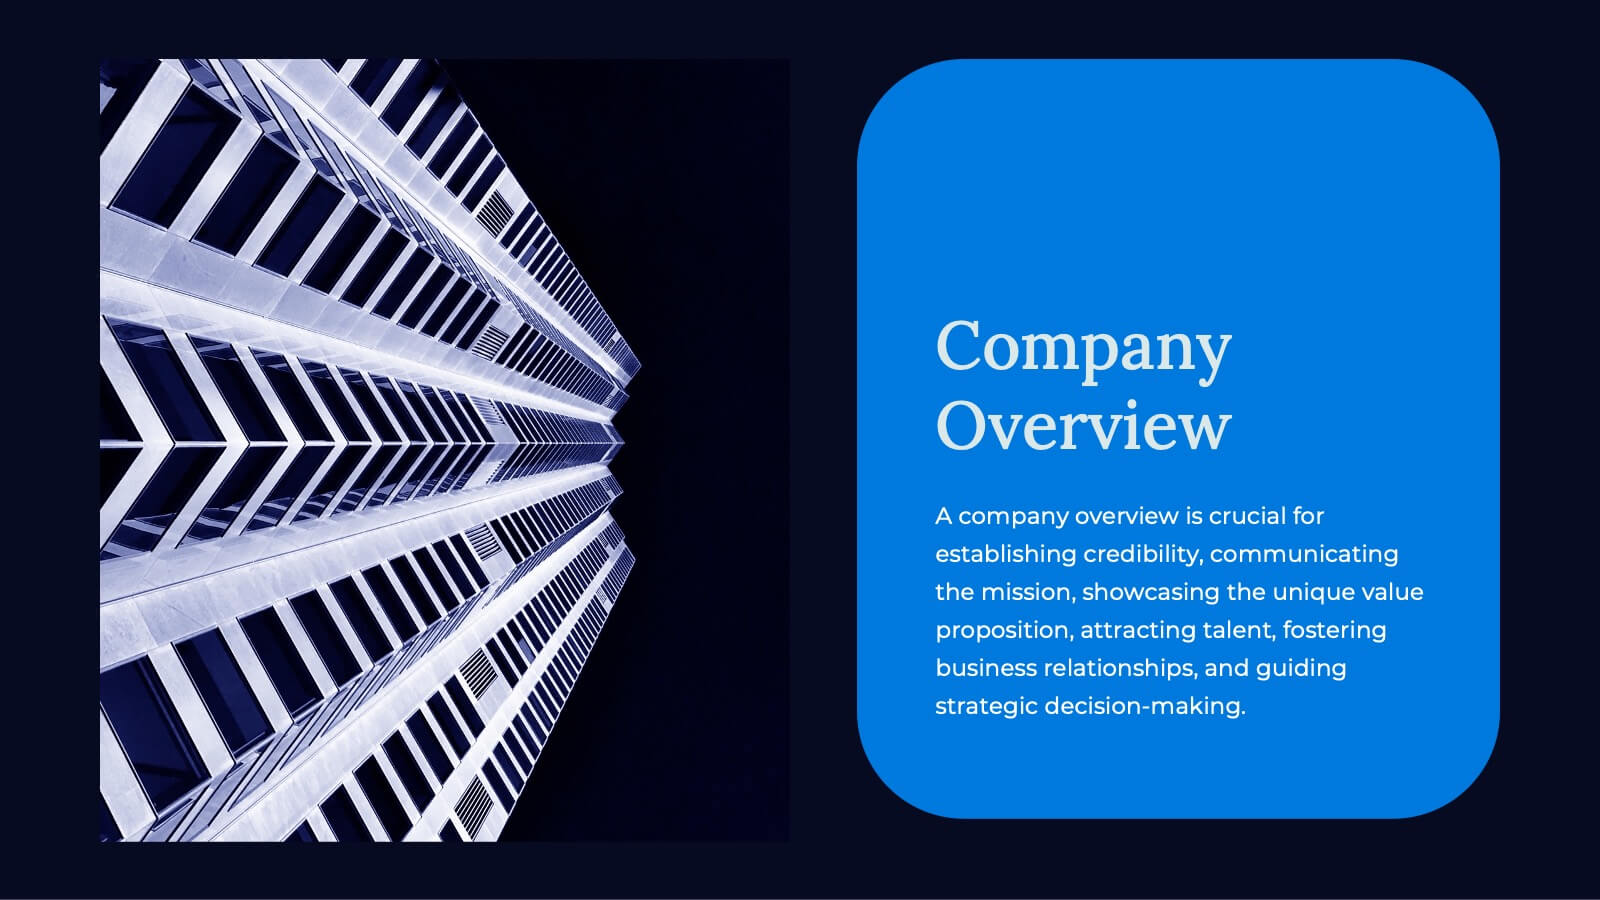
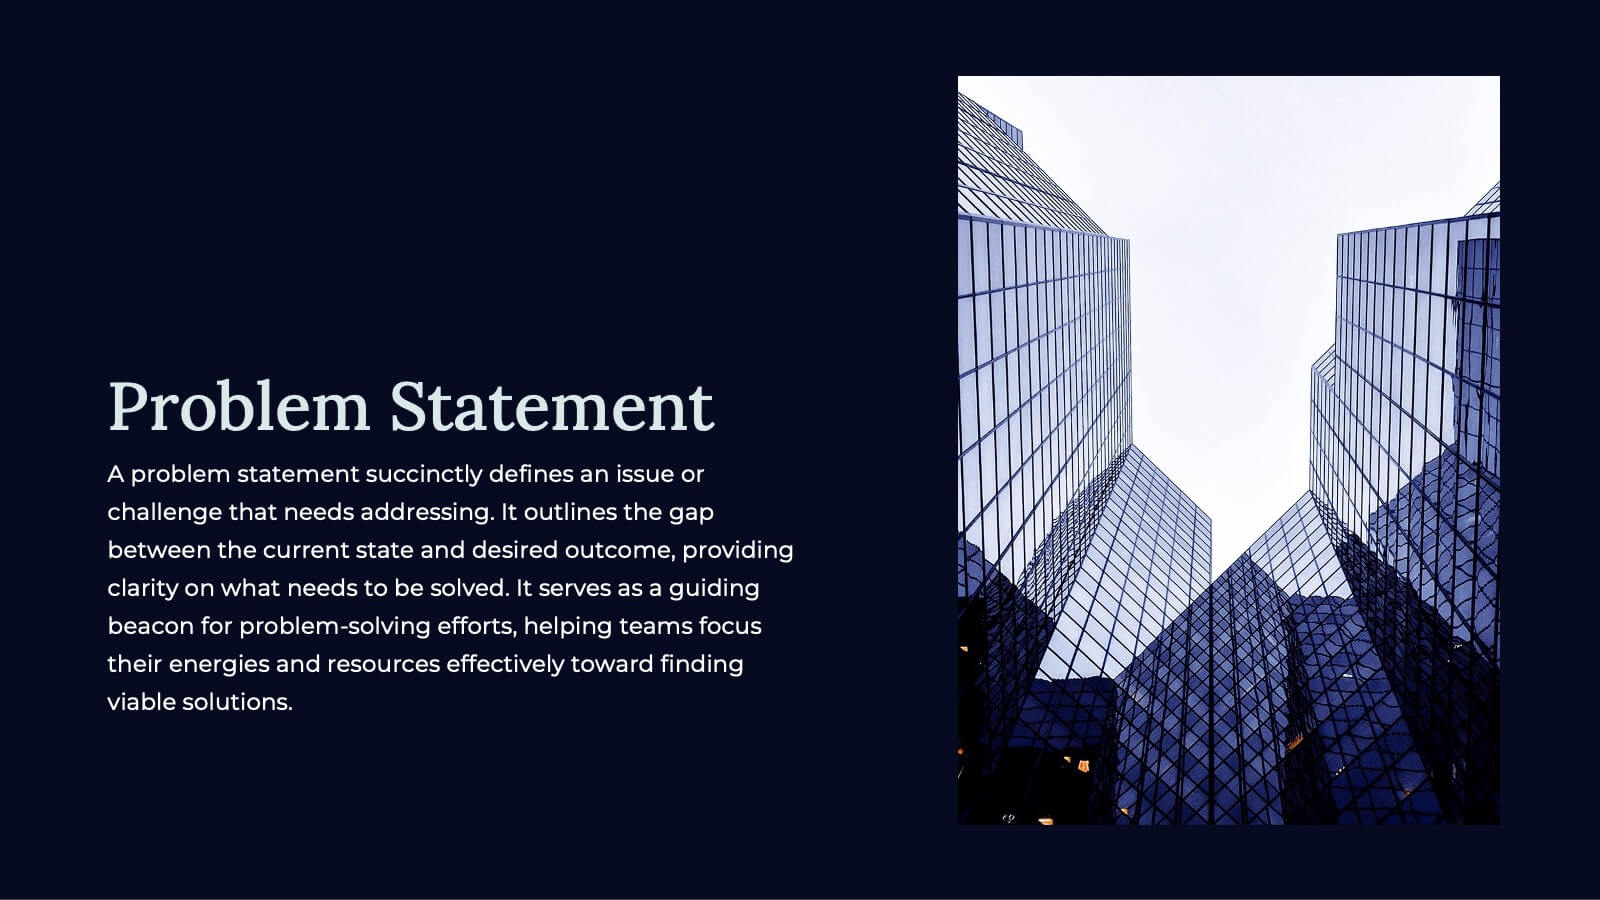
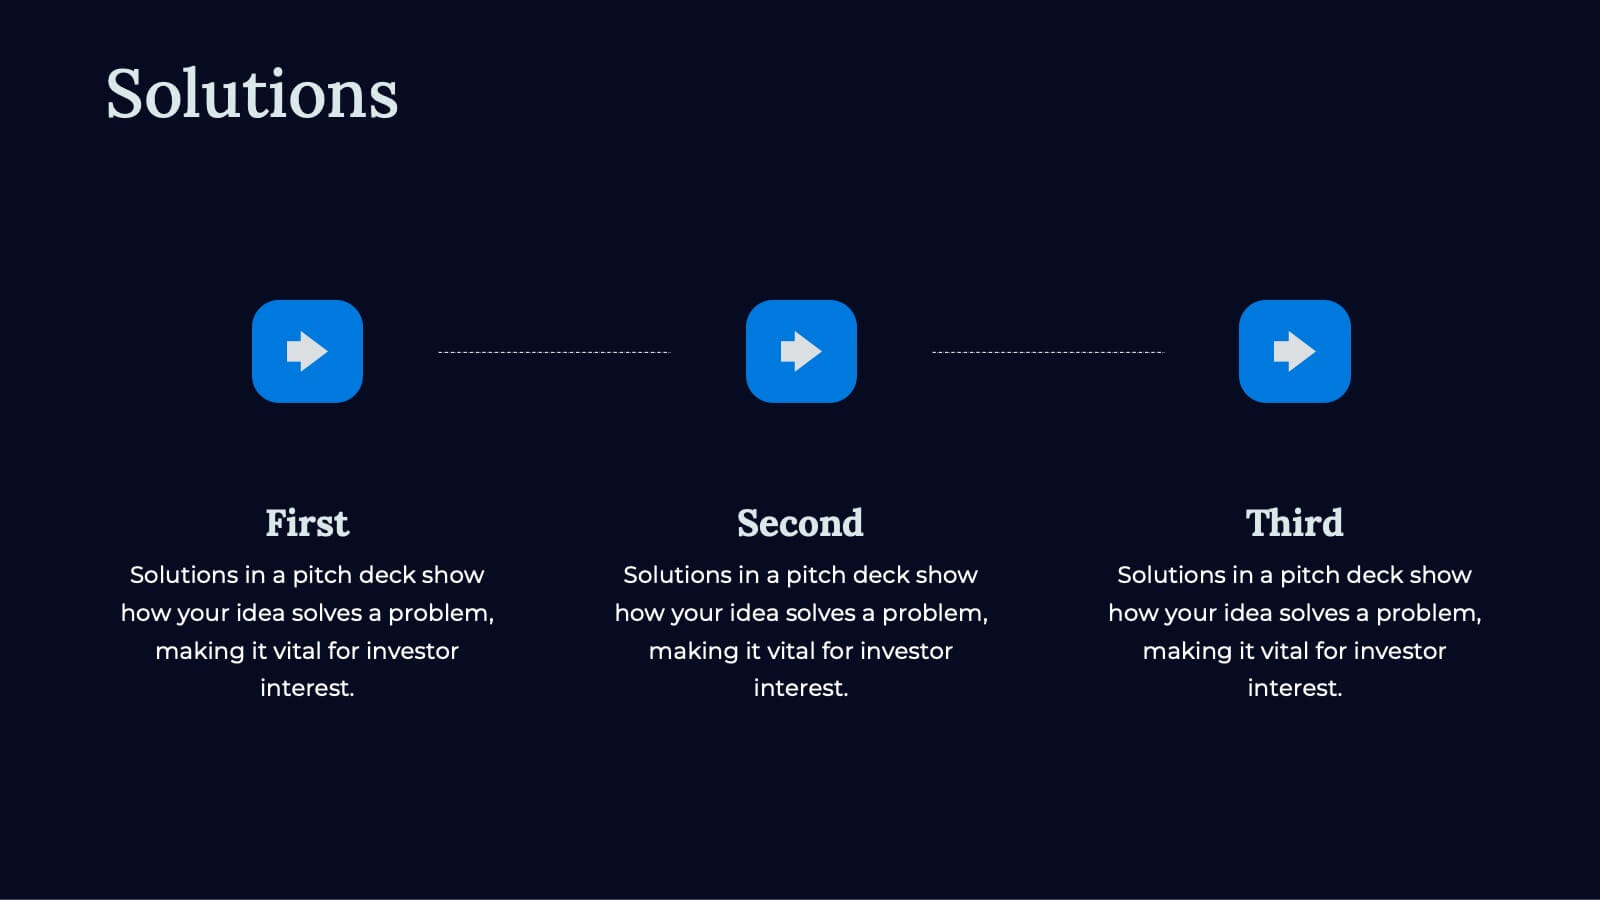
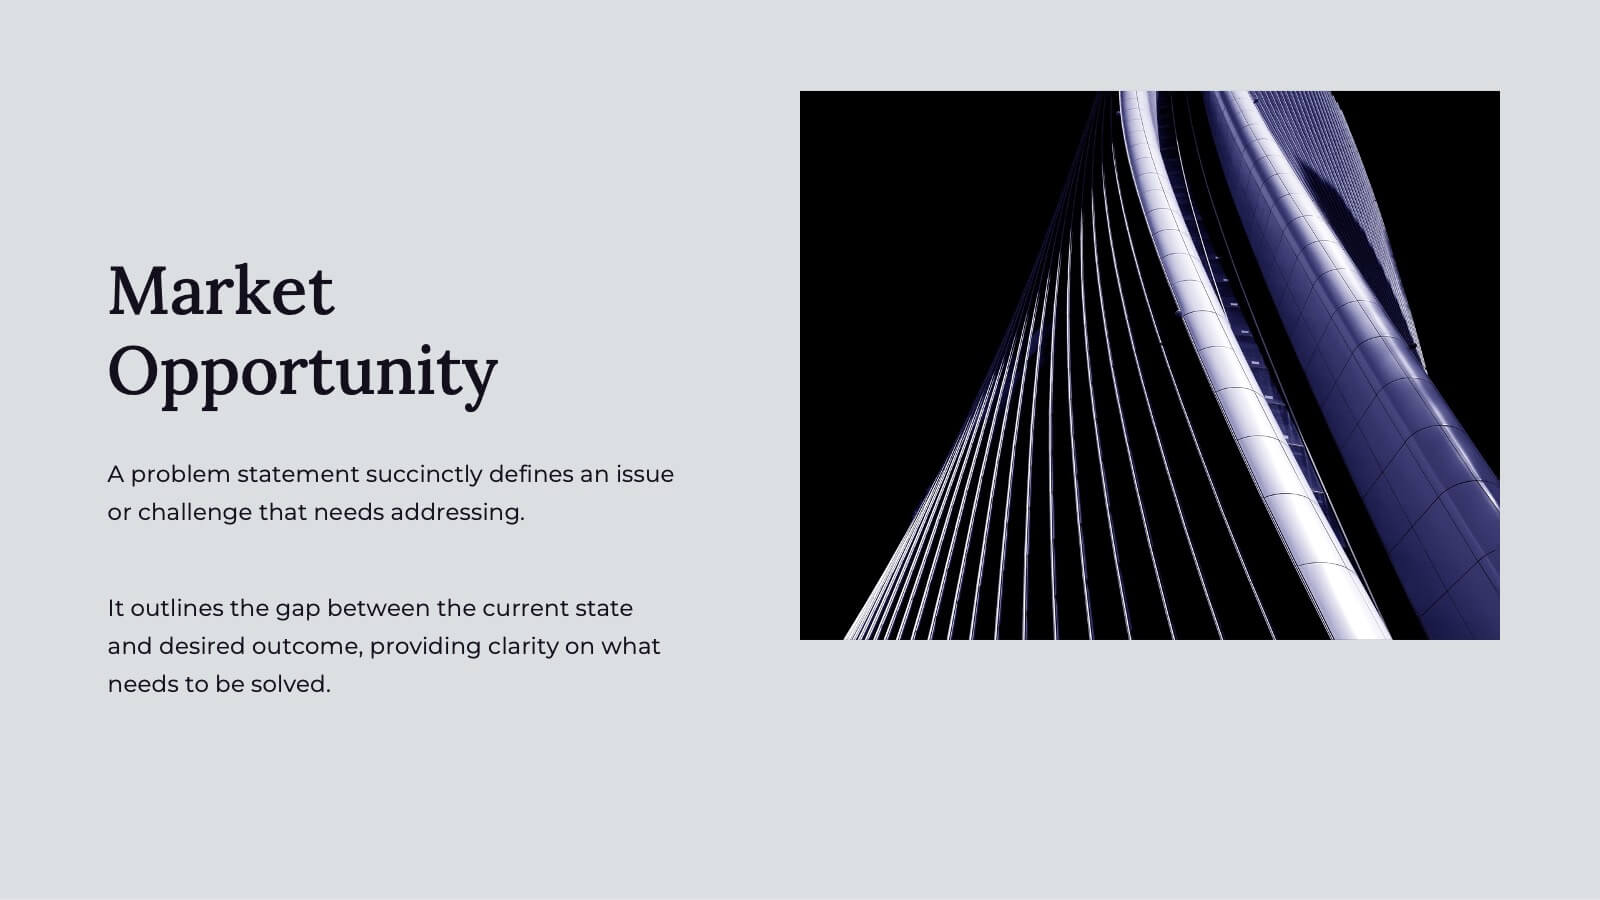
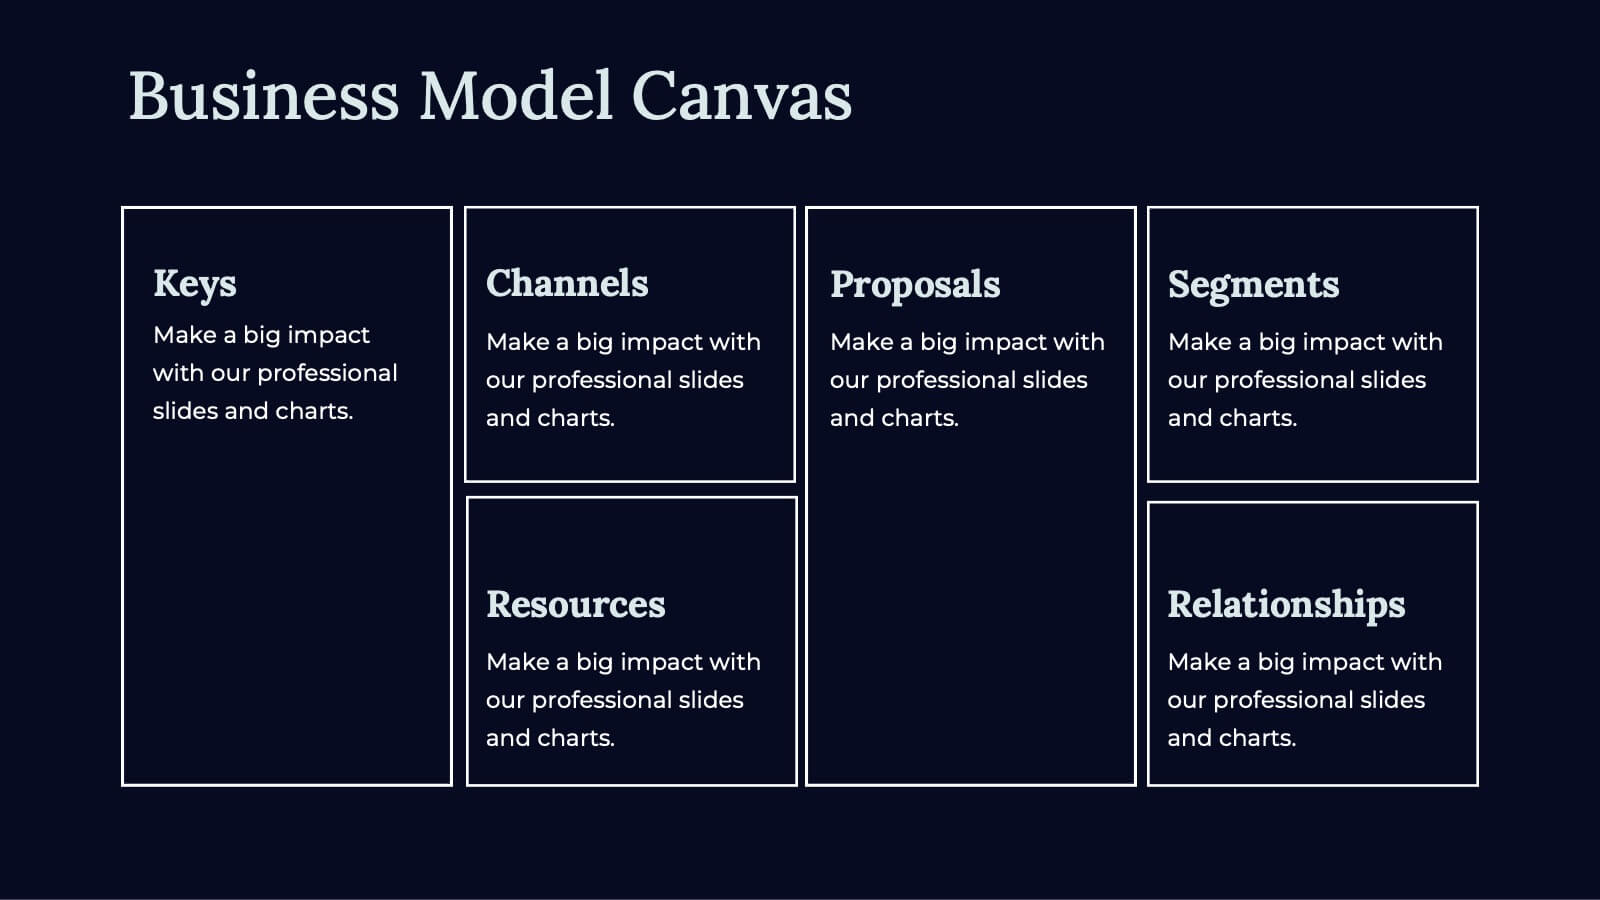
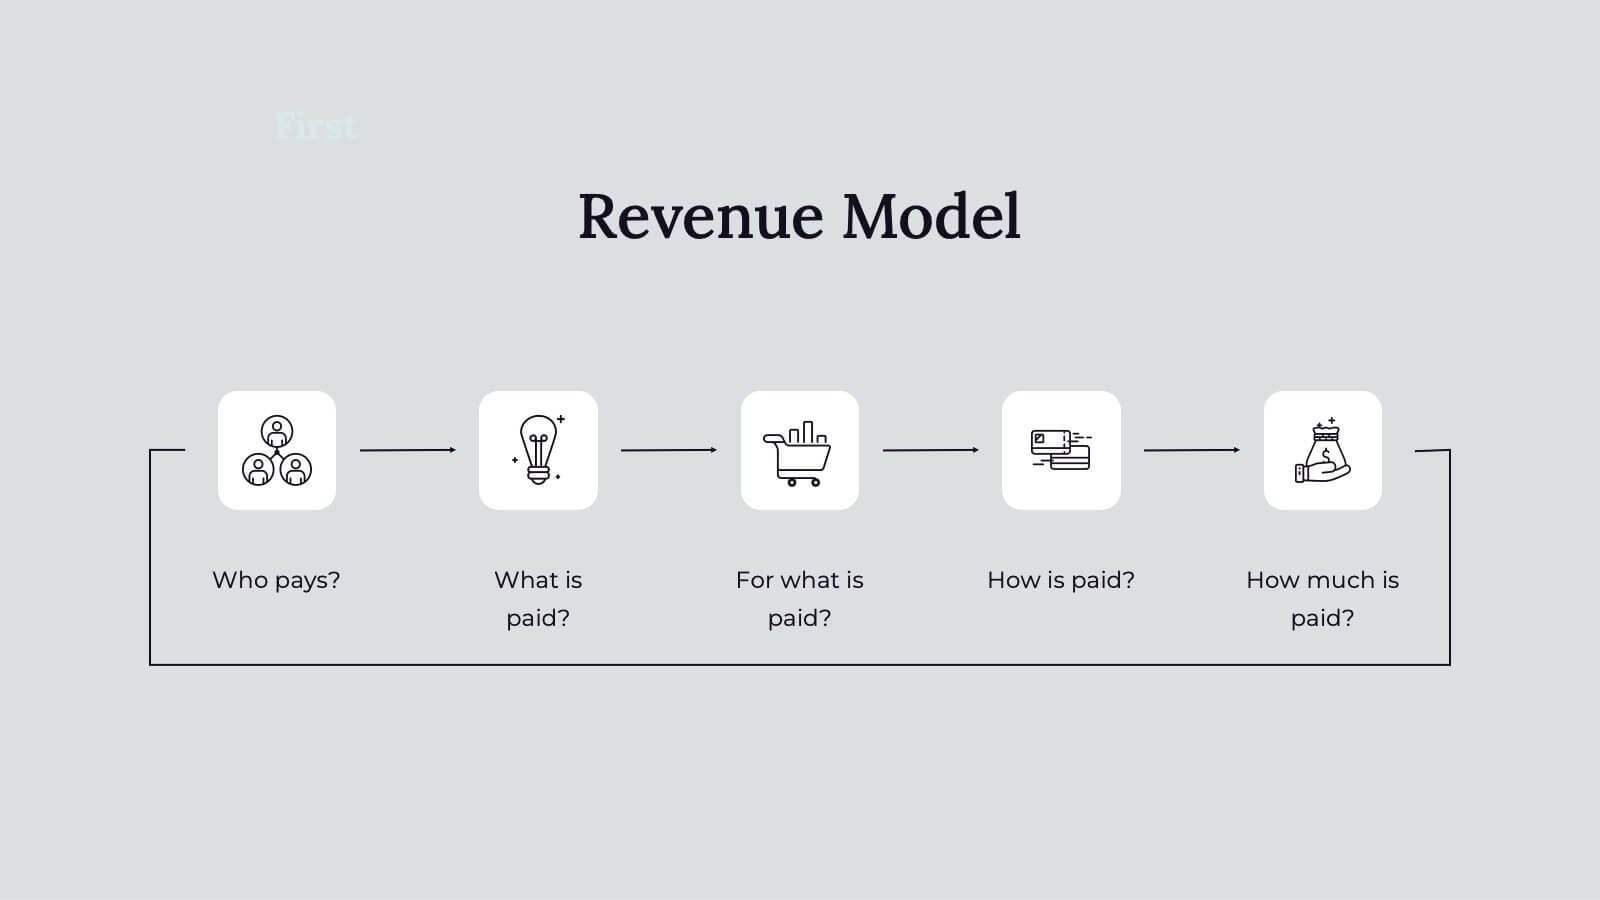
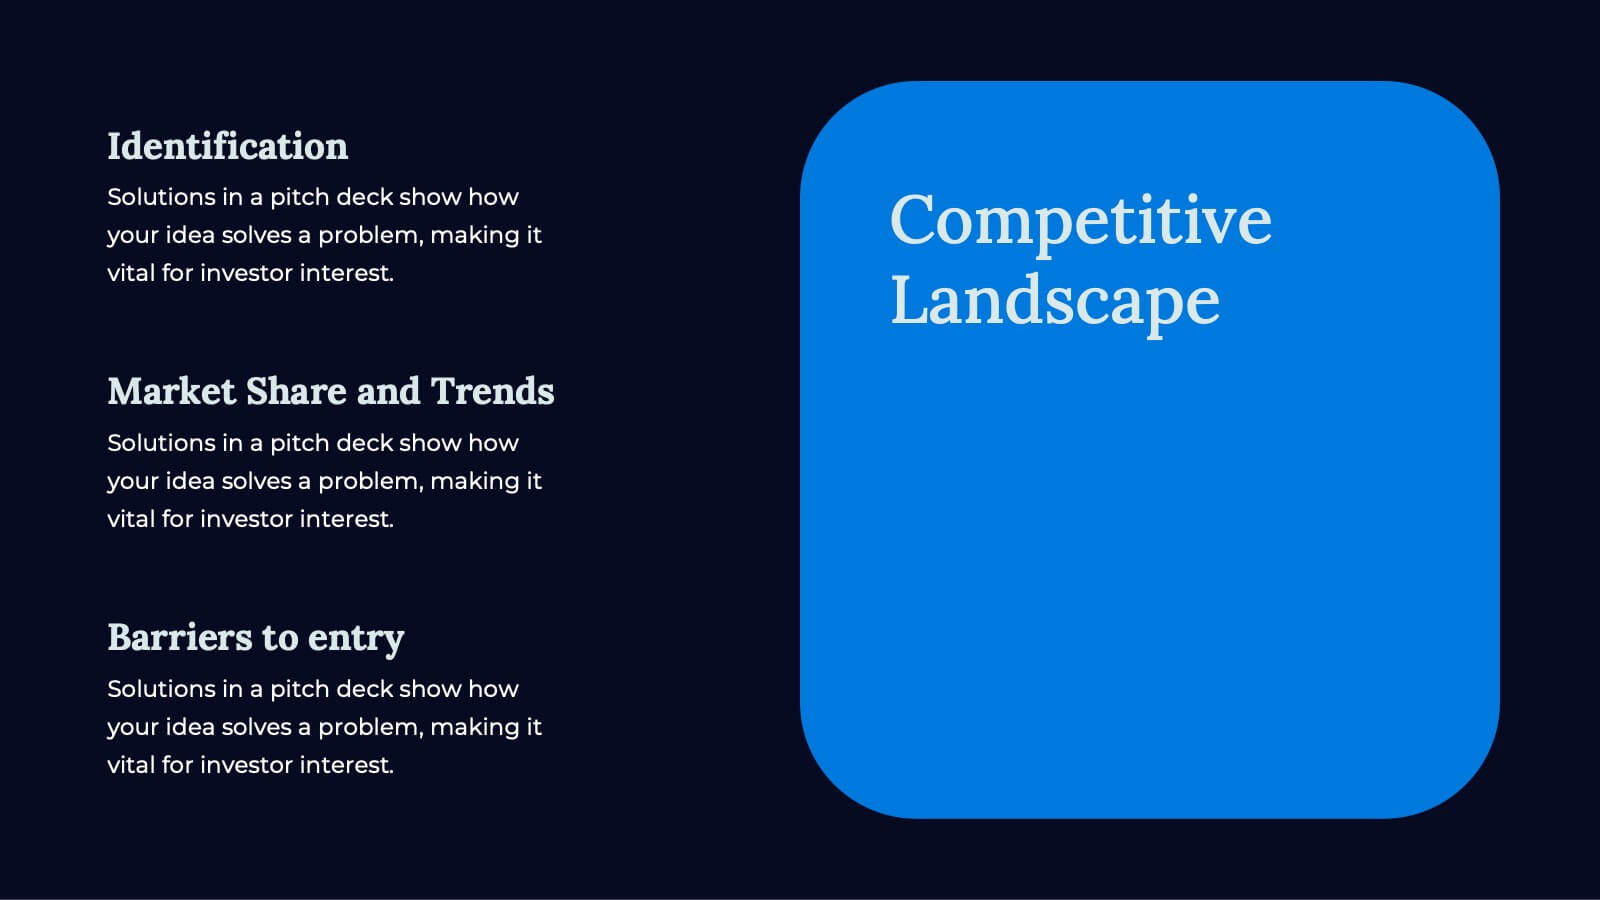
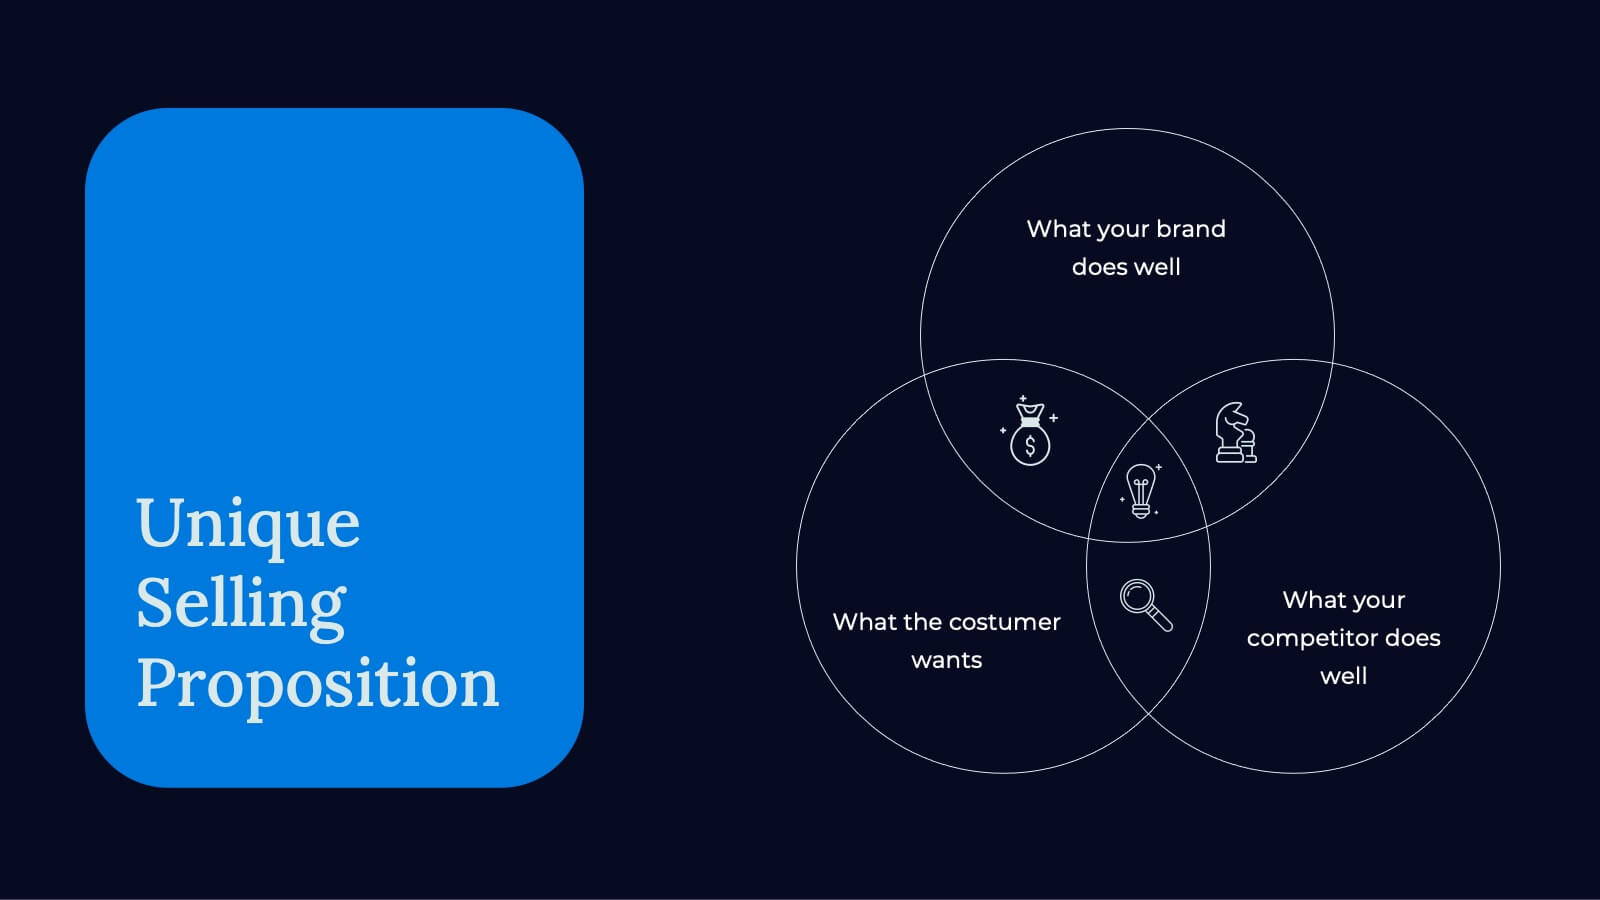
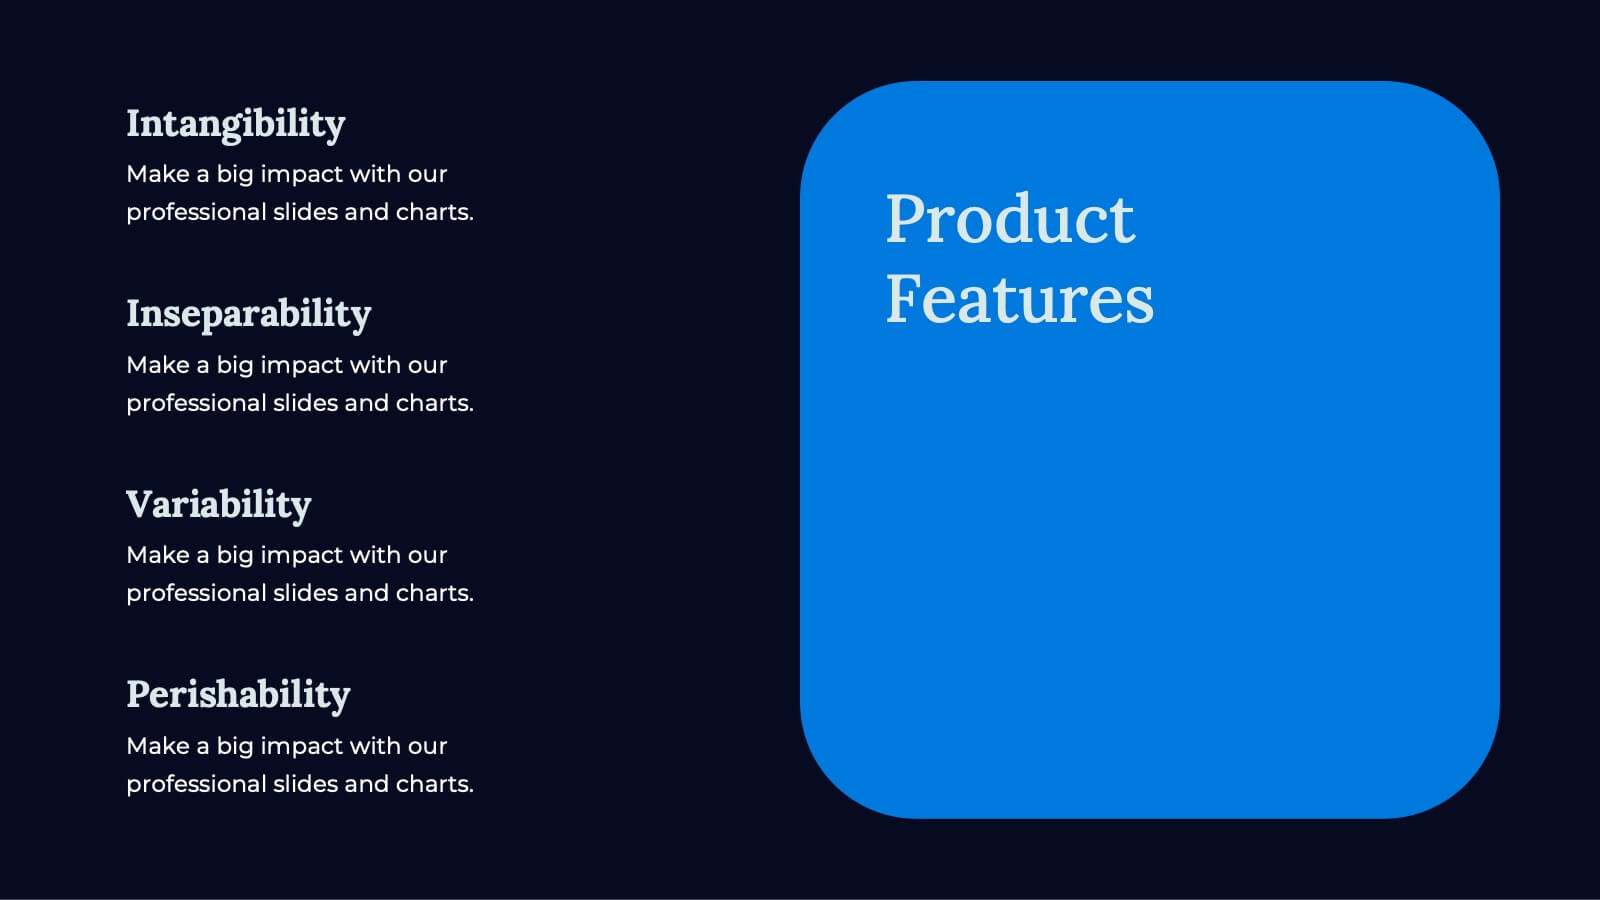
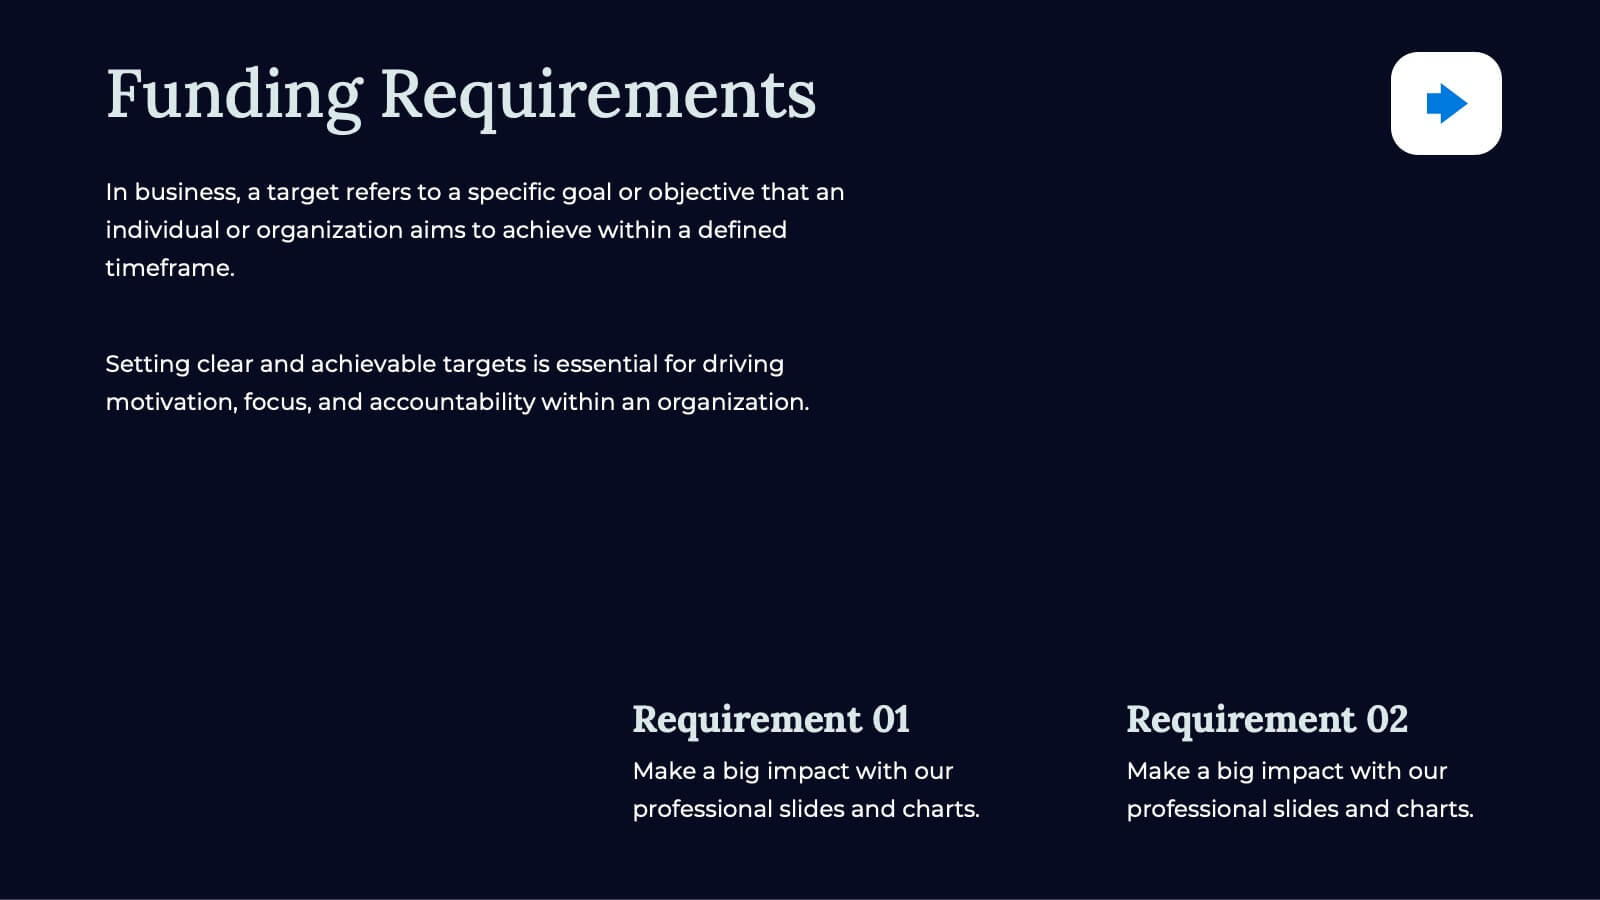
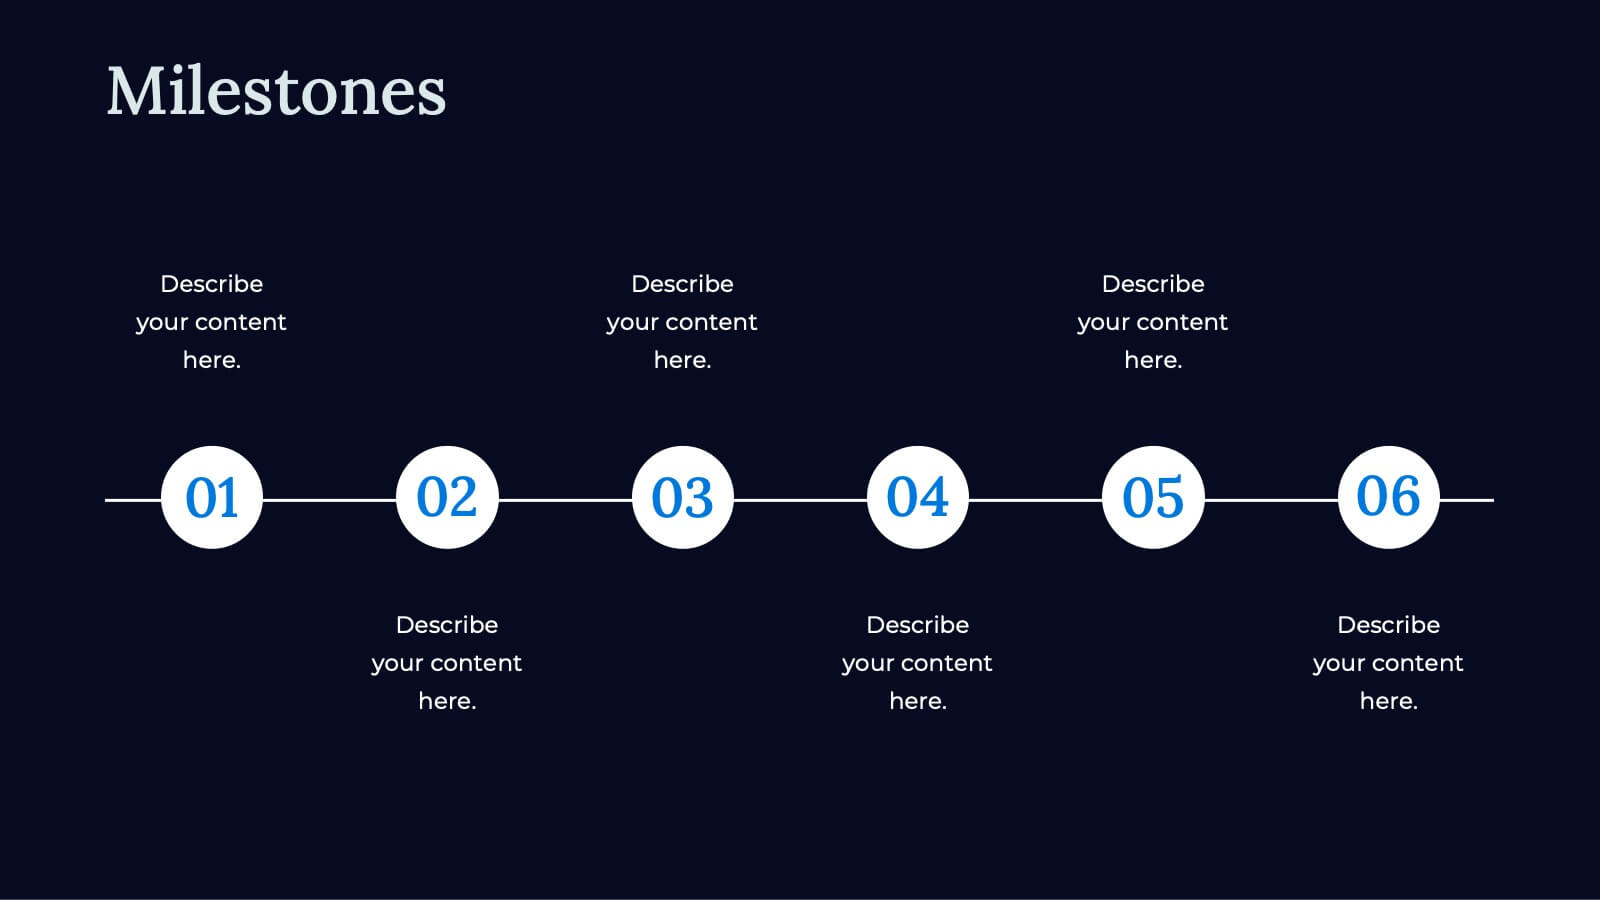
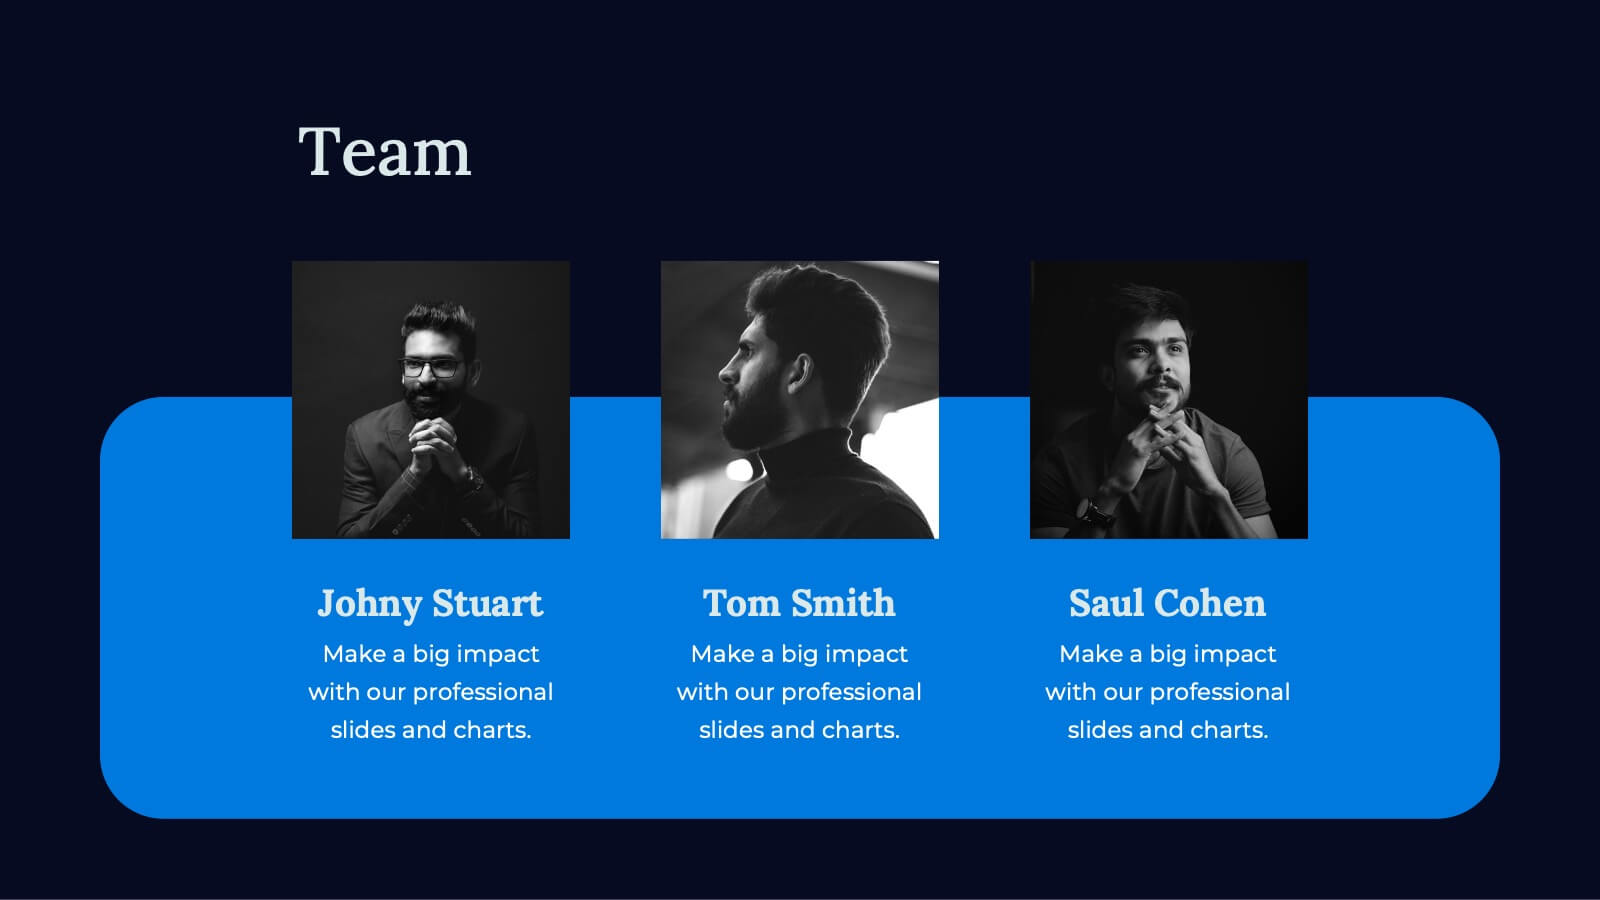
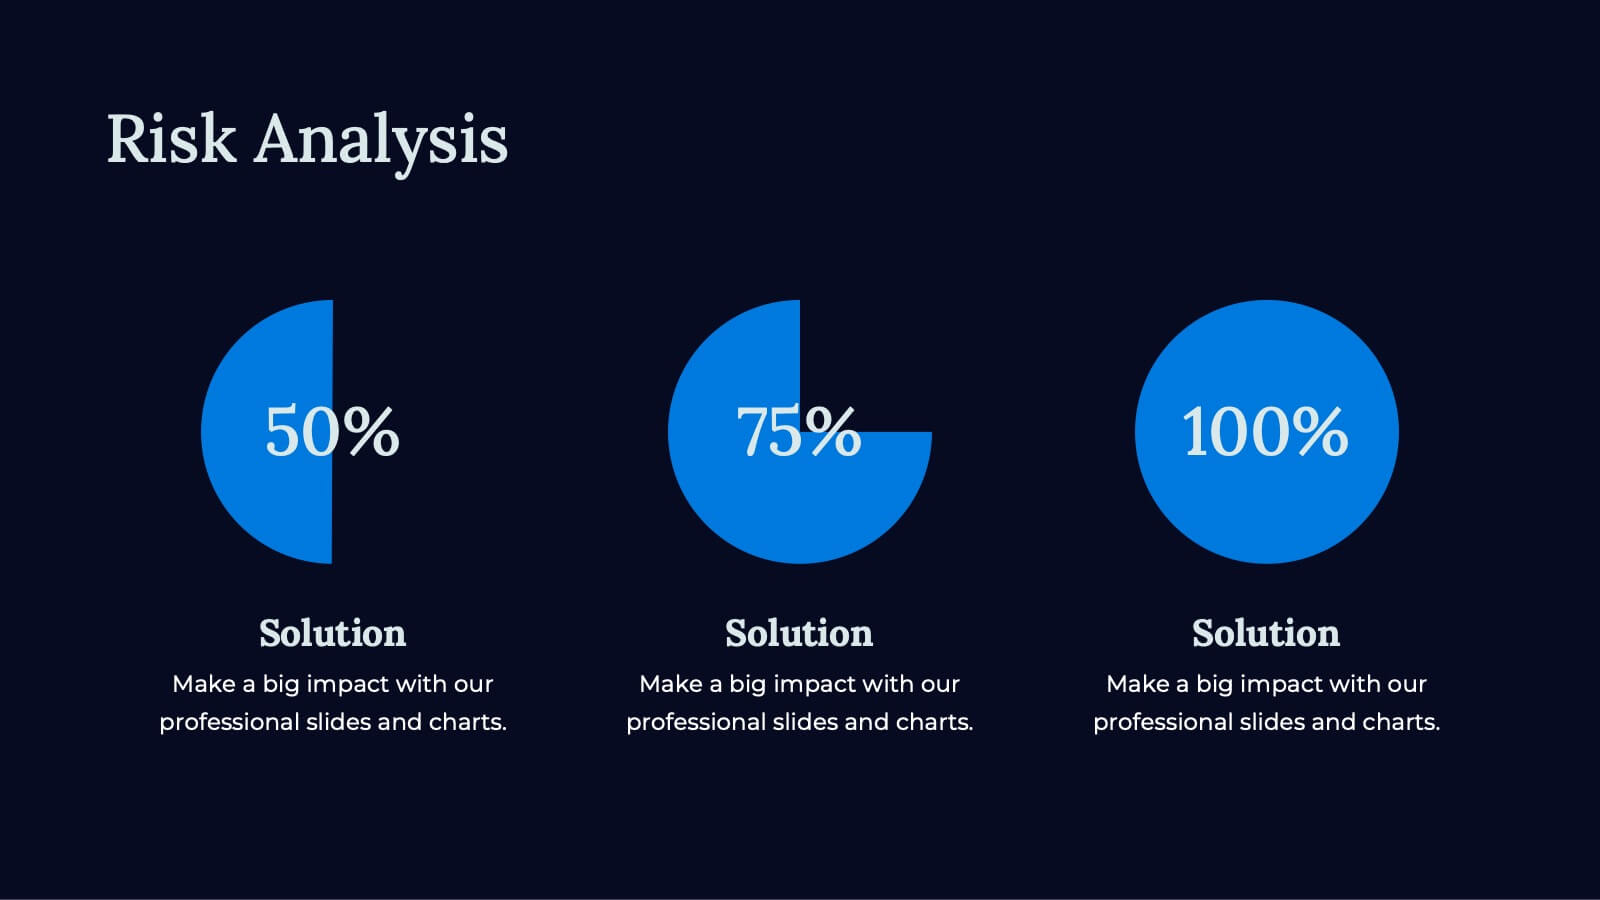
Apex Business Idea Pitch Deck Presentation
Craft powerful business pitch decks with this sleek template. Present your company overview, problem statement, solutions, and market opportunity. Showcase your business model, revenue model, competitive landscape, and unique selling proposition. Perfect for highlighting financials, growth projections, and funding requirements. Compatible with PowerPoint, Keynote, and Google Slides. Impress investors and stakeholders with clear, concise, and visually appealing presentations.


4 diapositivas
ABC Learning Slide Deck Presentation
Kickstart your ideas with a playful, rocket-shaped layout that turns simple ABC steps into a clear, engaging story. This presentation helps break down processes, lessons, or concepts in a way that feels intuitive and dynamic. Fully customizable and compatible with PowerPoint, Keynote, and Google Slides.


19 diapositivas
Zenith Sales Proposal Presentation
Get ready to blow your clients away with this electrifying sales proposal template! Packed with sections on project scope, bold objectives, timelines, and jaw-dropping pricing, it’s designed to make a powerful impact. The sleek, cutting-edge design ensures you’ll leave a lasting impression. Fully compatible with PowerPoint, Keynote, and Google Slides!


11 diapositivas
Moodboard Presentation
This Moodboard template is a vibrant tool for designers and creatives looking to showcase the aesthetic direction of their project. It starts with a dynamic cover slide, drawing you into the visual theme. As you progress through the slides, you are greeted with rich textures and a spectrum of colors carefully selected to inspire and evoke emotion. The slides dedicated to 'Textures' and 'Colors' serve not only as a palette but also as a canvas to communicate the essence of your creative vision. Questions like "Have you chosen your colors yet?" engage the audience, encouraging interaction and reflection on their choices. The 'Concept' and 'Keys' slides further detail the creative process and the core elements that will define the final design. The comprehensive Moodboard culminates in a credits slide, attributing all the inspirational sources that fueled the visual journey.


6 diapositivas
Best Solution Proposal Presentation
Present your ideas with clarity and confidence using this modern, structured layout that highlights problems, opportunities, and proposed solutions step by step. Ideal for showcasing strategies or business improvements, it keeps information organized and persuasive. Fully compatible with PowerPoint, Keynote, and Google Slides for effortless customization and presentation.


21 diapositivas
Mistrain Marketing Research Report Presentation
Present complex marketing research data with a visually engaging and structured template. This presentation design simplifies the process of showcasing company history, market presence, target audience insights, and competitive landscape analysis. With sections for financial highlights, growth plans, and client testimonials, it supports a comprehensive storytelling approach. Featuring clean layouts and aesthetic visuals, this template is ideal for presenting research findings, marketing plans, or audience insights to stakeholders. Fully customizable and compatible with PowerPoint, Google Slides, and Keynote, it ensures a seamless and professional presentation experience. Perfect for businesses, agencies, and professionals aiming to make impactful impressions.