


Características


¿Tienes alguna pregunta?
Recomendar


2 diapositivas
Professional Introduction Slide Presentation
Make a lasting first impression with this Professional Introduction Slide. Designed for business presentations, personal branding, and team introductions, this modern layout features bold shapes, a photo placeholder, and space for key details. Ideal for PowerPoint, Keynote, and Google Slides, this fully editable template lets you customize colors, text, and images to match your brand identity.


6 diapositivas
Business Growth Metrics Butterfly Chart
Highlight performance patterns and opportunities with the Business Growth Metrics Butterfly Chart Presentation. This engaging layout uses mirrored radial segments to present six growth indicators—ideal for tracking progress across two categories, departments, or timeframes. The butterfly-shaped curves draw the viewer’s attention to the center, making comparisons intuitive and visually balanced. Fully customizable in PowerPoint, Keynote, and Google Slides, this template is perfect for showcasing KPI trends, sales metrics, or marketing performance.


5 diapositivas
Workforce Alignment Strategy Presentation
Energize your strategy conversations with a clean, modern layout that makes team alignment feel clear, structured, and actionable. This presentation helps you break down goals, track priorities, and visualize key initiatives in a simple, intuitive flow. Ideal for planning sessions and leadership updates. Fully compatible with PowerPoint, Keynote, and Google Slides.


4 diapositivas
Product & Pricing Plan Matrix Presentation
Simplify complex pricing and product details with the Product & Pricing Plan Matrix Presentation. This structured grid layout is ideal for comparing multiple service tiers, packages, or feature sets side-by-side. Easily customizable, each block allows you to highlight key offerings, benefits, and pricing strategies. Compatible with Canva, PowerPoint, Keynote, and Google Slides.


20 diapositivas
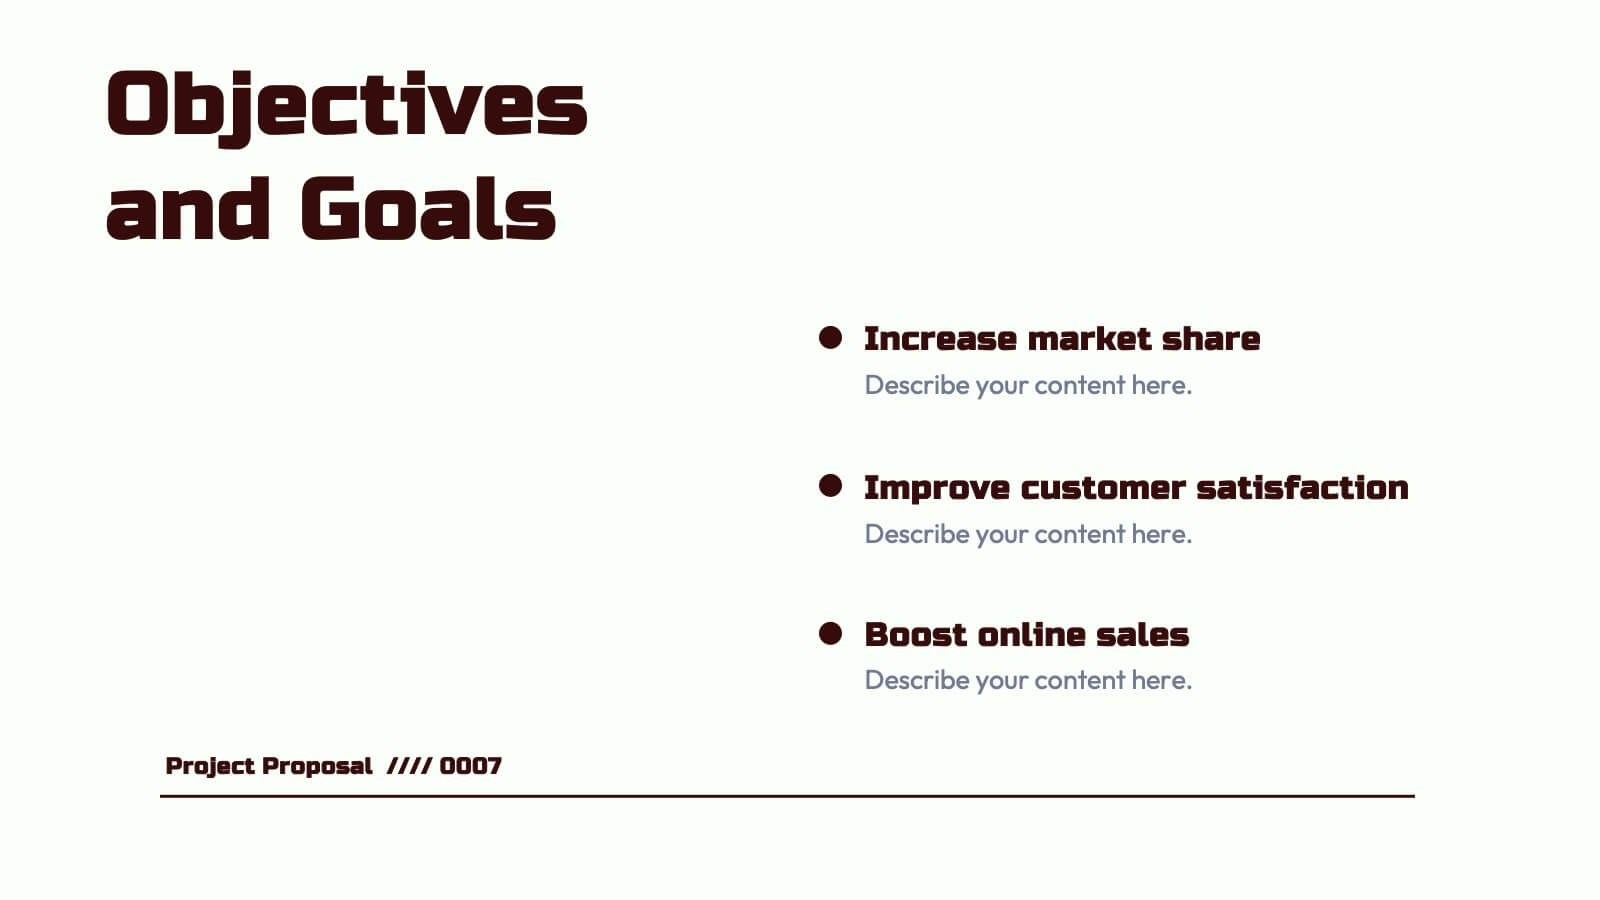
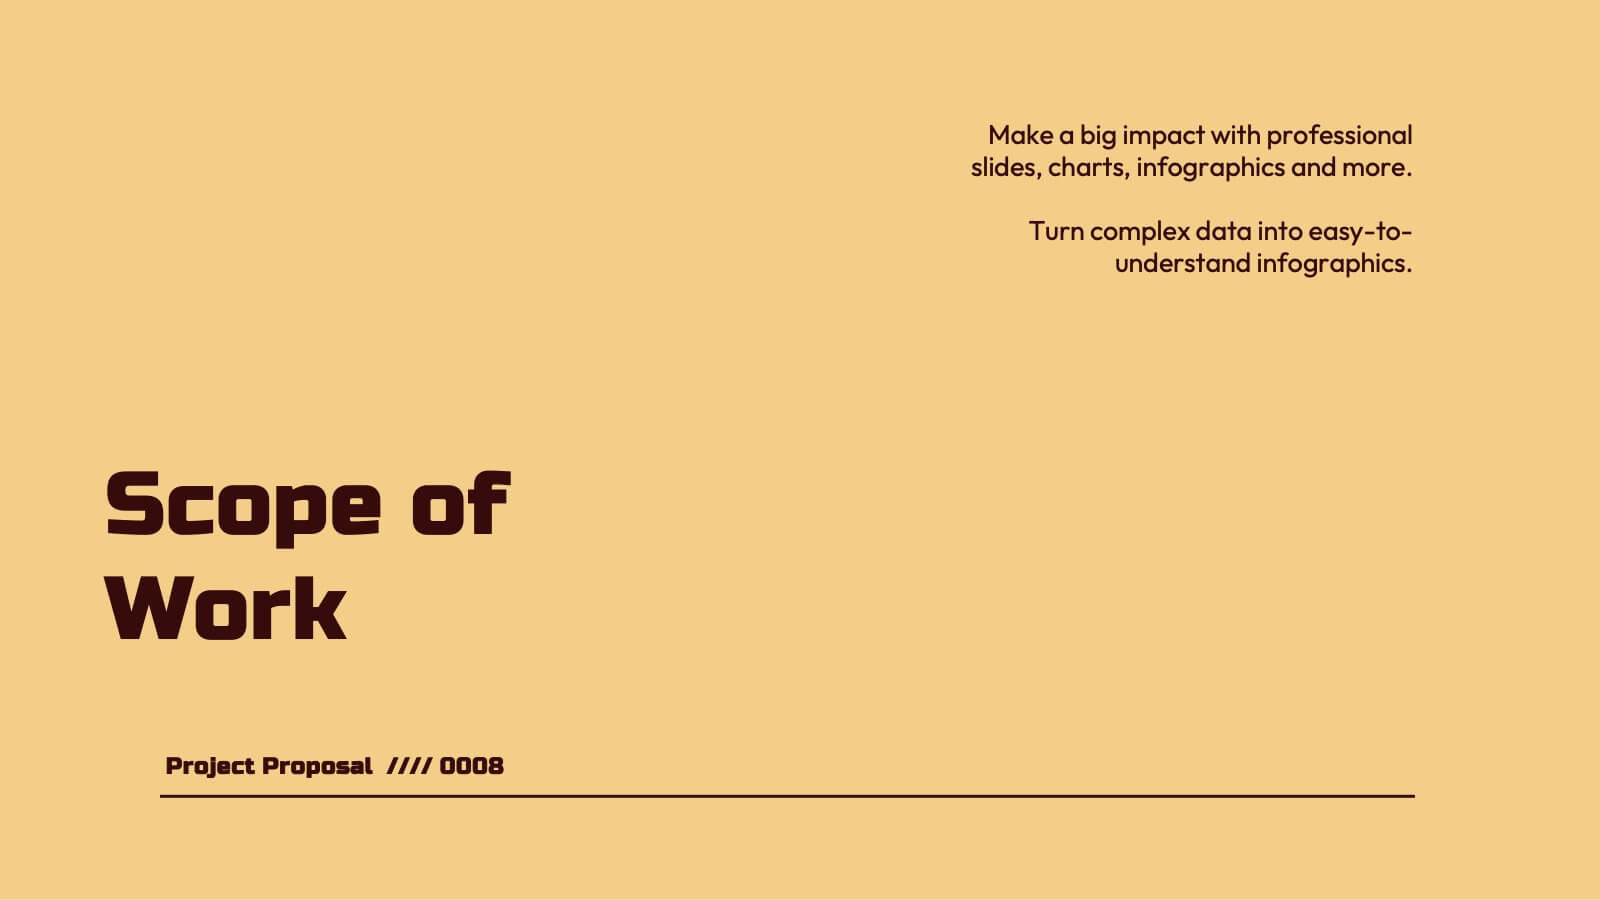
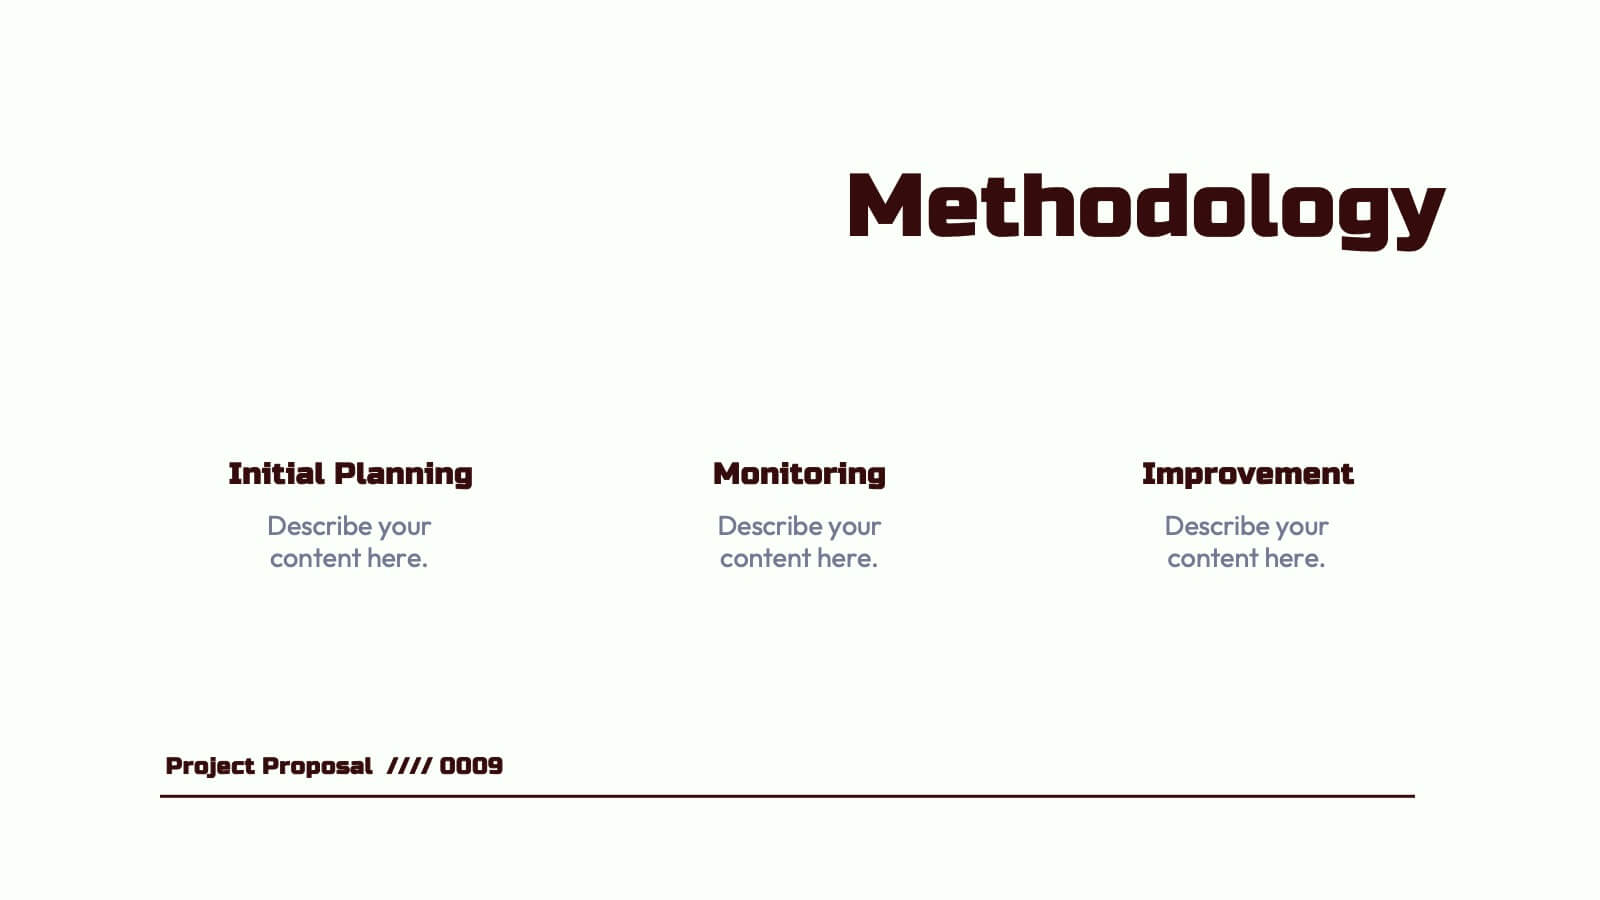
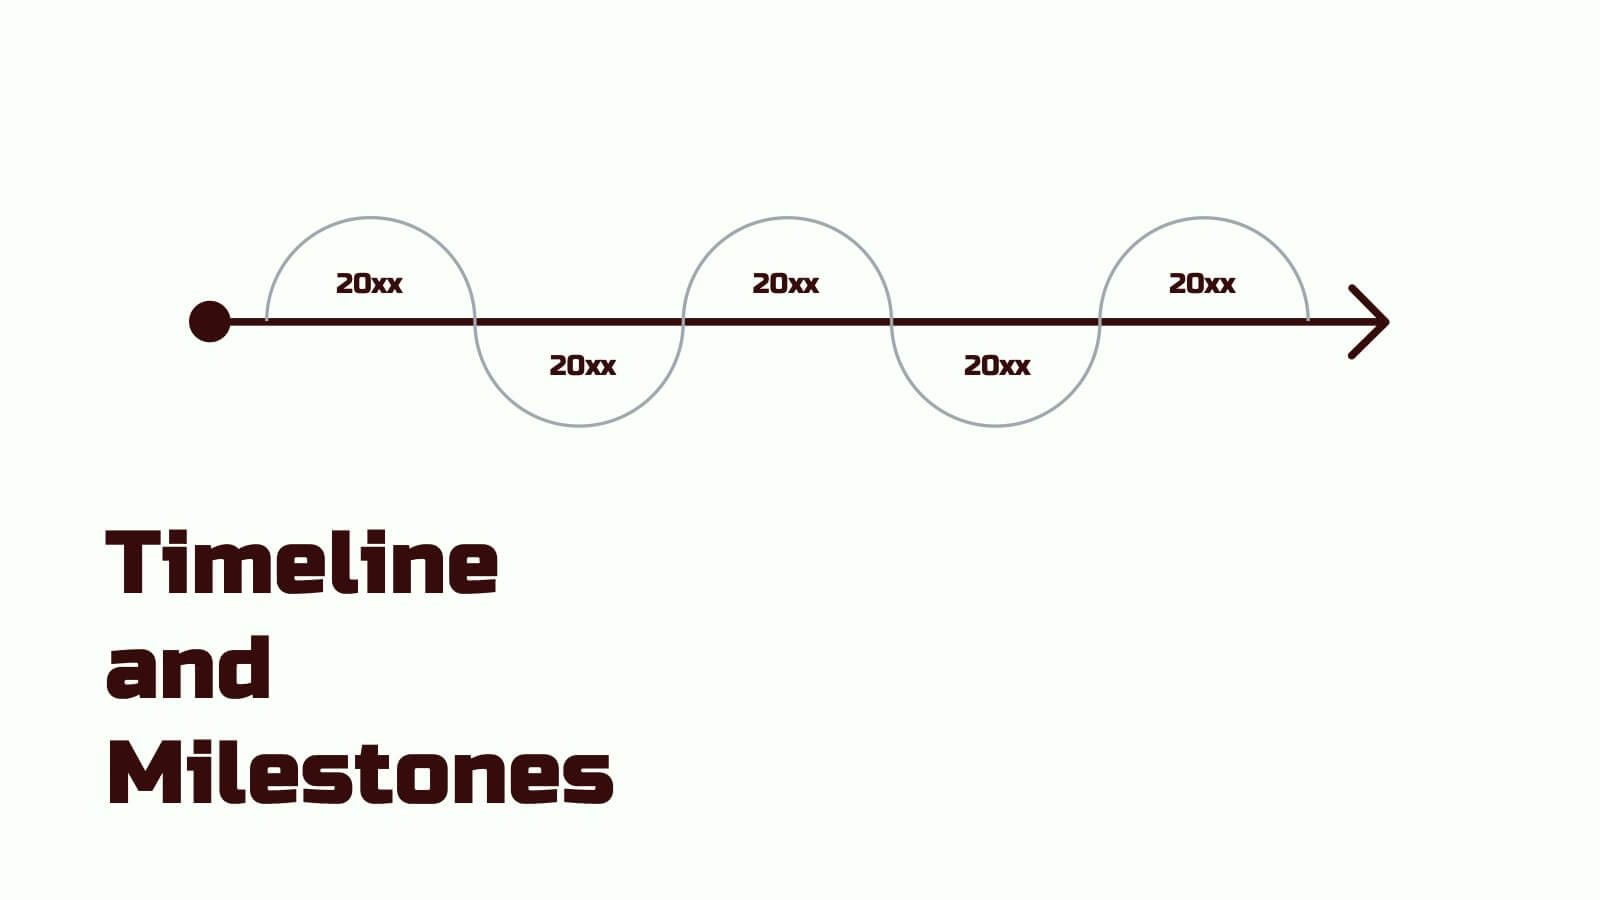
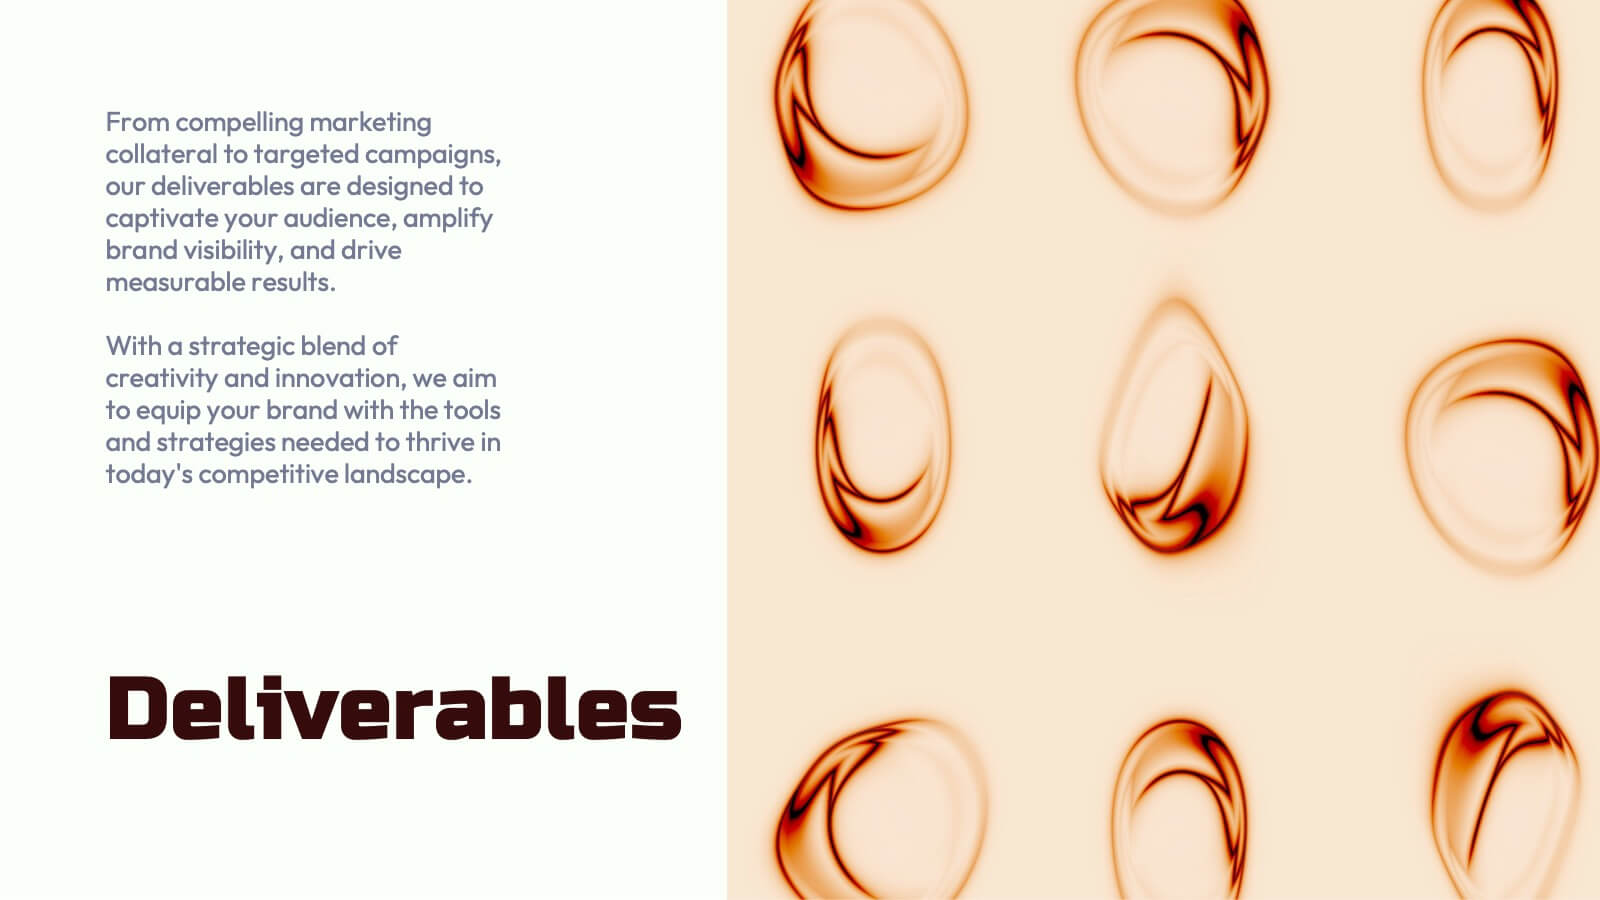
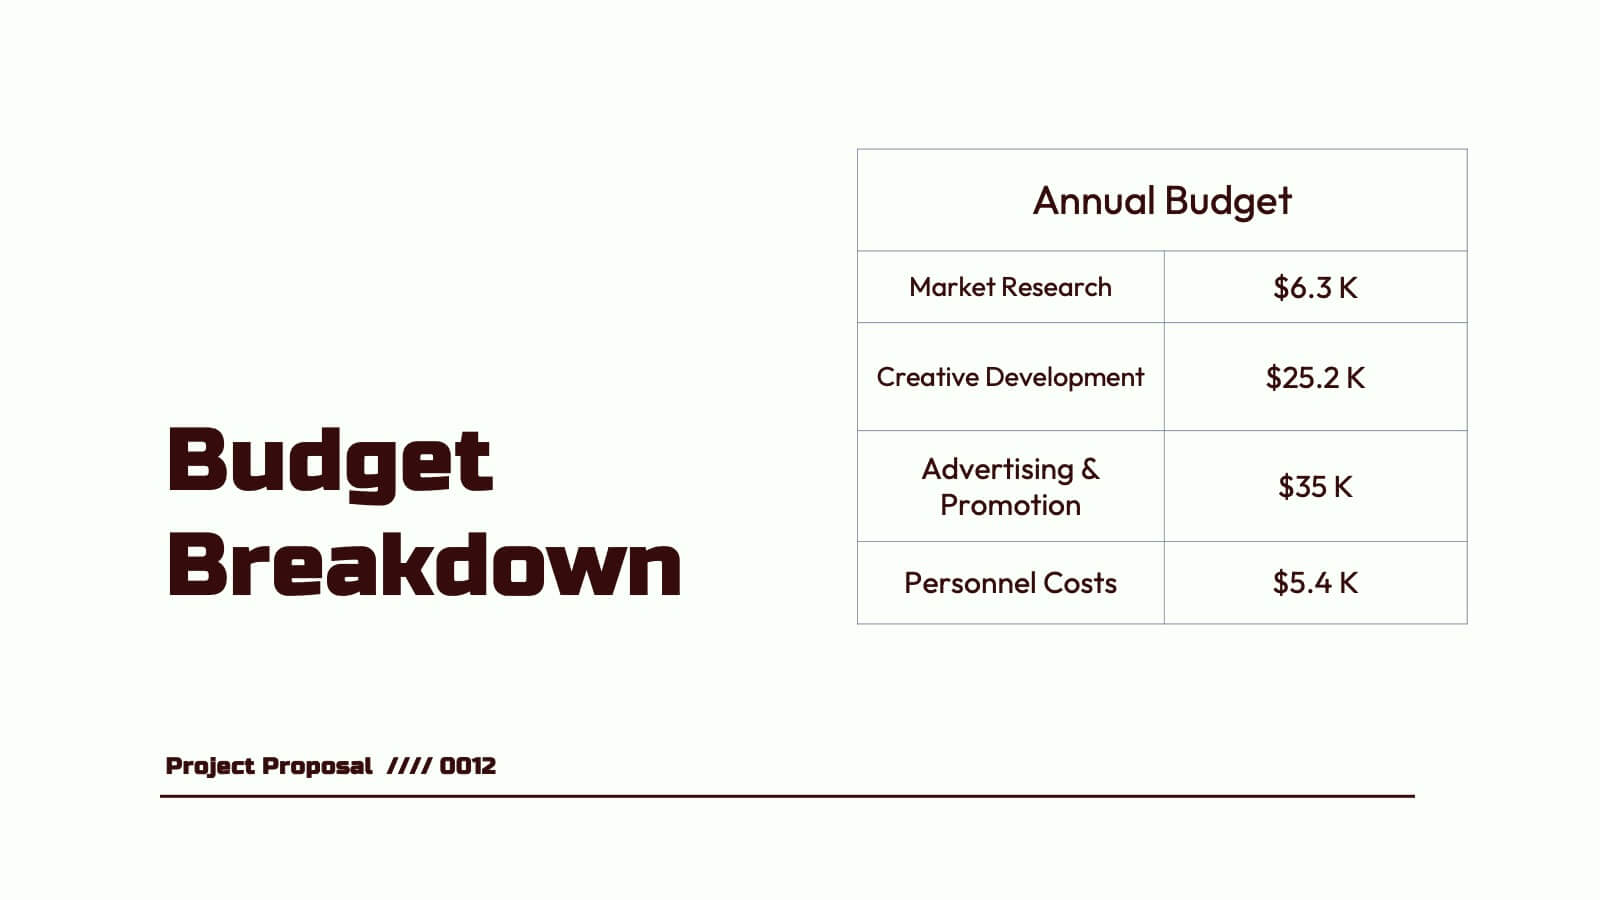
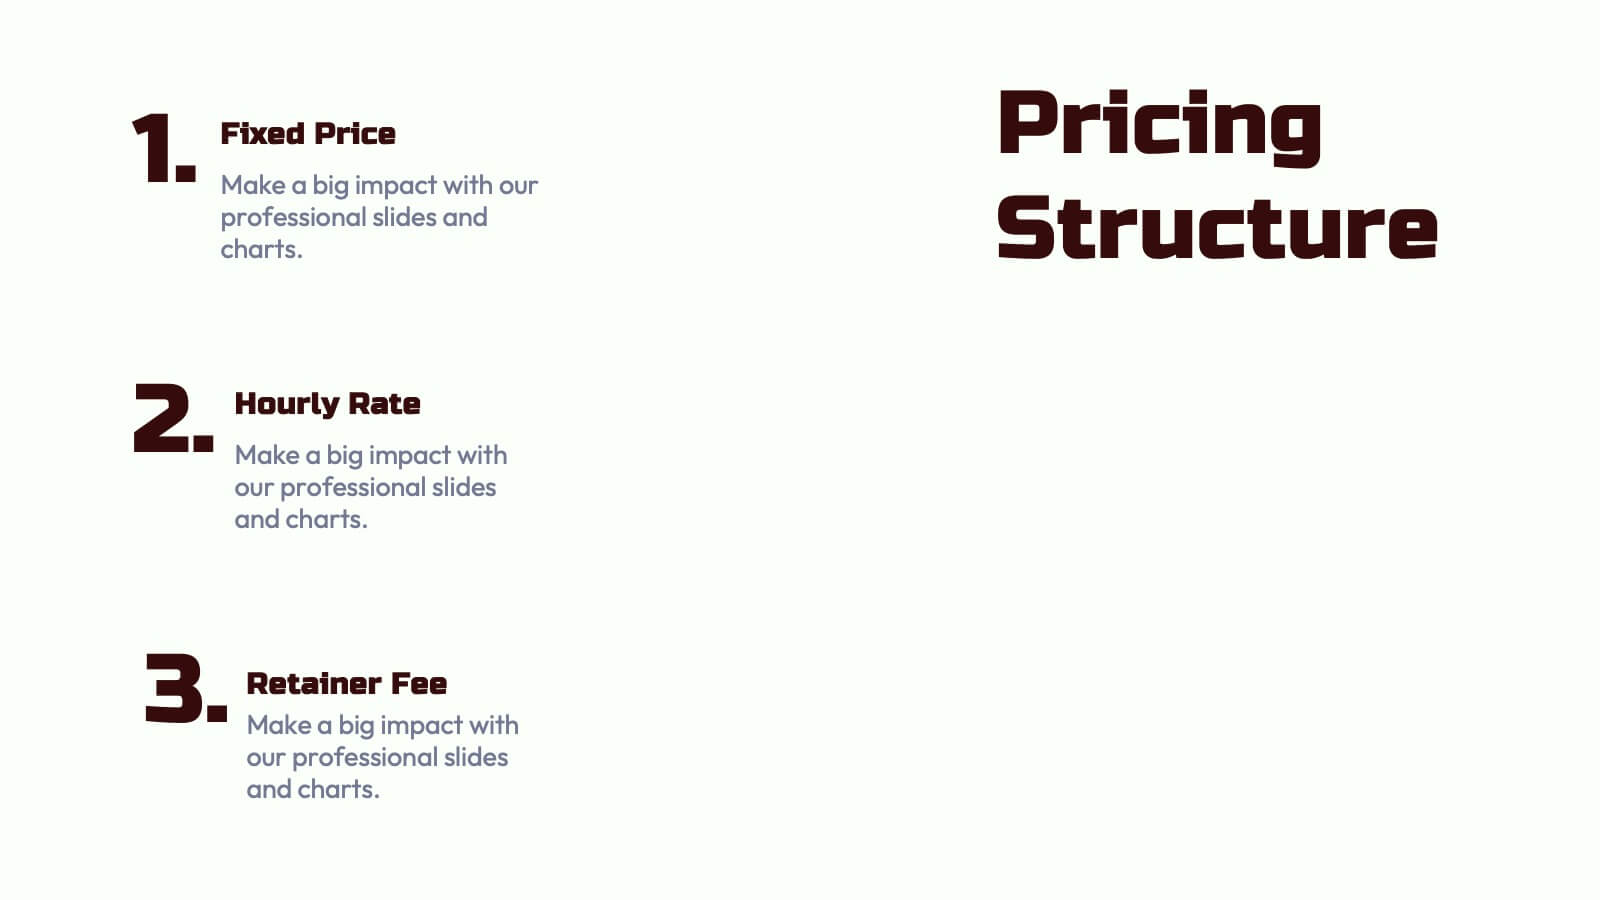
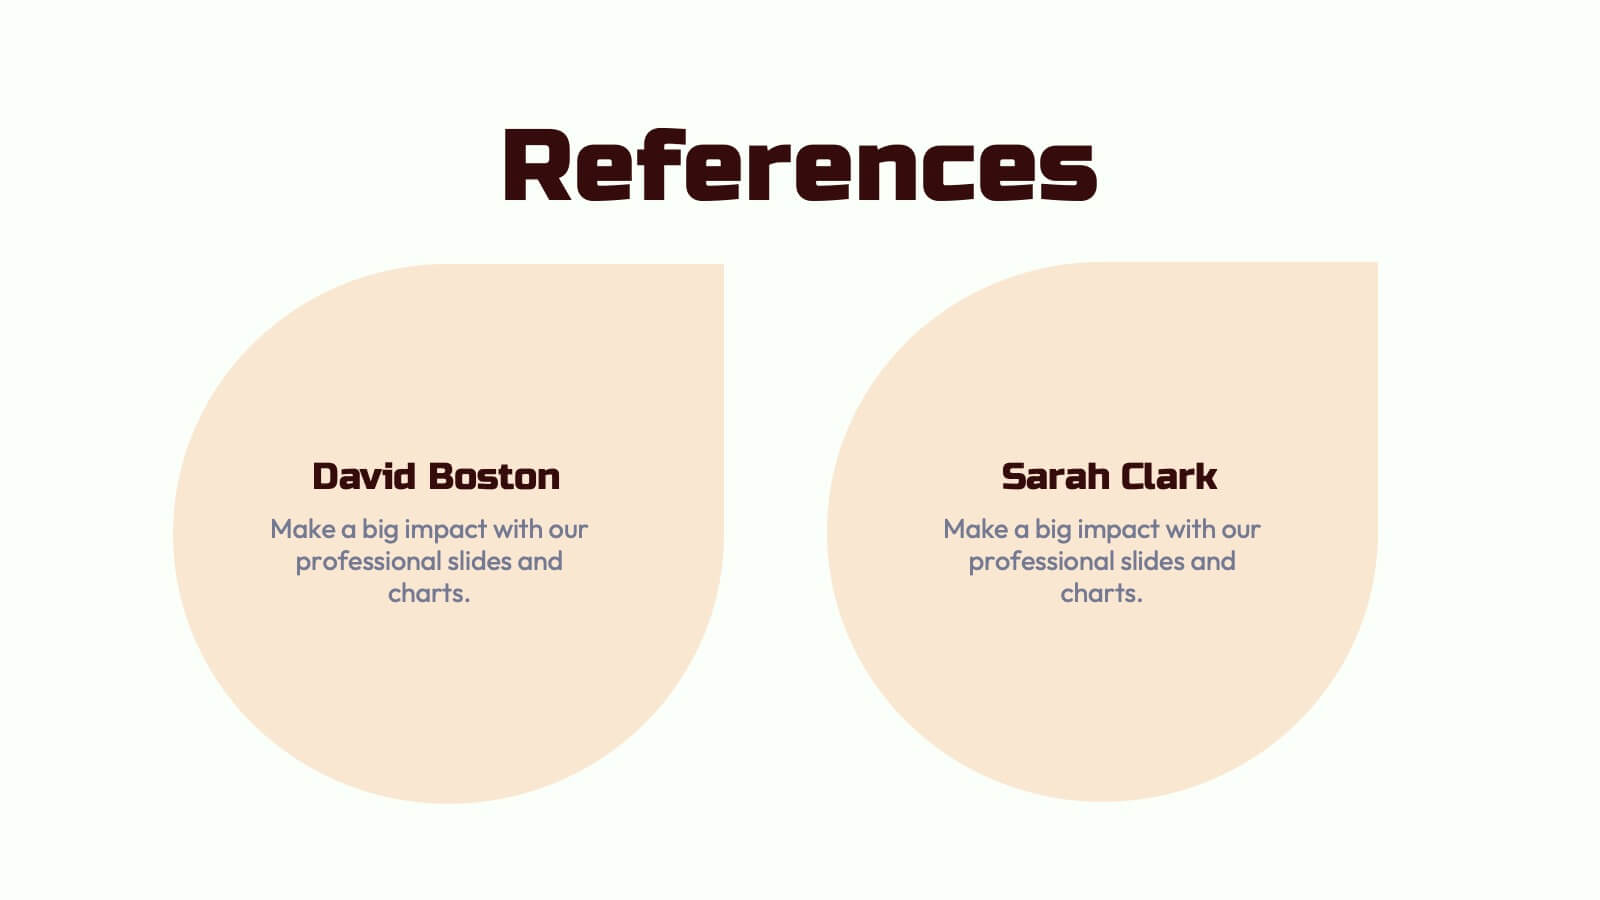
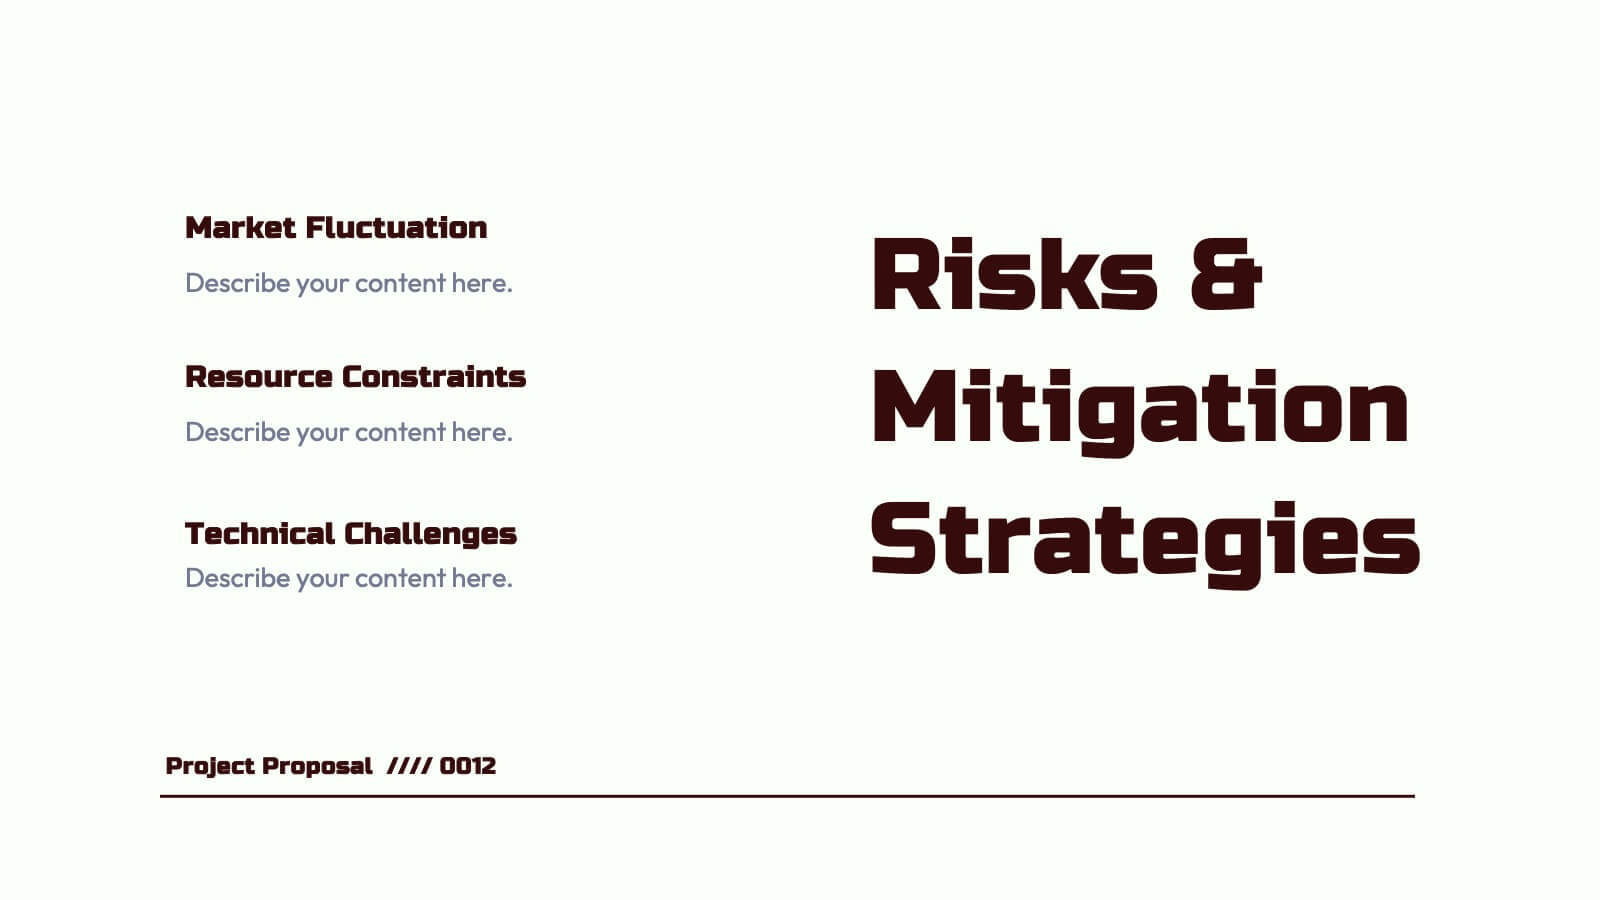
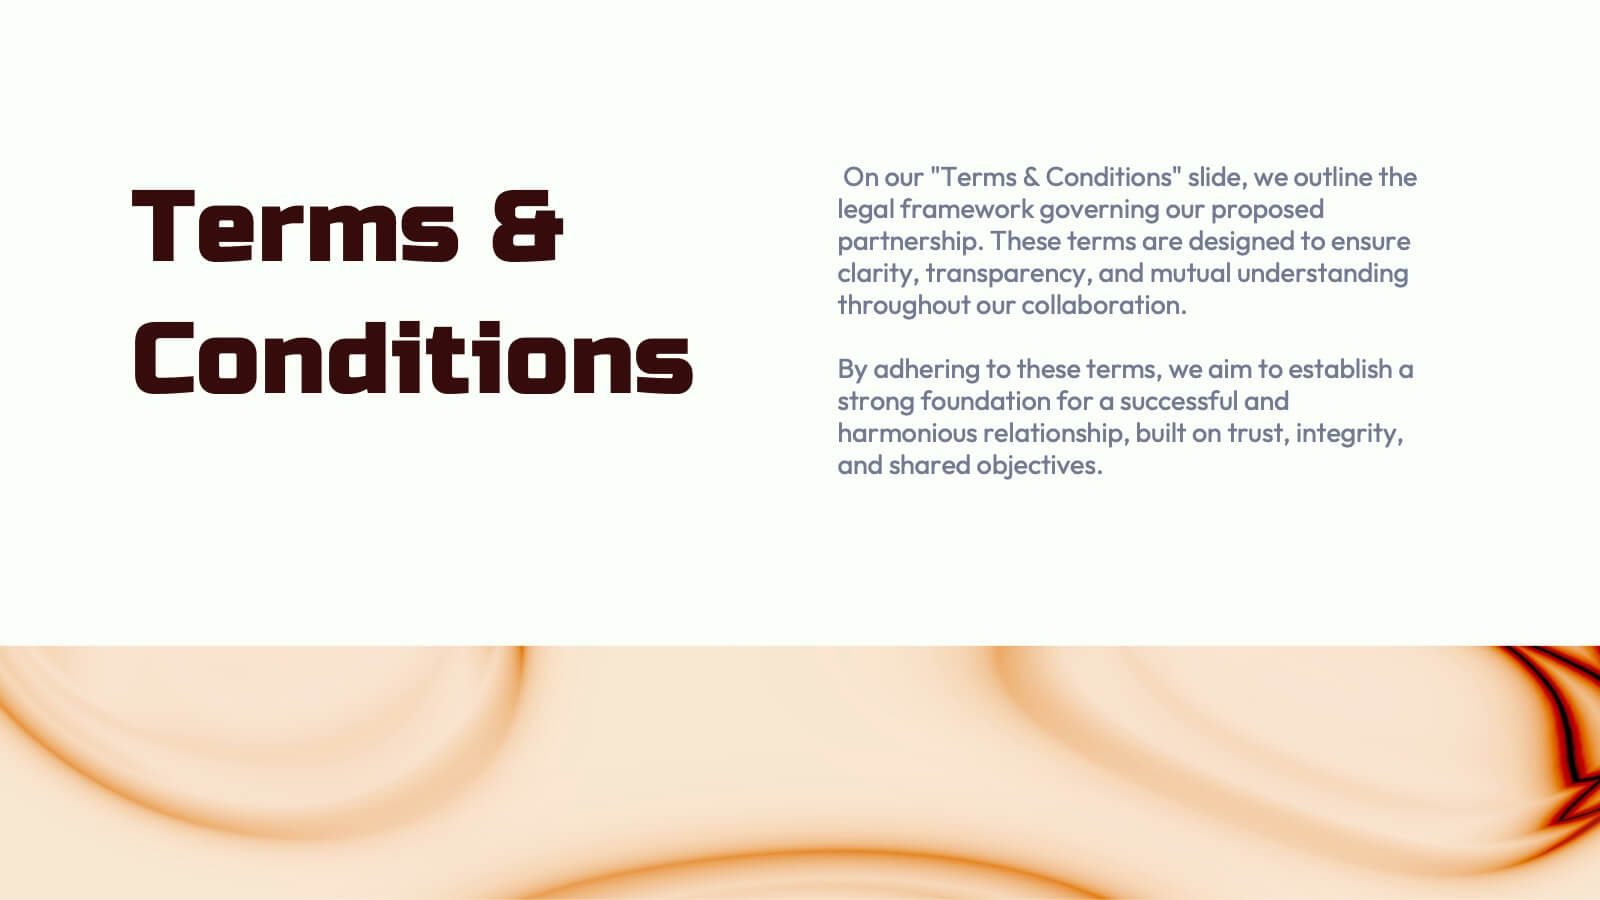
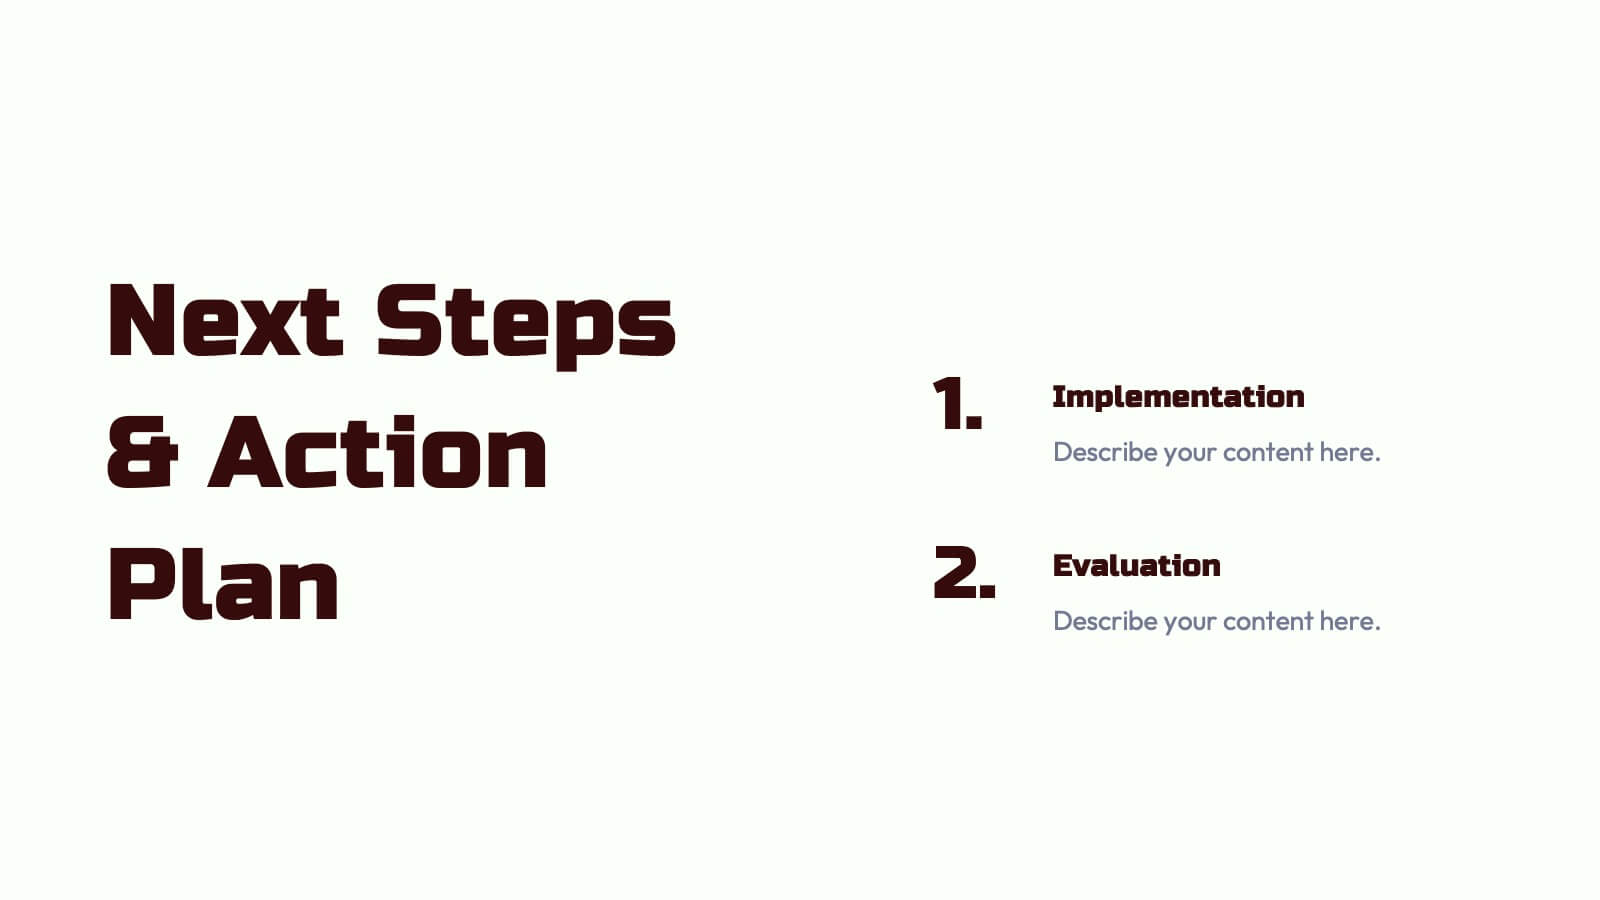
Nebula Project Proposal Presentation
Create a compelling project proposal with this structured, professional template! It includes sections for problem statements, proposed solutions, goals, timelines, and pricing. Perfect for organizing your ideas clearly and professionally, it's fully customizable and compatible with PowerPoint, Keynote, and Google Slides. This template makes it easy to present your proposals effectively and win clients.


20 diapositivas
Spectrumion Sales Performance Report Presentation
Enhance your sales strategy with this performance report template, covering objectives, process, metrics, and opportunities. Ideal for tracking progress and identifying growth areas, it ensures clear communication and actionable insights. Compatible with PowerPoint, Keynote, and Google Slides for versatile and professional presentations.


6 diapositivas
IT Operations Workflow Presentation
Visualize your IT processes with a sleek, structured flow that highlights every operational step from start to finish. Ideal for presenting systems management, network operations, or support frameworks, this presentation brings clarity to technical workflows. Fully compatible with PowerPoint, Keynote, and Google Slides for easy customization and seamless presentation delivery.


5 diapositivas
Corporate Teamwork and People Focus
Show how every team member powers success with this people-centered visual designed to highlight collaboration, roles, and interconnected efforts. Ideal for HR briefings, corporate values, or teamwork strategies, this gear-inspired layout places individuals at the heart of progress. Fully compatible with PowerPoint, Keynote, and Google Slides.


20 diapositivas
Obscuran Sales Performance Report Presentation
Take your sales analysis to the next level with this sleek and professional presentation template. Designed to highlight key areas such as sales objectives, process, performance metrics, competitive analysis, pricing strategy, and future opportunities. This modern layout ensures clarity and impact, making it perfect for sales teams, managers, and stakeholders. Fully customizable and compatible with PowerPoint, Keynote, and Google Slides.


26 diapositivas
Maki Presentation Template
Japanese cuisine is known all around the world, there is so much to try including all the different types of sushi. Maki is a 26 slide template made to help you market your services and products. The clean, simplistic design makes it easy for you to display your content in any modernized way. Maki is designed to showcase your packages, pricing and more. Help your customers feel comfortable purchasing your service or product using this template. Present your message clearly and effectively with this presentation. You can customize the design, photos, background and fonts to make it your own.


6 diapositivas
Design Thinking 5-Stage Model Presentation
Turn creativity into structured innovation with a clean, circular layout that guides your audience through each phase of problem-solving and ideation. Ideal for workshops, strategy sessions, or innovation pitches, this presentation makes complex processes easy to follow. Fully compatible with PowerPoint, Keynote, and Google Slides for seamless editing.


4 diapositivas
Home Design and Architecture Presentation
Showcase Home Design and Architecture with this layered house-themed presentation template. This stacked structure layout effectively illustrates key concepts such as floor planning, architectural elements, space optimization, and construction insights. Ideal for architects, interior designers, and real estate developers, this template helps communicate design strategies and structural layouts with clarity. Fully customizable and compatible with PowerPoint, Keynote, and Google Slides.


6 diapositivas
Eco-Conscious Business Practice Overview Presentation
Communicate your sustainability initiatives with the Eco-Conscious Business Practice Overview Presentation. This modern infographic template features a 5-part petal leaf layout to display eco-friendly actions, green goals, or corporate values. Ideal for environmental reports, ESG updates, or internal awareness decks. Fully editable in Canva, PowerPoint, Keynote, and Google Slides.


6 diapositivas
Business Model Canvas Proposition Infographic
The Business Model Canvas is a strategic management tool that provides a visual framework for describing, analyzing, and developing a business model. This infographic template visually represents the key components of a business model using the Business Model Canvas framework. This framework provides an overview of how a business creates, delivers, and captures value. This template is designed to be a comprehensive way to map out all the key components of a business model. This infographic is a versatile tool perfect for startups, established companies, and entrepreneurs to visualize, communicate, and iterate on their business models.


10 diapositivas
Brand Loyalty and Customer Retention Presentation
Strengthen your brand’s relationship with your audience using the "Brand Loyalty and Customer Retention" presentation template. This design effectively illustrates how strong branding strategies enhance customer loyalty and retention rates. Ideal for marketers and business strategists, this template is fully compatible with PowerPoint, Keynote, and Google Slides, making it perfect for presentations aimed at improving customer engagement and business growth.


10 diapositivas
Remote Work Best Practices Presentation
Streamline your team's productivity with this Remote Work Best Practices presentation. Ideal for hybrid or fully remote businesses, this layout features five key steps illustrated in a connected visual path, helping communicate structure and flow. With a clean, modern design and editable sections, it's perfect for onboarding, policy training, or workflow optimization. Compatible with PowerPoint, Keynote, and Google Slides for easy customization.


4 diapositivas
Iceberg Metaphor Diagram Presentation
Make your message feel deeper and more intriguing with a visual that instantly shows there’s more beneath the surface. This presentation helps you highlight hidden factors, core insights, and layered data using a clear, structured iceberg illustration. Ideal for strategy, analysis, and storytelling. Fully compatible with PowerPoint, Keynote, and Google Slides.