


Características


¿Tienes alguna pregunta?
Recomendar


23 diapositivas
Wendigo Agency Portfolio Presentation
This sleek agency portfolio template showcases your mission, services, and success stories with modern flair. From case studies and strategy development to campaign execution and client testimonials, it’s designed to highlight your agency’s strengths. Perfect for agency presentations across PowerPoint, Keynote, and Google Slides, this template makes your content shine effortlessly.


23 diapositivas
Rainshadow Digital Strategy Presentation
This Digital Strategy Presentation Template is designed to provide a structured approach to planning and implementing digital initiatives. Covering essential elements such as market trends, competitive analysis, value proposition, and risk management, it offers a professional framework to align goals with actionable steps. Fully customizable and compatible with PowerPoint, Keynote, and Google Slides.


10 diapositivas
National Distribution Network in the US Presentation
Present your logistics strategy with clarity using the National Distribution Network in the US Presentation. This slide visually maps out your key distribution hubs across the country, pairing each location with a numbered label and space for insights or logistics data. Ideal for supply chain overviews, retail operations, or partner briefings. Fully editable in Canva, PowerPoint, and Google Slides.


5 diapositivas
Project Planning and Rollout Timeline
Stay on track from kickoff to delivery with the Project Planning and Rollout Timeline Presentation. This curved roadmap layout visually guides your audience through five sequential stages—perfect for illustrating workflows, rollout phases, or go-to-market strategies. Easily customizable in PowerPoint, Keynote, and Google Slides to suit any project.


5 diapositivas
Cloud Computing for Business Presentation
Present your cloud strategy with clarity using this modern five-point diagram. Each cloud icon is linked to a central device, symbolizing data flow, security, storage, and infrastructure services. Ideal for IT presentations, cloud migration plans, or SaaS workflows. Fully editable in PowerPoint, Keynote, and Google Slides.


7 diapositivas
30 60 90 Nutritional Plan Infographic
Chart a path to healthful living with the 30 60 90 Nutritional Plan Infographic. In a vibrant mix of yellow, purple, blue, and white, this template presents a visually delightful guide to nutrition enthusiasts and health-conscious audiences. The tailored design encourages a gradual approach to dietary transitions, making it easier to understand and adhere to. Health coaches, dietitians, or fitness trainers will find this as an indispensable tool for workshops, webinars, or consultations. Its seamless integration with PowerPoint, Keynote, and Google Slides enhances the user experience during presentations.


4 diapositivas
Cause-Effect Relationships Bowtie Format Presentation
Clearly illustrate the connection between causes and outcomes with the Cause-Effect Relationships Bowtie Format Presentation. Designed to simplify complex business logic, this layout uses a symmetrical bowtie shape to contrast contributing factors with resulting effects. Ideal for strategy, operations, or risk analysis. Fully editable in Canva, PowerPoint, Google Slides, and Keynote.


6 diapositivas
Business Task and To-Do List Slide
Organize tasks with clarity using this colorful checklist-style layout, perfect for showcasing priorities, timelines, or team responsibilities. With six editable sections and engaging icons, this layout brings structure and visual appeal to business updates or project meetings. Fully customizable in PowerPoint, Keynote, and Google Slides.


23 diapositivas
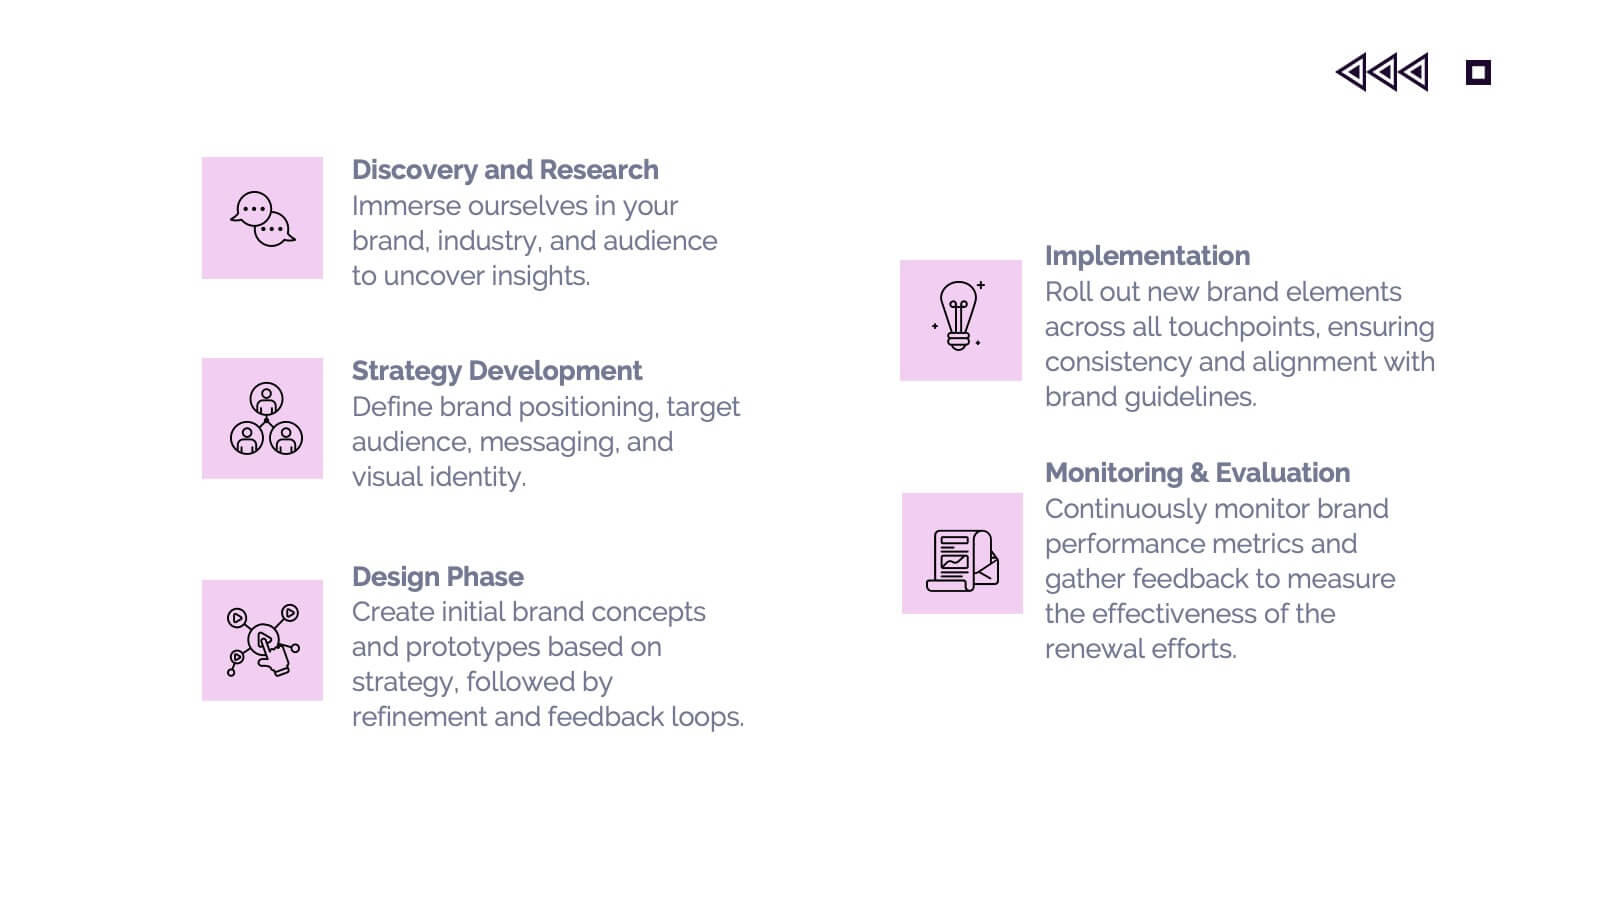
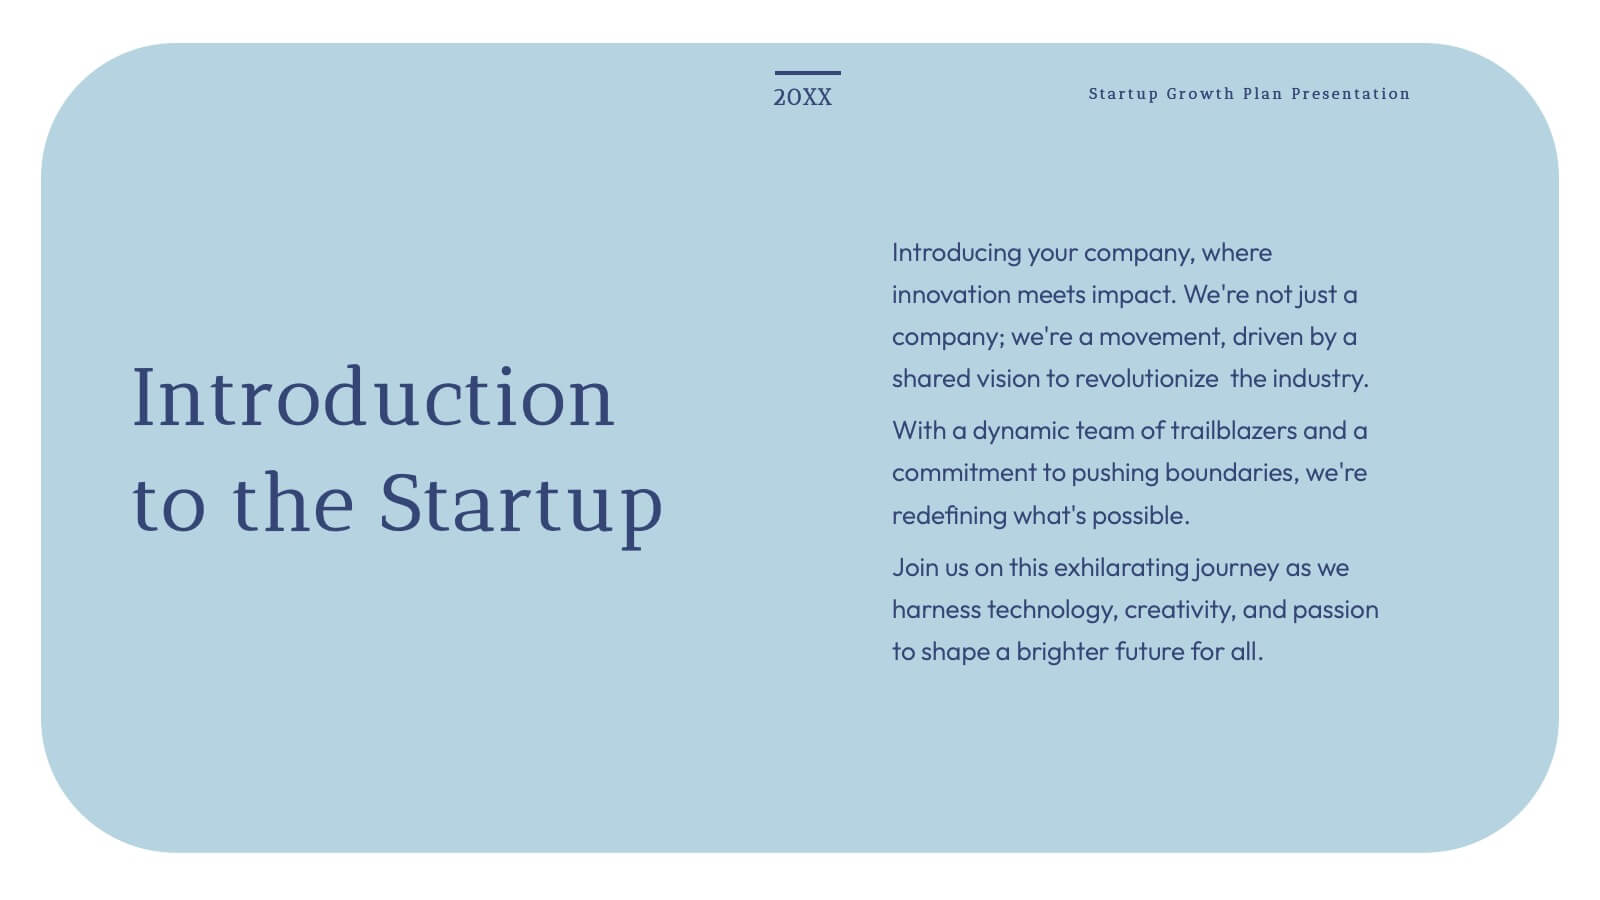
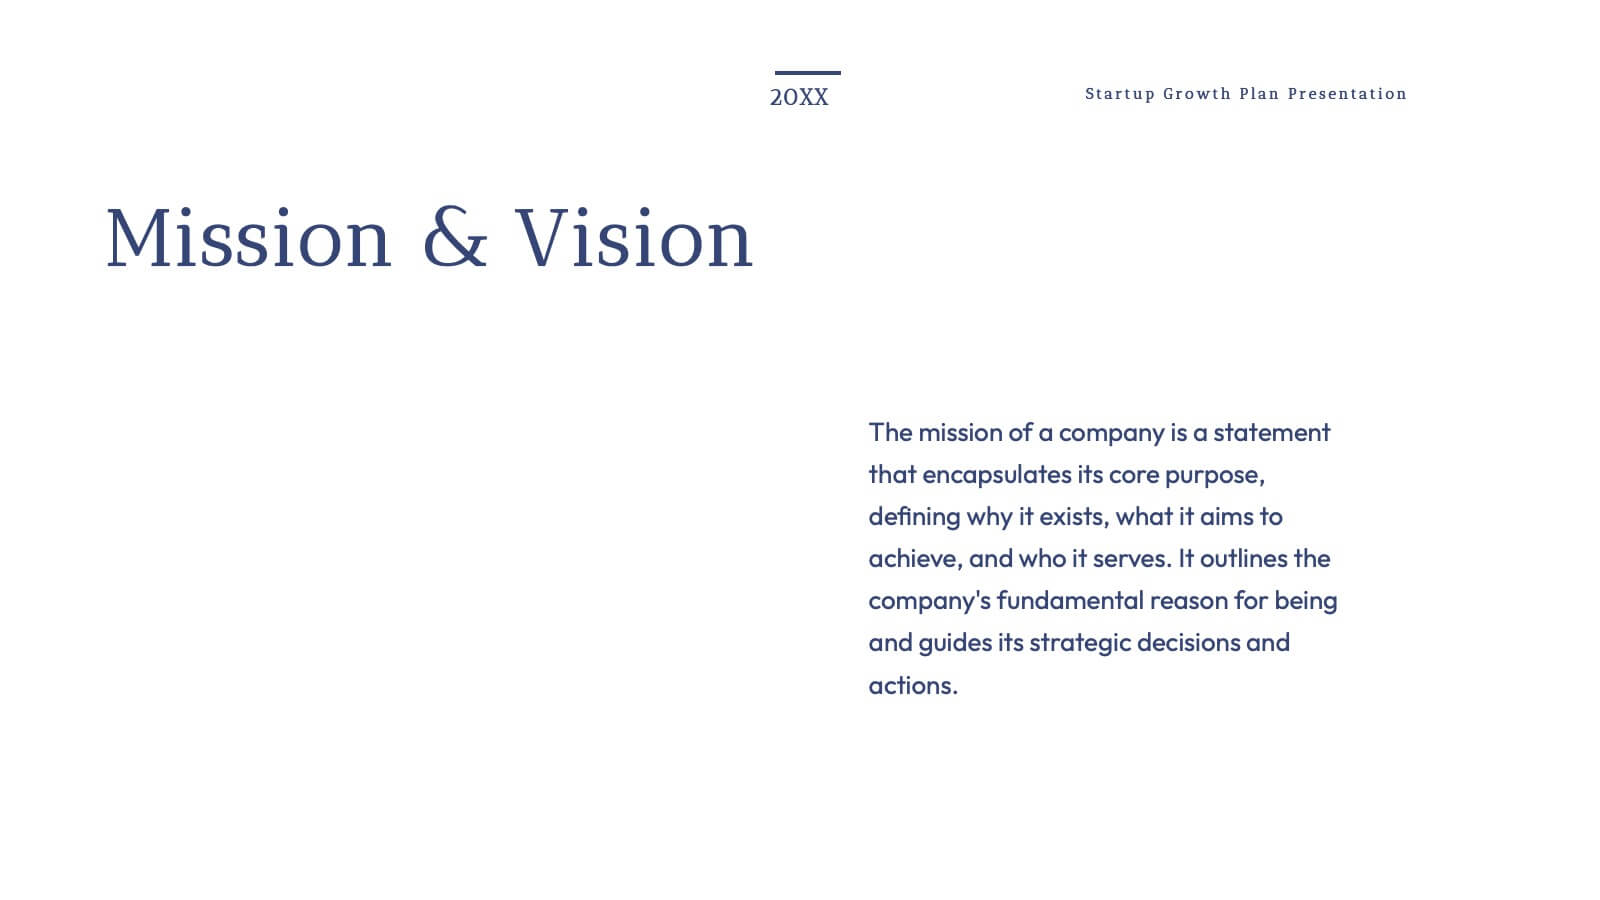
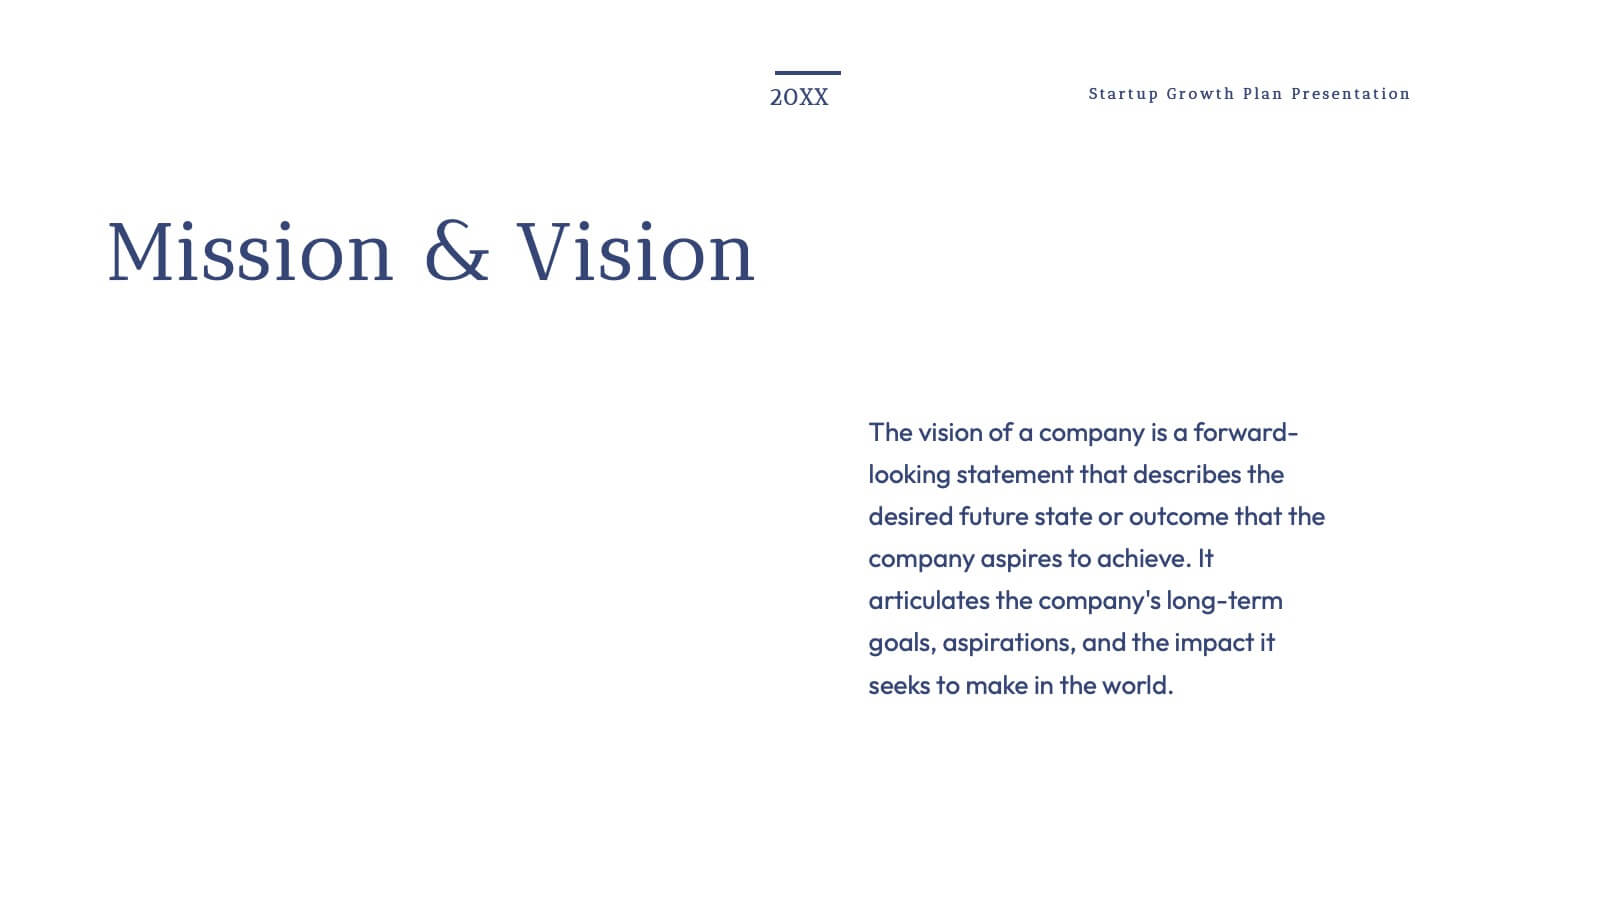
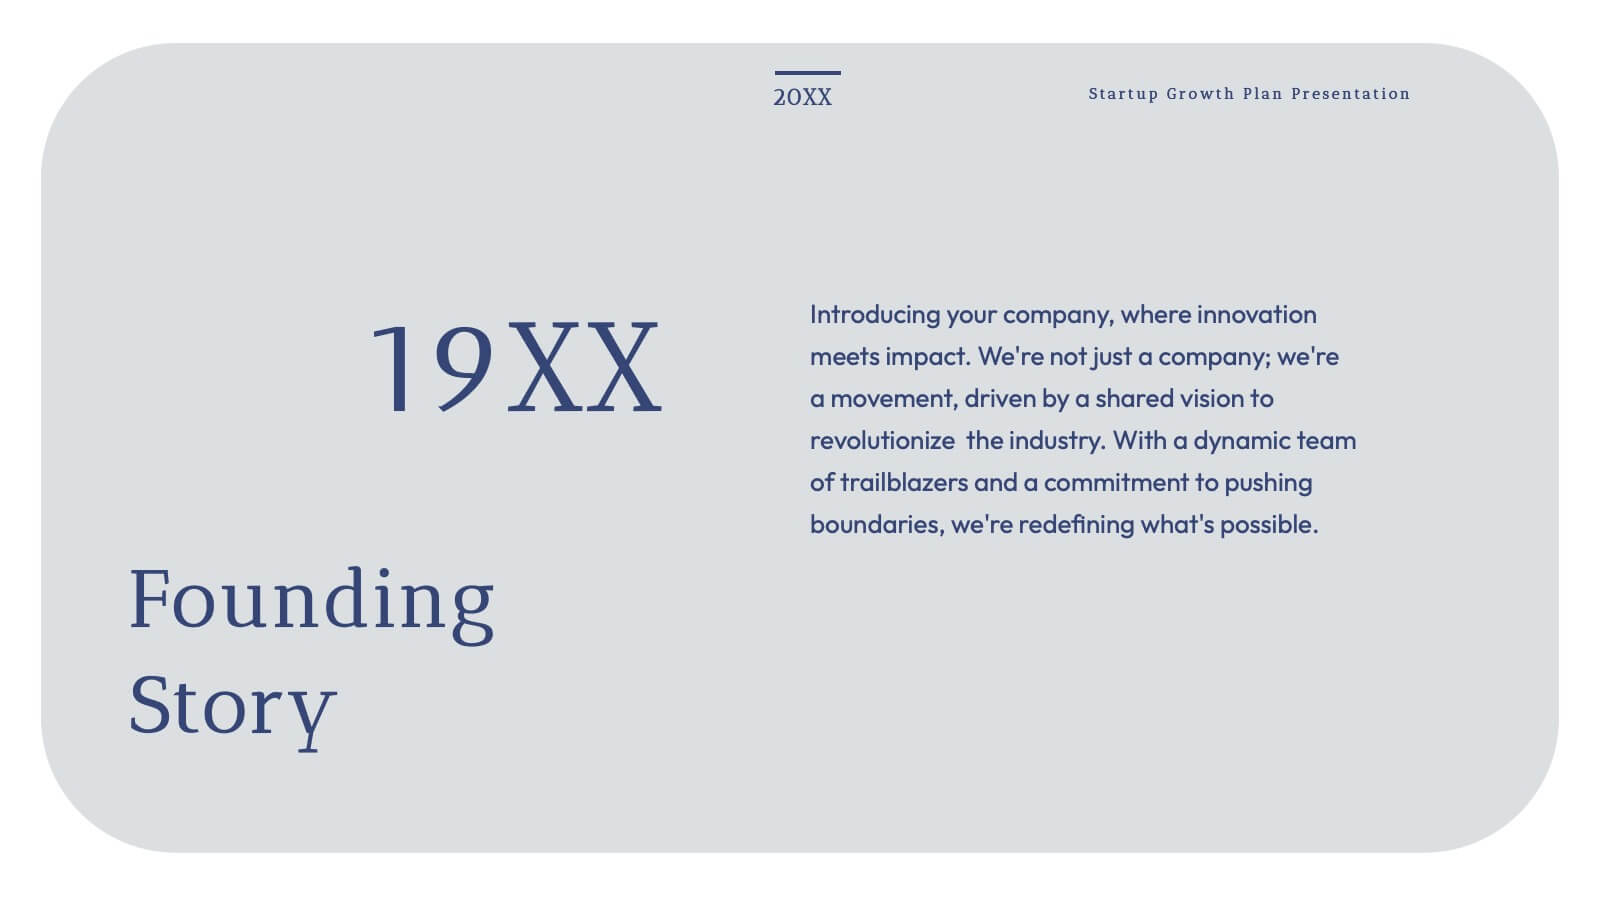
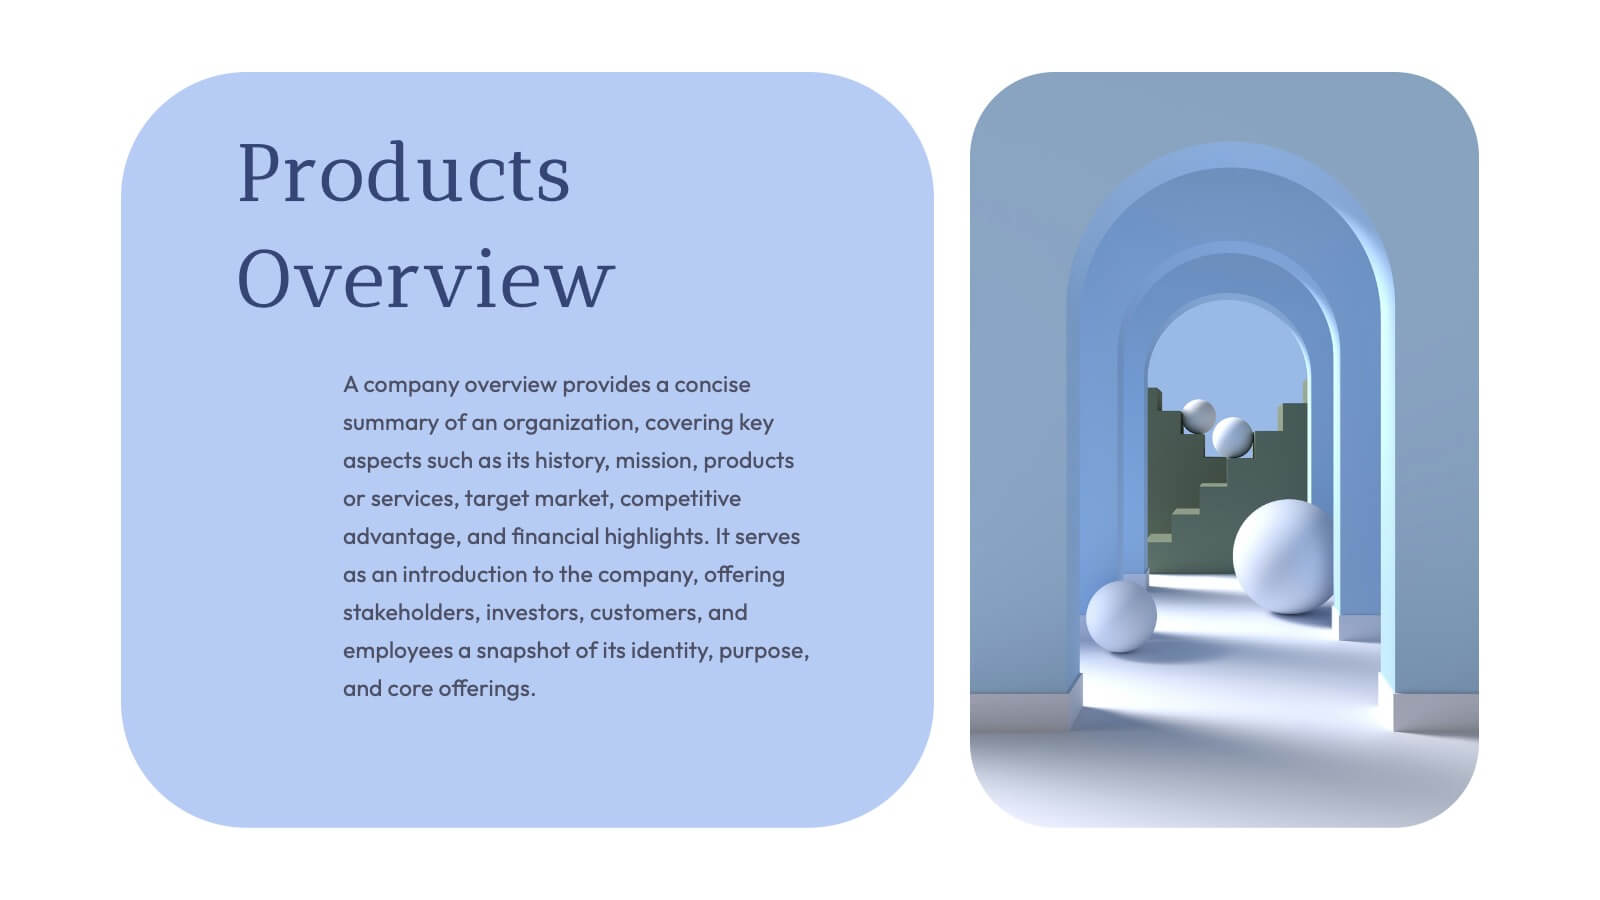
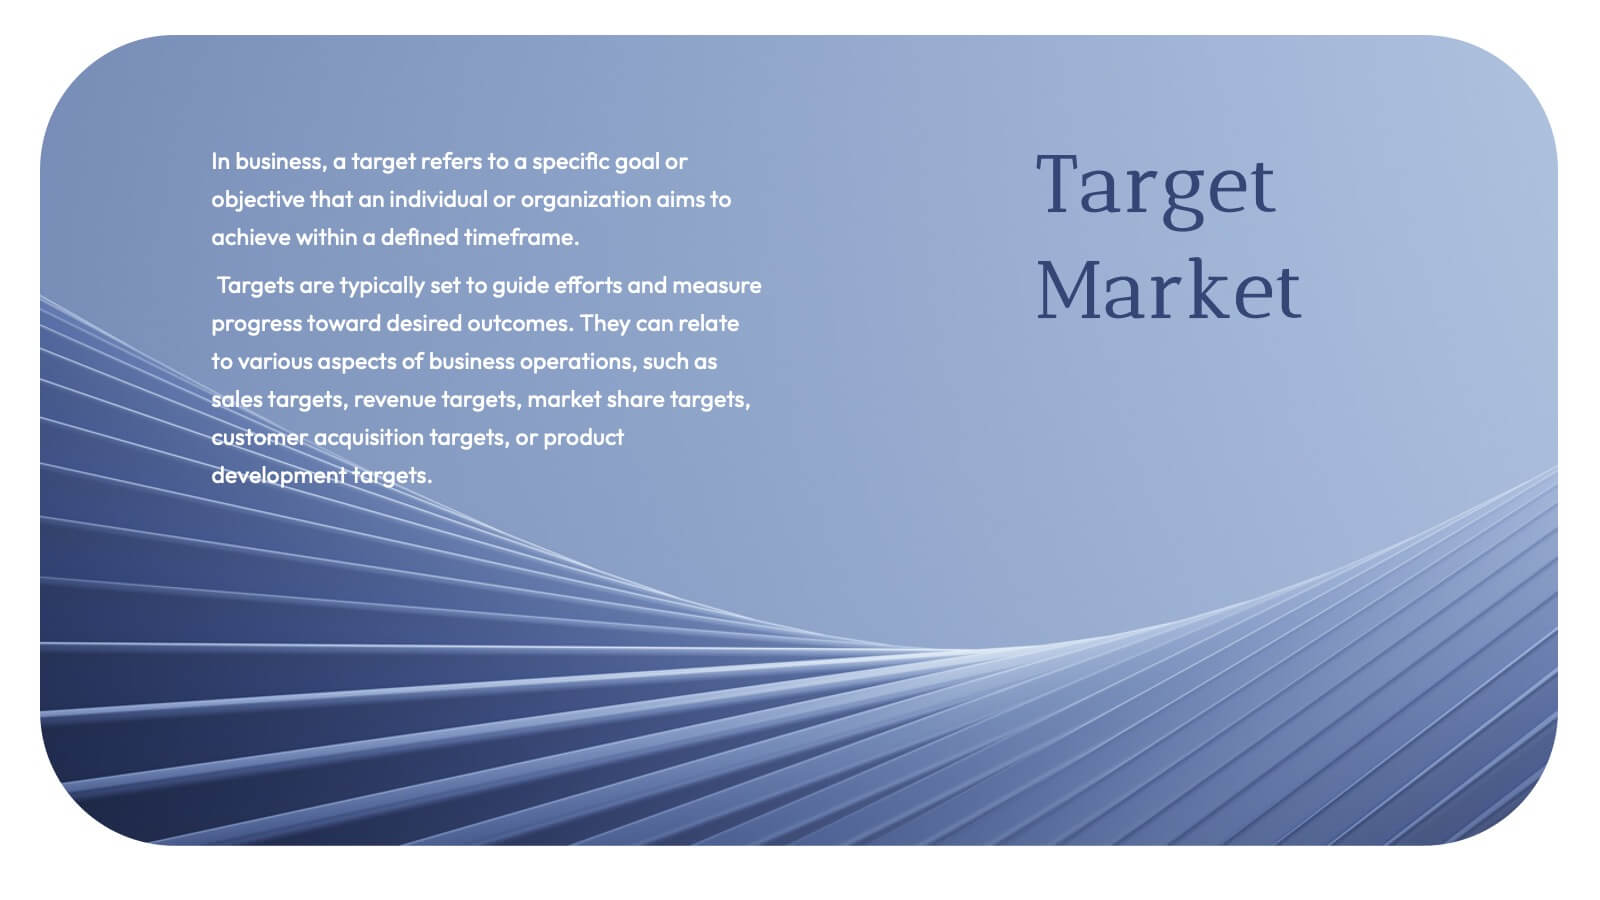
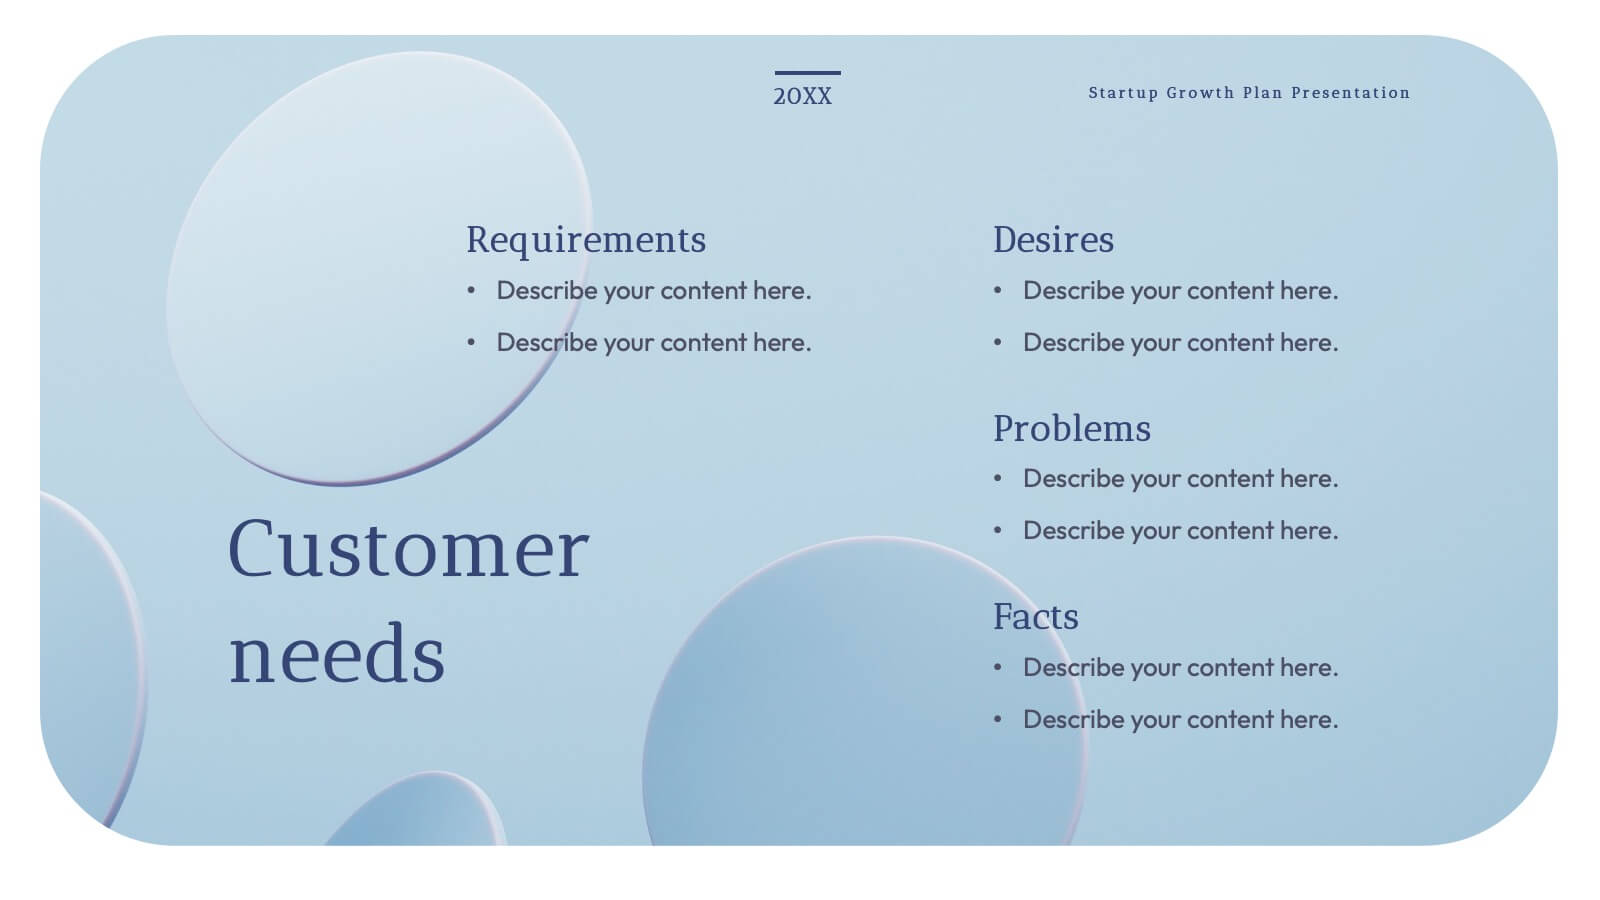
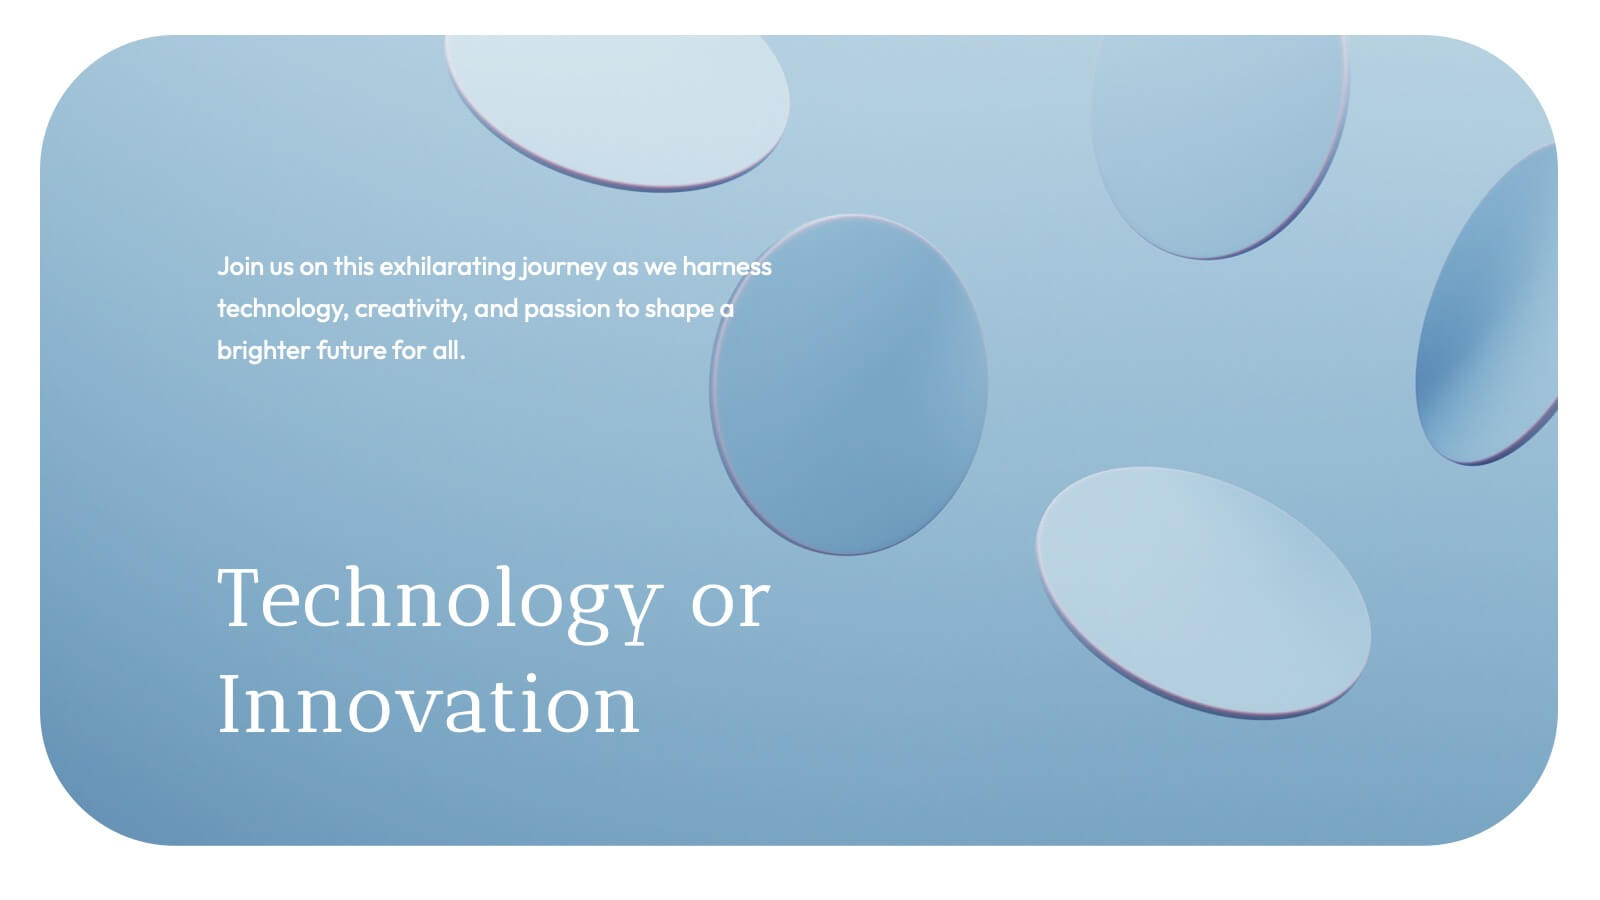
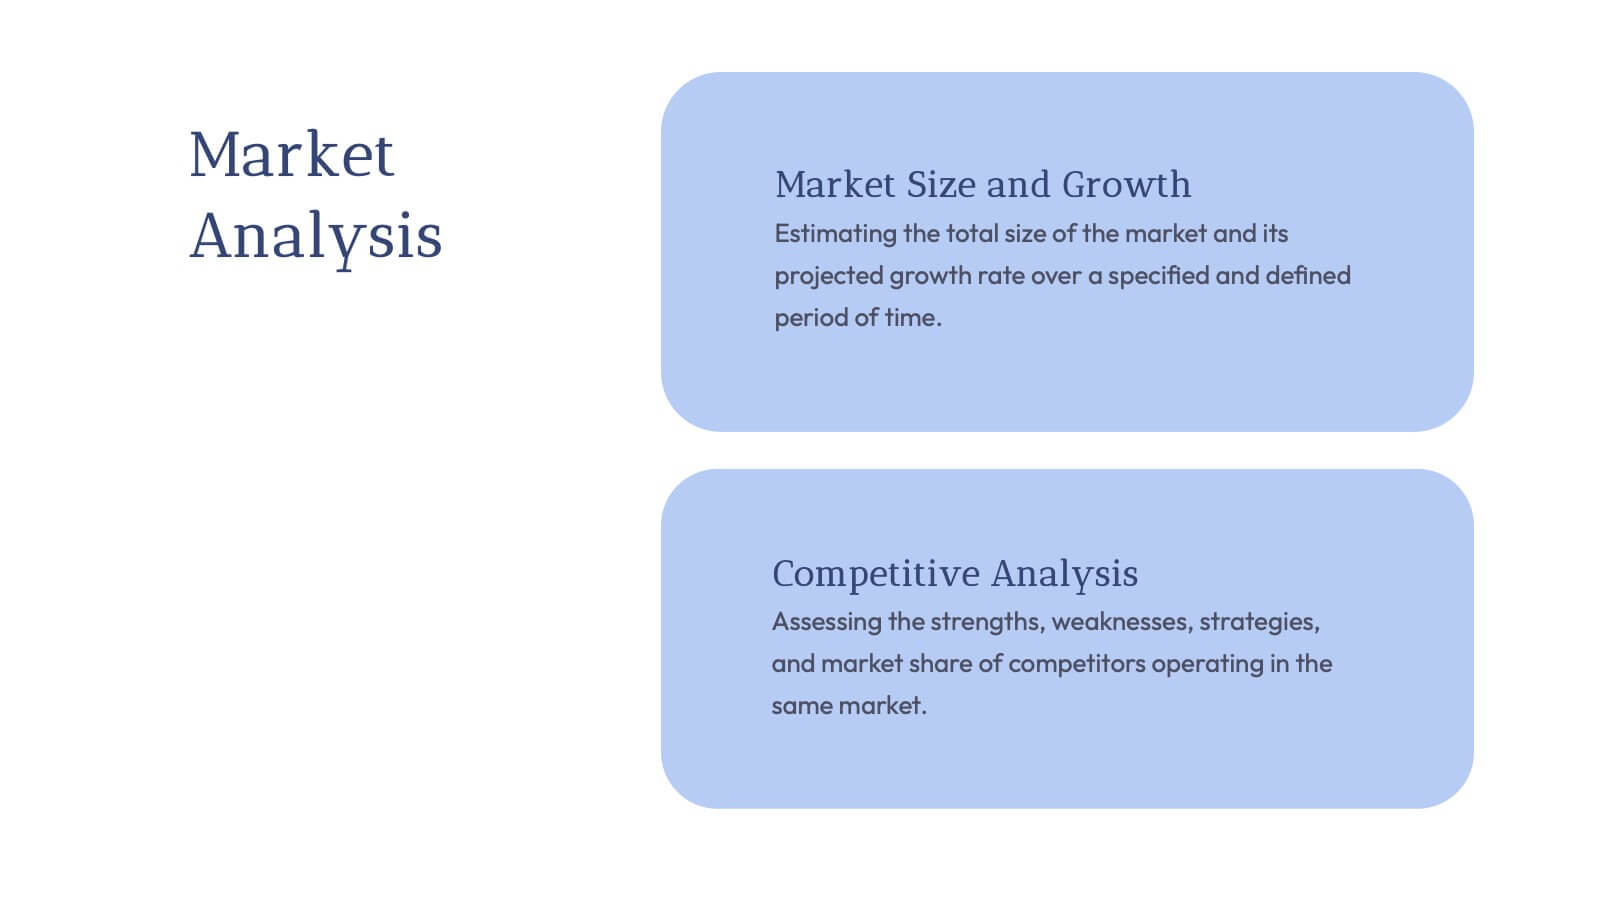
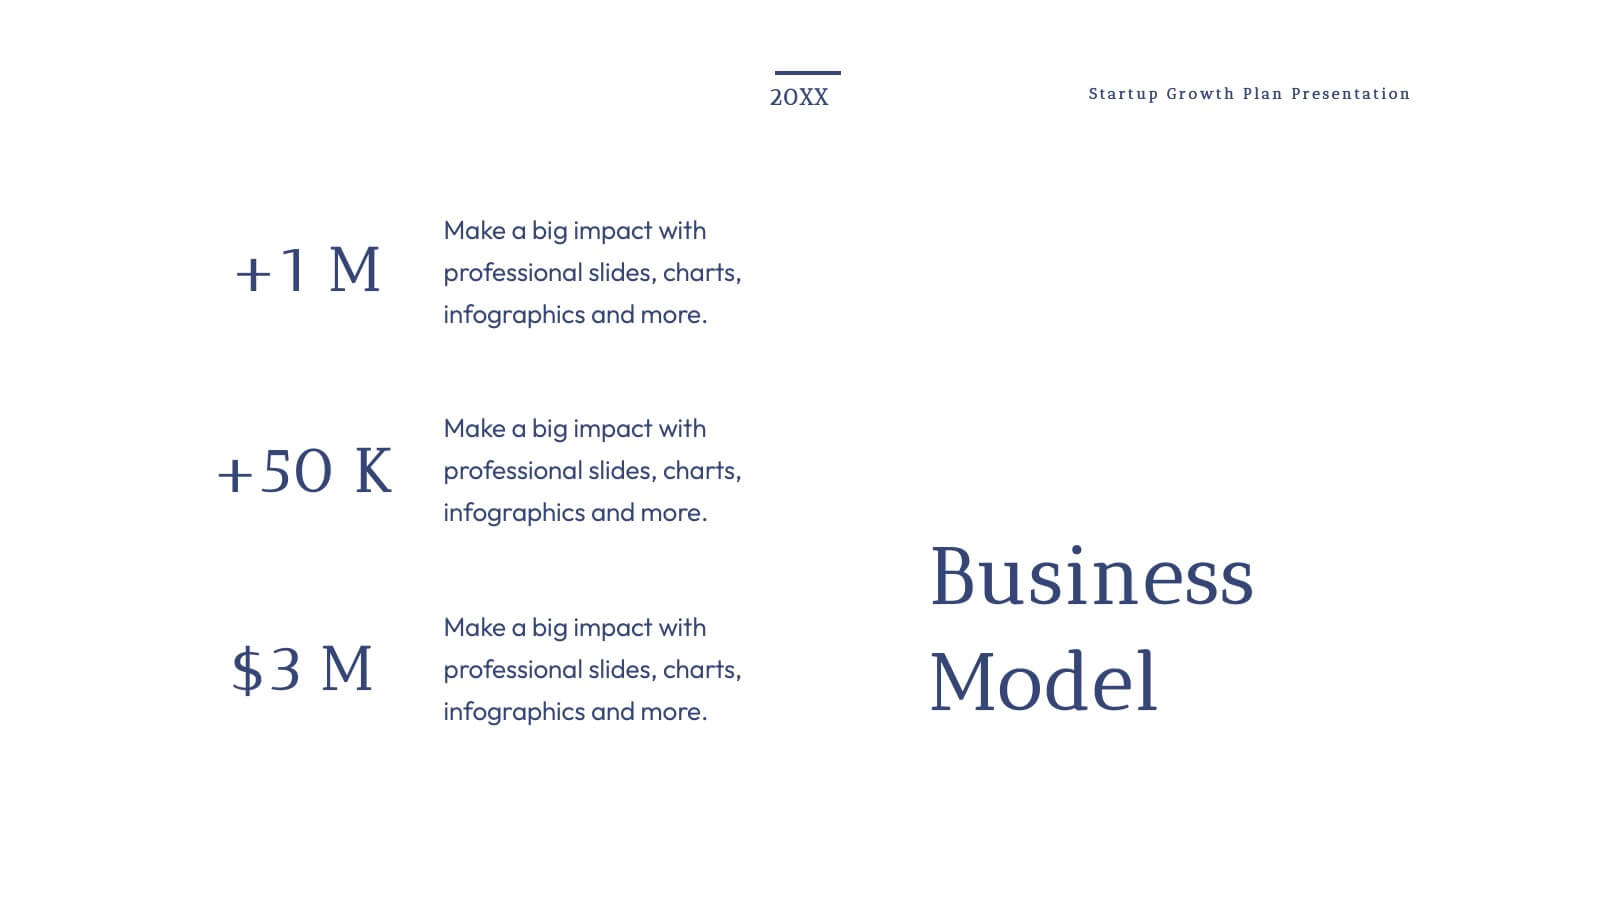
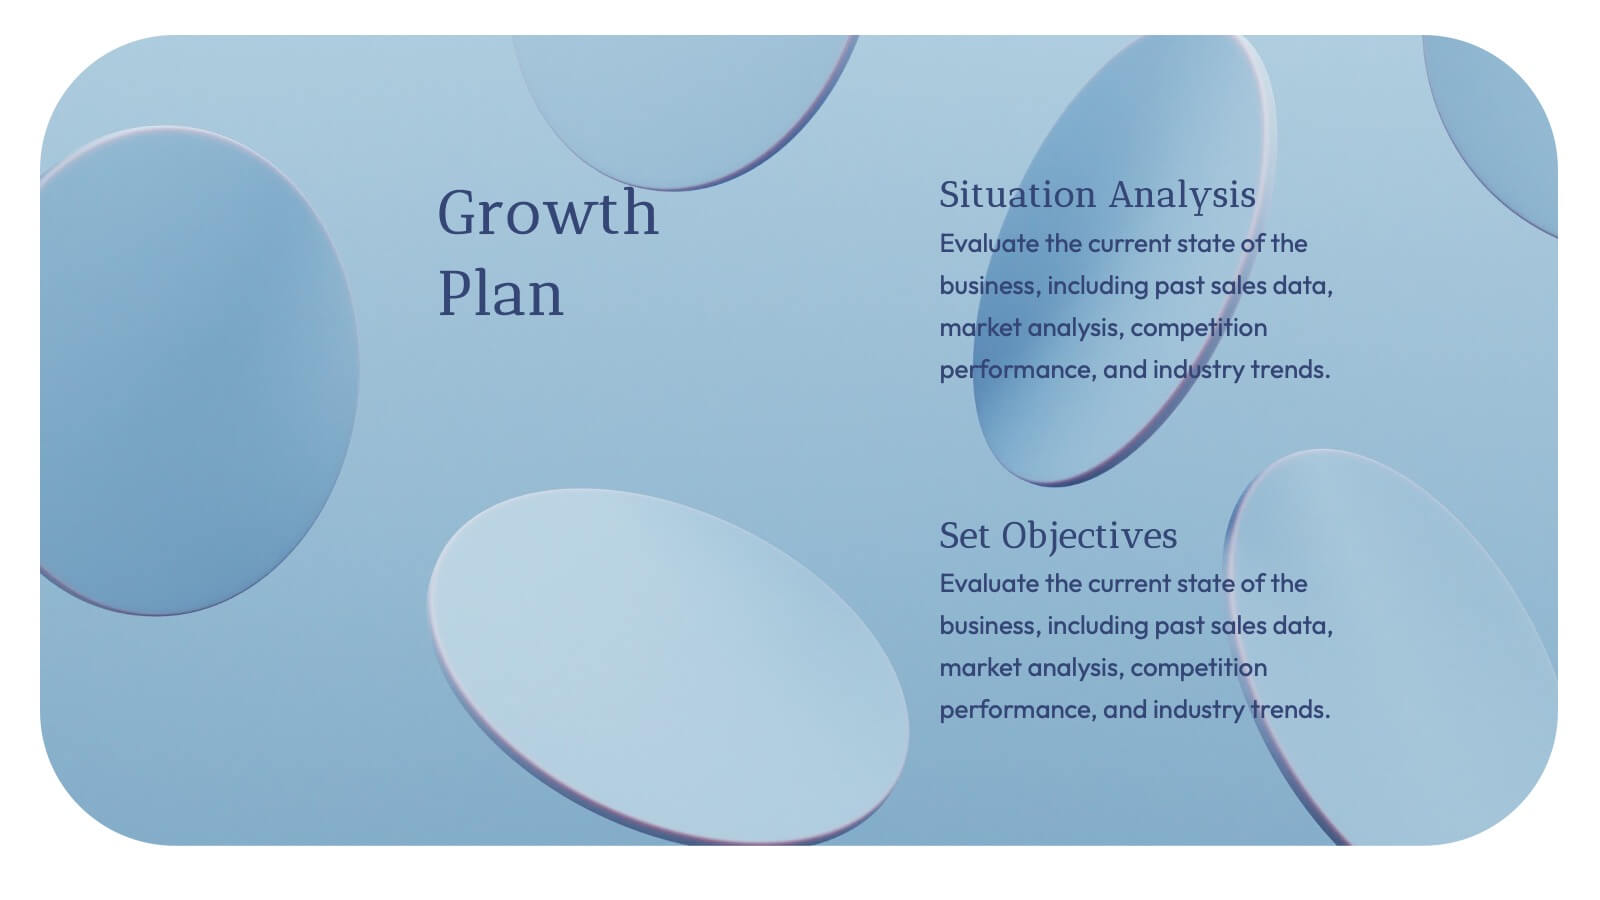
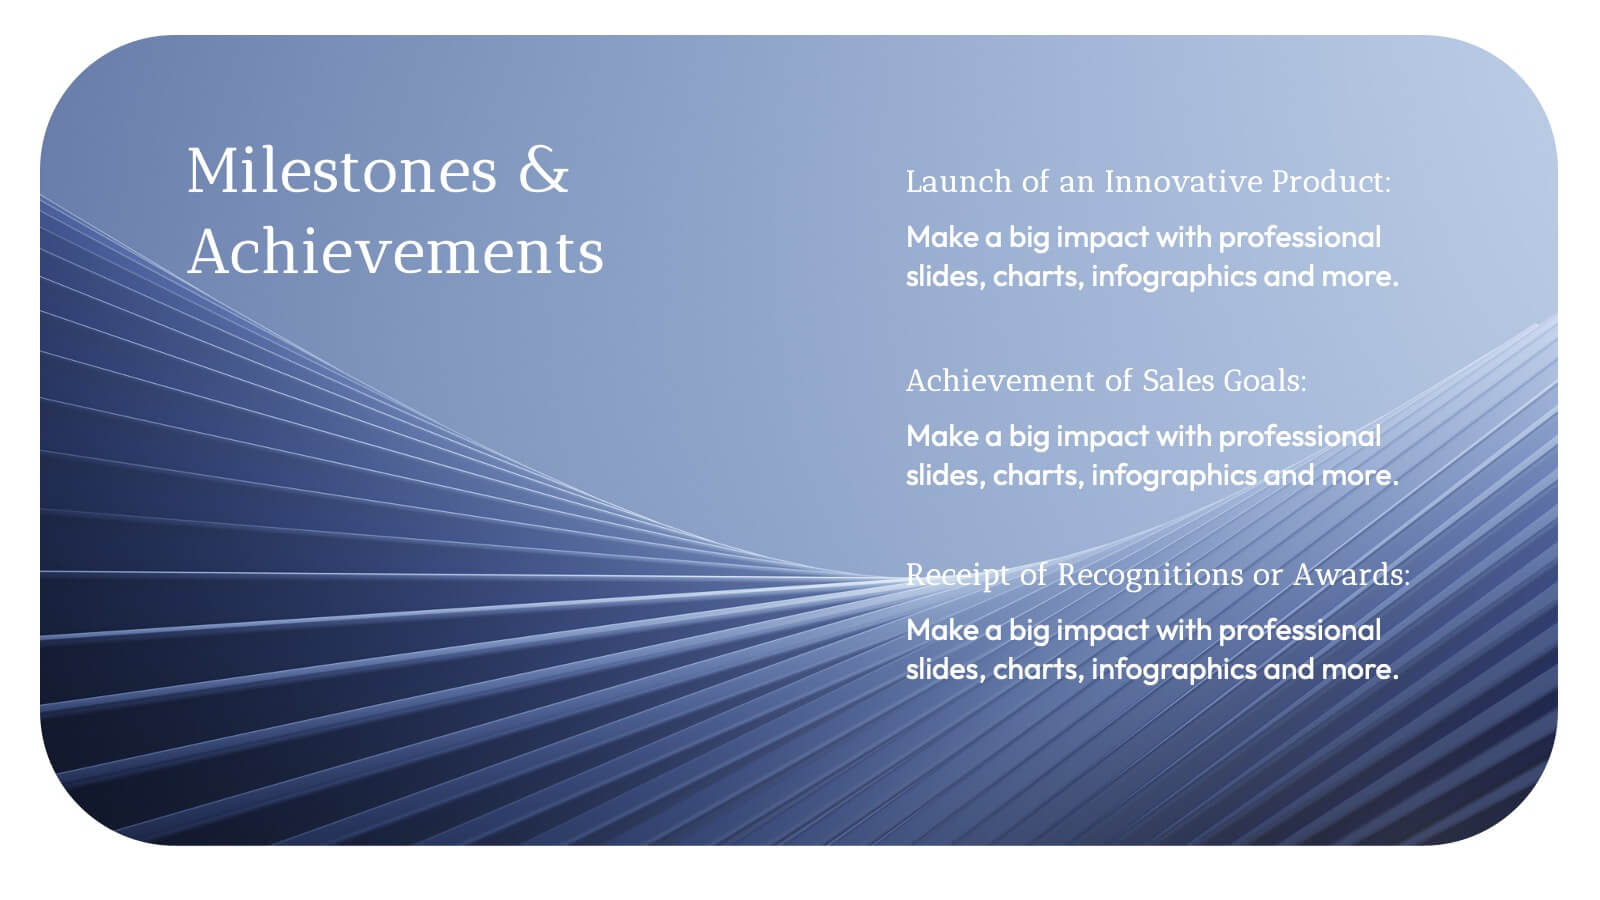
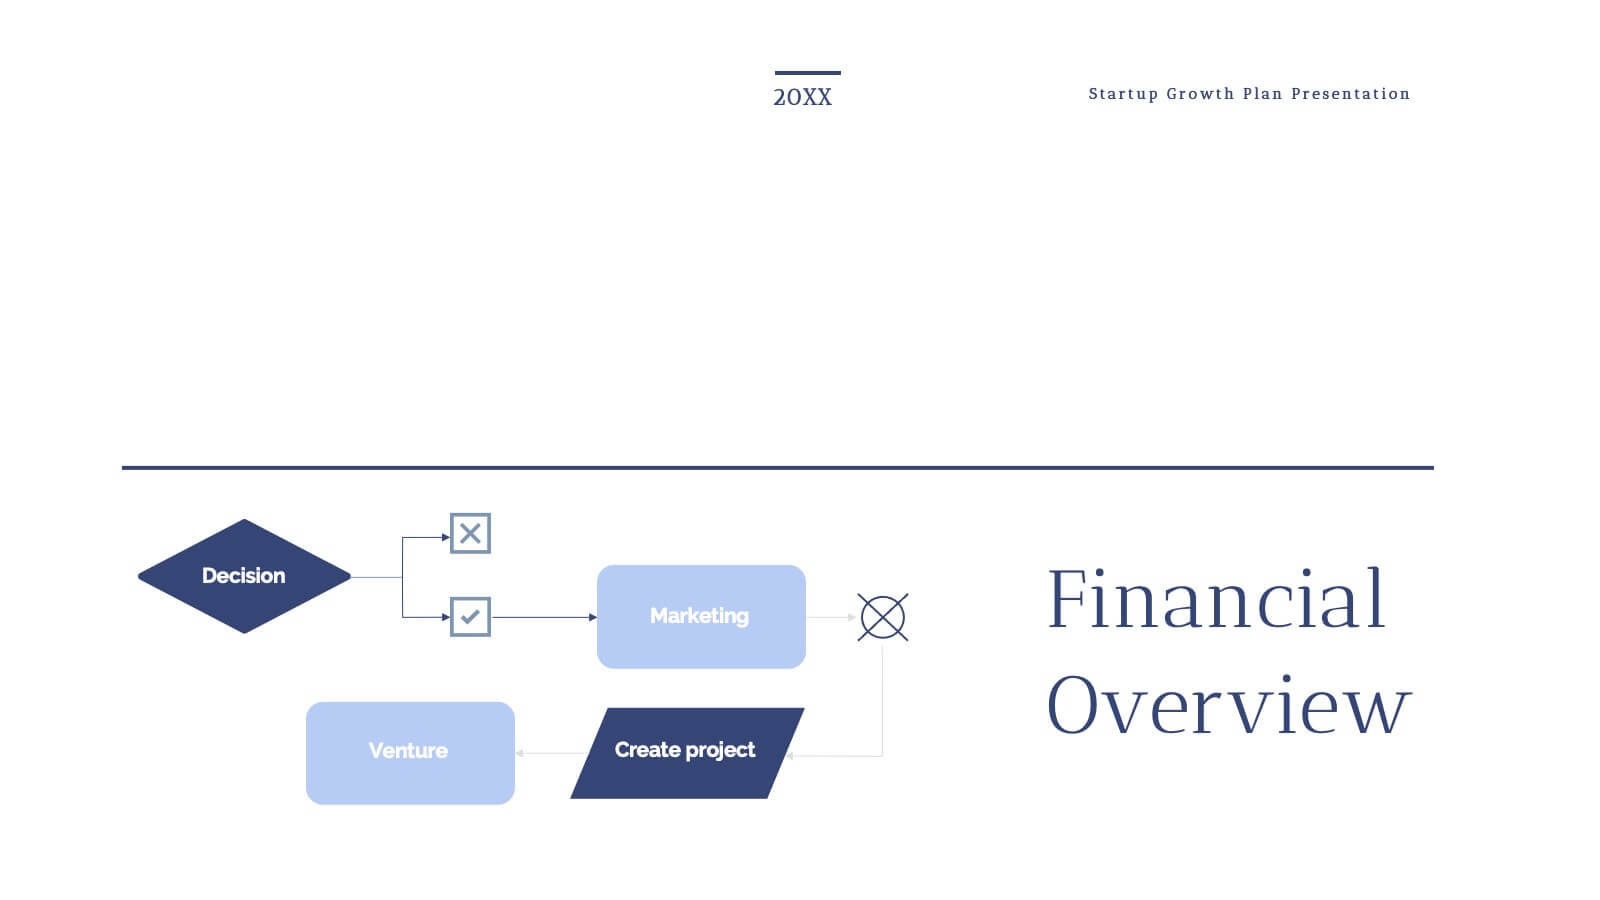
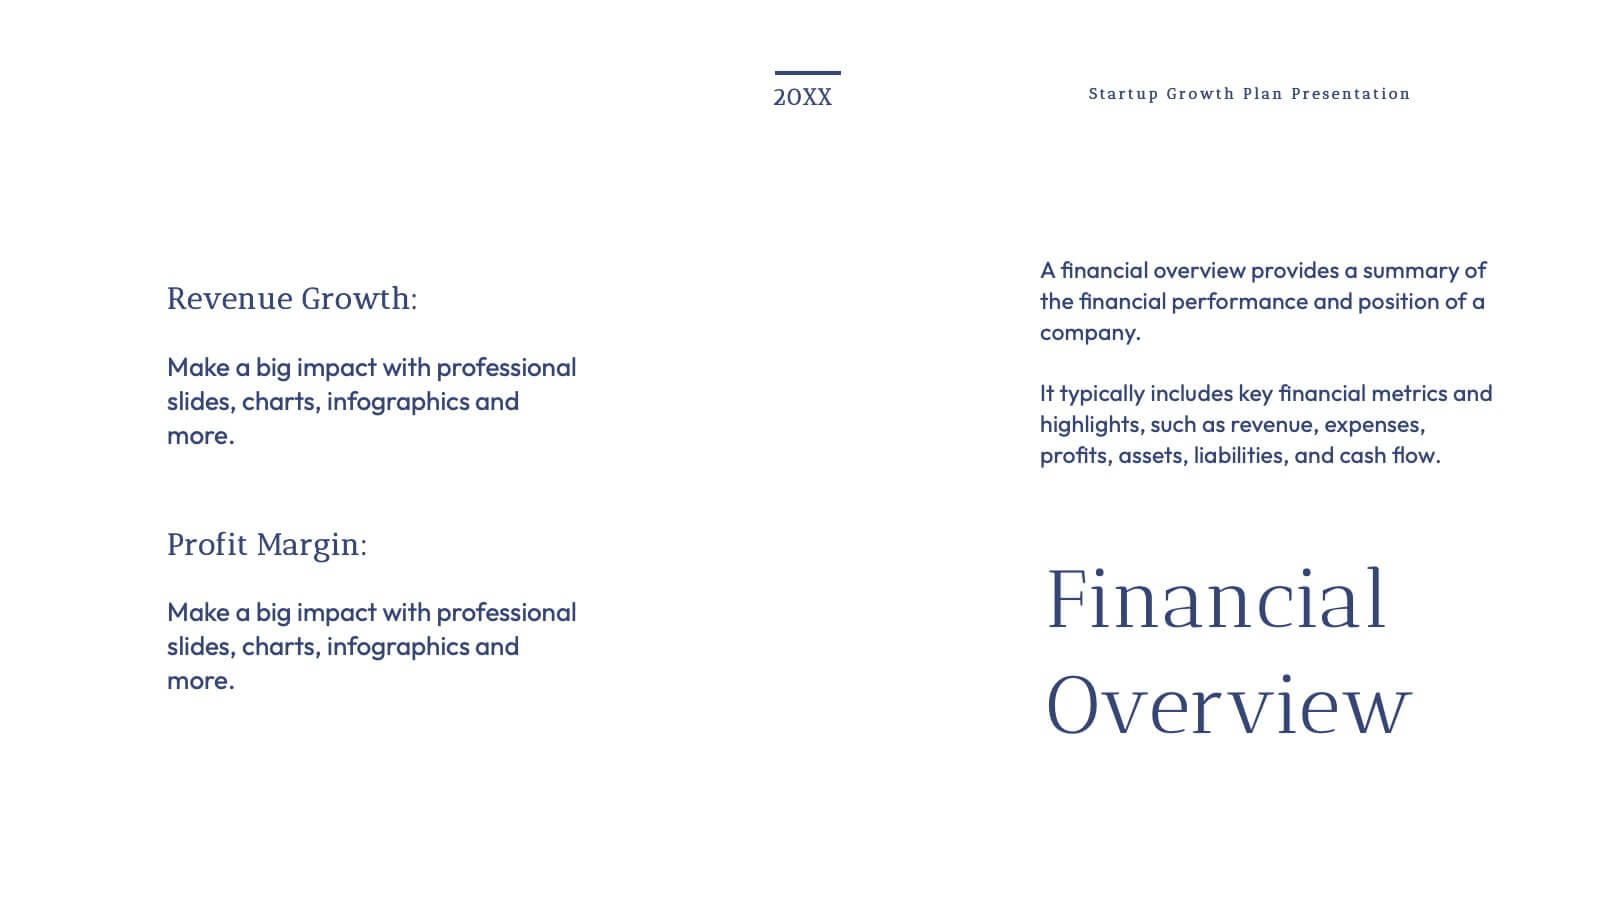
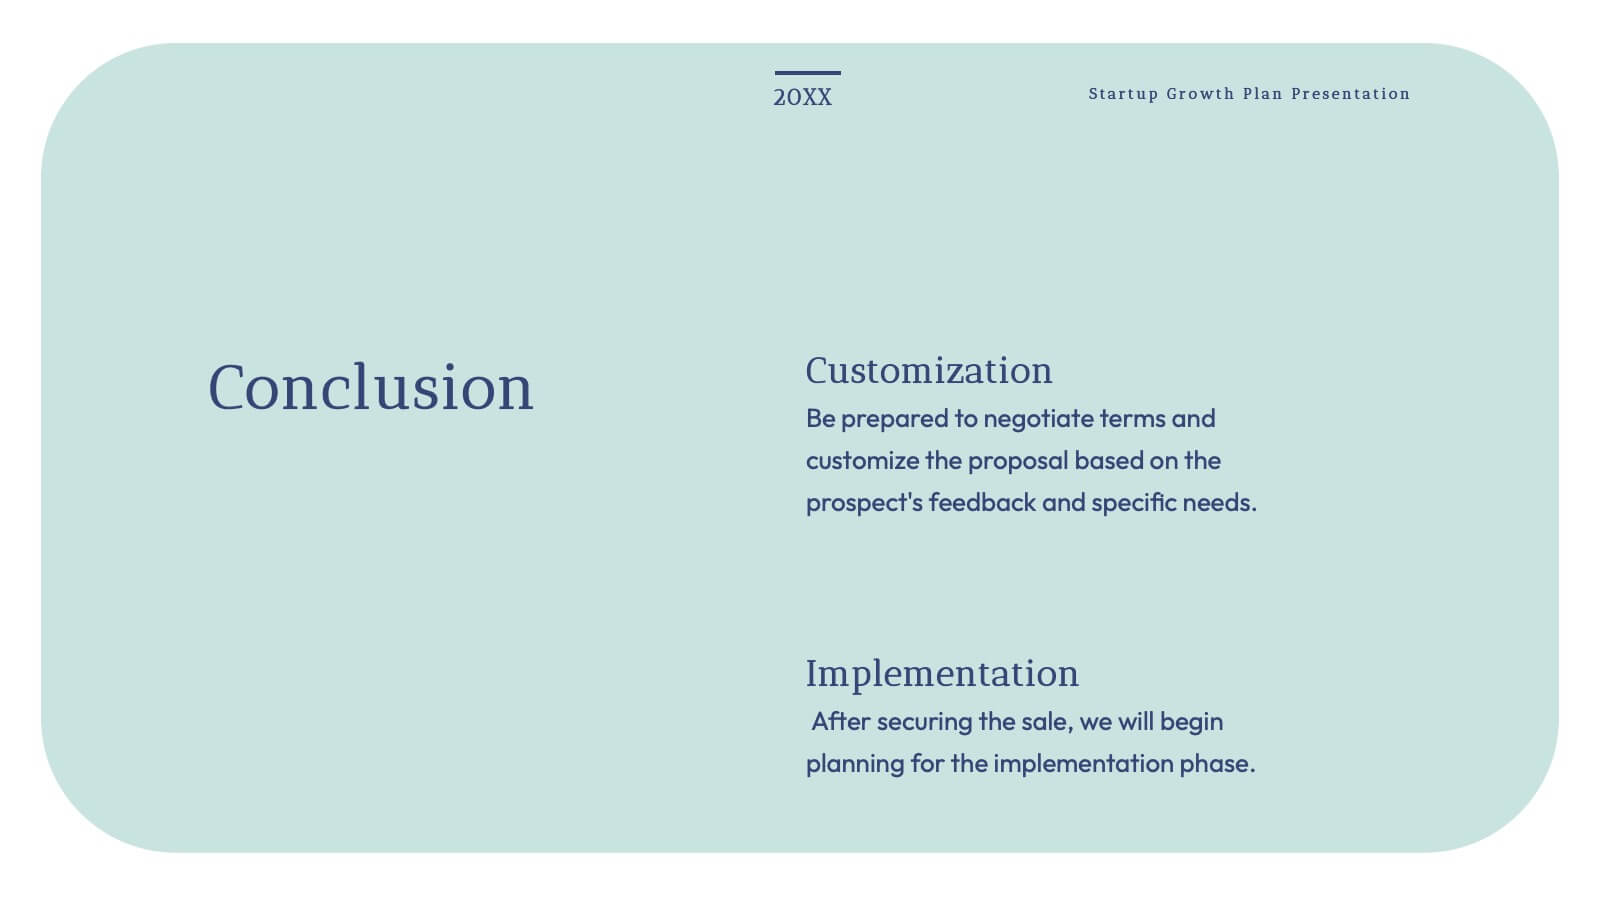
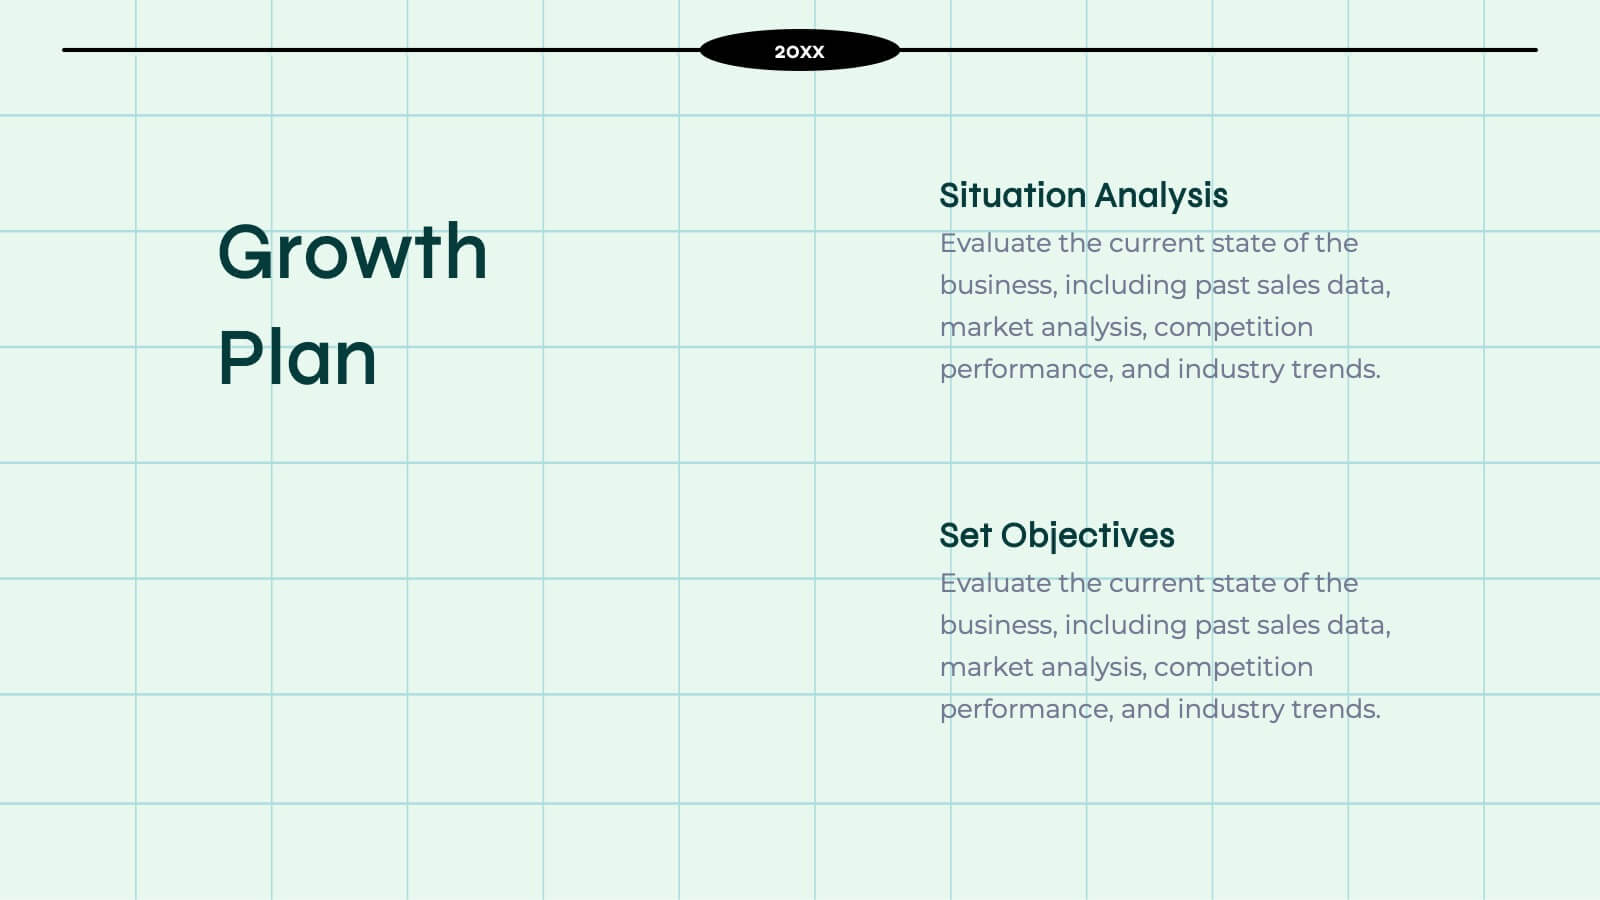
Grecian Startup Growth Plan Presentation
Elevate your pitch with this stunning Grecian-inspired presentation template, perfect for outlining your startup's growth plan! Showcase your business strategy, revenue projections, and scaling opportunities with a clean, elegant design that grabs attention. Impress investors and stakeholders with every slide. Compatible with PowerPoint, Keynote, and Google Slides for seamless customization.


5 diapositivas
Live Sports Infographics
Immerse in the dynamic realm of athletics with our live sports infographics. Crafted in a medley of energetic blue, spirited yellow, and various vivid hues, this template radiates the inherent in the world of sports. Its creative and vertical layout, optimized for impact, is perfect for sports journalists. Compatible with Powerpoint, Keynote, and Google Slides. The compelling graphics, icons, and dedicated image placeholders are specifically tailored to encapsulate the pulse-pounding moments and diverse statistics of live sports events. This visually striking, data-centric tool is indispensable for those seeking to convey complex sports information.


6 diapositivas
Team Work Environment Infographic
A team work environment refers to the conditions and culture within a group of individuals who come together to work collaboratively on a common goal or project. This infographic template highlights the importance of teamwork and fosters a positive team-oriented workplace culture. The design emphasizes the key elements and benefits of a collaborative work environment, encouraging employees to work together effectively and efficiently. This infographic features illustrations that depict employees working together, collaborating, and supporting one another. This reinforces the idea of teamwork and unity within the organization.


23 diapositivas
Kitsune Startup Strategy Presentation
This startup strategy template is designed for clear communication of business vision, target market, and unique value proposition. It also includes slides for marketing strategies, team introduction, and financial overview. Its clean, professional layout makes it ideal for investors or stakeholders. Compatible with PowerPoint, Keynote, and Google Slides for easy customization.


22 diapositivas
SEO Report Presentation
Optimize your SEO strategies using our comprehensive SEO Report template. It includes sections for keyword performance, market trends, competitor insights, and client feedback. Tailored for digital marketers and SEO specialists, this template supports presentations in PowerPoint, Keynote, and Google Slides.


21 diapositivas
Novaedge Professional Portfolio Showcase Presentation
Showcase your expertise with this elegant experience proposal presentation! Featuring sections like portfolio highlights, creative process, client testimonials, and pricing packages, it provides a complete overview of your work. Ideal for freelance professionals or agencies, this template ensures a polished presentation. Fully compatible with PowerPoint, Keynote, and Google Slides.


20 diapositivas
Oscillation Project Proposal Presentation
This project proposal template is designed to captivate your audience with a bold purple and yellow color scheme, adding a modern flair to your presentation. It includes comprehensive sections like company overview, objectives and goals, methodology, deliverables, and budget breakdown. Perfect for clearly communicating your project vision and strategy, this template streamlines your content while highlighting your professional approach. Compatible with PowerPoint, Keynote, and Google Slides, it provides versatility for seamless delivery across platforms.


21 diapositivas
Illume Detailed Project Execution Plan Presentation
Get ready to wow your audience with this dynamic Project Execution Plan template! Bursting with sleek design, it transforms your project timelines, deliverables, and stakeholder analysis into a stunning visual journey. Keep everyone engaged while you showcase your strategy with flair and finesse. Perfect for PowerPoint, Keynote, and Google Slides!


7 diapositivas
Health Department Infographic
A health department is a government or public authority at the local, regional, or national level that is primarily responsible for protecting and promoting public health within a specific jurisdiction. This template allows you to embark on a visual voyage through the realm of health and wellness with our health department infographic. Compatible with Powerpoint, Keynote, and Google Slides. This is designed to provide you with a holistic understanding of the various aspects of healthcare and well-being, this infographic encapsulates vital information that empowers individuals and communities to lead healthy lives.