


Características


¿Tienes alguna pregunta?
Recomendar


26 diapositivas
Doriyan Presentation Template
Doriyan is a beautiful, colorful, professional and descriptive presentation. This template has wonderful colors and graphics that are engaging and conveys the information to the audience. This template is suitable for all types of businesses especially those that are investors, realtors or other companies involved in investment advice. Charts, timelines and easy to edit text makes this template perfect for businesses seeking to introduce there business and services to make a great impression. Doriyan offers a way to boost your business. Present your information with this efficient template!


26 diapositivas
Ioel Presentation Template
Here's the perfect kickstart to your business with a presentation template that you’ve been dreaming of! Ioel's crisp, bold font and a clean aesthetic that is engaging to any audience. This template will give your business a bolder and more professional image that you need. Ioel's bold blue background is eye-catching, making this template perfect for businesses seeking to make a great impression. This template will make it easy for you to create an attractive and professional-looking deck. Any business owner wishing to make an impression on their audience will want to use this presentation.


24 diapositivas
Minerva UX Design Presentation
Elevate your UX design presentations with this comprehensive template, featuring sections for project overview, user research, wireframes, prototyping, and usability testing. Showcase design systems, branding guidelines, and accessibility considerations with ease. Perfect for demonstrating a user-centered approach. Compatible with PowerPoint, Keynote, and Google Slides for seamless customization.


4 diapositivas
Root Cause Problem Solving Presentation
Uncover insights with a clear, visual approach that makes complex issues easy to understand and communicate. This presentation guides audiences through identifying underlying problems, mapping causes, and highlighting solutions in a structured, memorable way. Clean icons and tree-based visuals keep your message engaging. Fully compatible with PowerPoint, Keynote, and Google Slides.


26 diapositivas
Kimbr Presentation Template
Kimbr is a modern and simple Powerpoint template that uses bold text in order to immediately catch your audience’s attention and let them focus on your innovative ideas. Combined with the modern and minimalistic style of Kimbr, this presentation packs a punch in the minimalism department: It comes with unique and modern slides perfect for Spa businesses or anyone looking for a clean minimal presentation. In addition, it has Charts, timelines and image placeholders, you'll be sure to find a space for all your information. Don't wait any longer and get started presenting your ideas today.


10 diapositivas
Workforce Learning & Training Module Presentation
Visualize your team’s learning journey with the Workforce Learning & Training Module Presentation. This hexagonal layout clearly maps training pillars or module stages, helping you present development plans in a structured, engaging way. Ideal for HR professionals, corporate trainers, and consultants. Fully editable in PowerPoint, Keynote, Google Slides, and Canva.


5 diapositivas
Business Goals Roadmap Presentation
Bring your long-term vision to life with a clear, structured roadmap that highlights each milestone in your business journey. This presentation helps you outline key objectives, track progress, and communicate strategic priorities with ease. Ideal for planning, strategy, and growth discussions. Fully compatible with PowerPoint, Keynote, and Google Slides.


3 diapositivas
Stock Market Performance Overview Presentation
Showcase financial growth like a pro with this clean, data-driven layout designed to visualize performance, market activity, and business progress over time. Ideal for professionals presenting key financial trends, metrics, or strategies. Fully compatible with PowerPoint, Keynote, and Google Slides for easy customization and professional presentation results.


12 diapositivas
Timeline Path to Market Strategy Presentation
Outline your market strategy with this step-by-step timeline slide. Ideal for product launches, go-to-market plans, or business rollouts. Includes 6 editable phases with directional arrows, year markers, and text boxes for customization. Fully compatible with PowerPoint, Keynote, and Google Slides—perfect for marketers, strategists, and business development teams.


4 diapositivas
IT Network Infrastructure
Simplify the complexity of your digital ecosystem with this IT Network Infrastructure presentation. Designed to visualize connectivity, servers, and system architecture, this layout is perfect for IT teams, consultants, and tech-focused reports. Fully editable in PowerPoint, Keynote, and Google Slides for seamless integration into your workflow.


26 diapositivas
Ethical Business Practices Presentation
Promote integrity with our Ethical Business Practices presentation template, suitable for PowerPoint, Keynote, and Google Slides. This essential tool is crafted for business leaders, compliance officers, and educators who aim to reinforce the importance of ethics in the corporate environment. Our template facilitates a clear understanding of ethical standards in business operations. It includes slides on ethical decision-making, corporate governance, social responsibility, and the long-term benefits of maintaining high ethical standards. With customizable layouts, you can present real-world scenarios, ethical frameworks, and company policies that illustrate your commitment to ethical conduct. This SEO-optimized template is key for reaching audiences interested in building trust and credibility through responsible business practices. Use this template to lead discussions on ethics, influence corporate culture positively, and showcase how ethical behavior is not just right but also beneficial for business success.


6 diapositivas
Strategic Business Objective Mapping Presentation
Clearly define your strategic focus with this Strategic Business Objective Mapping slide. Designed to display six core objectives around a central theme, it’s ideal for visualizing business goals, departmental priorities, or key initiatives. Fully customizable in PowerPoint, Canva, and Google Slides for seamless team collaboration.


4 diapositivas
Project Milestone Path Roadmap Presentation
Bring your project plan to life with a clean, colorful layout that makes every milestone easy to follow across each quarter. This presentation helps you organize tasks, timelines, and progress in a clear visual path that supports smarter planning and team alignment. Fully compatible with PowerPoint, Keynote, and Google Slides.


6 diapositivas
Business Model Hexagon Infographic Presentation
Break down complex strategies with the Business Model Hexagon Infographic Presentation. This sleek, six-part hexagonal layout is perfect for illustrating interconnected components like operations, value propositions, and customer segments. Fully editable and easy to customize in PowerPoint, Keynote, or Google Slides—ideal for startups, consultants, and corporate teams.


21 diapositivas
Cineris Product Roadmap Presentation
Present your product vision and strategy with this professional and modern product roadmap presentation template. Covering key aspects such as product overview, features, competitive analysis, pricing strategy, and production process, this template helps you communicate your plan effectively. Designed for easy customization, it’s perfect for internal team alignment, stakeholder presentations, and strategic planning. Compatible with PowerPoint, Keynote, and Google Slides.
8 diapositivas
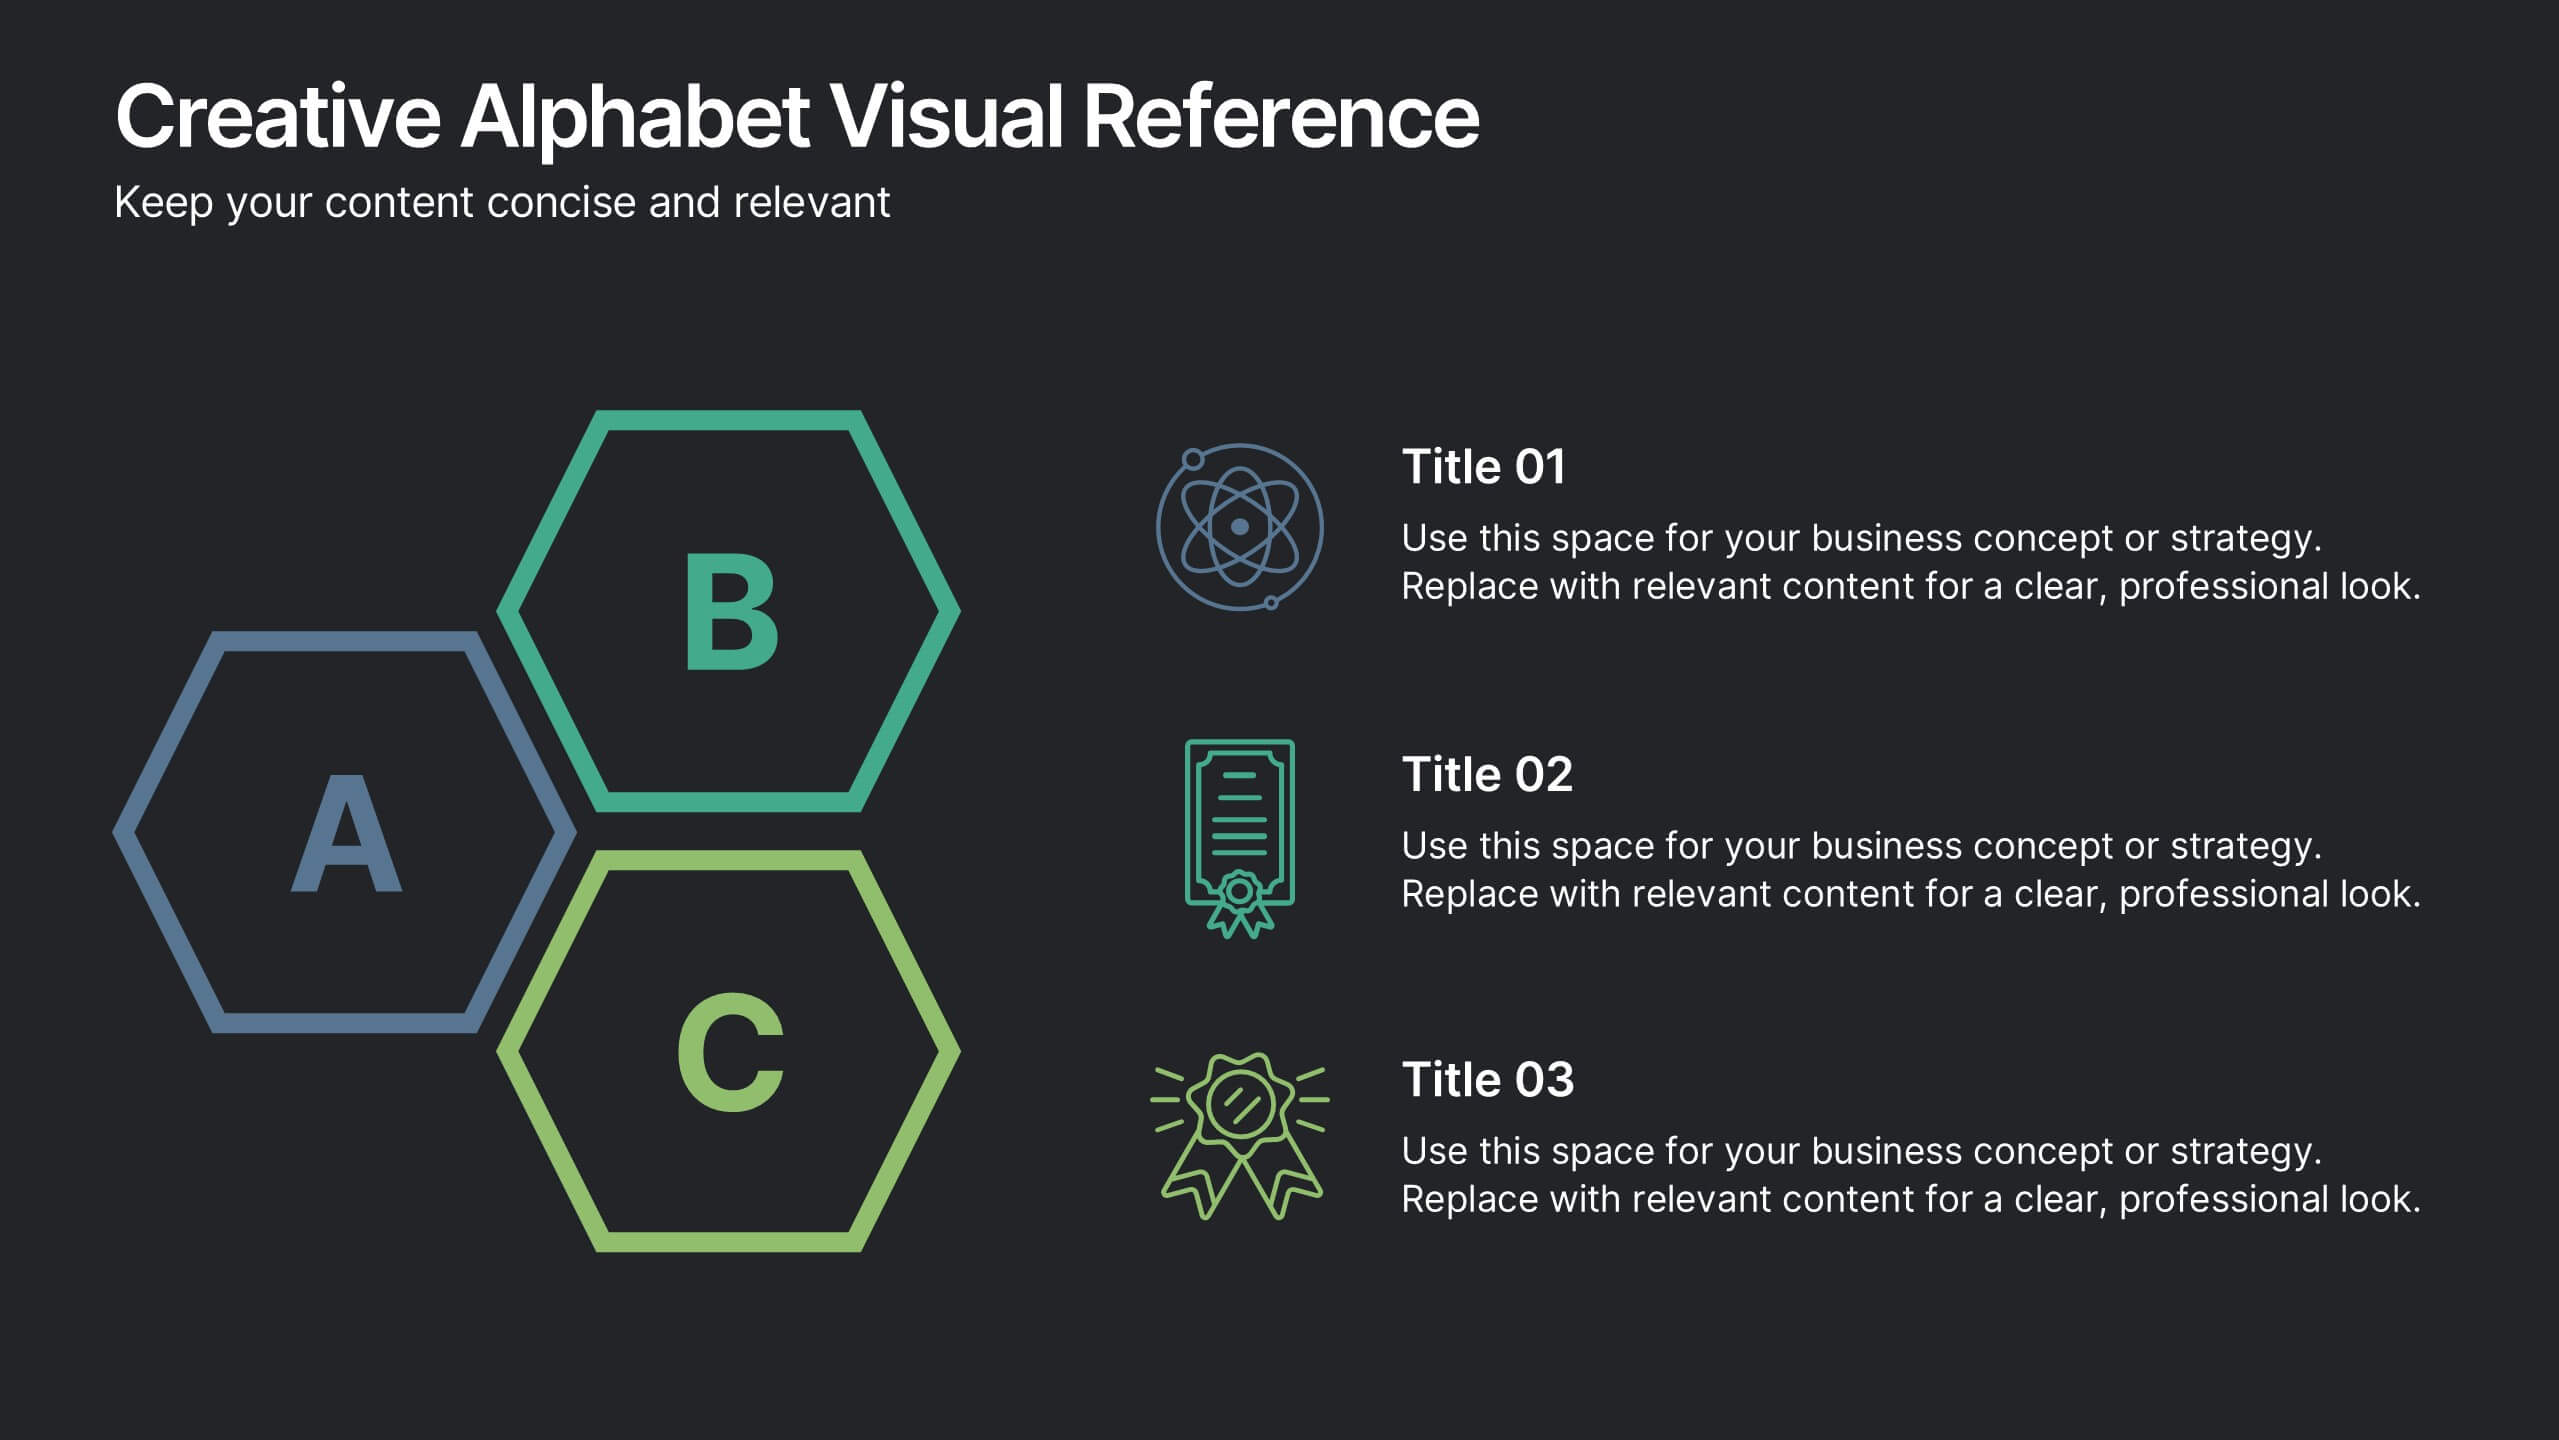
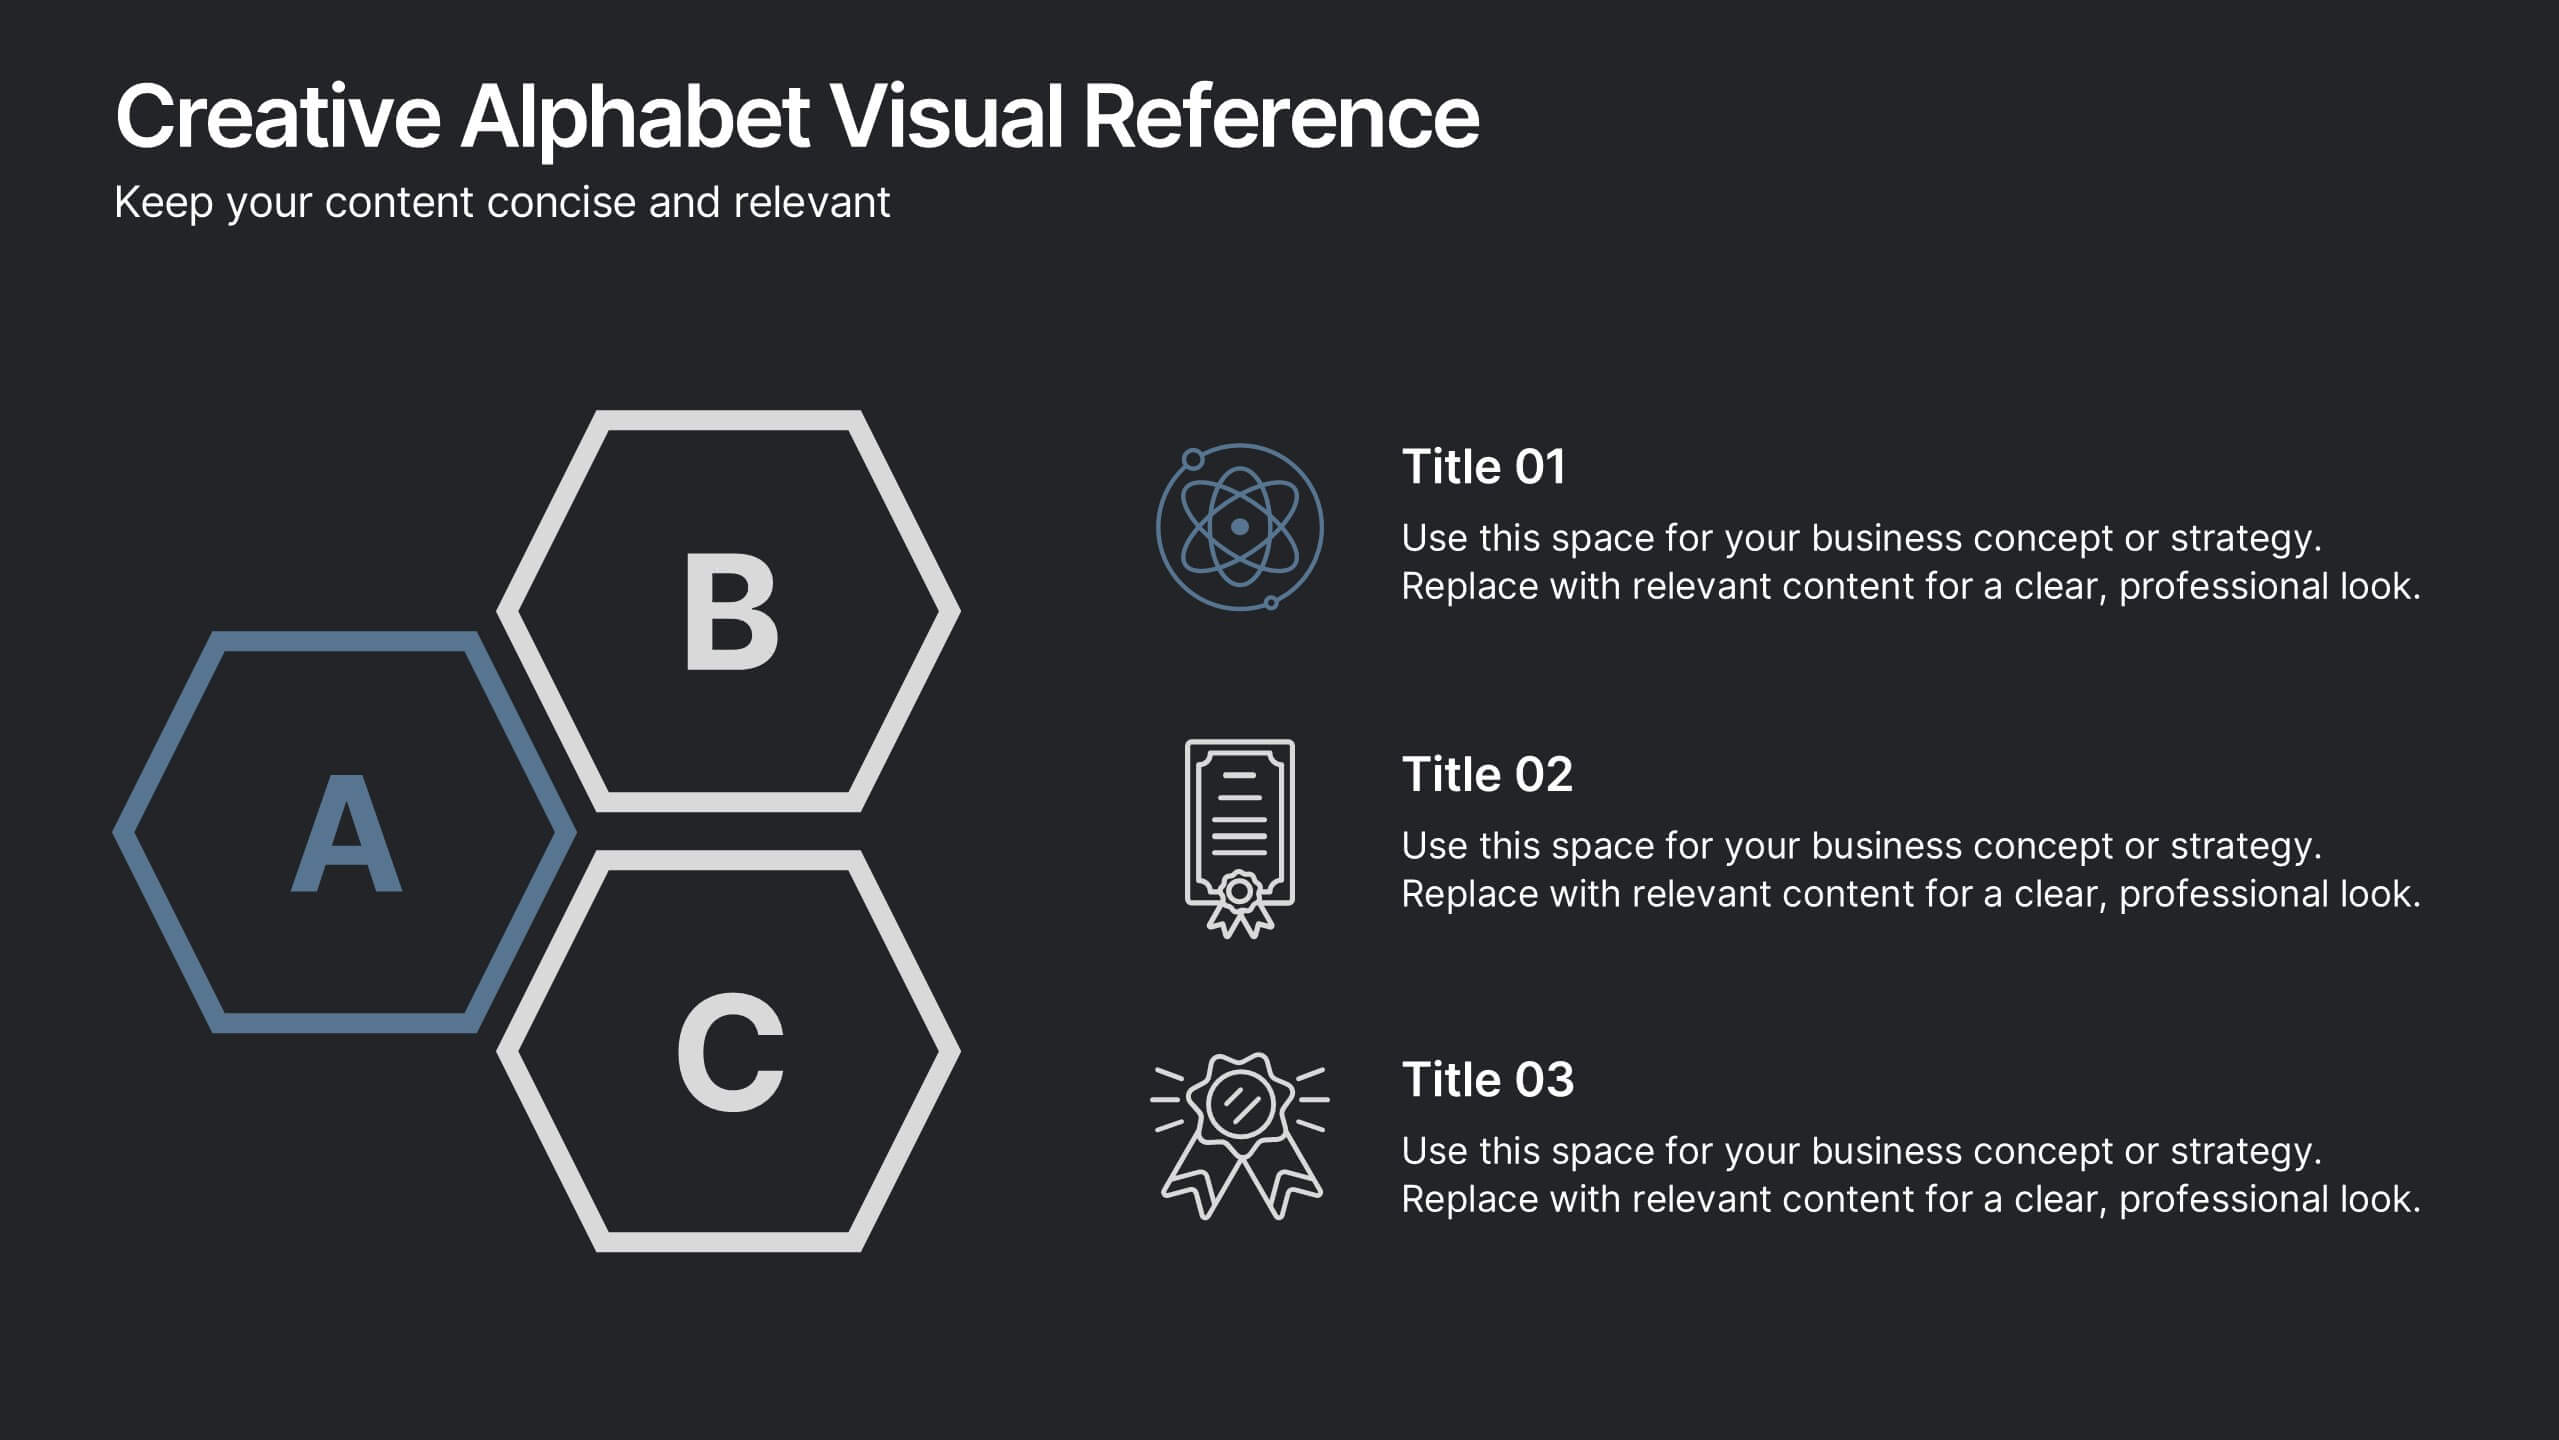
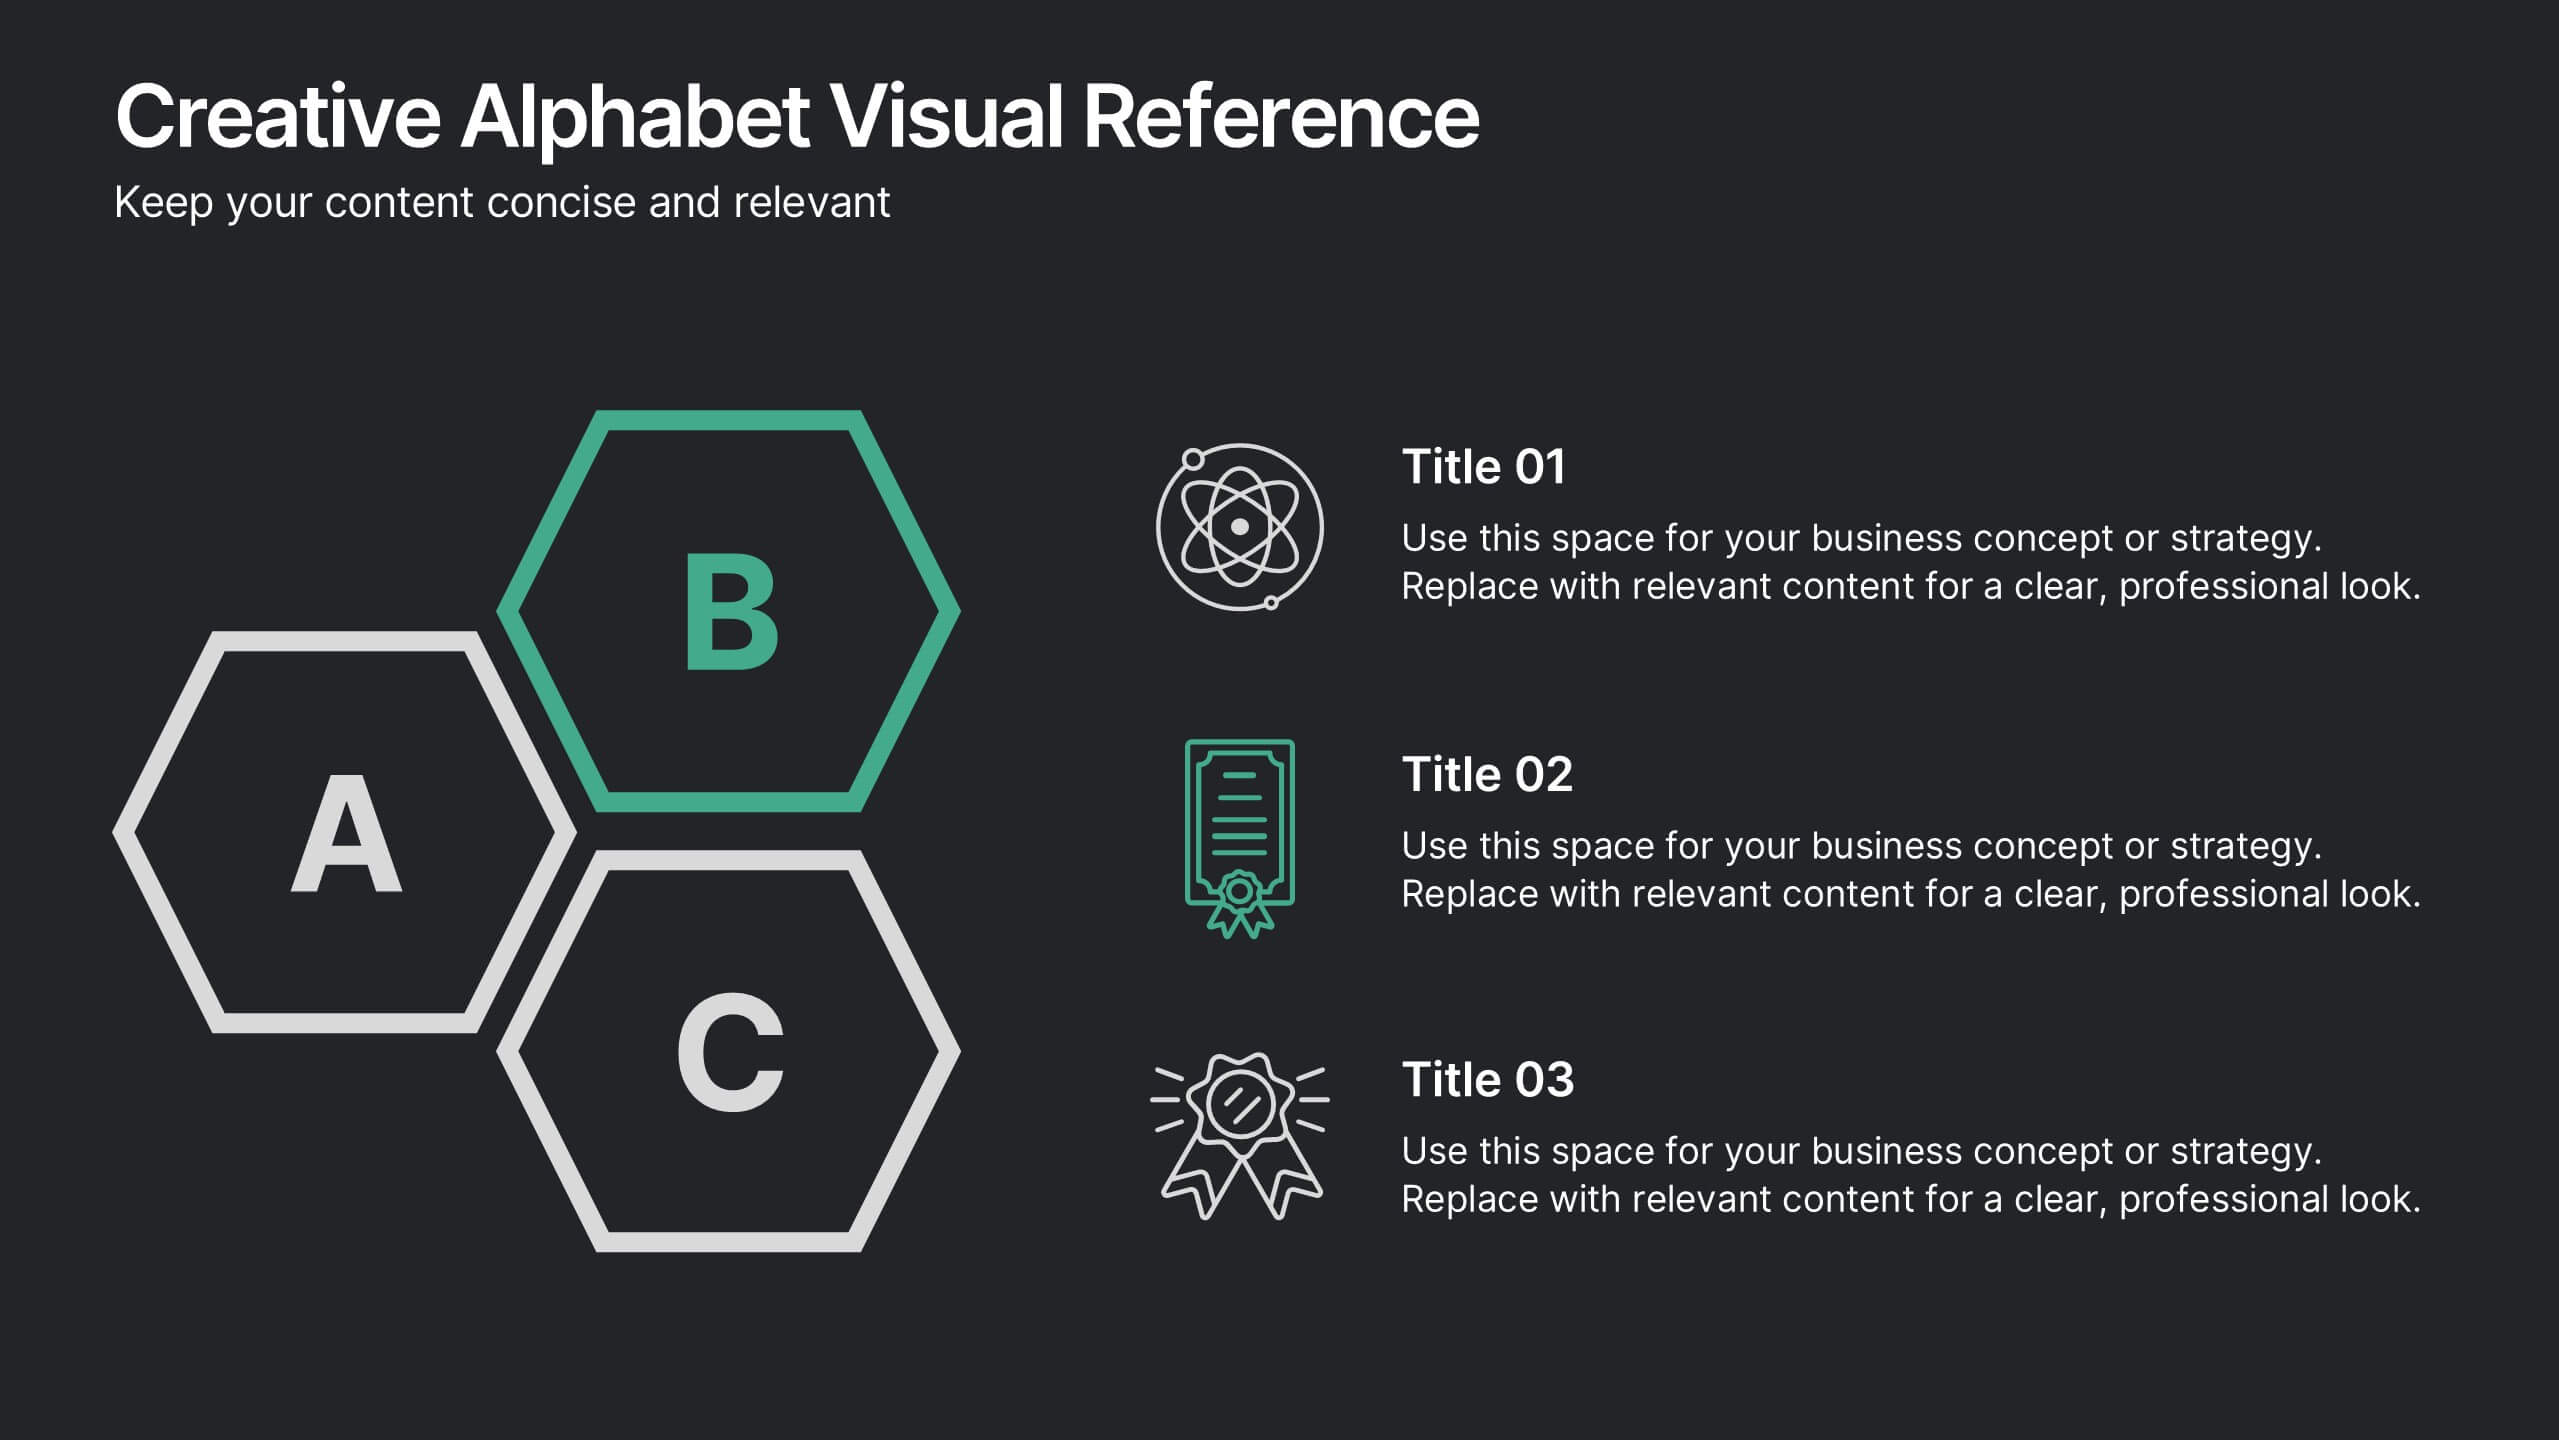
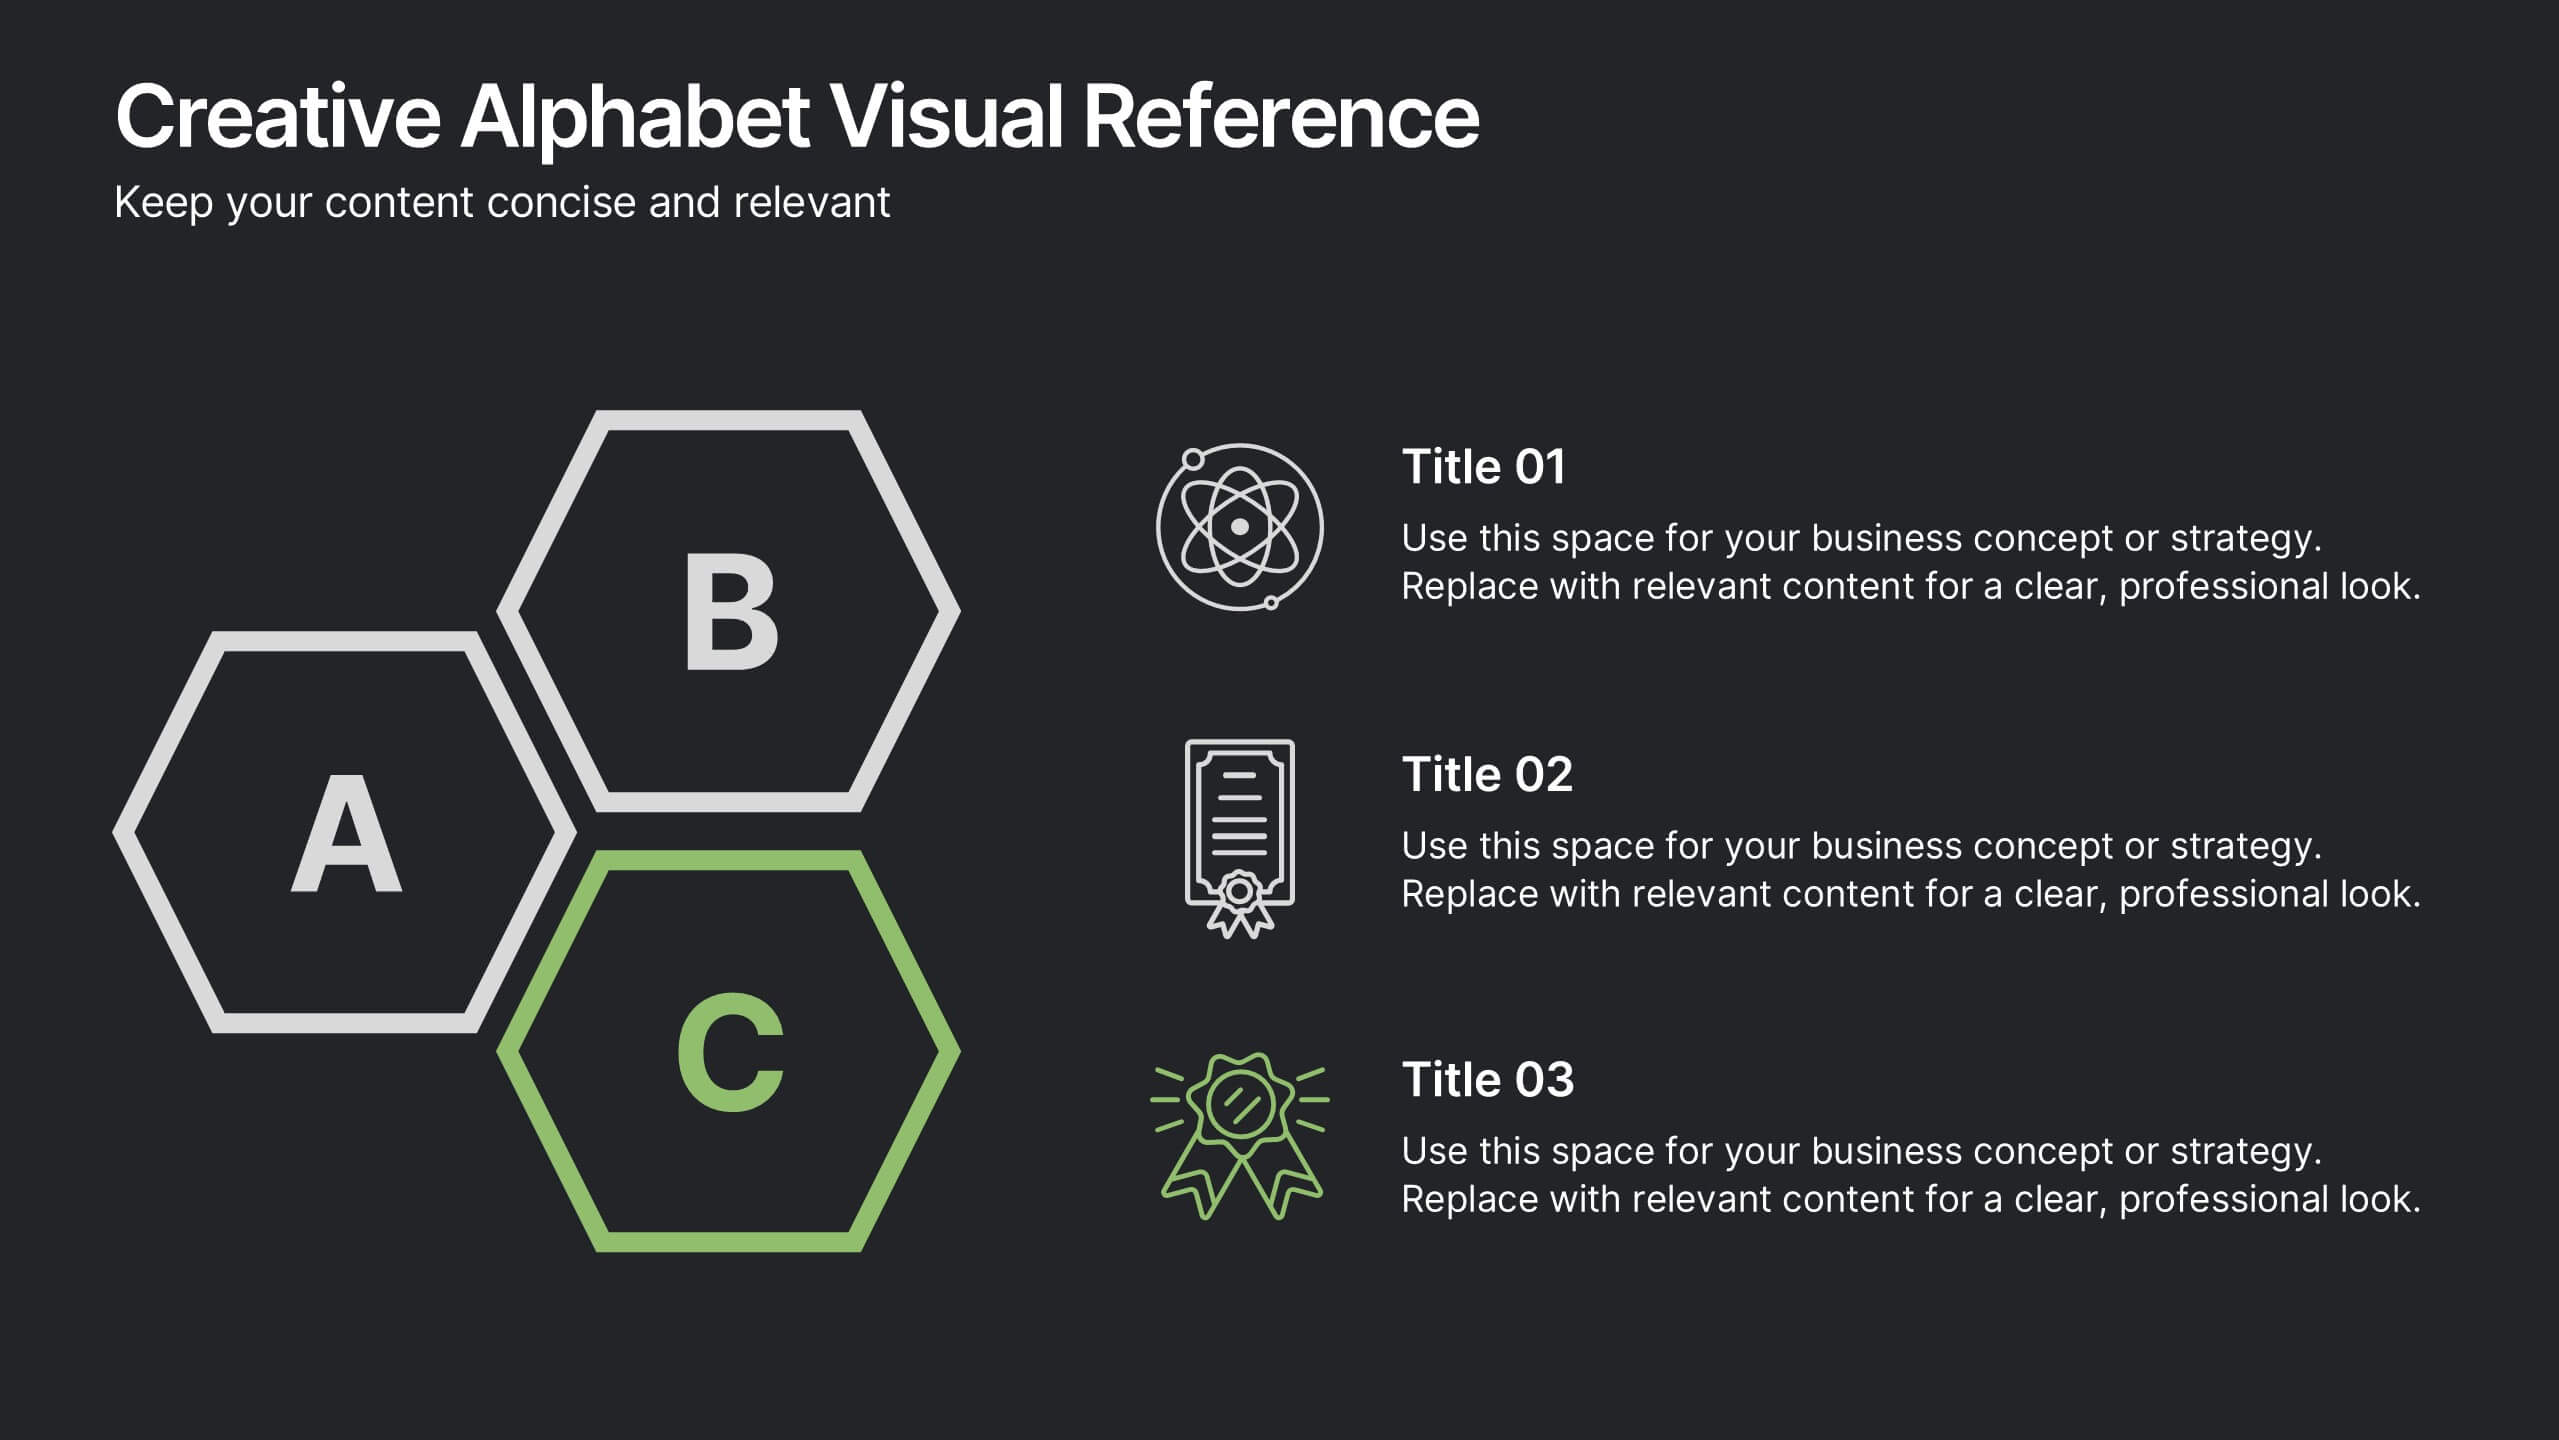
Creative Alphabet Visual Reference Presentation
This creative presentation uses a bold A–B–C visual structure to highlight key points in a clean, modern layout. Ideal for overviews, comparisons, or step-by-step frameworks. Fully customizable in Canva, it balances design and clarity—perfect for business strategies, education, or visual storytelling with strong alphabetical cues and icon integration.


4 diapositivas
Survey Response Data Visuals Presentation
Present your survey data clearly with this radial icon-based layout. Show response percentages alongside descriptive titles and modern visuals. Ideal for feedback analysis or research summaries. Fully editable in Canva, PowerPoint, or Google Slides, this template offers a clean, professional look to highlight key insights with ease.