


Características


¿Tienes alguna pregunta?
Recomendar


4 diapositivas
Product List Table for Quick Overview
Showcase product highlights at a glance with the Product List Table for Quick Overview Presentation. This sleek, column-based layout allows you to compare up to three product categories or service features side by side. Each section includes an icon, title, and space for three concise text rows—ideal for summarizing specifications, benefits, or pricing tiers. Fully editable in PowerPoint, Keynote, and Google Slides.


6 diapositivas
Modern Science Report Presentation
Bring your findings to life with a clean, dynamic layout designed to make scientific insights easy to follow. This presentation highlights key data, research points, and lab observations in a structured, visually engaging format that supports clarity and accuracy. Fully compatible with PowerPoint, Keynote, and Google Slides.


6 diapositivas
Future Trends in 5G Connectivity Presentation
Showcase the evolving landscape of mobile innovation with this modern 5G trends infographic. Featuring a central smartphone graphic and five vertically aligned icons, this slide is perfect for highlighting connectivity advancements, industry shifts, and upcoming opportunities. Color-coded markers enhance clarity for presentations on telecom, IoT, smart cities, and emerging tech. Fully editable in PowerPoint, Keynote, and Google Slides.


3 diapositivas
Visual Breakdown with Tree Diagram Format Presentation
Illustrate growth stages, concepts, or layered development with the Visual Breakdown with Tree Diagram Format Presentation. This creative design uses three tree icons—seedling, sapling, and mature tree—to represent progression or hierarchy. Ideal for timelines, product evolution, or strategic planning. Fully editable in PowerPoint, Keynote, and Google Slides.


5 diapositivas
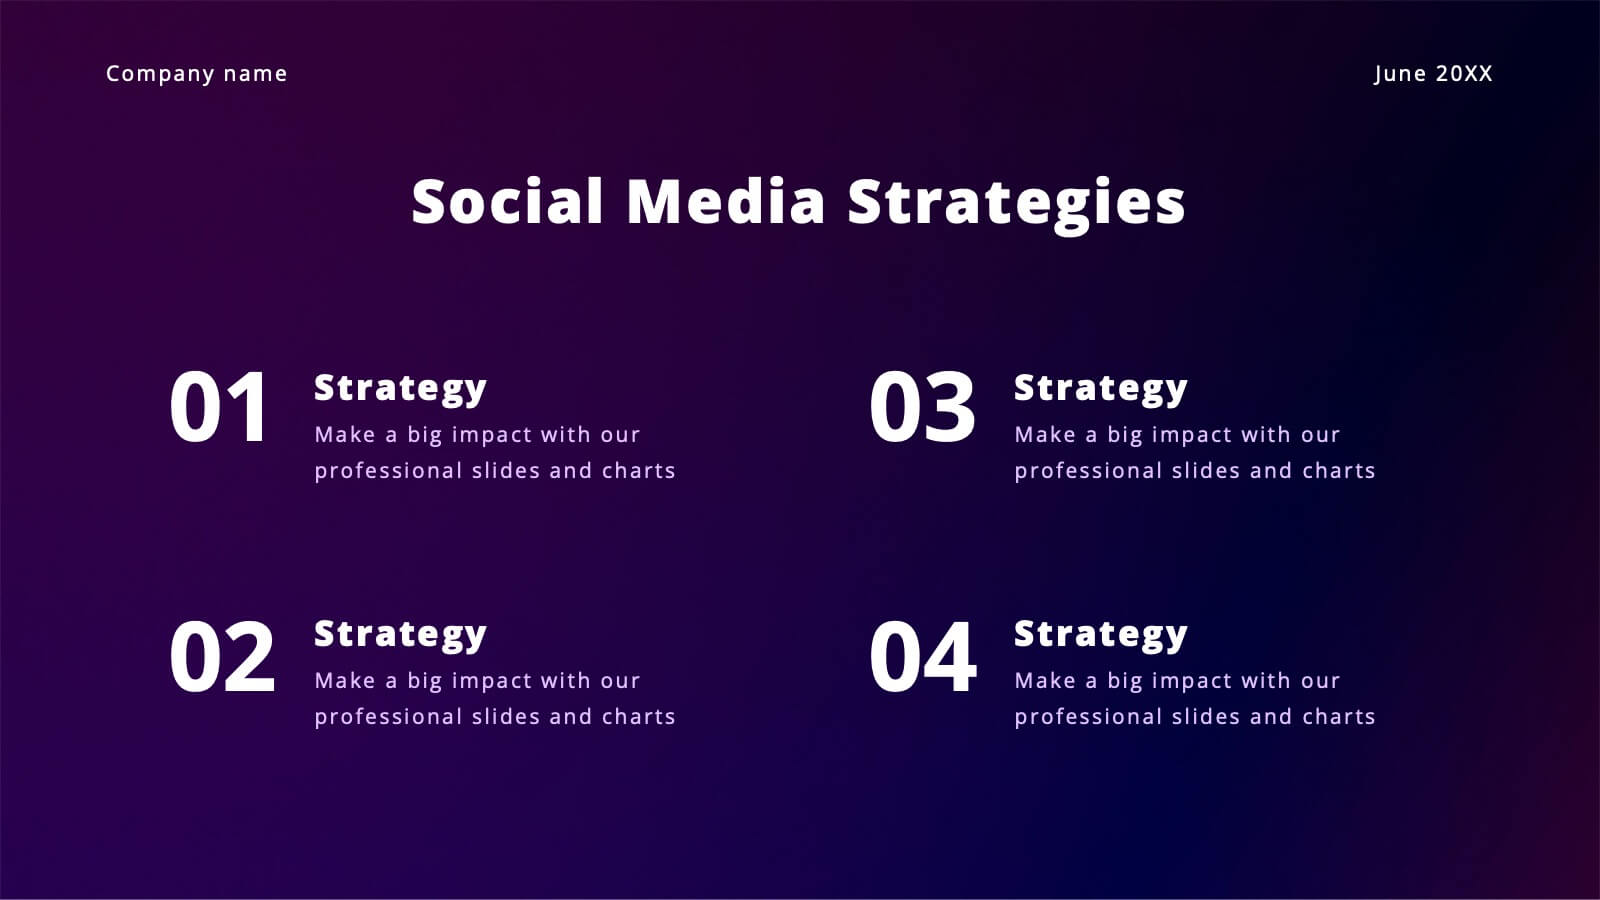
Social Media Strategies Presentation
Bring your online vision to life with a clean, modern layout that makes planning campaigns feel effortless. This presentation helps you map out goals, content pillars, audience insights, and platform tactics with clarity and impact. Fully editable and compatible with PowerPoint, Keynote, and Google Slides.


6 diapositivas
Alphabet Learning Presentation
Make learning fun and engaging with this alphabet learning presentation template! Designed with vibrant visuals and a structured layout, this template helps educators, parents, and trainers introduce letters effectively. Perfect for early childhood education, homeschooling, and interactive lessons. Fully customizable and compatible with PowerPoint, Keynote, and Google Slides.


7 diapositivas
Progress Infographic Presentation Template
Our Progress template is designed with a simple layout for presenting your infographic with flow charts and progress bars. This layout is made to be used as a presentation layer so that you can easily change text and images from one slide to the next. It comes with useful icons and illustrations to help you create a more informative presentation. This is a well-organized template for PowerPoint presentations. It allows you to present important information with clear and concise structure. With its useful design and features, you can create an engaging presentation in just minutes.


6 diapositivas
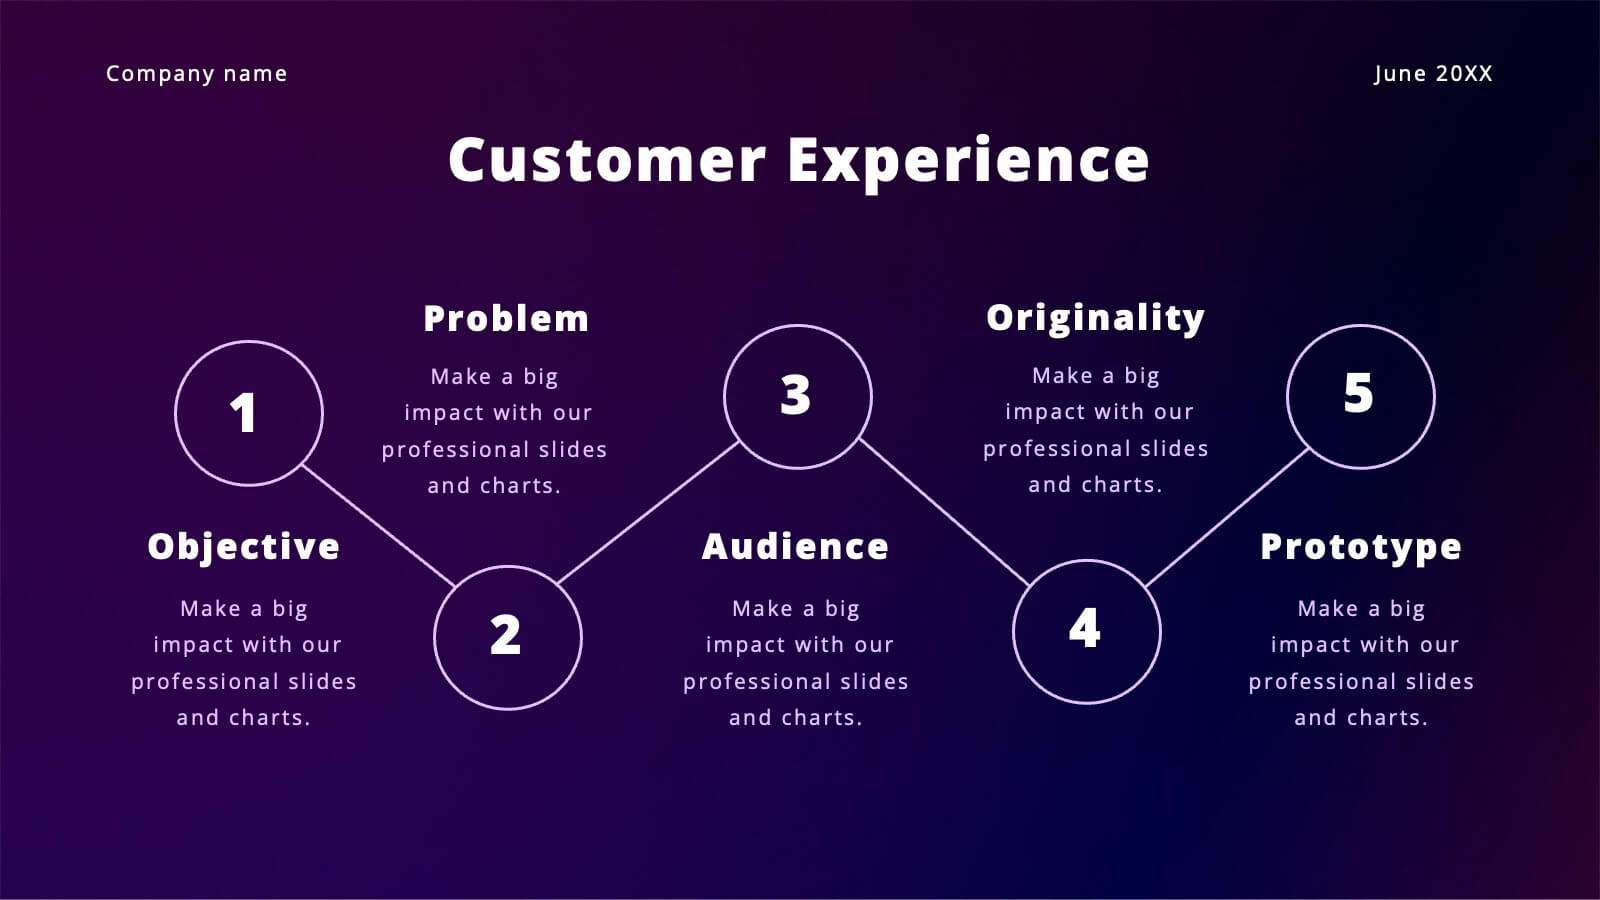
Geometric Shape Design Slides
Present your process or flow clearly using the Geometric Shape Design Slides Presentation. This layout uses connected circular icons to visually represent sequential steps, ideal for workflows, timelines, or strategic roadmaps. Each stage is color-coded and paired with editable titles and descriptions for clarity. Fully customizable in PowerPoint, Keynote, and Google Slides.


7 diapositivas
SEO Specialist Infographic
A Search Engine Optimization (SEO) Specialist is a professional responsible for improving the visibility and ranking of a website in search engine results pages. The goal of this infographic template is to drive organic, unpaid traffic to a website by optimizing its content, structure, and technical aspects to align with search engine algorithms. Embark on a visually stimulating exploration of the dynamic world of SEO. This captivating infographic is carefully crafted to offer a comprehensive understanding of Search Engine Optimization, empowering both beginners and experts to enhance their online presence and rankings.


4 diapositivas
Veterinary Practice Overview Presentation
Give your veterinary insights a professional touch with this clean, modern infographic layout. Designed to showcase workflows, patient care processes, and team structures, it helps present information clearly and visually. Fully customizable and compatible with PowerPoint, Keynote, and Google Slides for easy editing and seamless presentation design.


6 diapositivas
Strategic Solution Framework Presentation
Build your ideas step by step with this dynamic layout that turns strategies into a clear visual journey. Perfect for illustrating processes, growth plans, or solution pathways, it helps simplify complex frameworks into engaging visuals. Fully editable and compatible with PowerPoint, Keynote, and Google Slides for seamless customization.


20 diapositivas
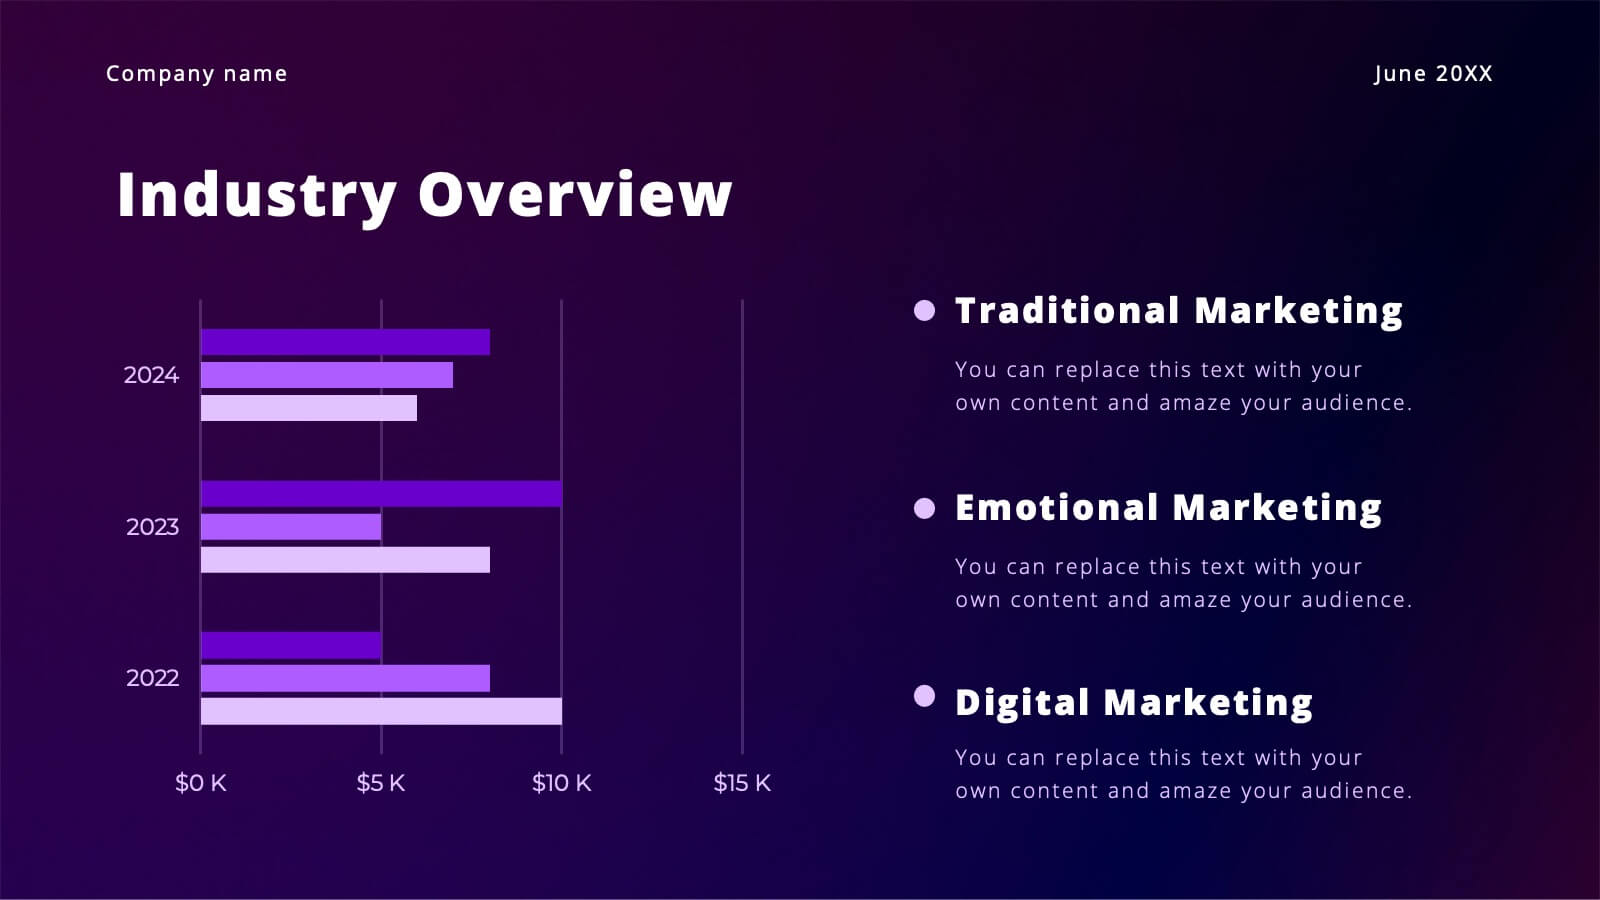
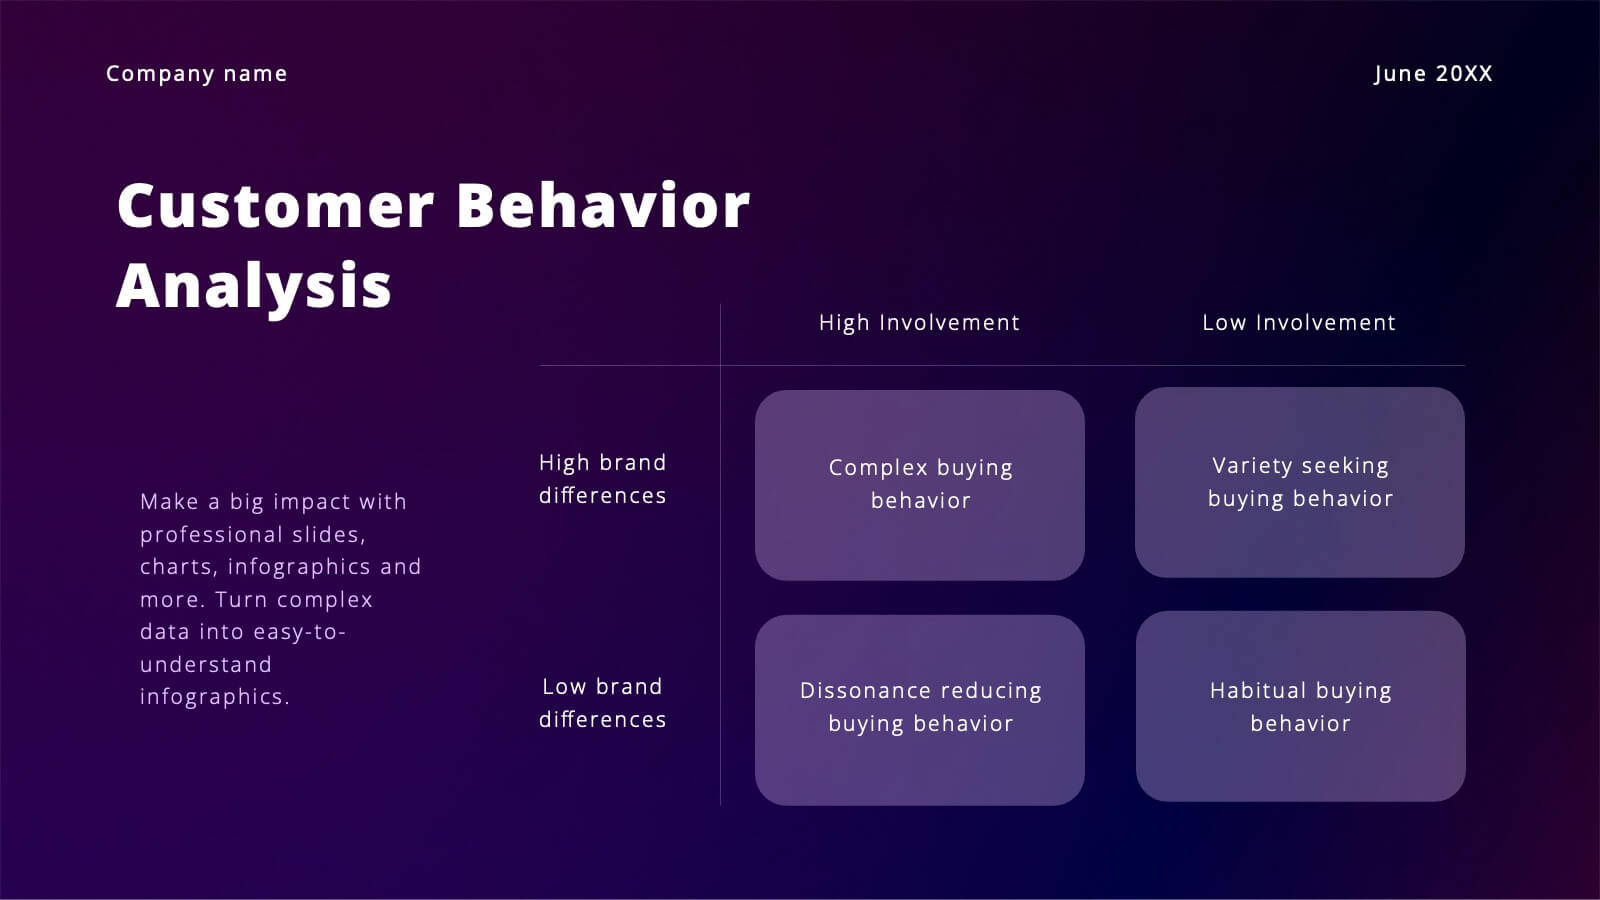
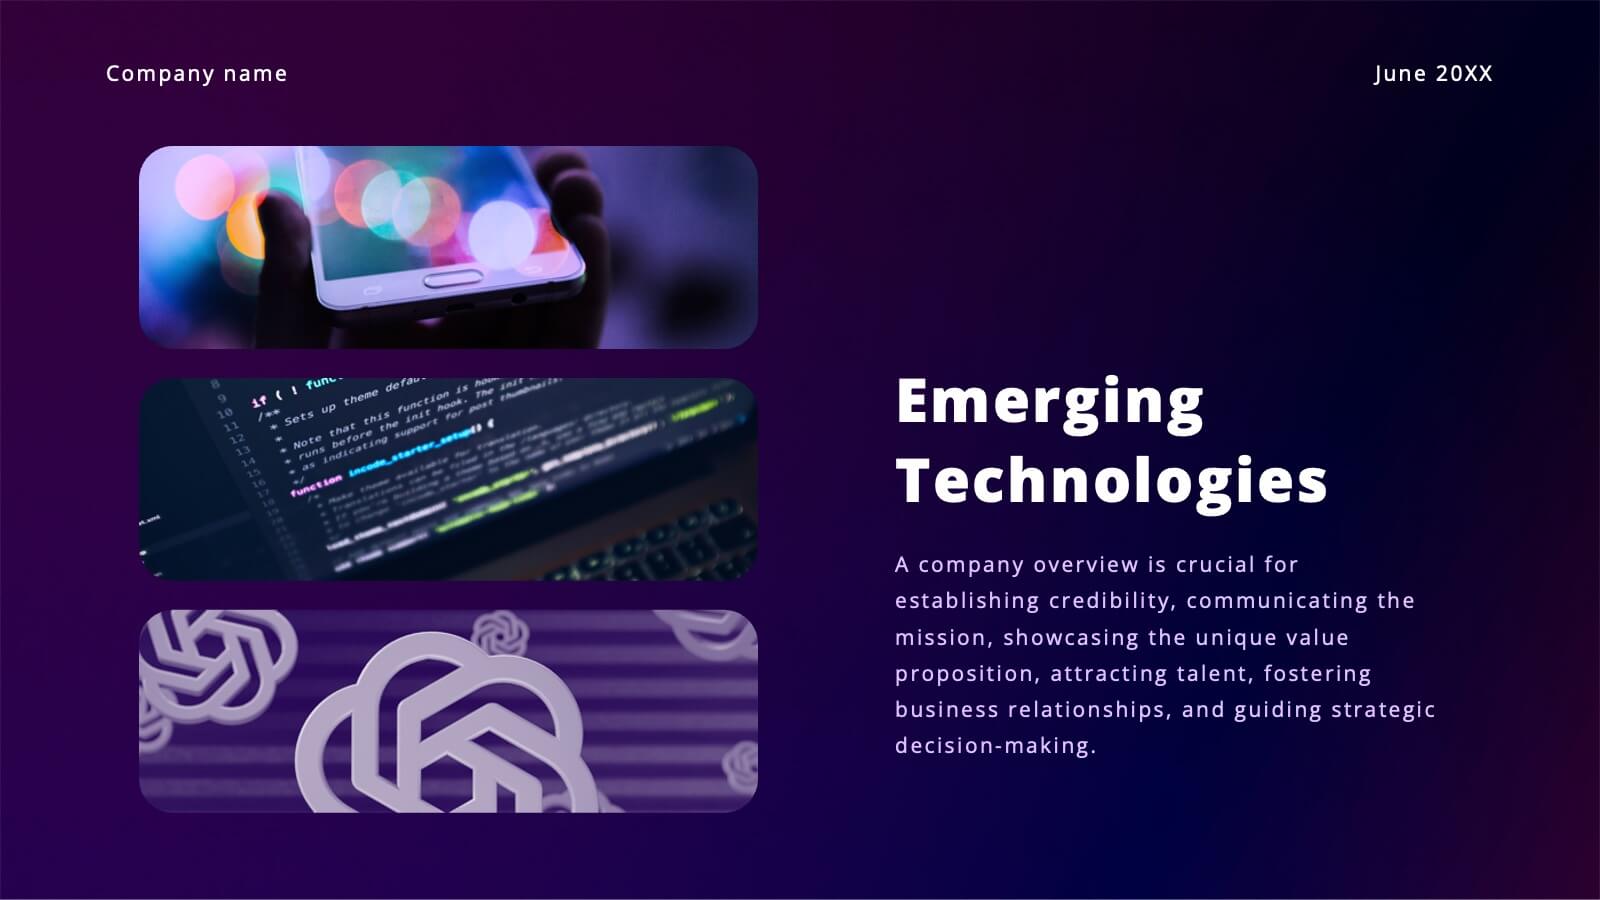
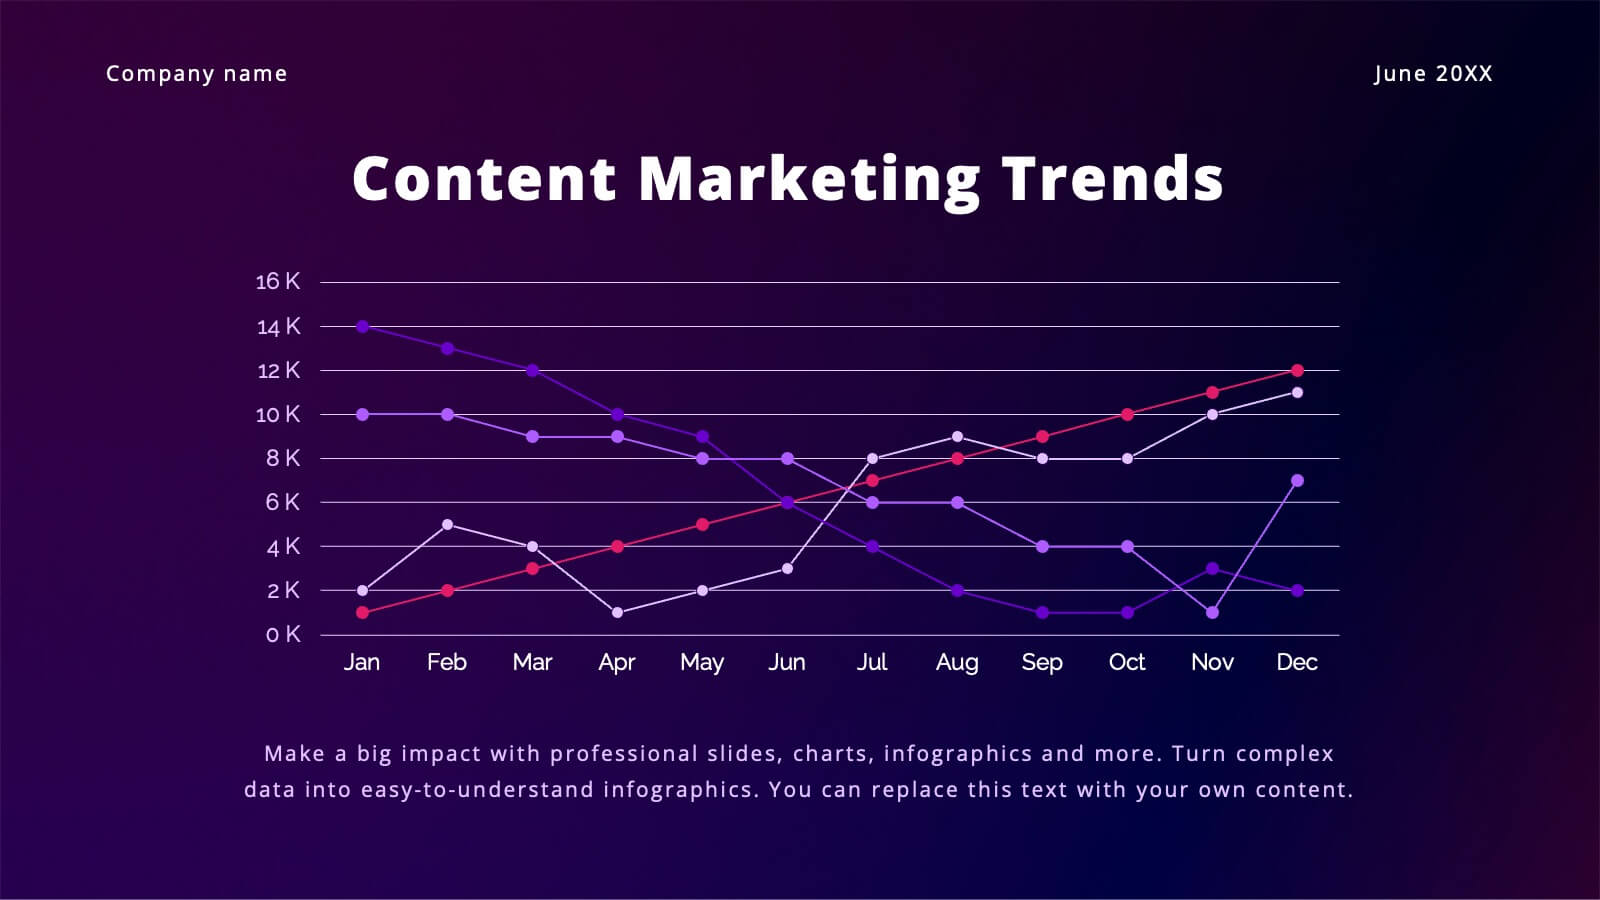
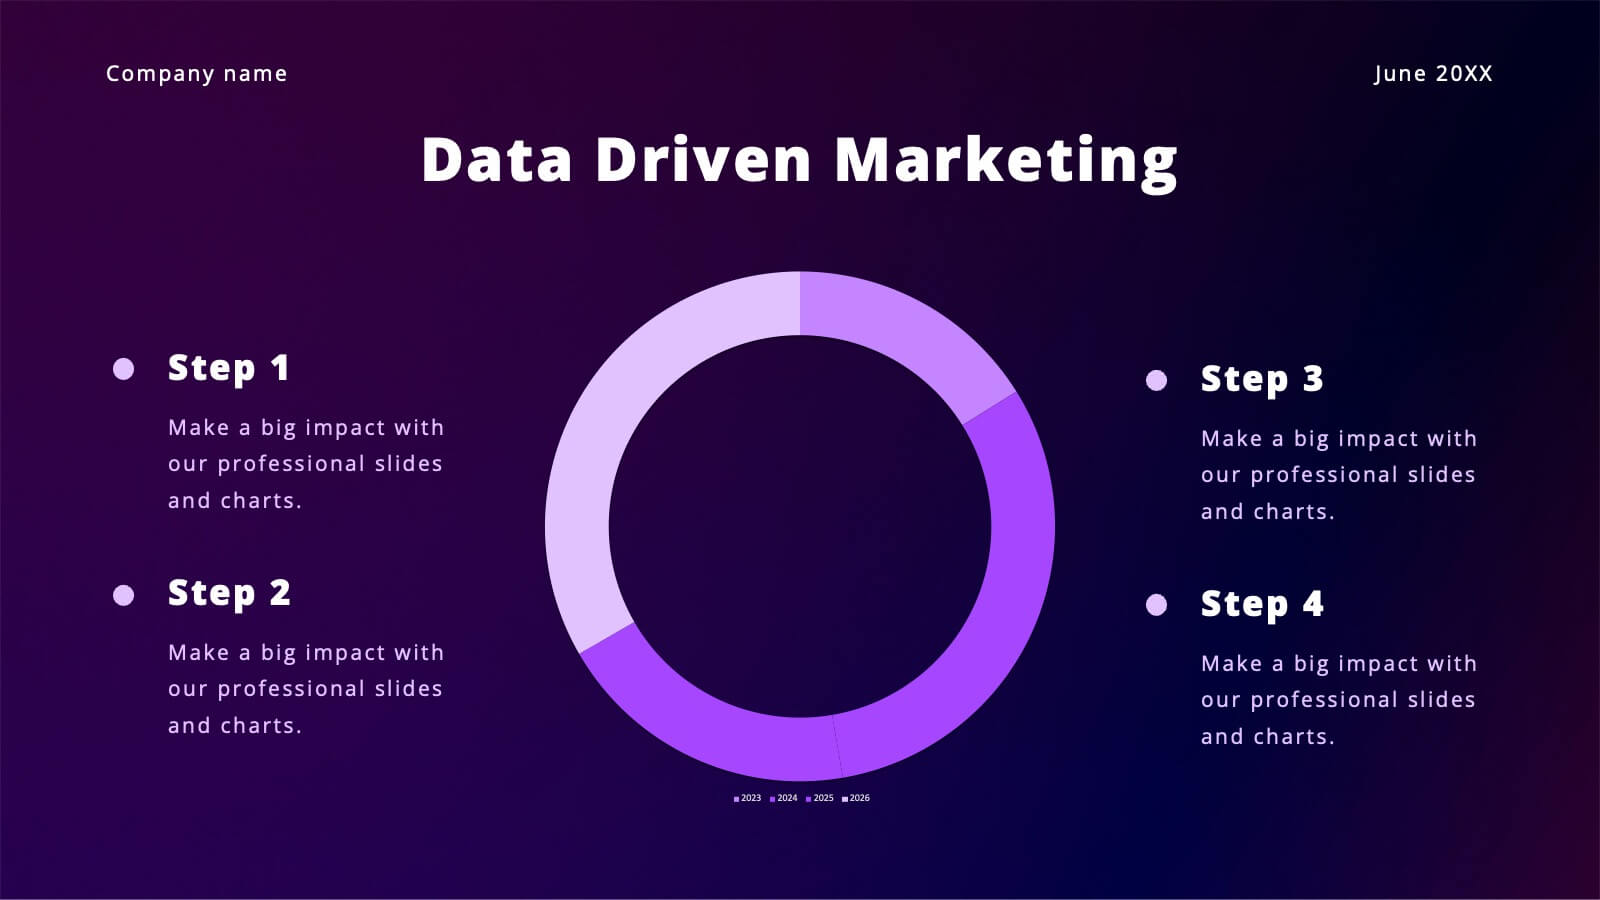
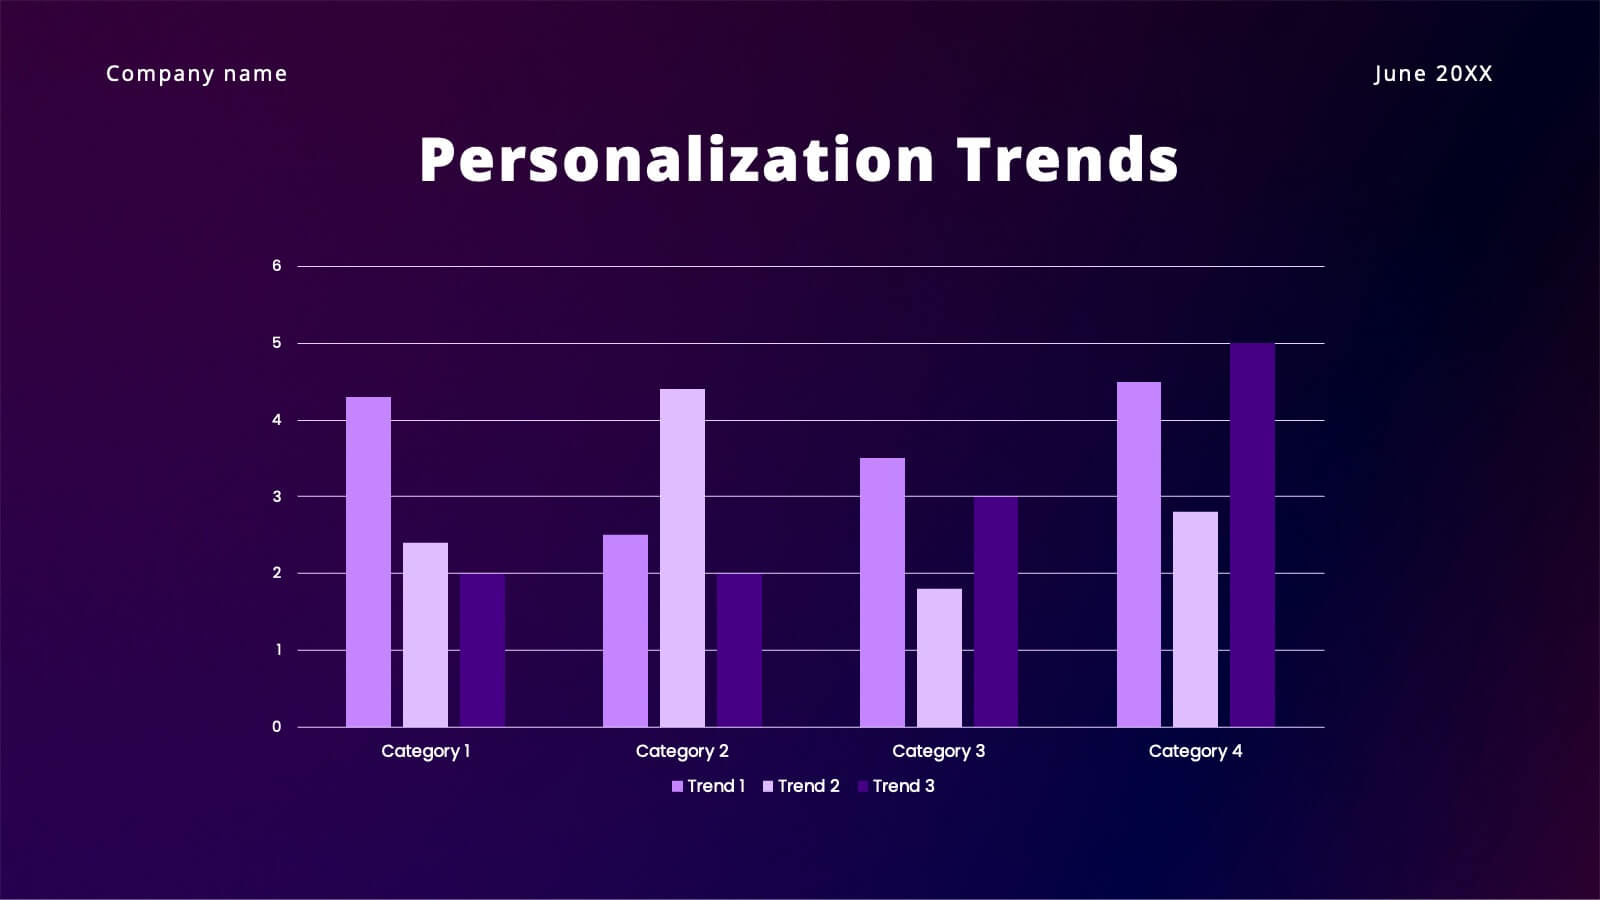
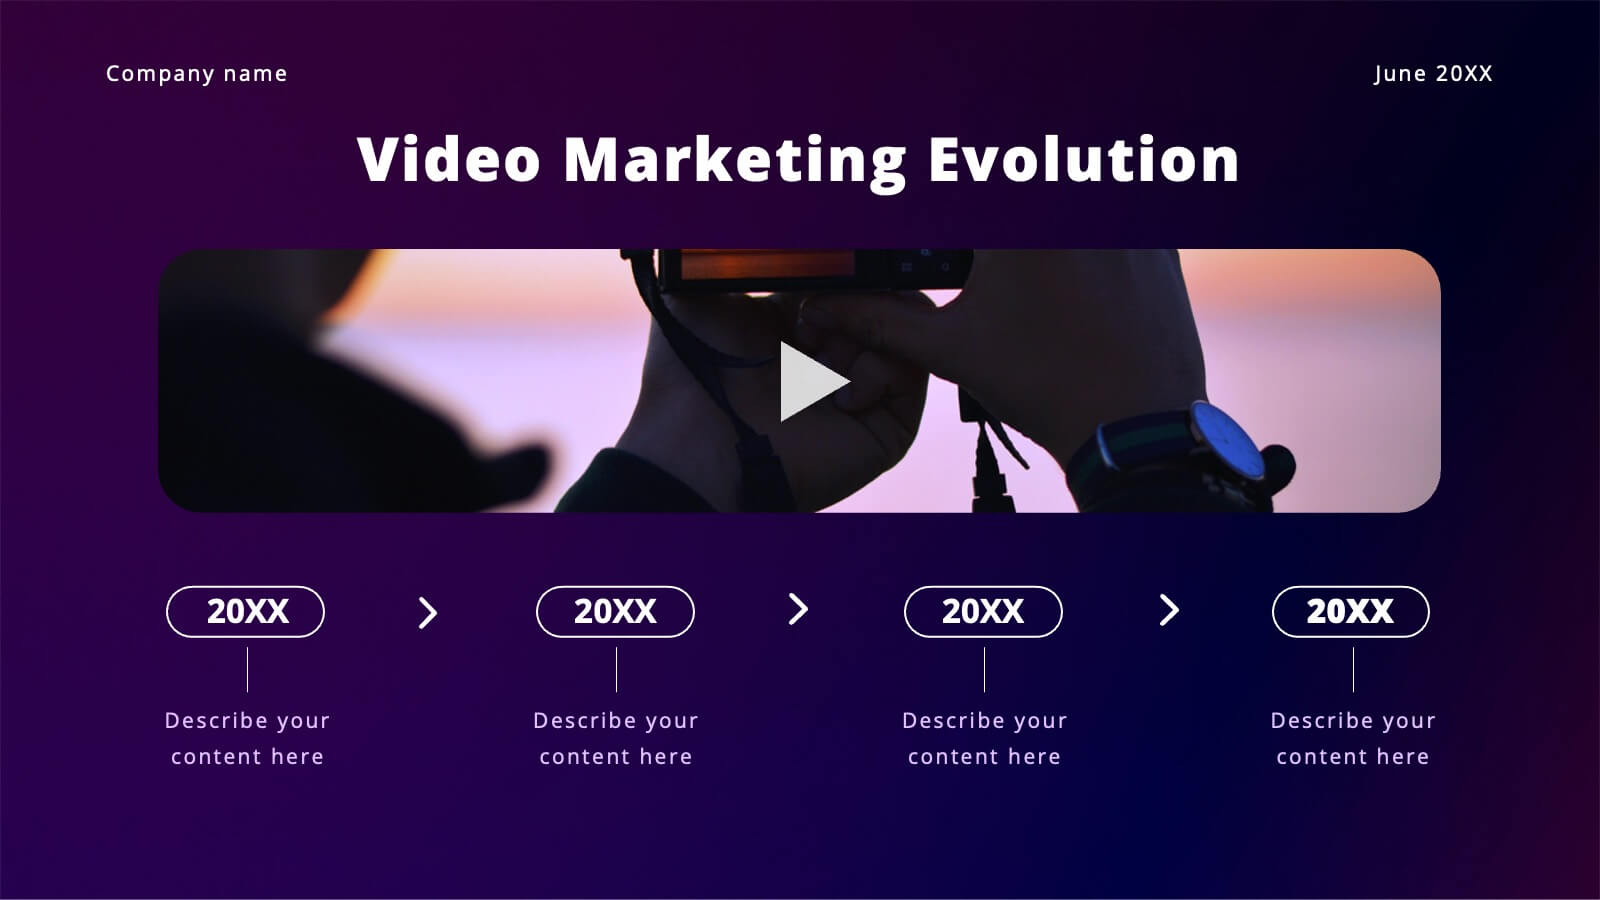
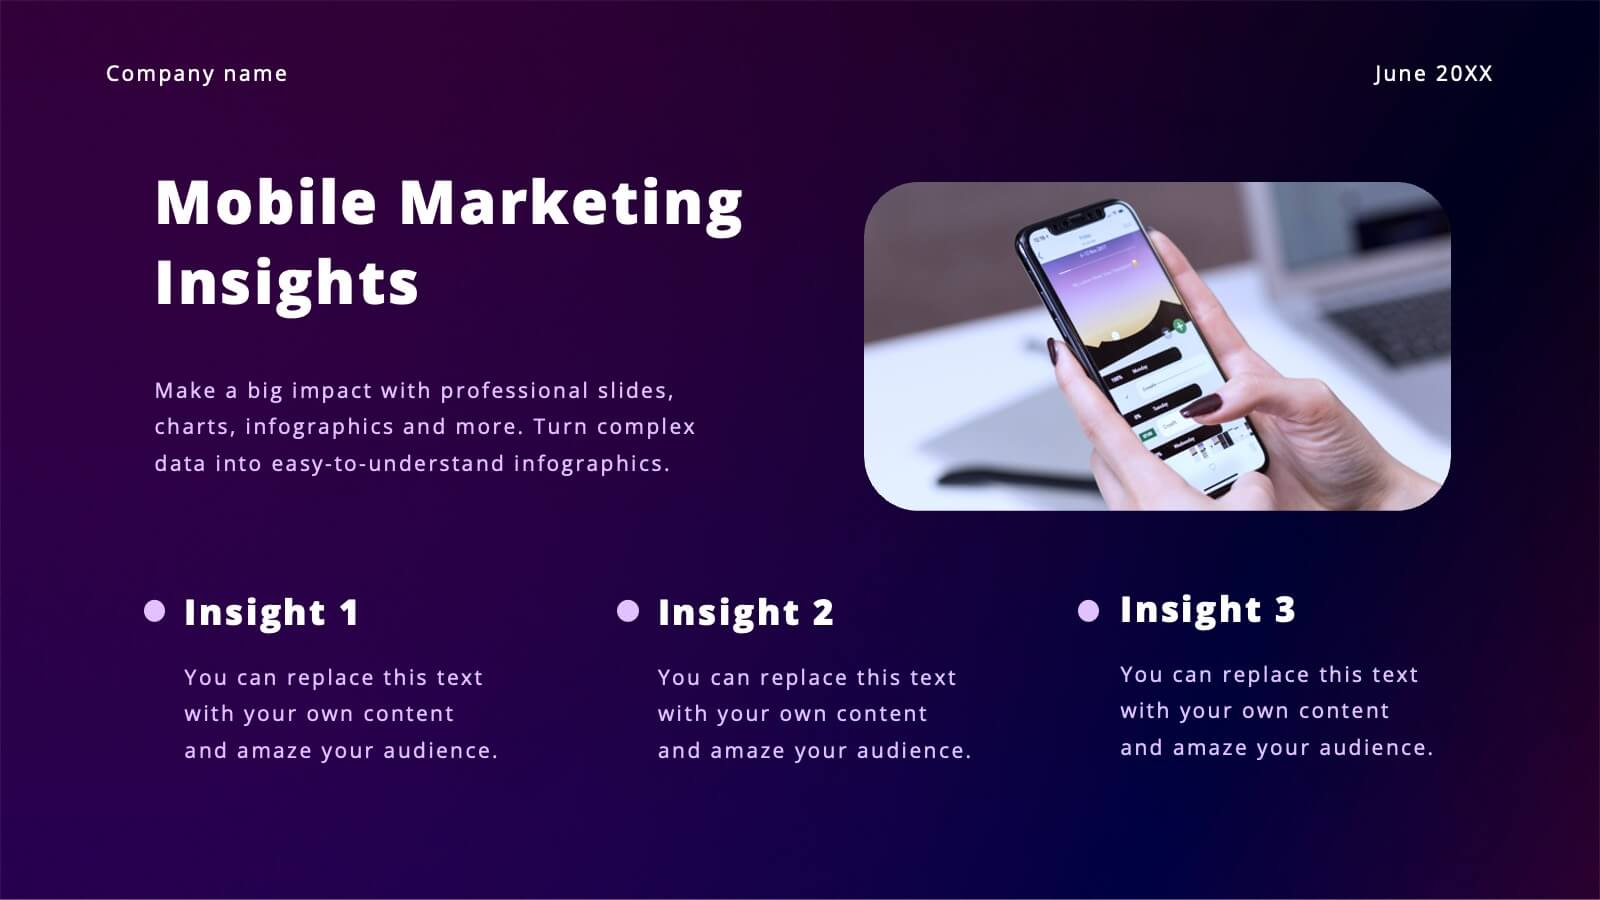
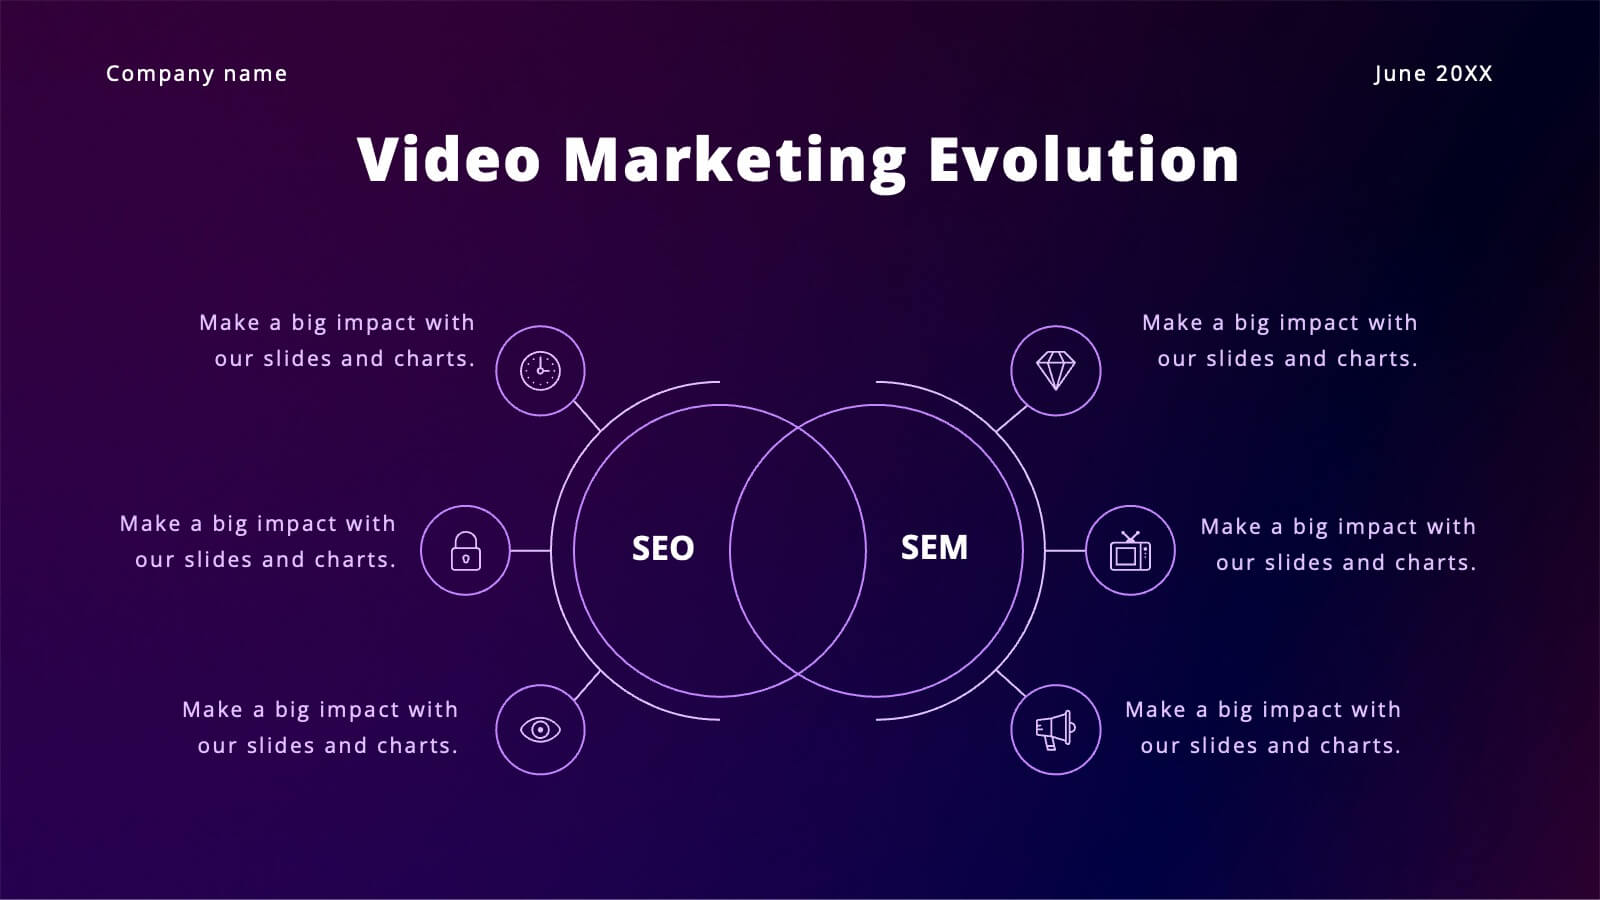
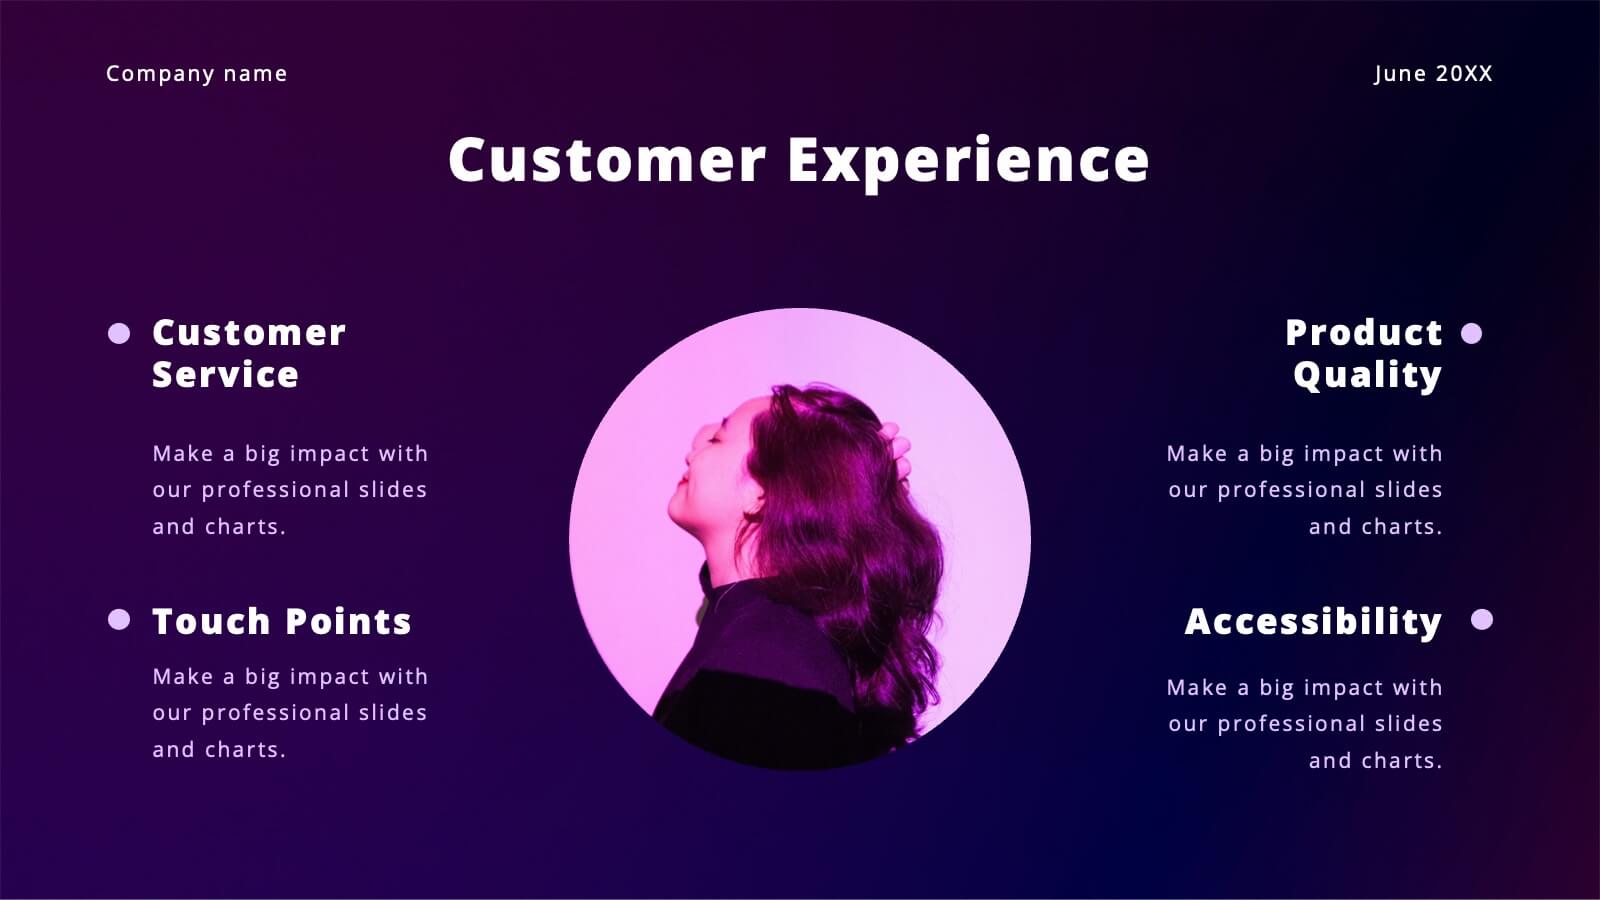
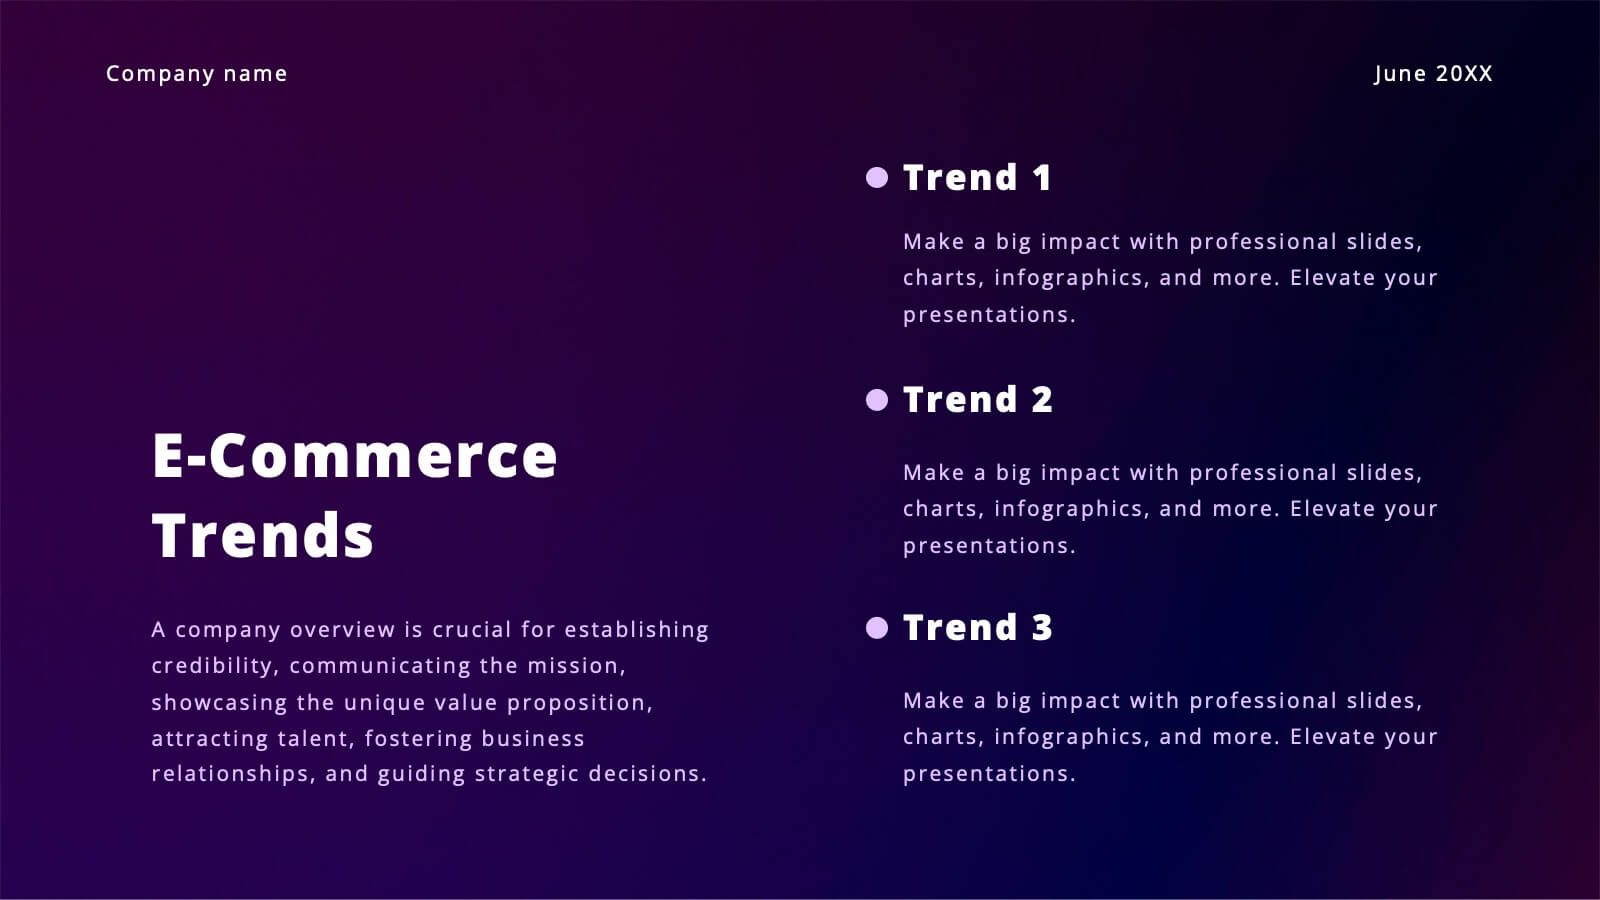
Vibrant Content Marketing Pitch Deck Presentation
Boost your marketing pitch with this vibrant deck! Covering industry overviews, customer behavior analysis, and emerging technologies, it’s designed to captivate your audience. Highlight social media strategies, data-driven marketing, and e-commerce trends effortlessly. Perfect for presenting a comprehensive marketing plan. Compatible with PowerPoint, Keynote, and Google Slides. Make your next pitch stand out!


6 diapositivas
Create Challenge Infographic
Challenges are obstacles, difficulties, or problems that individuals, organizations, or societies face while trying to achieve their goals or navigate through various situations. This infographic template involves visually presenting a specific challenge, its context, and possible solutions in an informative way. Summarize the key takeaways from the infographic, emphasizing the importance of addressing the challenge and implementing the suggested solutions. An effective challenge infographic can be used for educational purposes, presentations, or as a reference guide to help individuals and teams overcome challenges in a structured and informed manner.


6 diapositivas
Business Strategy Pyramid Presentation
Outline your strategic priorities with clarity using the Business Strategy Pyramid Presentation. This template features a five-step 3D pyramid that highlights key business goals, initiatives, or stages. Each layer includes icons and numbered sections for easy interpretation. Ideal for strategy meetings, executive briefings, and growth plans. Fully editable in PowerPoint, Keynote, and Google Slides.


4 diapositivas
Startup Investor Pitch Deck
Command investor attention with this dynamic Startup Pitch Deck slide. Featuring bold metrics, sleek data visualizations, and clean typography, it's designed to highlight growth and business potential. Fully editable in PowerPoint, Keynote, and Google Slides—ideal for tech, finance, and innovation-driven startups.


4 diapositivas
Colorful Workflow Process Chart Presentation
Bring your workflow to life with a vibrant, easy-to-follow layout that makes every stage feel connected and purposeful. This presentation helps you map processes, explain team roles, and simplify complex steps using a clean, visual flow. Fully compatible with PowerPoint, Keynote, and Google Slides.


7 diapositivas
Marketing Team Infographic
This collection showcases a series of slides dedicated to optimizing marketing team operations and strategies. Each template is designed to cater to various facets of marketing planning and execution, featuring layouts that help articulate team roles, campaign timelines, budget allocations, and performance metrics. The slides incorporate diverse visual elements, such as hierarchical diagrams, flow charts, and graphs, to ensure complex information is accessible and engaging. Customizable color palettes and design elements allow for seamless integration into existing corporate branding, making these templates not only functional but also aesthetically aligned with company standards. Ideal for marketing strategy presentations, team meetings, and stakeholder briefings, these slides facilitate a comprehensive overview of marketing efforts, pinpointing achievements and areas for improvement. The adaptability of these templates makes them an essential tool for marketing professionals aiming to communicate effectively and drive results.