


Características


¿Tienes alguna pregunta?
Recomendar


6 diapositivas
Effective Time Management Strategie Presentation
Make the most of your hours with this sharp and creative visual layout designed to organize your time-saving game plan. This template highlights key time management strategies, helping you structure priorities and boost daily efficiency. Fully customizable and easy to edit in PowerPoint, Keynote, and Google Slides for seamless presentation use.


7 diapositivas
Target Customer Profile Infographic
This Target Customer Profile infographic template is designed to help businesses clearly define and present their ideal customer segments. Available for PowerPoint, Google Slides, and Keynote, it includes various sections to detail demographics, customer needs, purchasing habits, and more. With a clean layout and a warm color scheme of oranges and blues, it facilitates the easy organization of customer information. Icons and comparison charts enable users to visualize customer motivations, goals, and product alignment efficiently. Ideal for marketers and business planners, this template simplifies the process of profiling target customers in a visually engaging and informative manner.


6 diapositivas
Community Network Infographic
A community network is a localized, often root-driven, communication infrastructure that connects individuals, organizations, and institutions within a specific geographical area or community. This Infographic template visually represents the connections, relationships, and interactions within a community, often focusing on its members, resources, and activities. This template is a powerful way to showcase the dynamics and vitality of a community. This highlights the central theme or purpose of the community at the center of the infographic. This is fully customizable and compatible with Powerpoint, Keynote, and Google Slides.


22 diapositivas
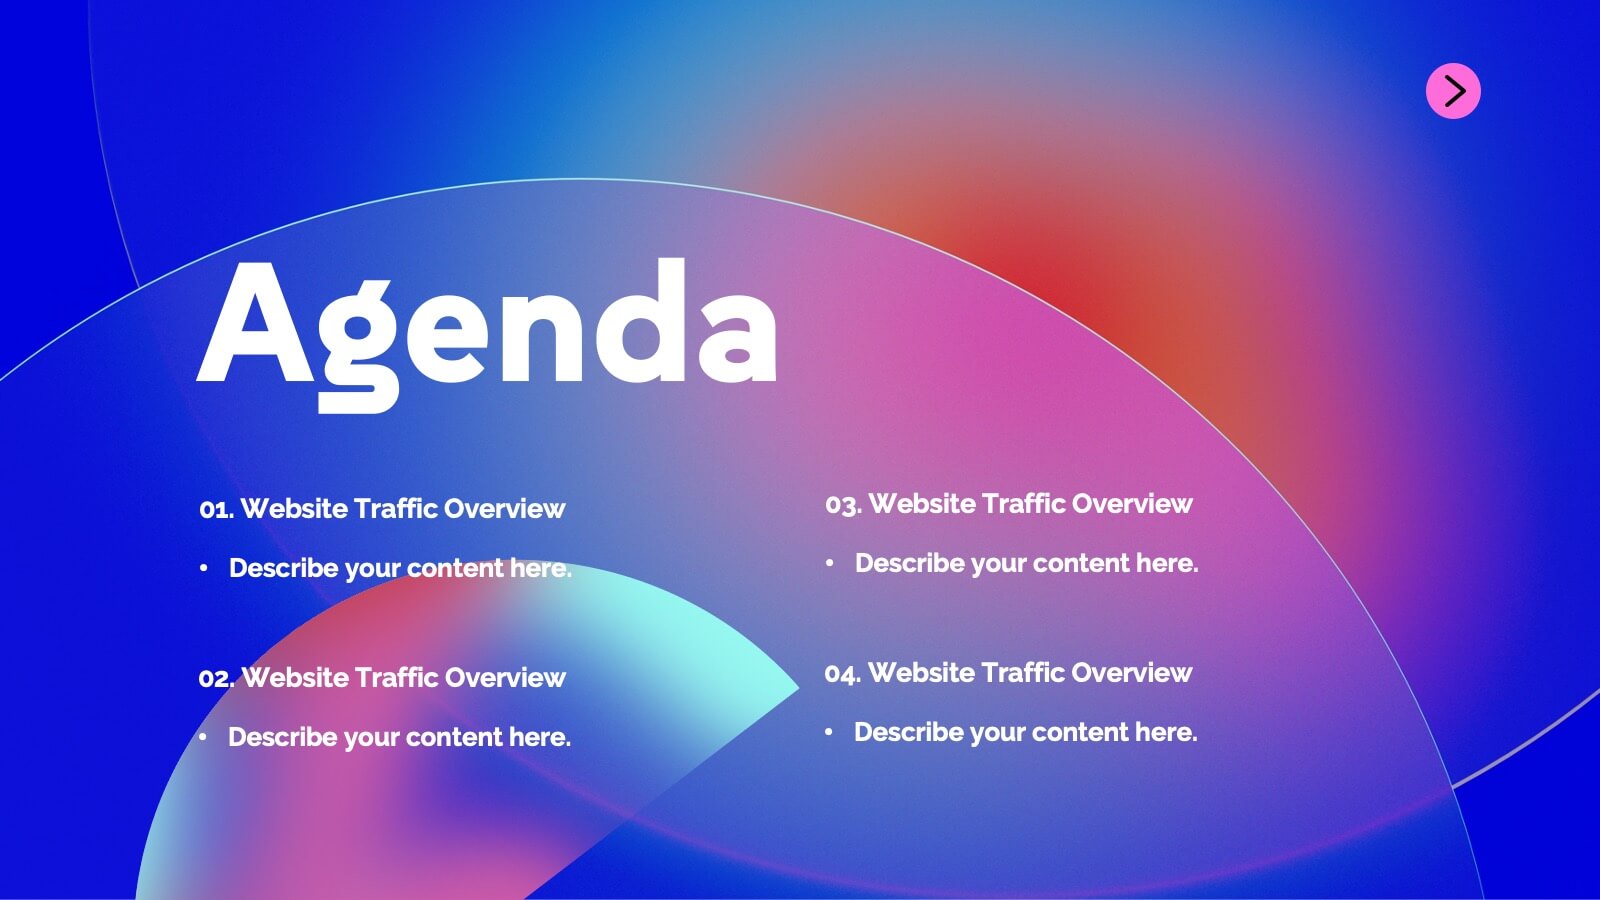
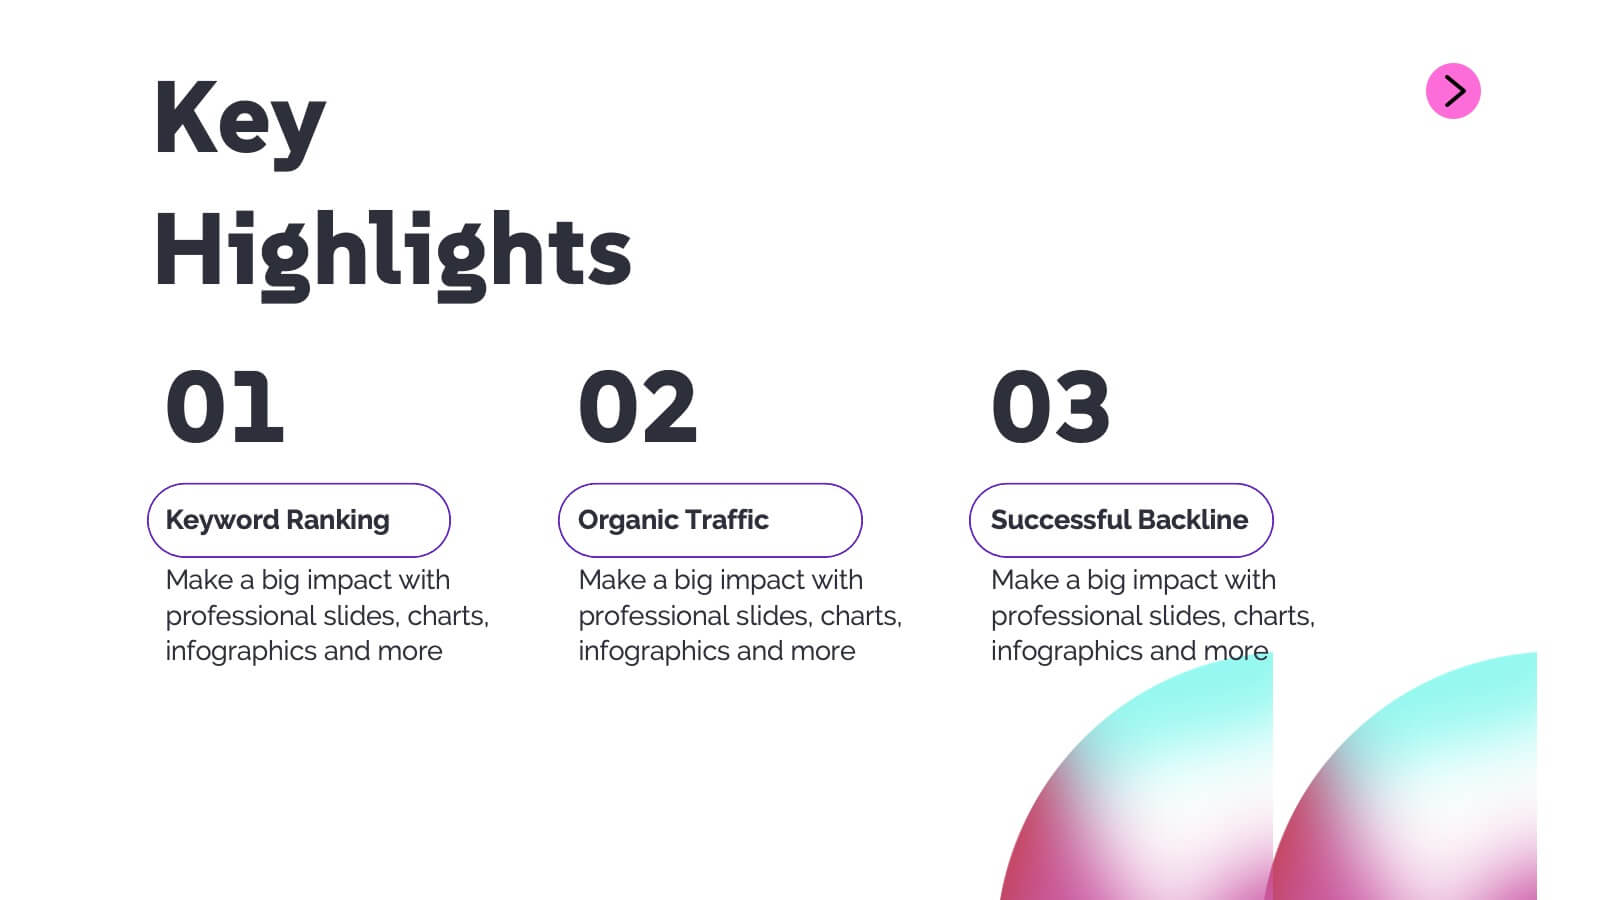
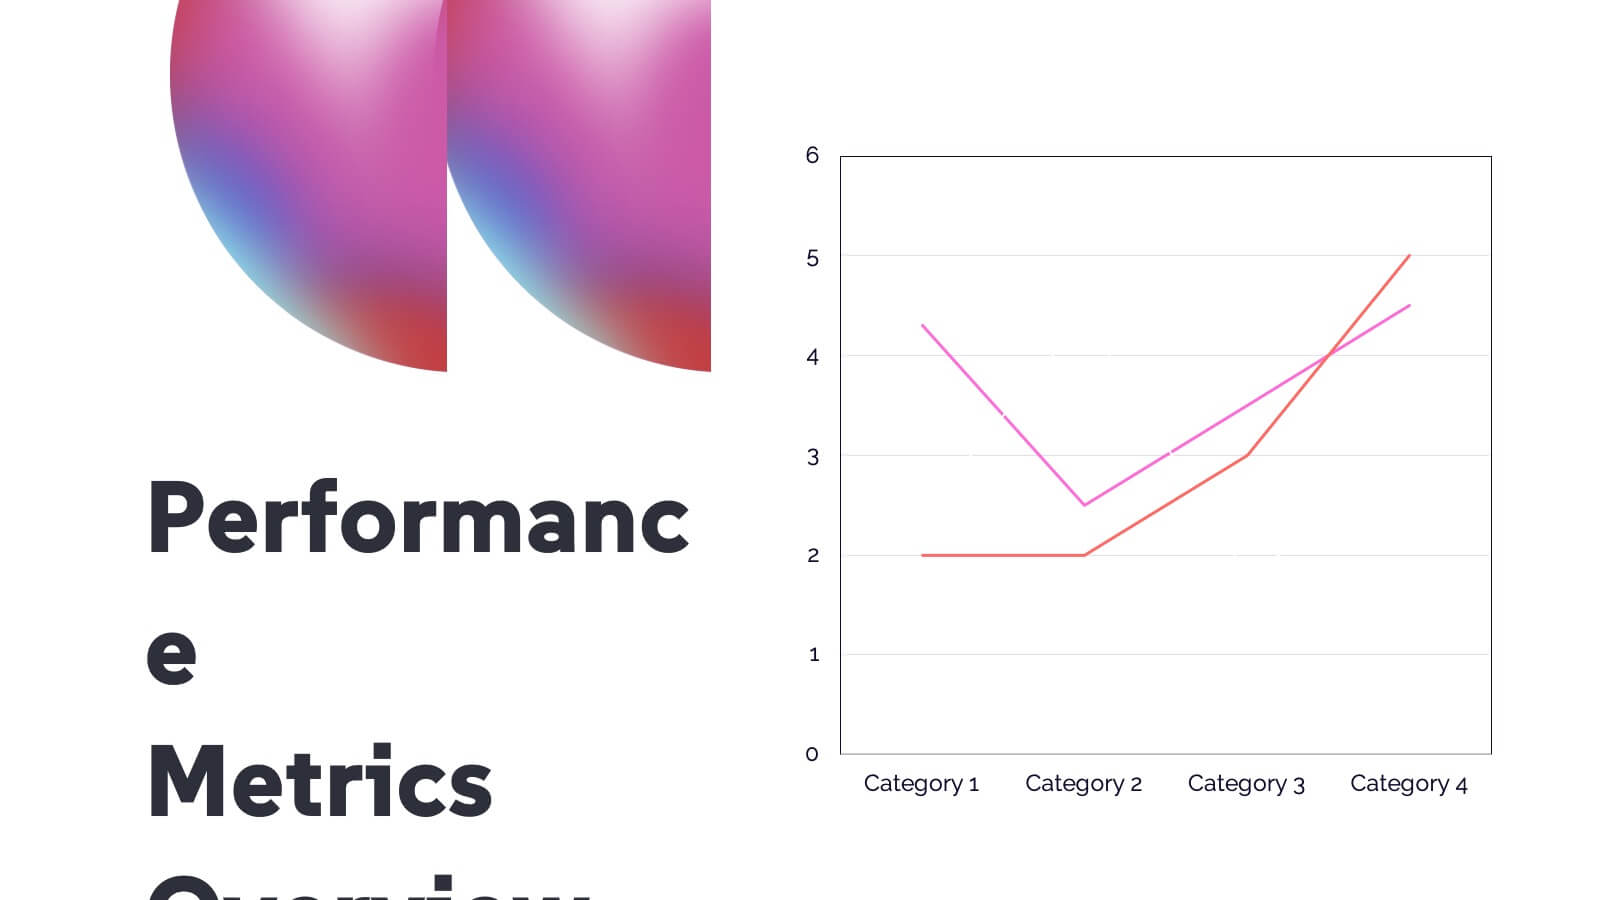
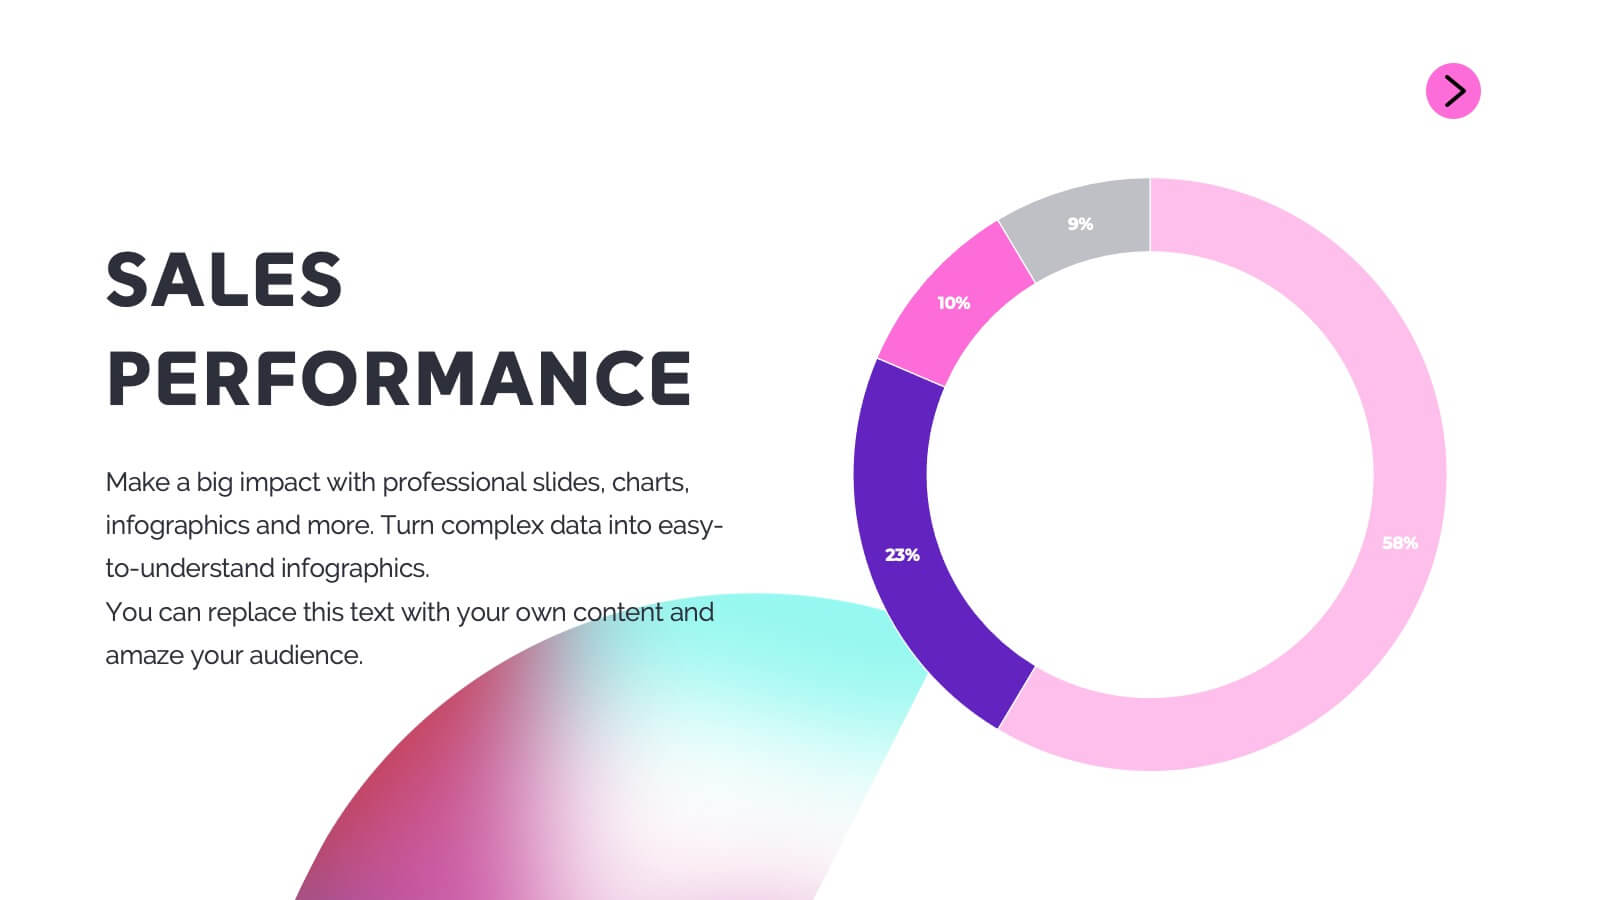
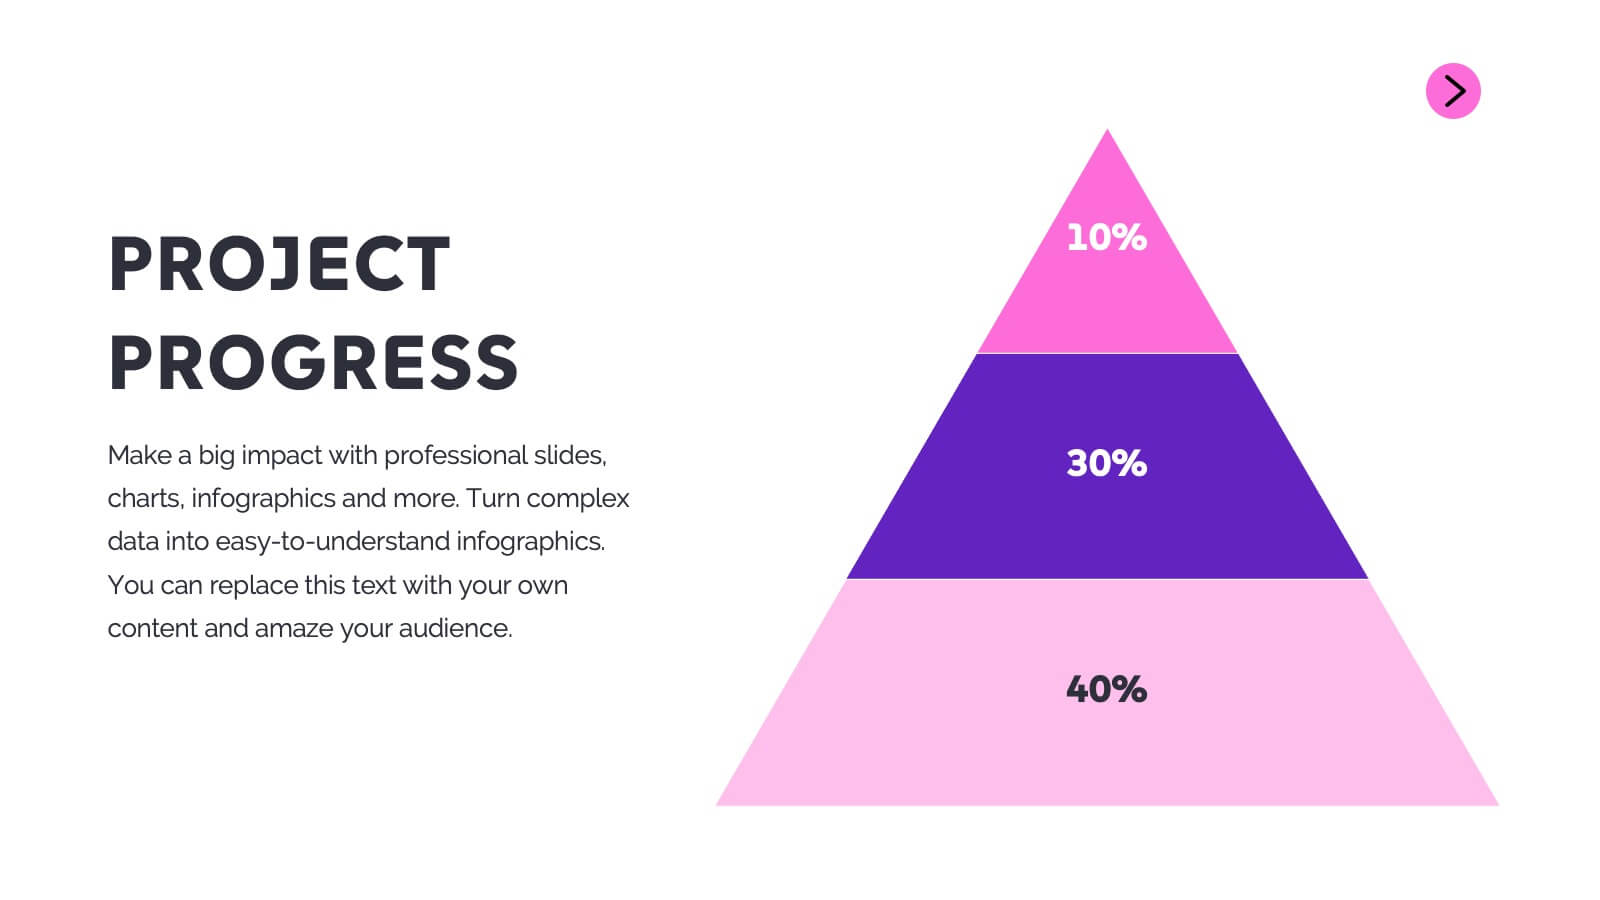
Sphinx Project Status Report Presentation
This modern project status report template is perfect for tracking progress and highlighting key achievements. It includes sections for performance metrics, financial summaries, challenges, and strategic initiatives. Keep stakeholders informed with clear, concise updates. Compatible with PowerPoint, Keynote, and Google Slides for easy customization and presentation.


5 diapositivas
Suicide Awareness Stats Infographics
Navigate the sensitive topic of suicide with the suicide awareness stats infographics template. Crafted with care in shades of blue, white, and purple, this vertical, informative infographic serves as a profound educational tool. It is essential for mental health advocates, educational institutions, and community outreach programs, offering a respectful yet impactful way of presenting statistics and information. The template includes thoughtfully designed graphics, relevant icons, and placeholders for real-world images, ensuring the data speaks volumes in raising awareness, promoting prevention, and supporting life-affirming actions within various communities.


4 diapositivas
Global Business Distribution Layout Presentation
Visualize your company’s international footprint with this Global Business Distribution Layout. Perfect for showcasing market reach, branch networks, or regional performance. Features a clean world map design with customizable highlight zones. Fully editable in PowerPoint, Keynote, and Google Slides—ideal for corporate overviews, investor decks, and business expansion presentations.


6 diapositivas
Global Transportation & Logistics Infographics
The "Global Transportation and Logistics" infographic template, suitable for PowerPoint, Keynote, and Google Slides, is an invaluable tool for professionals in the logistics, shipping, and supply chain industries. This comprehensive template is designed to effectively communicate the complexities and scope of global transportation and logistics. This template features key elements such as global shipping routes, logistics management, and supply chain operations. Its detailed and informative design is perfect for presentations that need to illustrate the intricacies of global logistics, from transportation networks to logistical challenges. This is especially useful for strategic planning, educational purposes, or corporate presentations in the logistics sector. The color scheme of the template reflects global connectivity and efficiency, incorporating shades of blue, green, and earth tones. This professional and visually appealing design not only enhances the clarity of the information but also adds a global perspective to your presentation. Whether used for training, client meetings, or industry conferences, this template ensures your insights into global transportation and logistics are presented with precision and professionalism.


6 diapositivas
Business Performance Pie Chart
Visualize your key metrics clearly with this pie chart-style performance layout. Designed for business reviews and strategic updates, it breaks down five data categories into easy-to-read segments. Ideal for quarterly performance slides, team dashboards, and KPI tracking. Fully editable in PowerPoint, Keynote, and Google Slides.


5 diapositivas
Human Resource Functions Infographics
Illuminate the complexities of people management with our human resource functions infographics template. Cast in the professional yet warm palette of black, orange, pink, and red, this template is an essential tool for HR professionals, corporate trainers, and business leaders. It elegantly dissects various HR realms with its sleek graphics, intuitive icons, and dedicated image placeholders, making it perfect for showcasing recruitment processes, employee engagement strategies, or organizational culture principles. Its creative, vertical style is designed to hold the attention and fuel the imagination, turning any HR presentation into a compelling narrative.


10 diapositivas
Depth-Based Visual Charts in 3D Presentation
Elevate your data storytelling with the Depth-Based Visual Charts in 3D Presentation. This slide set transforms layered information into eye-catching 3D stack visuals—perfect for showcasing rankings, workflows, or strategic hierarchies. Fully editable in PowerPoint, Keynote, and Google Slides for seamless customization.


6 diapositivas
Time Management Skills Infographic
Time Management refers to the process of planning and organizing your time effectively to accomplish tasks, achieve goals, and maximize productivity. This infographic template aims to help individuals improve their time management abilities. It provides practical tips, techniques, and strategies to effectively manage time and increase productivity. This template provides practical guidance on setting goals, prioritizing tasks, managing distractions, and optimizing productivity. This infographic will help your audience develop effective time management skills and make the most of their valuable time.


5 diapositivas
Planning and Delivery in Five Phases Presentation
Guide your audience through each step of your execution plan using the Planning and Delivery in Five Phases Presentation. This clean, drop-pin style layout highlights five essential milestones for structured delivery and progress tracking. Each phase is color-coded for easy reference. Fully editable in PowerPoint, Keynote, Google Slides, and Canva.


6 diapositivas
Root Cause Investigation Framework Presentation
Uncover the "why" behind your challenges with the Root Cause Investigation Framework Presentation. Designed around the classic fishbone (Ishikawa) diagram, this slide helps teams visually identify and organize contributing factors across multiple categories. With editable sections and bold color coding, it’s ideal for quality management, Six Sigma, and process improvement. Compatible with PowerPoint, Keynote, and Google Slides.


7 diapositivas
E-Learning Infographic Presentation Template
An E-learning Infographic is an informative design that shows all the different ways that e-learning can be used in your classroom, as well as the benefits associated with each one. This infographic illustrates the popularity of e-learning and gives tips for creating compelling learning materials. This template is equipped with all the resources needed to create your e-learning infographic. It comes fully customizable and ready-to-use. This Infographic template provides a bare-bone structure and design, leaving space for you to add your own content and create the best presentation!


6 diapositivas
KPI Metric Infographic
KPI stands for Key Performance Indicator, and it is a measurable value that helps organizations track their progress and performance towards achieving specific business goals and objectives. This infographic template is designed to display key performance indicators and metrics in a concise and easy-to-understand manner. KPIs are quantifiable measurements used to evaluate the success of an organization, project, or specific business activities. The infographic provides a visual representation of these KPIs, making it easier for stakeholders and decision-makers to interpret the data and track progress.


6 diapositivas
Customer Perceived Value Analysis
Visualize what matters most to your audience using this customer-centric diagram. Perfect for marketers, brand strategists, and CX professionals looking to present value drivers, motivations, or user insights. Easily editable in PowerPoint, Keynote, and Google Slides—customize colors, icons, and text to align with your brand.


6 diapositivas
Concentric Circles Strategy Infographics
Visualize your strategic approach with our Concentric Circles Strategy infographic template. This template is fully compatible with popular presentation software like PowerPoint, Keynote, and Google Slides, allowing you to easily customize it to illustrate and communicate your concentric circles strategy. The Concentric Circles Strategy infographic template offers a visually engaging platform to depict your strategy's core, intermediate, and peripheral elements. Whether you're a business leader, strategist, or planner, this template provides a user-friendly canvas to create informative presentations and effectively communicate your strategic vision. Enhance your strategic planning with this SEO-optimized Concentric Circles Strategy infographic template, thoughtfully designed for clarity and ease of use. Customize it to highlight the key components of your concentric circles strategy, ensuring that your team and stakeholders grasp the strategic direction clearly. Start crafting your personalized infographic today to drive alignment and execution of your strategic goals.