


Características


¿Tienes alguna pregunta?
Recomendar


22 diapositivas
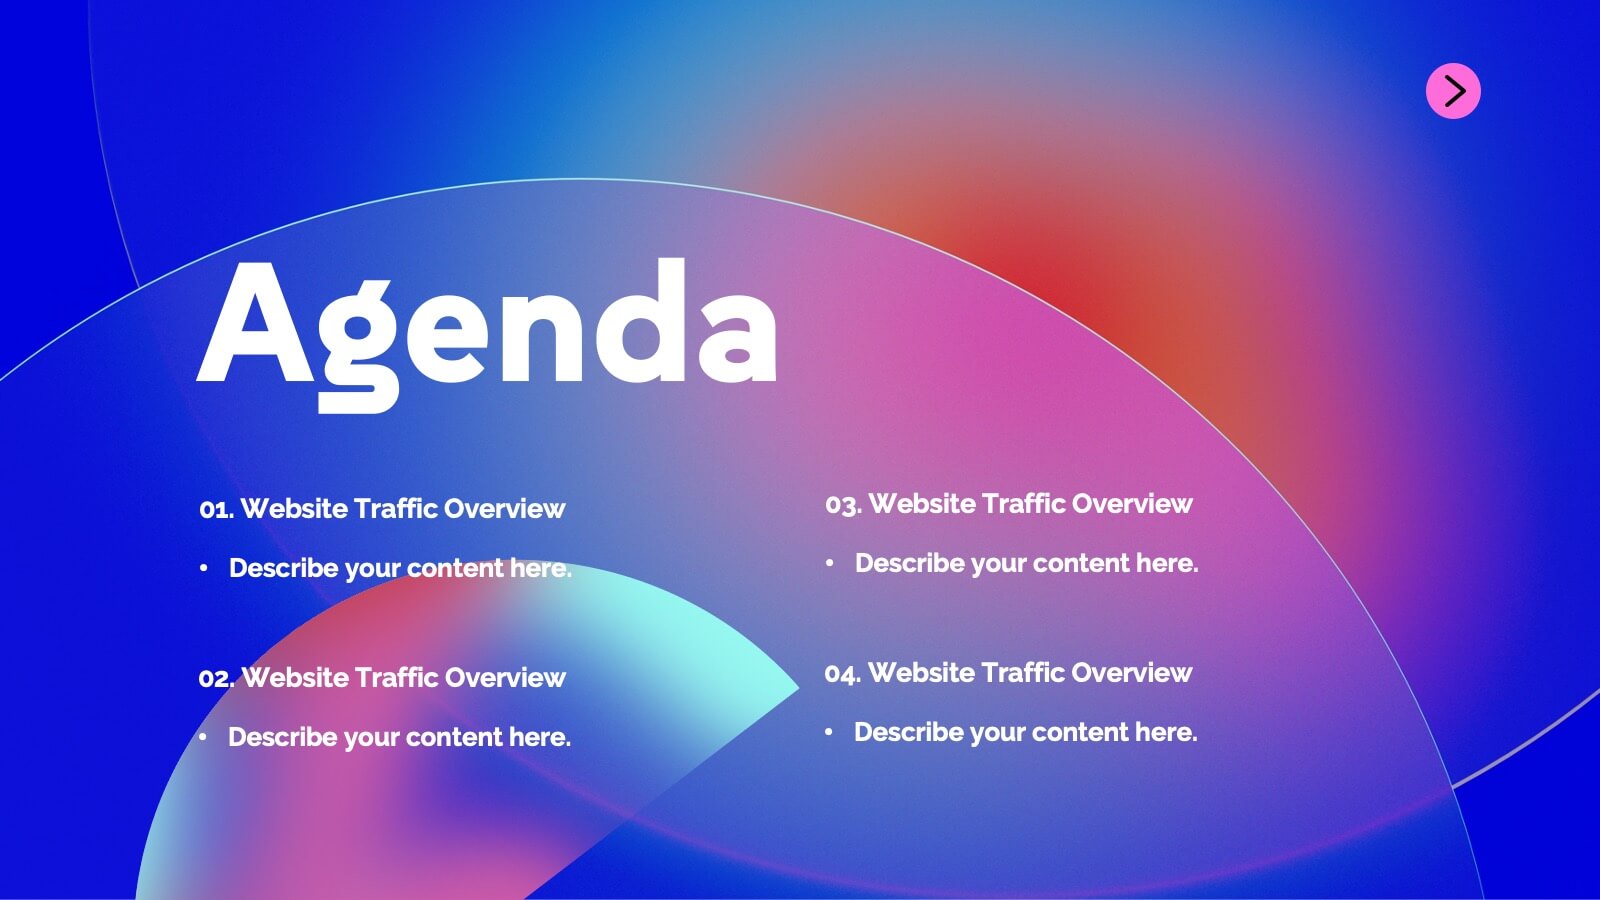
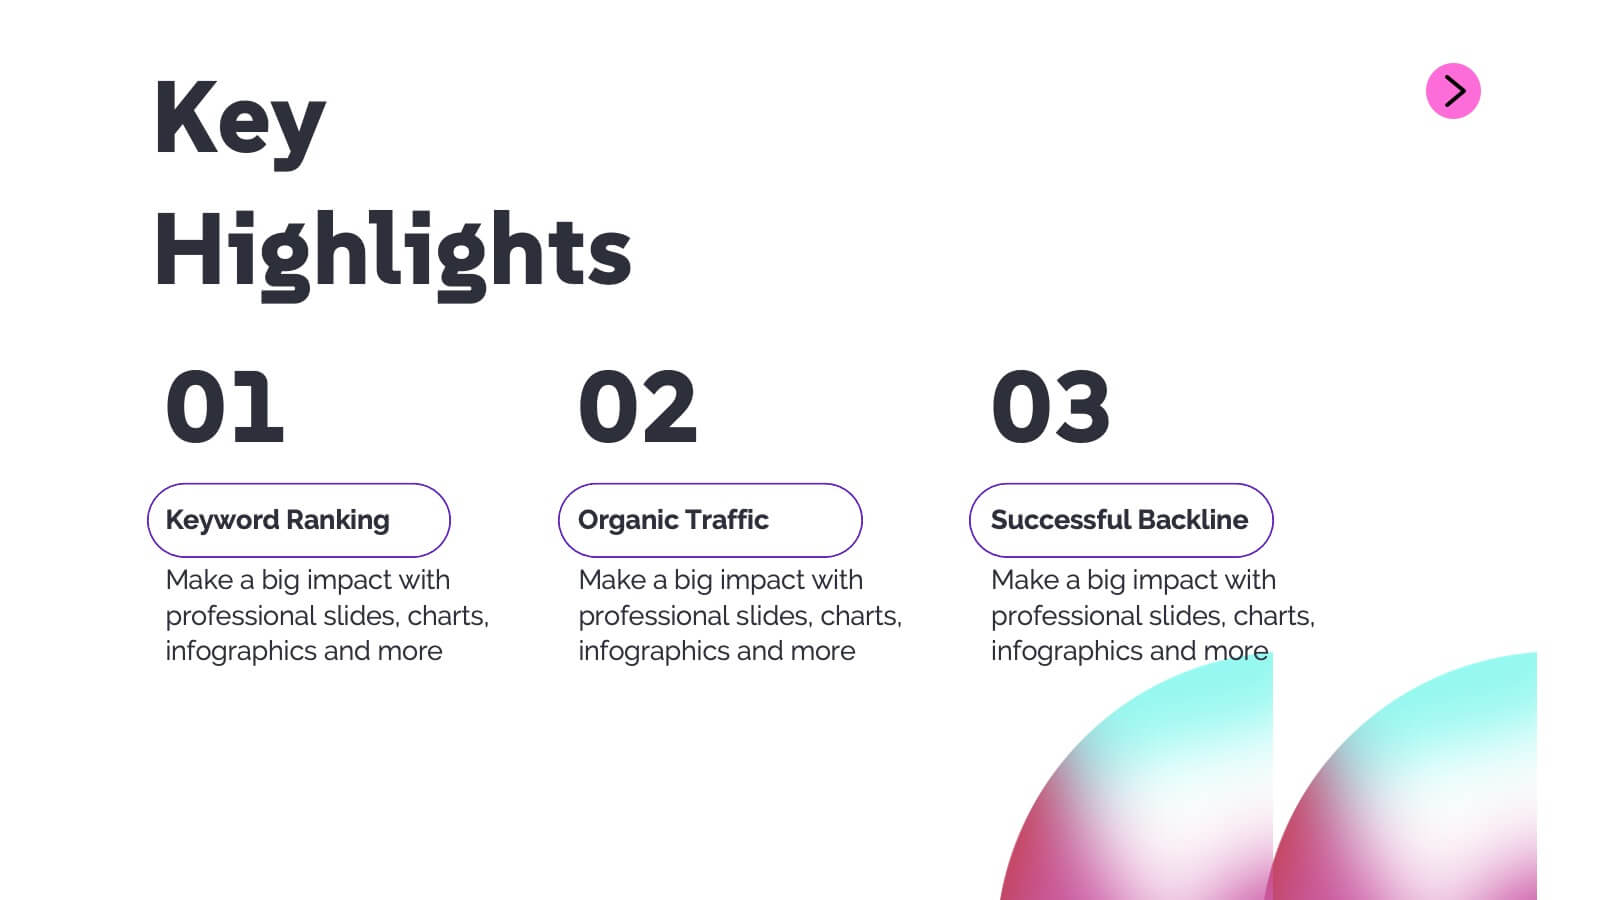
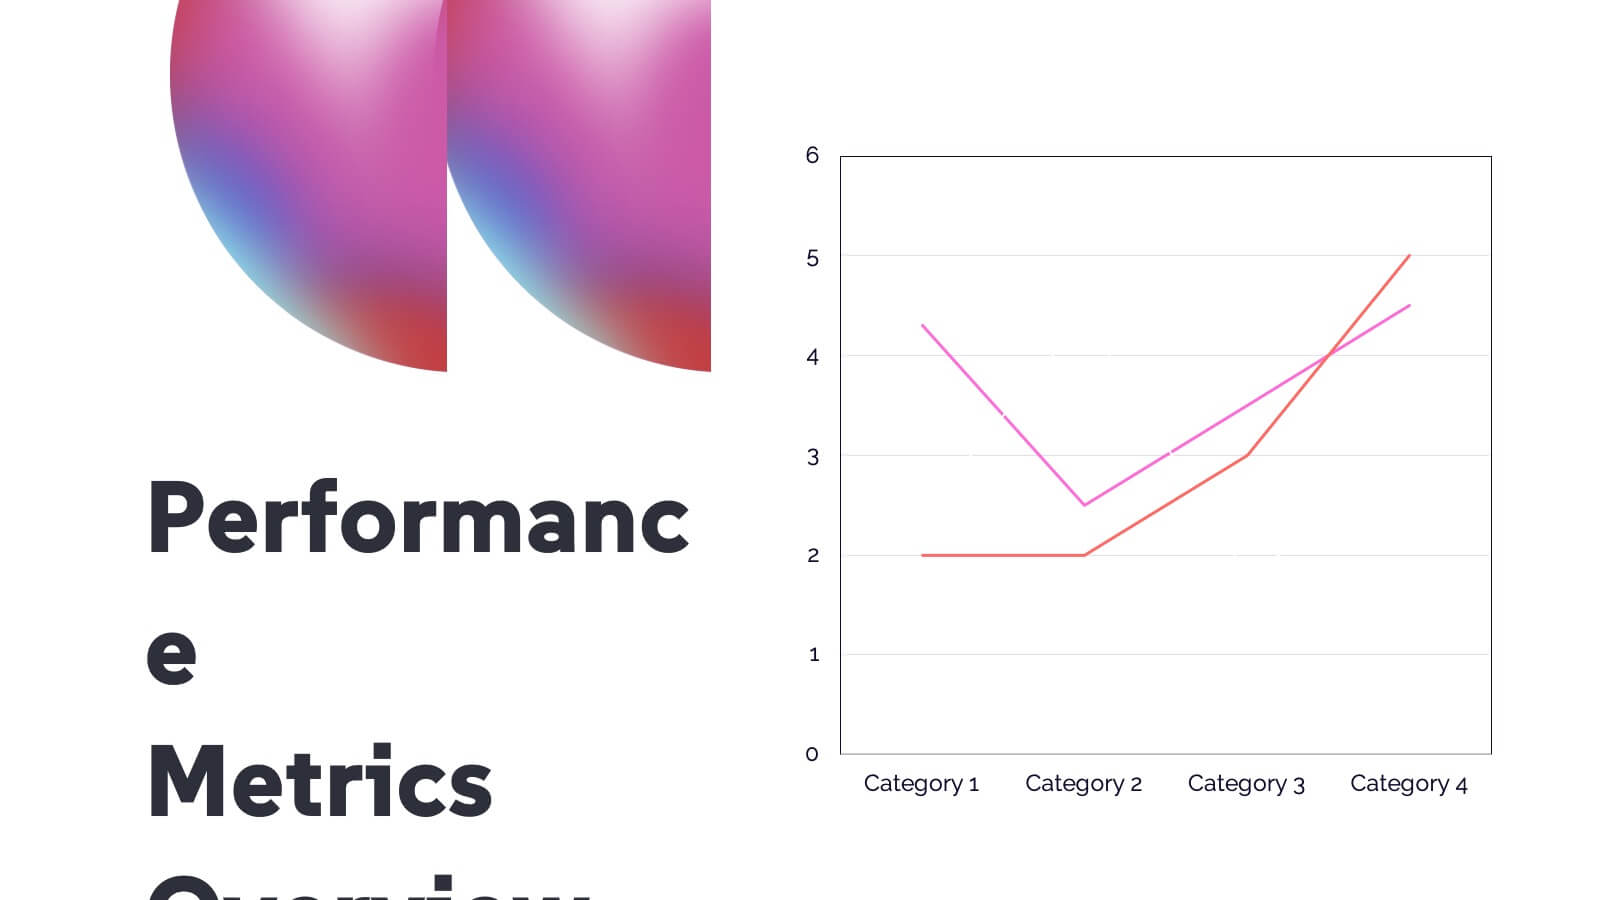
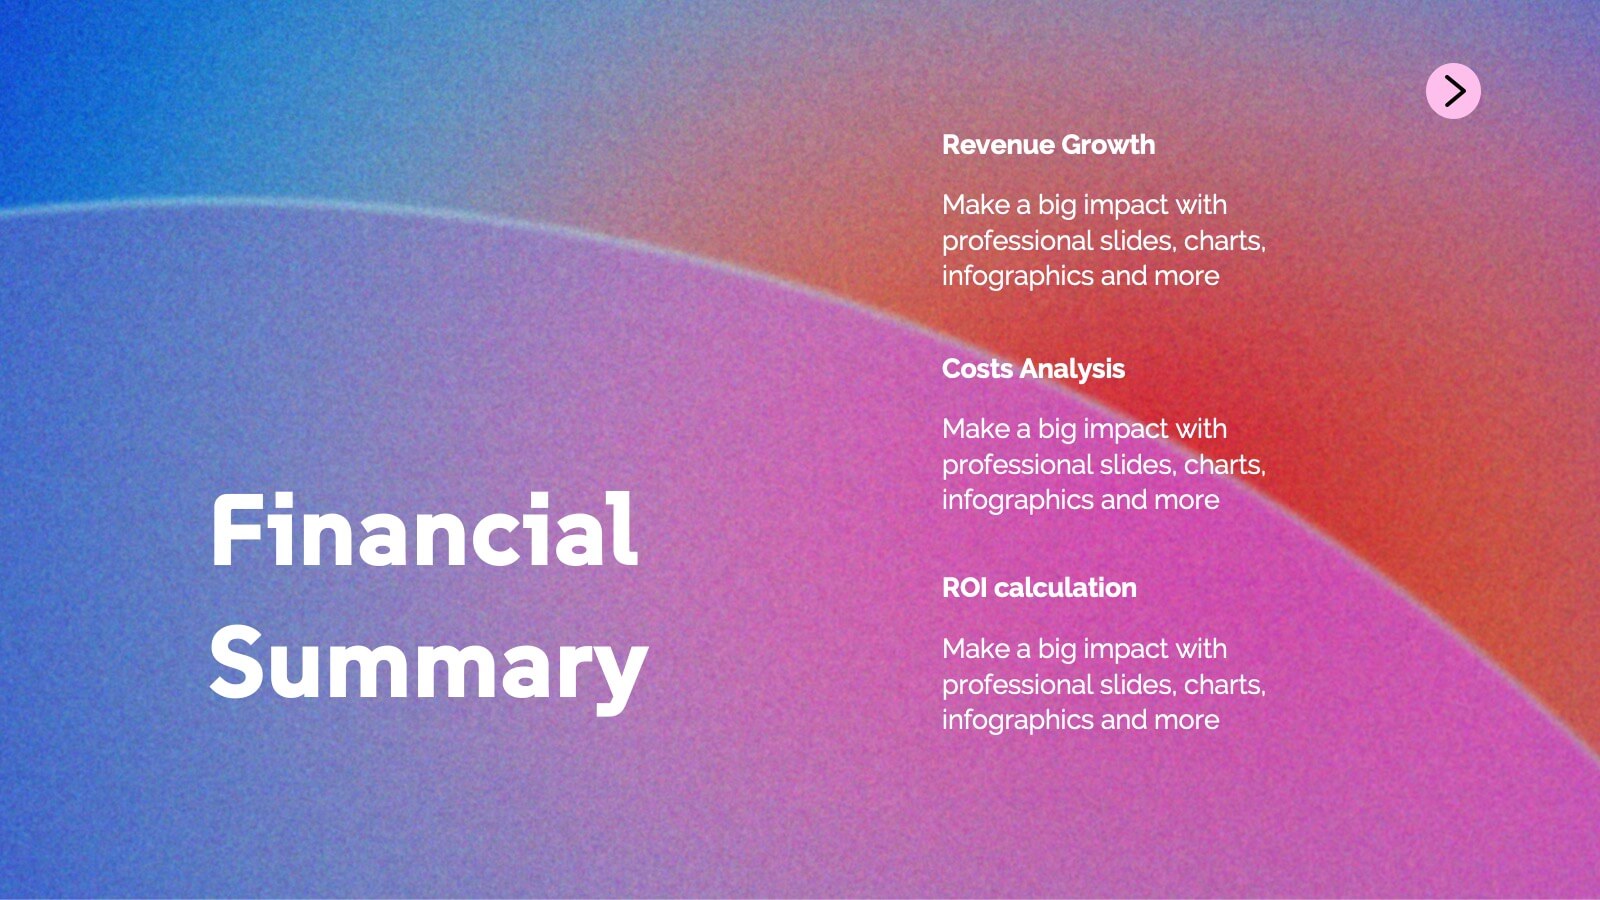
Sphinx Project Status Report Presentation
This modern project status report template is perfect for tracking progress and highlighting key achievements. It includes sections for performance metrics, financial summaries, challenges, and strategic initiatives. Keep stakeholders informed with clear, concise updates. Compatible with PowerPoint, Keynote, and Google Slides for easy customization and presentation.


21 diapositivas
Chrysolis Small Business Pitch Deck Presentation
Make your business stand out with a pitch deck that tells your story with clarity and confidence. Covering key elements like company policies, performance metrics, collaboration opportunities, and future projects, this presentation helps you impress stakeholders. Fully customizable and compatible with PowerPoint, Keynote, and Google Slides for a seamless pitch experience.


6 diapositivas
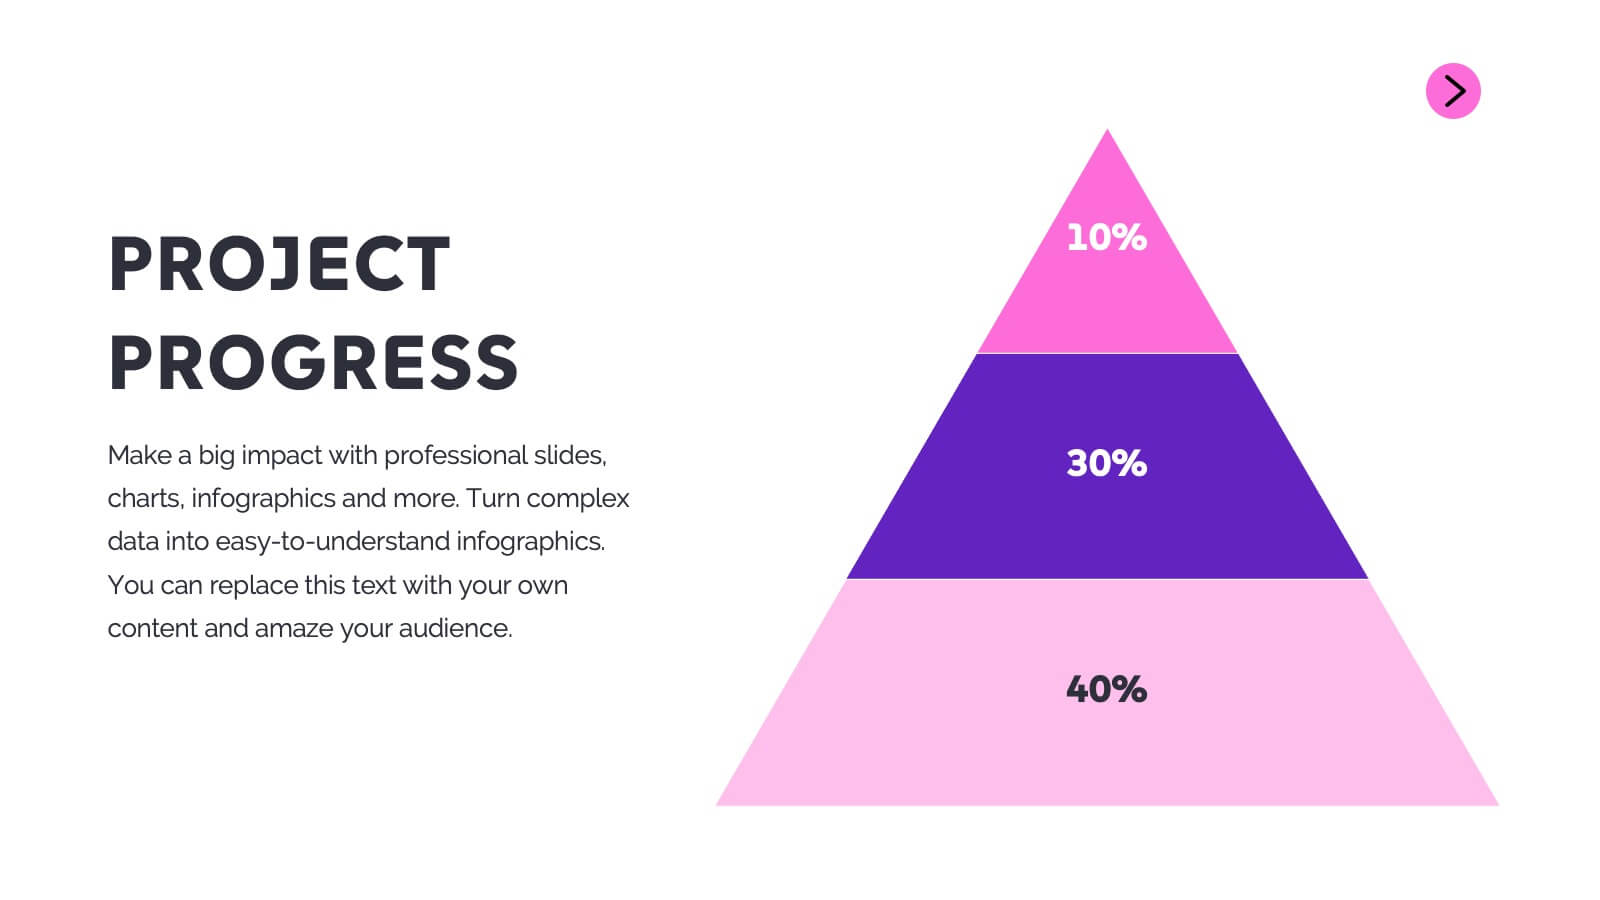
Business Case Study and ROI Breakdown Presentation
Communicate your business impact clearly with the Business Case Study and ROI Breakdown Presentation. Featuring layered building-block visuals, this template is ideal for illustrating return on investment, strategic value, or project outcomes. Perfect for executive briefings and stakeholder presentations. Fully editable in PowerPoint, Keynote, and Google Slides.


7 diapositivas
Asia Regions Map Infographic
Embark on a visual journey across the vast and diverse continent of Asia with our meticulously crafted map infographic. Painted in the cultural richness of red, the depth of blue, and the clarity of white, our template captures the essence of Asia in all its glory. Adorned with pinpoint infographics, symbolic icons, and region-specific image placeholders, it serves as a comprehensive guide to Asia's multifaceted landscape. Impeccably designed for Powerpoint, Keynote, or Google Slides. An indispensable resource for educators, travelers, researchers, or businesses venturing into the Asian market. Explore with purpose; let every slide be a step into Asia's vibrant tapestry.


6 diapositivas
Capability Gap Analysis Infographic
Gap analysis is a strategic management tool used to compare an organization's current performance or situation with its desired or target state. This infographic template is a visual representation of the process of conducting a capability gap analysis, which is a strategic assessment used to identify the gaps between their current capabilities and the capabilities required to achieve their goals or meet specific objectives. The infographic aims to provide a clear and concise overview of the capability gap analysis process and its key components. Compatible with Powerpoint, Keynote, and Google Slides.


10 diapositivas
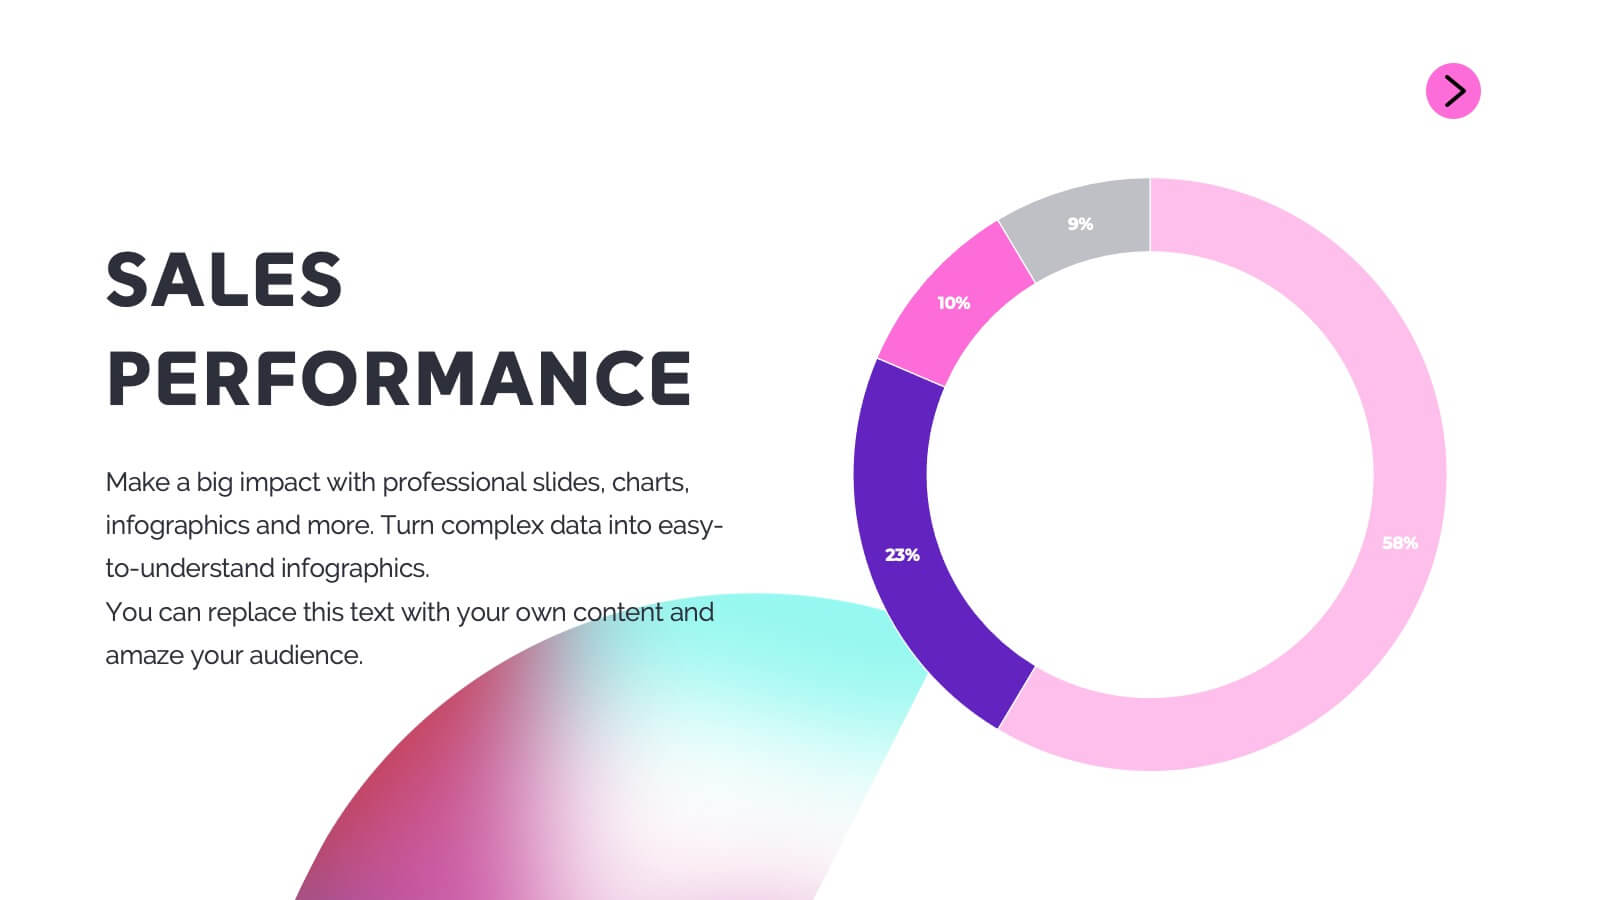
Business Data Charts Presentation
Visualize insights with precision using this Business Data Charts Presentation Template. Featuring clean, colorful doughnut charts and clearly labeled segments, it’s ideal for showcasing survey results, KPI breakdowns, or performance metrics. Designed for professionals who want sleek data visuals, and fully customizable in PowerPoint, Keynote, and Google Slides.


12 diapositivas
Corporate Hierarchy Structure Presentation
Showcase your Corporate Hierarchy Structure with a sleek and professional design. This template helps visualize organizational roles, reporting relationships, and team structures for clear communication. Perfect for HR teams, business leaders, and project managers, it’s fully customizable and compatible with PowerPoint, Keynote, and Google Slides for easy editing.


10 diapositivas
Corporate Governance Model Presentation
Bring clarity and structure to complex leadership systems with this clean, modern slide, perfect for explaining how key responsibilities flow across an organization. It helps simplify roles, decisions, and oversight for any business audience. Fully editable and easy to use in PowerPoint, Keynote, and Google Slides.


24 diapositivas
Brand Overview Presentation
Enhance your brand storytelling with our Brand Presentation template. Perfect for showcasing brand vision, values, and strategies, this template includes diverse slides for audience targeting and brand touchpoints. Suitable for all professional settings, it's compatible with PowerPoint, Keynote, and Google Slides.


12 diapositivas
Effective Decision-Making with RAPID Presentation
Unlock streamlined decision-making with the Effective Decision-Making with RAPID template, a comprehensive guide designed to help organizations enhance and clarify their decision-making processes. Covering the key phases: Recommend, Agree, Perform, Input, and Decide, this template is essential for teams looking to optimize operational efficiency. Ideal for a variety of business environments, it is compatible with PowerPoint, Keynote, and Google Slides, offering versatility and ease of use for professionals.


25 diapositivas
Siren Rebranding Project Plan Presentation
This sleek brand presentation template covers essential elements like market analysis, brand guidelines, positioning, and audience insights. It's designed to showcase your brand identity and development strategies with a modern layout. Compatible with PowerPoint, Keynote, and Google Slides, it’s perfect for delivering professional and engaging brand presentations.


7 diapositivas
Website Mockup Infographic
Enhance your digital presence with this curated collection of website mockup templates, meticulously designed to showcase your online projects with clarity and professional flair. Each template features vibrant layouts that display your website designs on various digital devices, providing a comprehensive view of how your site will look across different platforms. These mockups are crafted with precision, emphasizing the responsive nature of web design and ensuring that your visuals translate beautifully from desktops to mobile devices. The use of bright colors and clear, concise text areas within the mockups makes them both attention-grabbing and informative. Perfect for web designers, developers, or digital marketers, these mockups are essential tools for client presentations, portfolio displays, or marketing pitches. They allow you to demonstrate the functionality and aesthetics of your website effectively, ensuring your digital projects resonate with your target audience.
5 diapositivas
PM Milestone Planning and Tracking Layout Presentation
Track your project progress with clarity using the PM Milestone Planning and Tracking Layout Presentation. This curved arrow timeline visually guides stakeholders through five key stages of your project plan, highlighting each milestone with clear labels. Fully editable in Canva, PowerPoint, Keynote, and Google Slides for flexible use.


4 diapositivas
Athlete Performance Metrics Presentation
Track and display key performance data with this Athlete Performance Metrics slide. Featuring a semi-circular layout with sports icons, percentages, and editable text areas, this template helps visualize stats clearly. Ideal for coaching reports or sports analysis. Compatible with PowerPoint, Keynote, and Google Slides for easy customization and use.


26 diapositivas
Leadership and Management Skills Presentation
Elevate your leadership and management training with a presentation template that's as organized and efficient as it is visually appealing. The design is tailored for clarity, with a clean, contemporary layout that speaks to professionals eager to enhance their skills. Each slide is crafted with purpose, using a smart blend of graphics and space to highlight key concepts in leadership and management. This template includes a variety of slides to cover all training aspects: from the core qualities of a leader to the intricacies of team management. Graphs and charts provide a clear representation of management theories, while comparison slides help illustrate different leadership styles. Whether for a corporate training session, a workshop for budding entrepreneurs, or a classroom lecture, this set is ready for use in PowerPoint, Keynote, and Google Slides, making it a valuable tool for any leadership development program.


6 diapositivas
Strategic Business Objective Mapping Presentation
Clearly define your strategic focus with this Strategic Business Objective Mapping slide. Designed to display six core objectives around a central theme, it’s ideal for visualizing business goals, departmental priorities, or key initiatives. Fully customizable in PowerPoint, Canva, and Google Slides for seamless team collaboration.


6 diapositivas
Machine Learning and Data Science Presentation
Deliver insights with precision using this data-driven presentation template tailored for machine learning, AI, and analytics topics. Featuring a central hub-and-spoke design, this layout allows you to showcase key components like algorithms, tools, processes, or data sources. Each segment includes clean icons and customizable titles for seamless editing. Ideal for data scientists, tech professionals, and academic presentations. Fully editable in PowerPoint, Keynote, and Google Slides.