


Características


¿Tienes alguna pregunta?
Recomendar


22 diapositivas
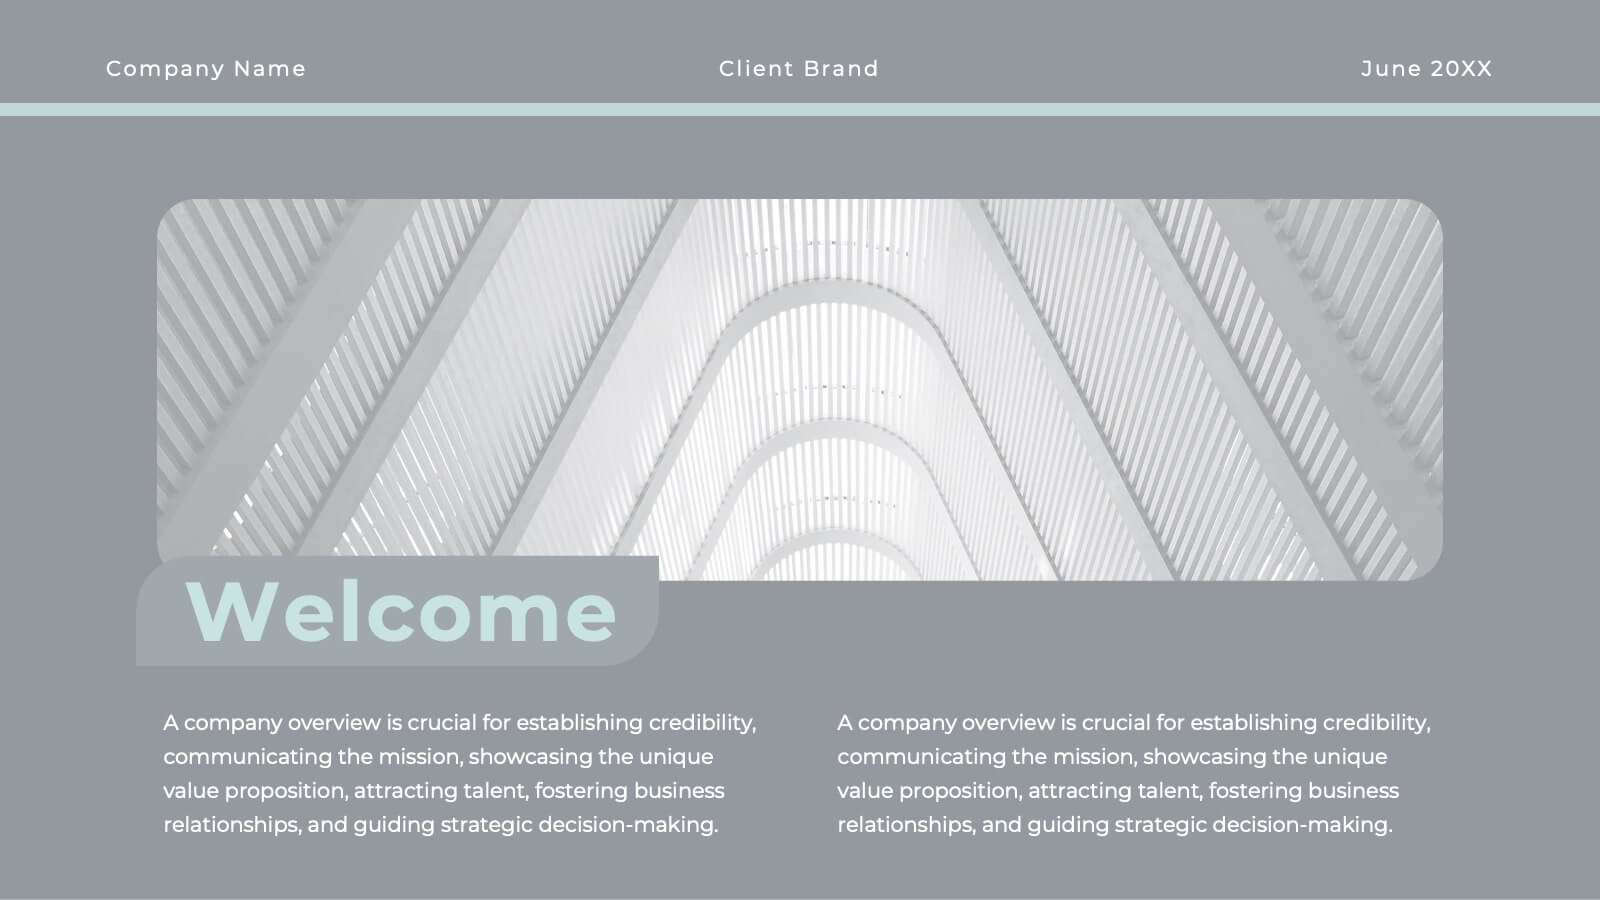
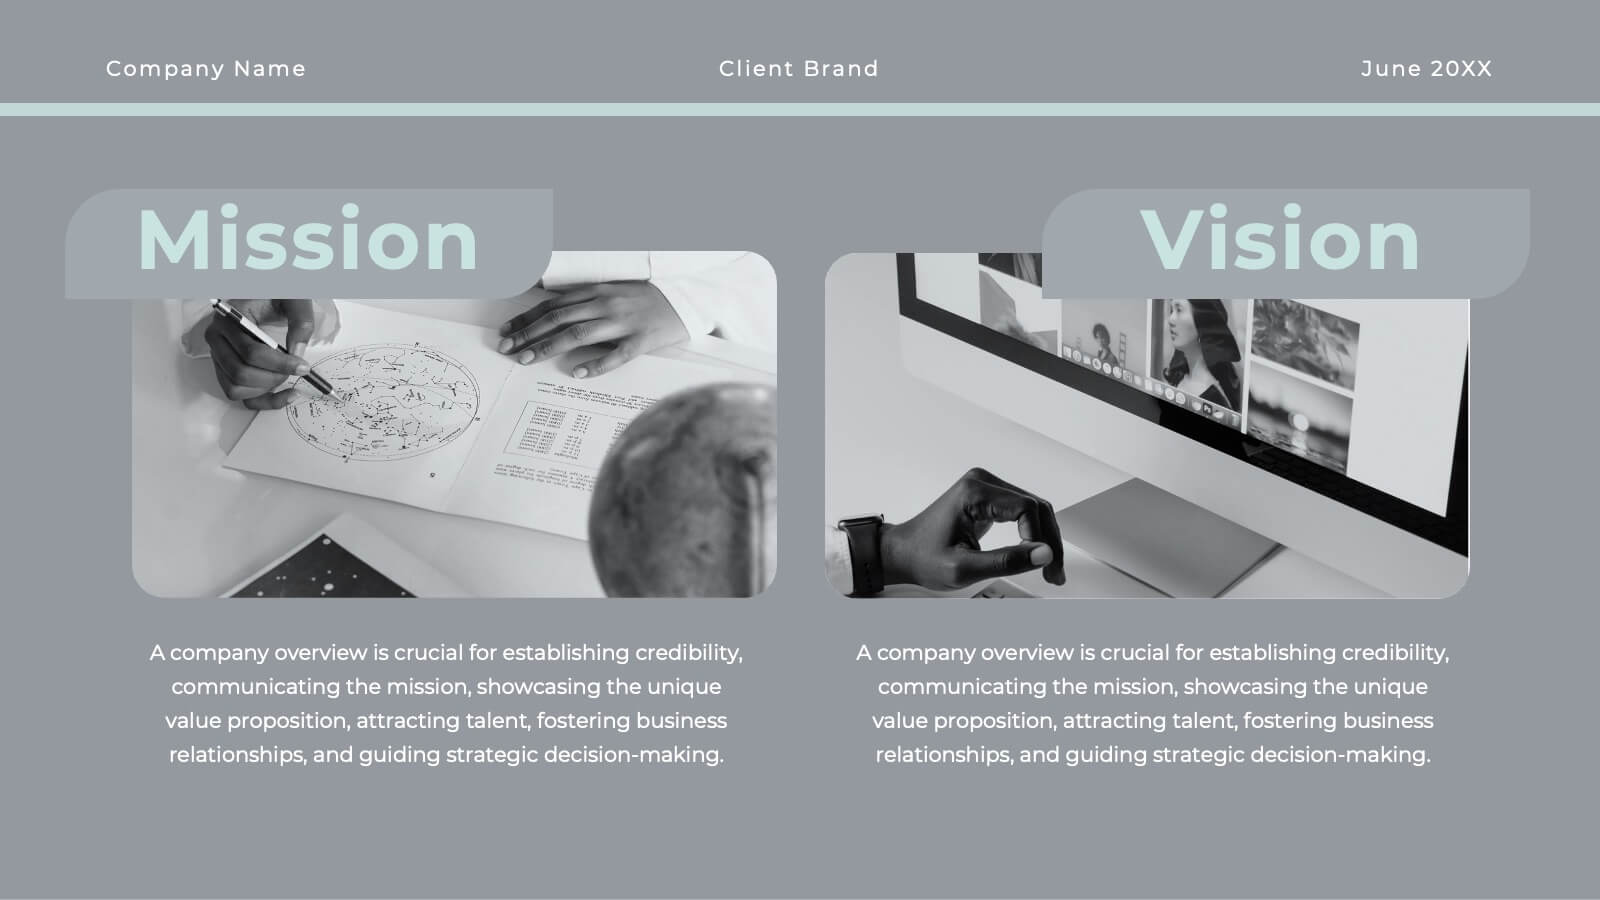
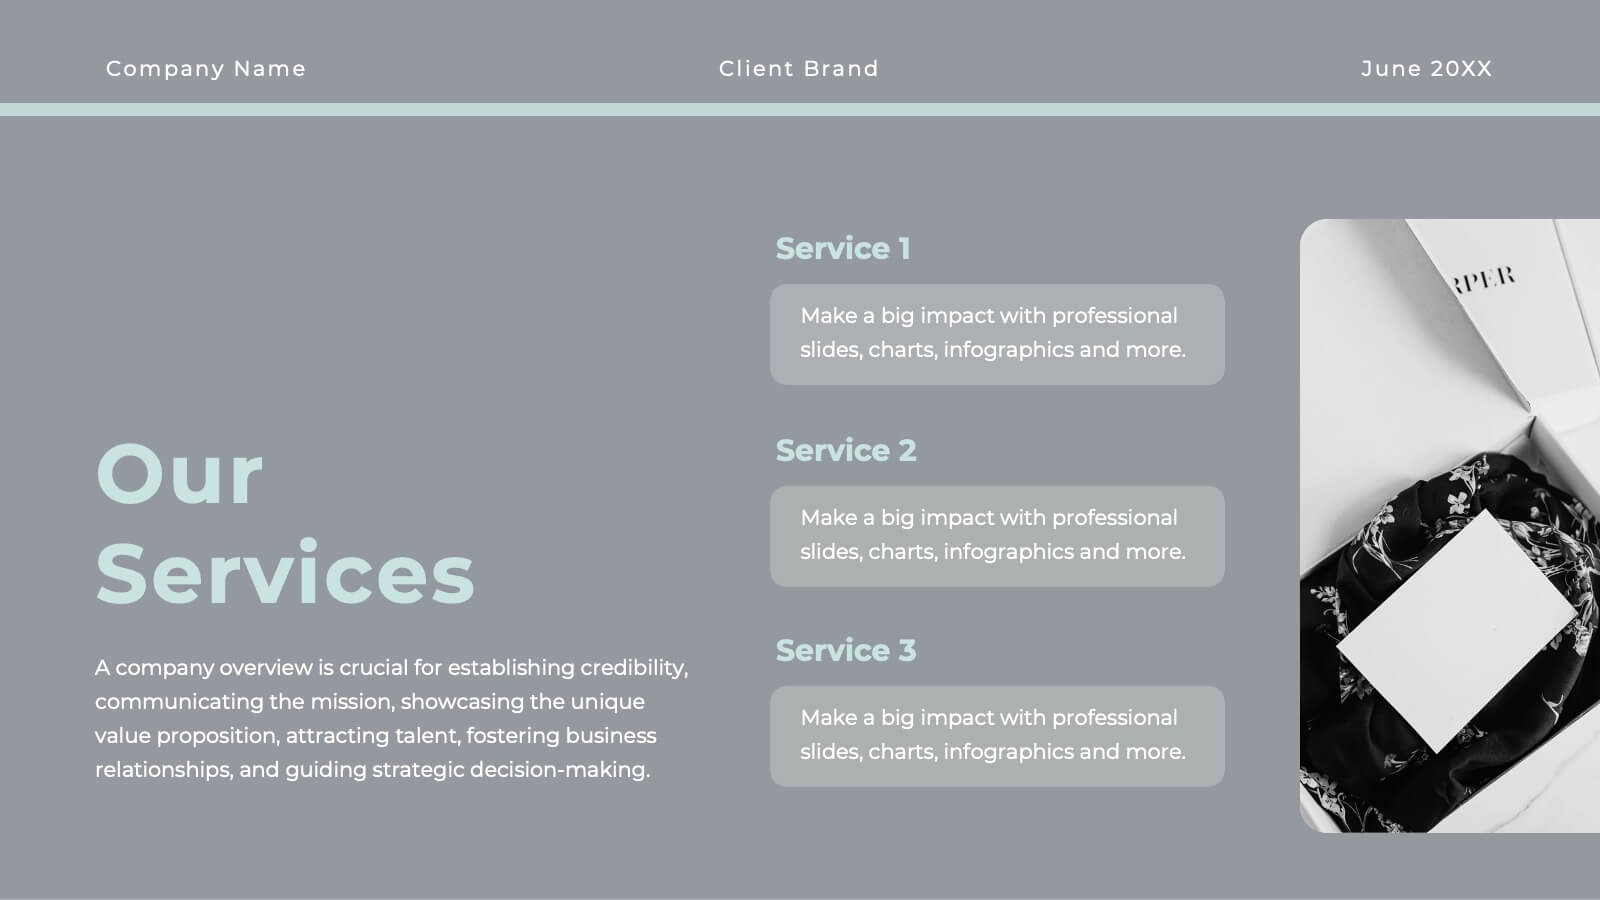
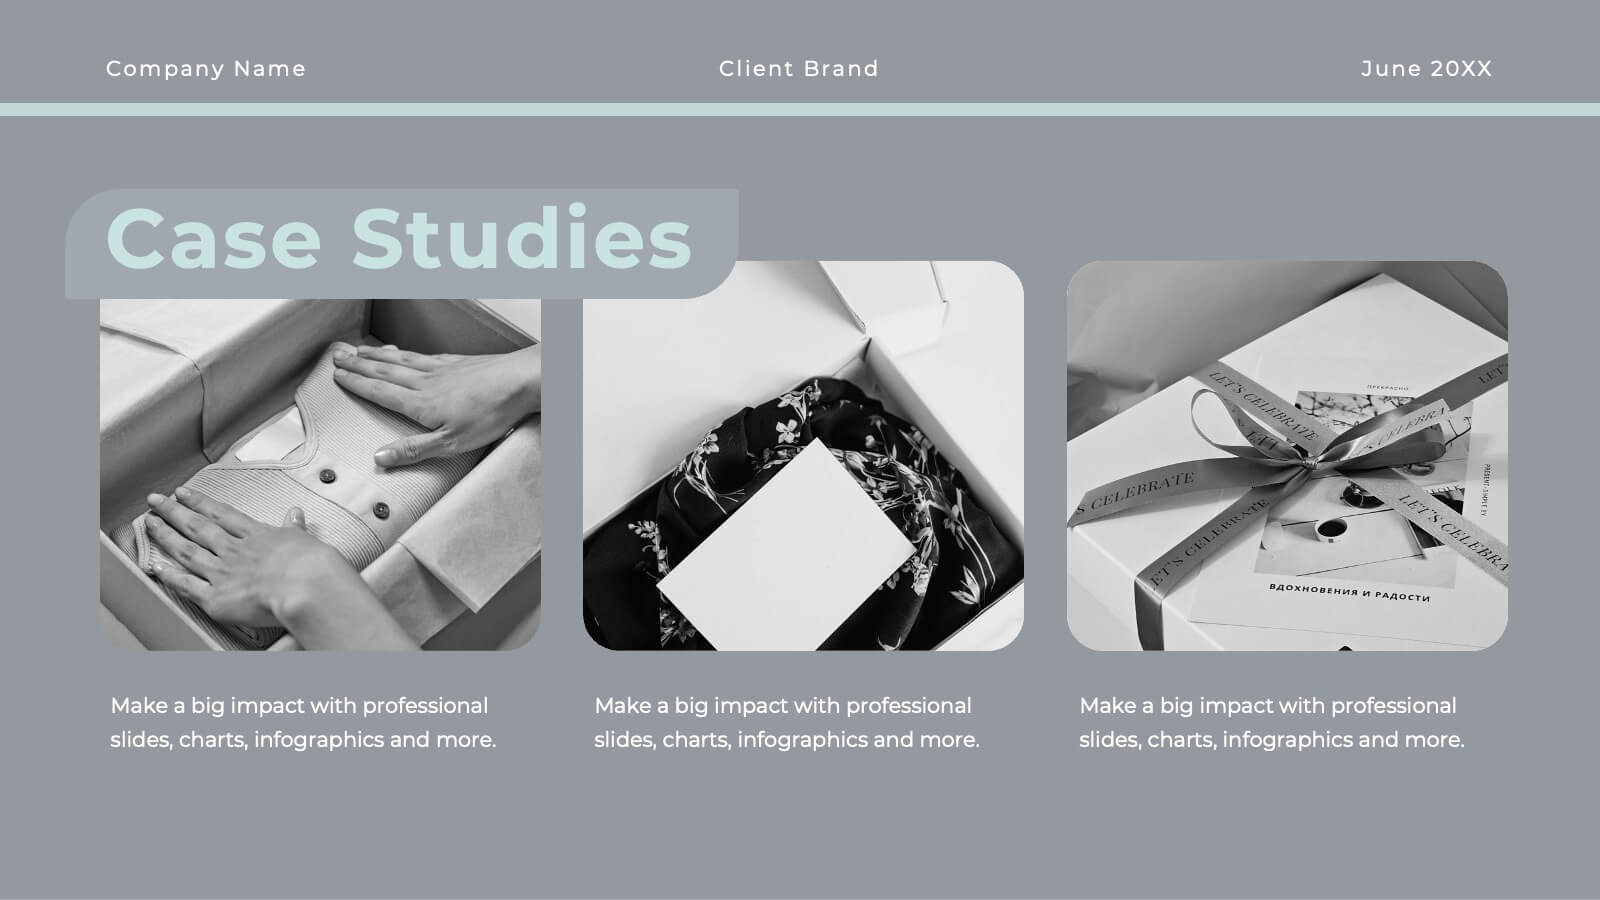
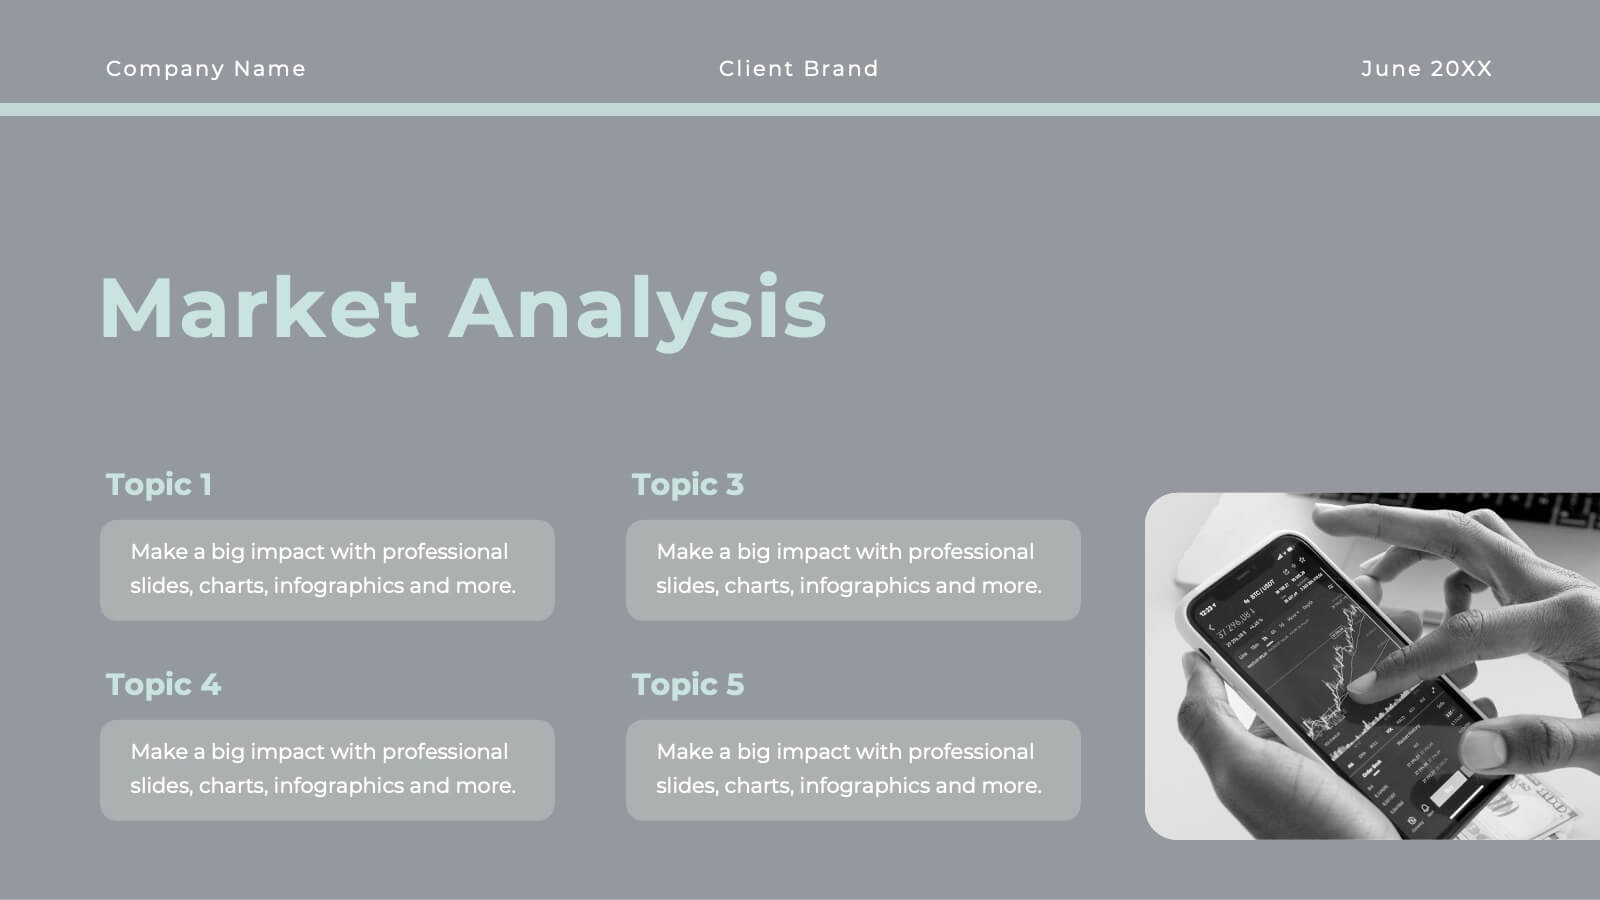
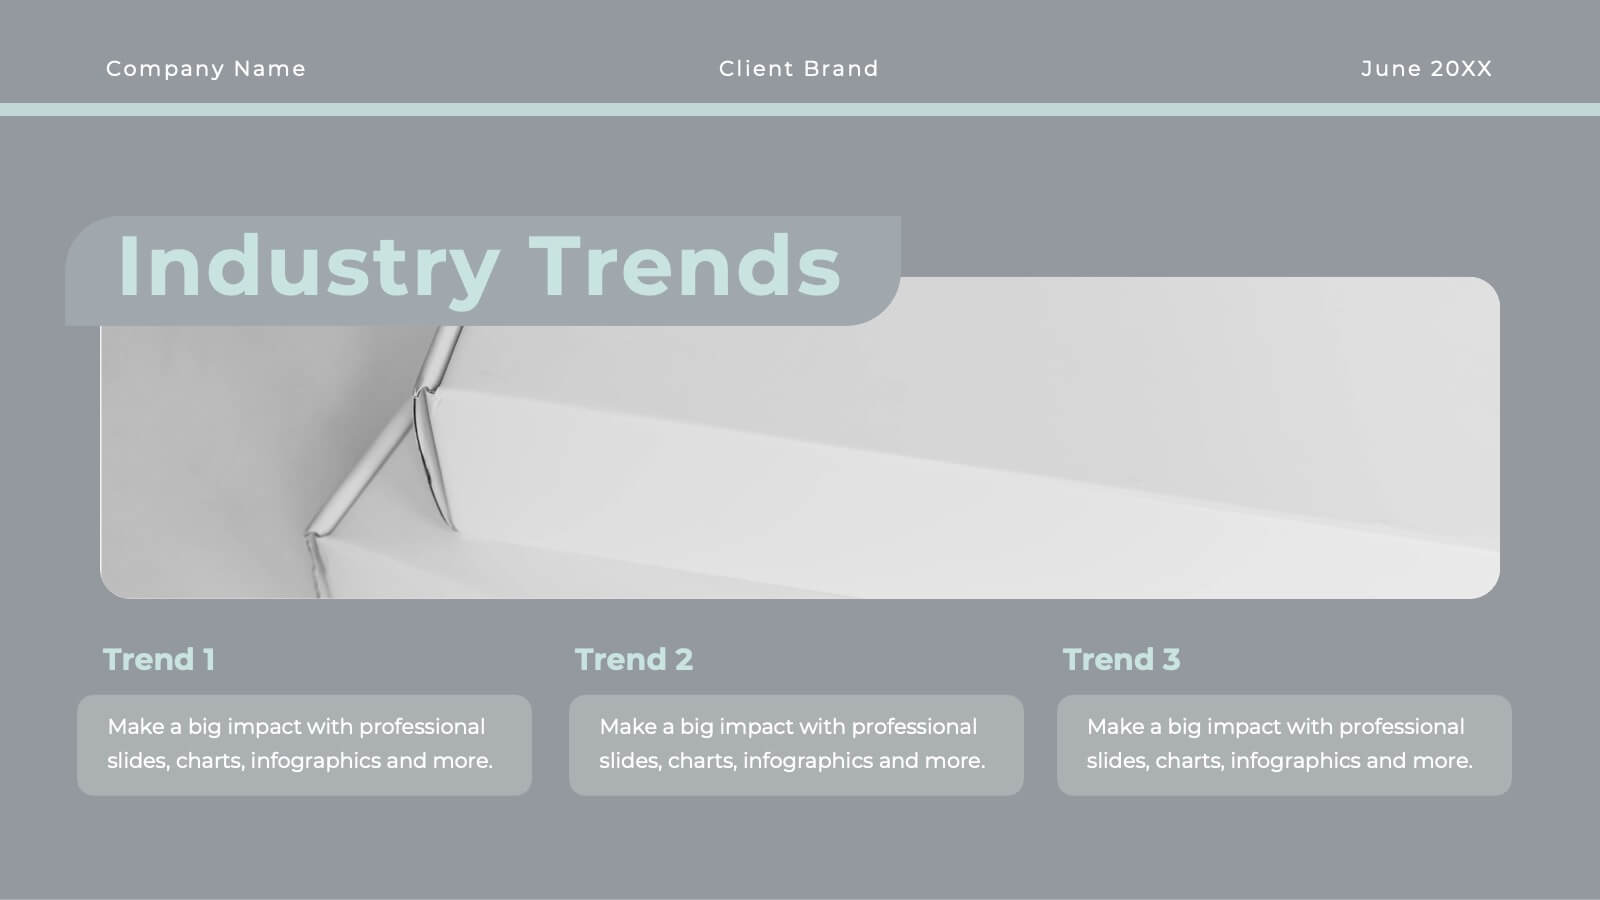
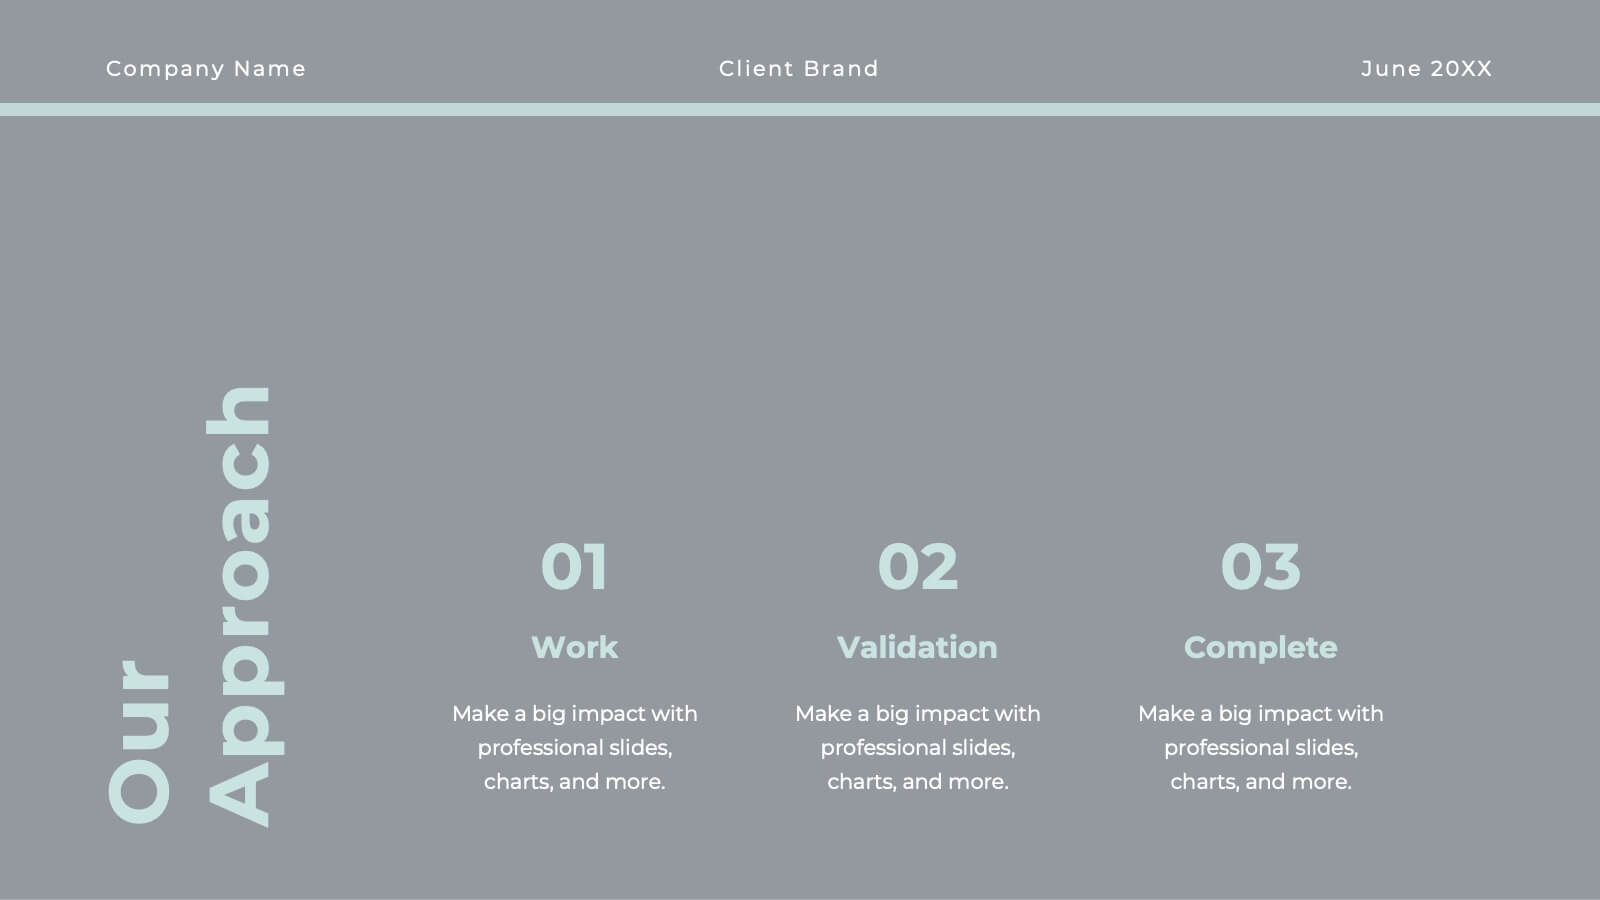
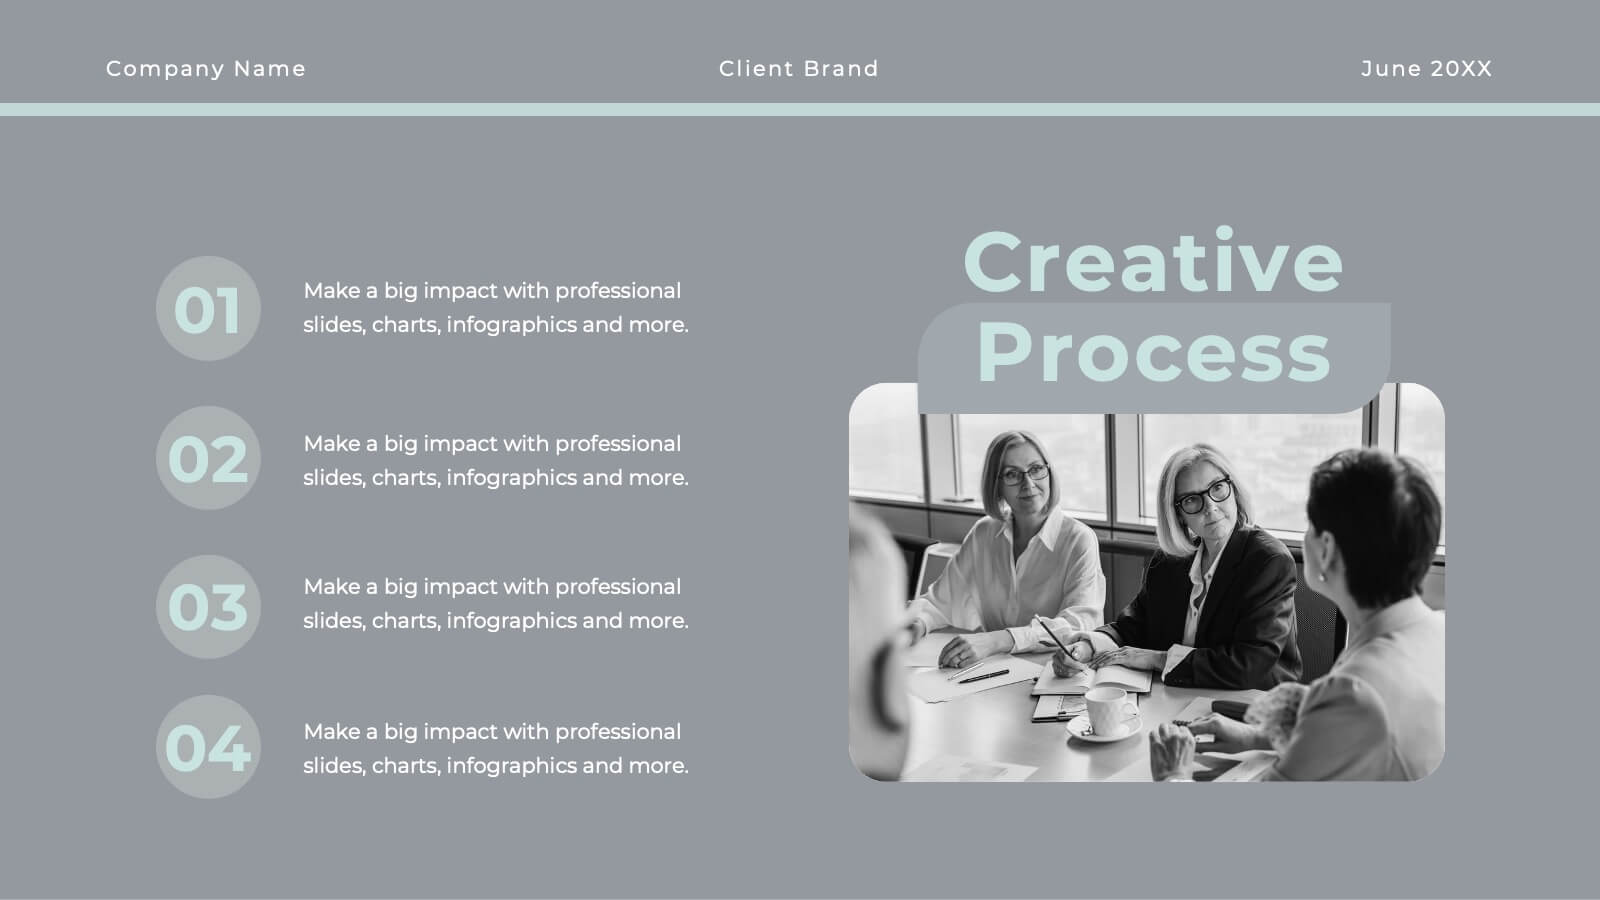
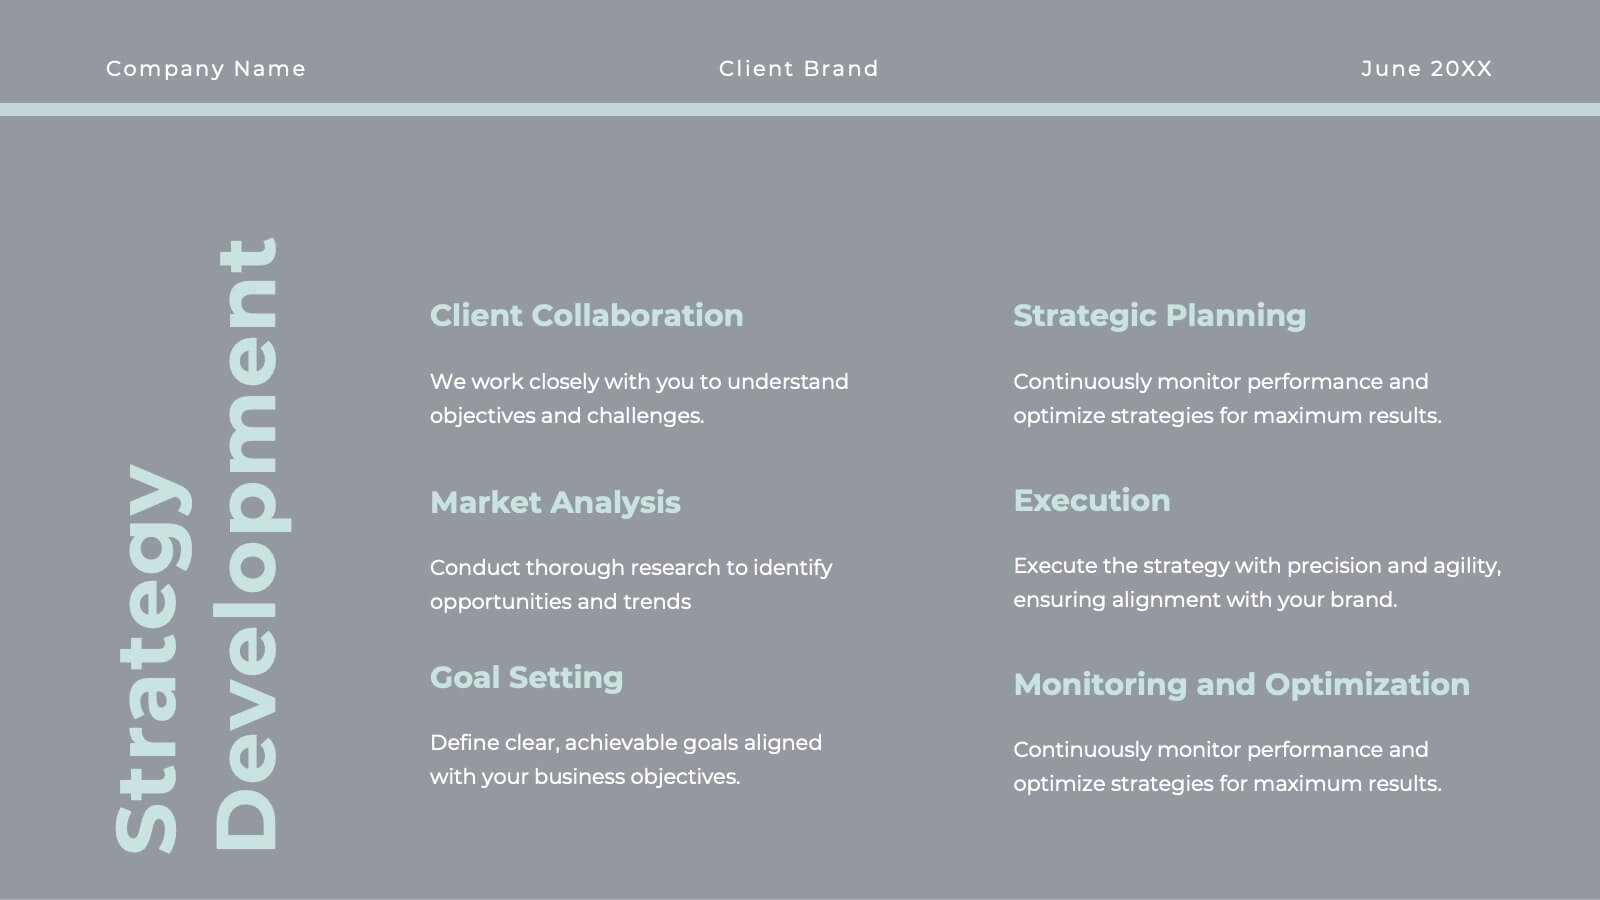
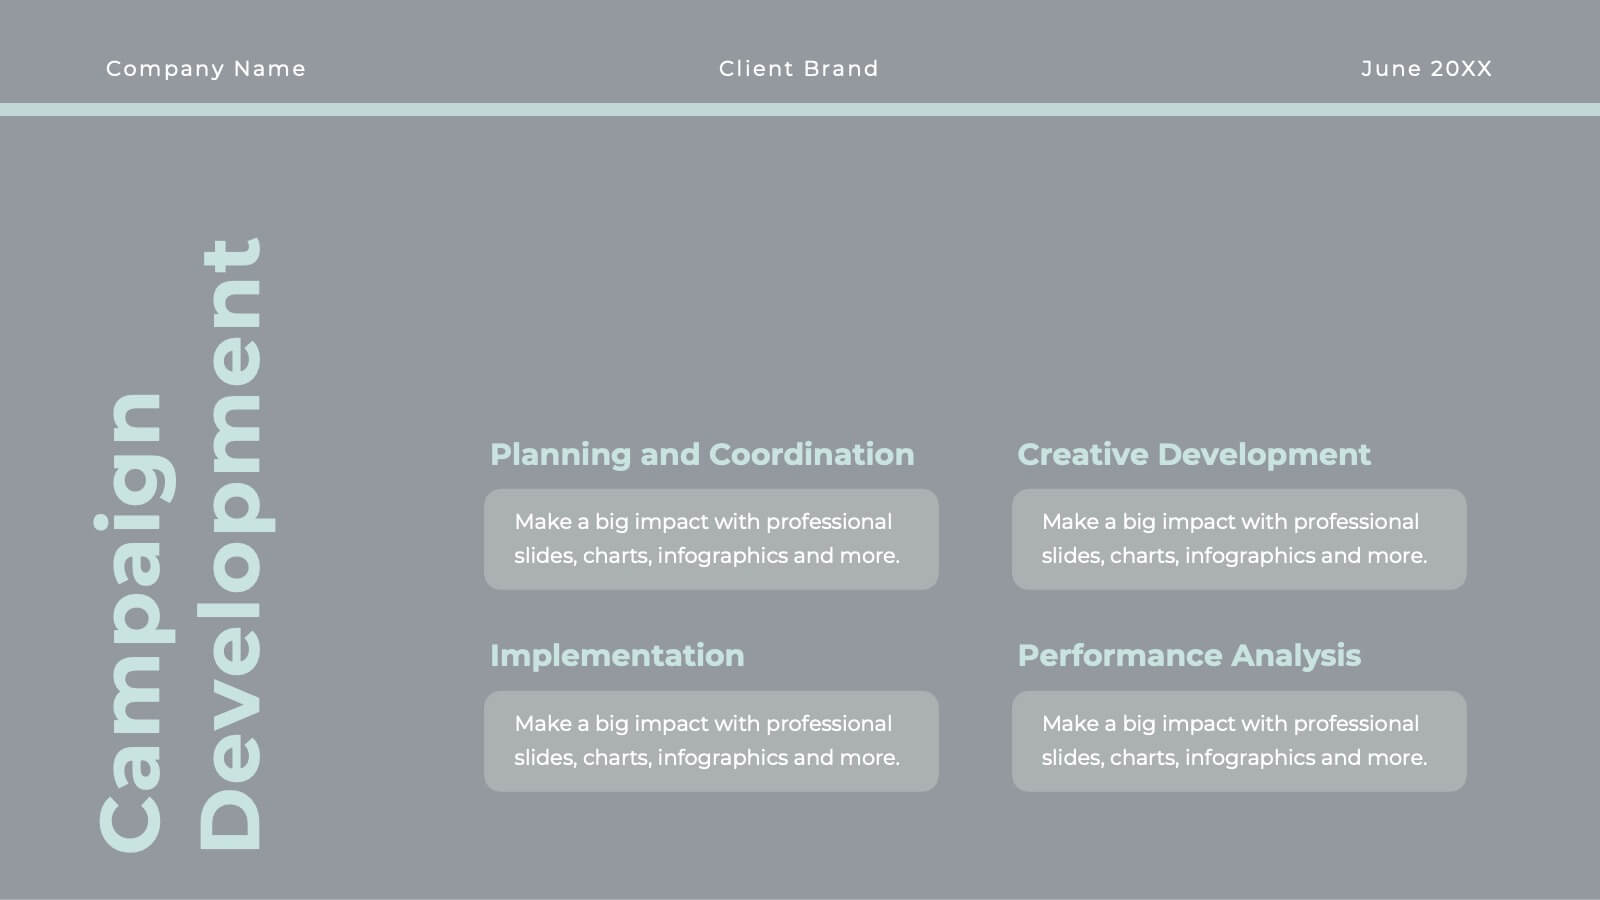
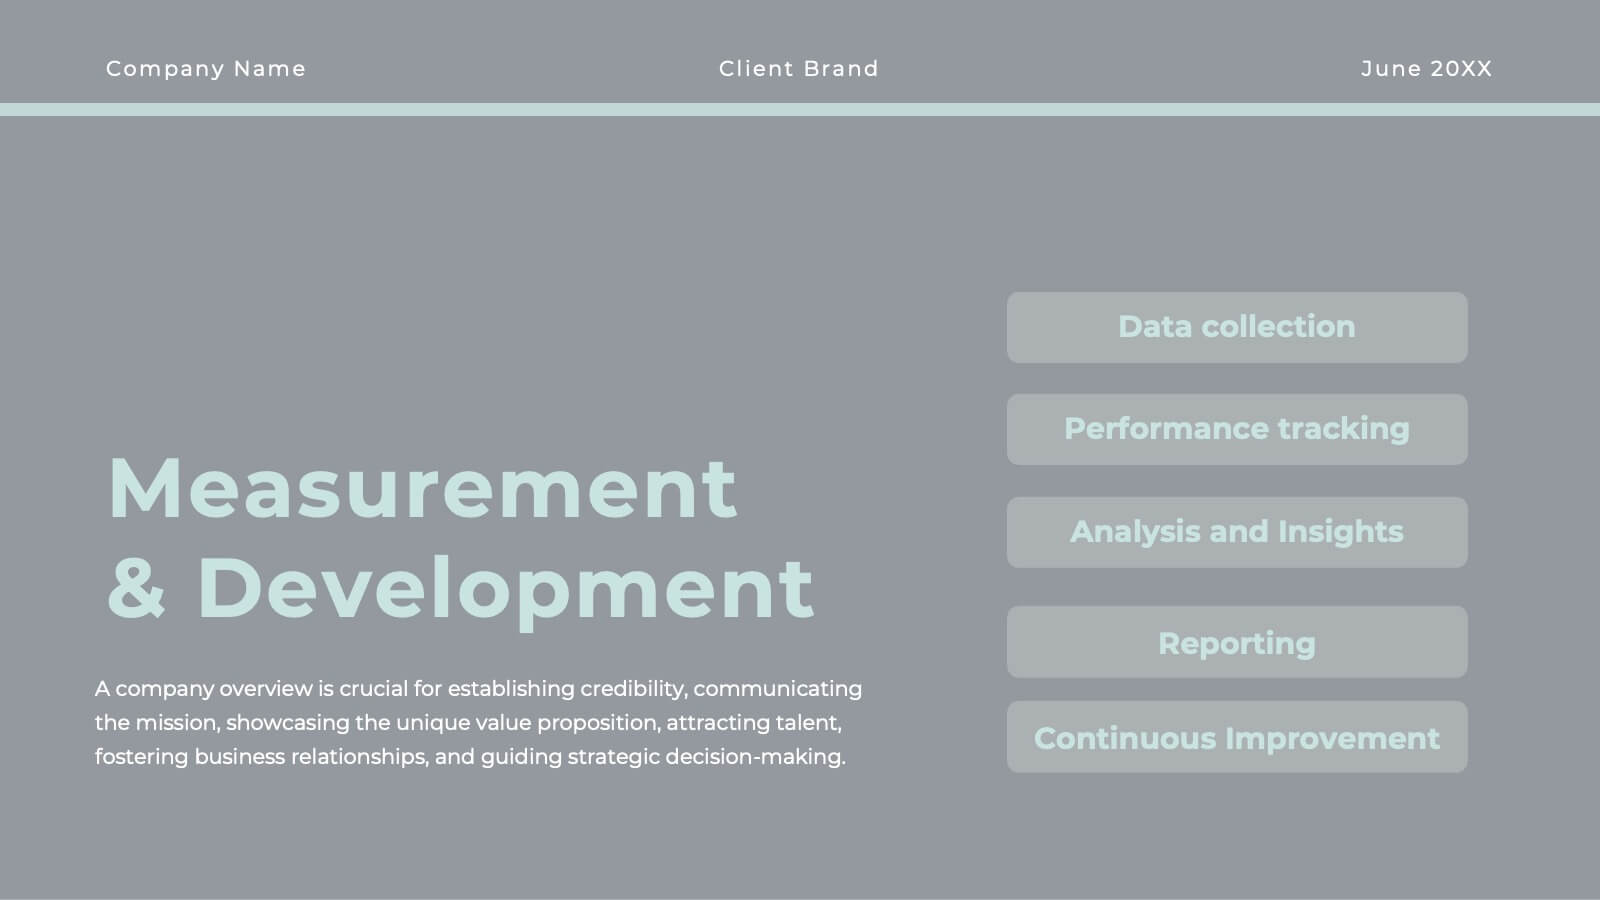
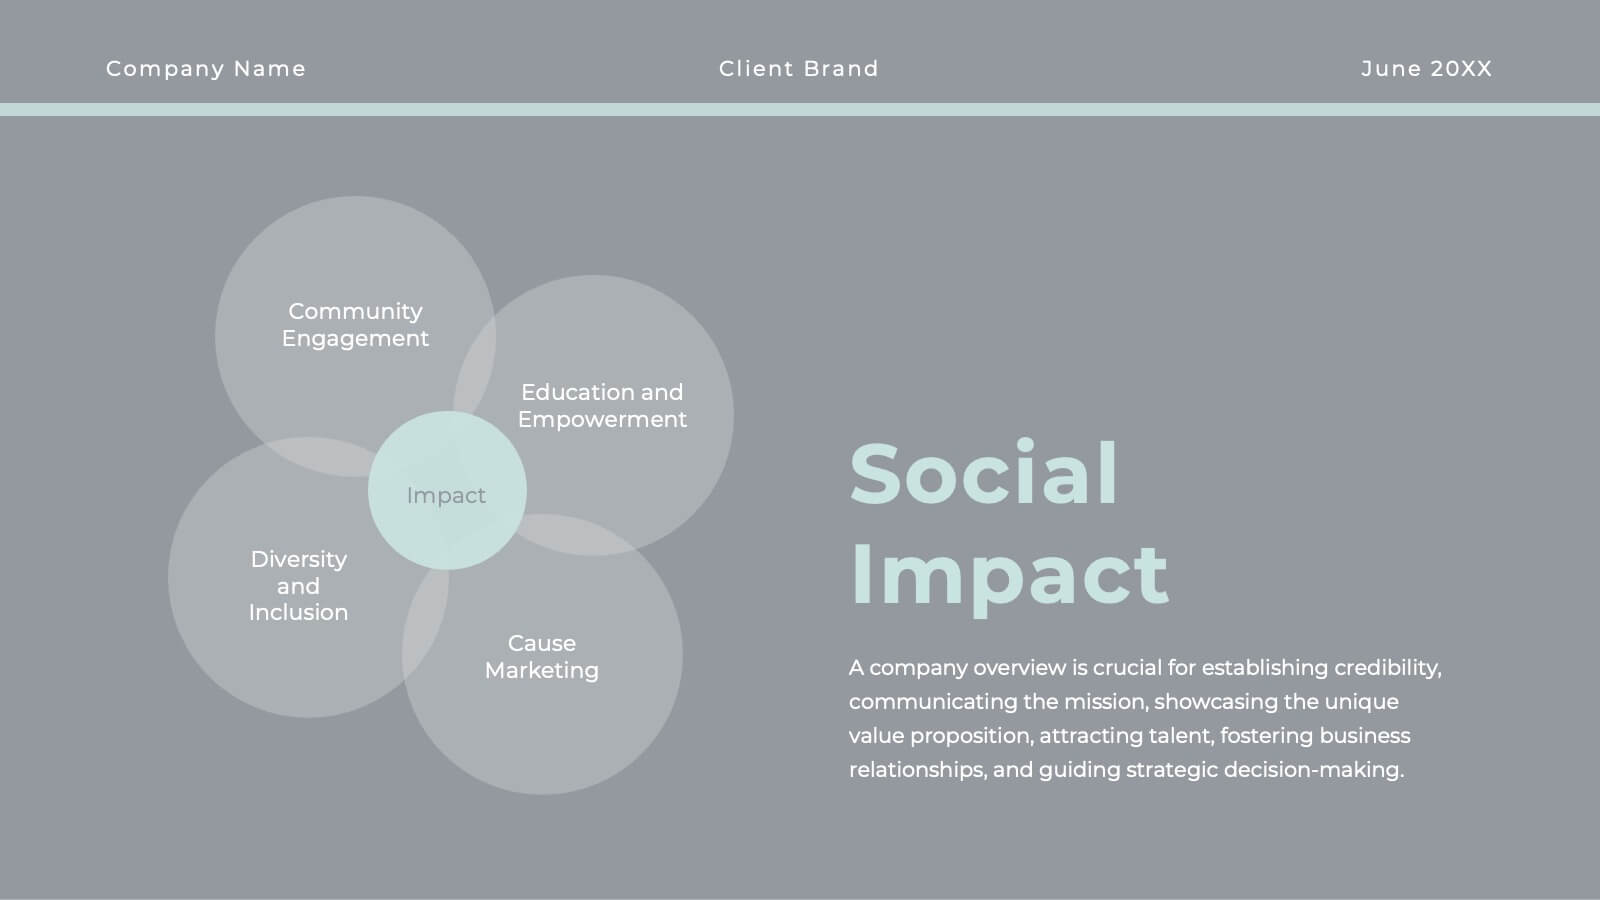
Whirlwind Advertising Agency Proposal Presentation
Get ready to elevate your agency’s game with a proposal template that’s as polished as your services! This sleek and sophisticated design is crafted to make a lasting impression on your clients and partners. From introducing your team’s expertise to showcasing successful case studies, every slide is meticulously designed to reflect professionalism and creativity. The clean, modern layout helps you present your market analysis, industry trends, and strategic approach with clarity and impact. With dedicated sections for client testimonials, campaign development, and partnership opportunities, this template ensures your agency’s value proposition is communicated with confidence and style. Perfectly adaptable to PowerPoint, Keynote, and Google Slides, this proposal template is your go-to tool for sealing deals and building lasting relationships. Your agency’s vision and mission will shine through in a presentation that’s both powerful and persuasive, making your proposals truly unforgettable!


7 diapositivas
AIDA Interest Model Infographic
The AIDA Interest Model is a cornerstone in marketing and sales, guiding professionals through the stages of Attention, Interest, Desire, and Action. Our infographic, bathed in hues of purple, green, blue, and yellow, brings this classical model to life in a refreshing and engaging manner. With a fun, yet informative style, it elucidates each phase, making it a go-to resource for marketers, salespersons, and educators alike. Whether you're training a team, educating students, or crafting a persuasive pitch, this infographic will elevate your presentation. It's fully compatible with PowerPoint, Keynote, and Google Slides.


5 diapositivas
Technological Advances in Manufacturing Infographics
Manufacturing refers to the process of converting raw materials or components into finished products on a large scale. These infographic templates provide an overview of how technology has transformed the manufacturing industry. This allows you to showcase the significant advancements and their impact on various aspects of manufacturing processes. This template serves as a valuable resource for professionals, educators, students and anyone interested in understanding the evolving landscape of manufacturing technology. Completely customizable and compatible with Powerpoint, Keynote, and Google Slides.


5 diapositivas
Financial Market Trends and Forecast Presentation
Visualize economic shifts and data insights with this upward growth line infographic. Ideal for presenting financial forecasts, investment strategies, and market milestones, this layout features a stylized arrow path with icons, letter markers, and space for detailed annotations. Fully editable and compatible with PowerPoint, Keynote, and Google Slides.


4 diapositivas
Turning Ideas into Impact Presentation
Showcase your transformation journey from concept to achievement with this bold visual layout. The three-step diagram—idea, action, success—makes it ideal for project planning, product development, or strategic execution. Easily editable in PowerPoint, Keynote, and Google Slides for pitch decks, business roadmaps, or innovation workflows. Clean, modern, and impactful.


5 diapositivas
Collaboration Tools for Team Efficiency Presentation
Visualize teamwork like never before with the Collaboration Tools for Team Efficiency Presentation. Featuring a puzzle-style layout, this slide highlights four interconnected ideas or steps—perfect for team workflows, project milestones, or tool comparisons. Easy to customize in Canva, PowerPoint, or Google Slides.


6 diapositivas
Africa Population Map Infographics
Discover the flexibility of our Africa Population Map infographic template, a dynamic tool for illustrating population distribution across the African continent. This template is compatible with widely used presentation software like PowerPoint, Keynote, and Google Slides, allowing you to effortlessly customize it according to your specific requirements. The Africa Population Map infographic template provides a solid foundation for visualizing population data, highlighting densely populated areas, urban centers, and demographic trends. Whether you're an educator, researcher, or simply curious about Africa's demographics, this template offers a user-friendly platform to create engaging presentations and informative materials. Impress your audience with this SEO-optimized Africa Population Map infographic template, thoughtfully designed for clarity and ease of use. Tailor it to showcase population variations, growth patterns, and regional insights, making it a valuable asset for your projects and presentations. Start crafting your personalized infographic today!


6 diapositivas
Academy Sports Infographic
Sports are physical activities or games that involve individual or team competition and are typically governed by specific rules. This infographic template highlights key aspects of sports and physical activities in an academy setting. Whether it's a school sports program, a community sports academy, or a professional training institute, this infographic provides a comprehensive overview of the benefits, programs, and facilities offered by an academy sports institution. This template is compatible with Powerpoint, Keynote, and Google Slides making it easy to navigate and can be easily customized to fit your presentation needs.


5 diapositivas
Creative Watercolor Style Presentation
Splash your ideas onto the page with a layout that blends artistic watercolor accents and clean, modern structure. This presentation helps you showcase insights, steps, or concepts in a visually soothing format that feels both creative and professional. Ideal for storytelling or branding discussions. Fully compatible with PowerPoint, Keynote, and Google Slides.


3 diapositivas
Strategic Planning and Business Model Presentation
Present your business roadmap with clarity using this Strategic Planning and Business Model slide. Featuring a modular grid layout, it allows you to break down initiatives, objectives, and action items into digestible segments. Perfect for business strategy sessions, planning workshops, or executive reports. Fully editable in PowerPoint, Canva, and Google Slides.


4 diapositivas
Social and Professional Networking
Visualize global connections and collaborative ecosystems with this Social and Professional Networking presentation. Ideal for HR teams, marketers, or networking strategists, it showcases relationship-building and engagement across key hubs. Fully customizable in PowerPoint, Keynote, and Google Slides for maximum flexibility in any professional setting.


5 diapositivas
Process Flow Infographics
Streamline your pathway to success with our process flow infographics template. Utilizing a professional gray palette accented with colorful highlights, this creative vertical design is tailored for clarity and impact. Ideal for business strategists and process engineers, this template assists in illustrating step-by-step progressions or workflows in an engaging manner. It's perfect for those who need to communicate processes effectively, ensuring every phase is visually represented and easy to understand. This template comes equipped with innovative graphics, diverse icons, and dedicated spaces for images, making your data presentation a smooth, navigable experience.


8 diapositivas
Geometric Design Elements Presentation
The "Geometric Design Elements" presentation template features a modern layout utilizing geometric shapes to organize and present data effectively. Each slide provides a unique configuration of circles or connected shapes, facilitating clear visualization of interconnected topics or categories. These design elements are ideal for displaying business insights, relationships between concepts, or summarizing key points in a visually appealing and easily digestible format. The use of varied colors helps to distinguish between different sections or ideas, enhancing the viewer's ability to follow and absorb the presented information efficiently. This template is suitable for business presentations that require a balance of aesthetic appeal and functional design to communicate complex information clearly.


21 diapositivas
Terraflare Project Status Report Presentation
Keep stakeholders updated with this comprehensive project status report template, featuring agenda, key highlights, performance metrics, project progress, risk assessments, and goals. Easily track progress, strategic initiatives, and team productivity. Perfect for PowerPoint, Keynote, and Google Slides, ensuring clear communication of project updates and priorities.


4 diapositivas
Onboarding 30-60-90 Roadmap Presentation
Simplify your onboarding strategy with the Onboarding 30–60–90 Roadmap Presentation. This clean, visual layout breaks down employee integration into three distinct timeframes—30, 60, and 90 days—each with space for goals, tasks, or milestones. Perfect for HR teams, managers, and trainers. Fully editable in Canva, PowerPoint, Keynote, and Google Slides.


7 diapositivas
Empathy Map Infographic Presentation Template
An Empathy Map is a collaborative tool organizations can use to gain a deeper insight into their customers. Similar to a user persona, an empathy map can represent a group of users, such as a customer segment. An empathy map helps to map what a design team knows about the potential audience. Use this template to gain a deeper understanding of your target audience. This template comes with many empathy maps you can use to discover how to empathize with your customers. The empathy maps available in this template are designed to give you an avenue into the mind of your target audience.


7 diapositivas
Value Chain Business Infographic
The value chain is a concept used in business management to describe the full range of activities that businesses go through to bring a product or service from conception to delivery to customers. This infographic template is designed to showcase the various activities and processes that add value to your product or service, enlightening your audience about the holistic journey from start to finish. Compatible with Powerpoint, Keynote, and Google Slides. Present a visual representation of a value chain analysis, emphasizing the importance of evaluating each activity's contribution to the overall value.