


Características


¿Tienes alguna pregunta?
Recomendar


5 diapositivas
Historical Event Timeline Overview Presentation
Bring history to life with the Historical Event Timeline Overview Presentation. This visually engaging slide is perfect for educators, researchers, or historians looking to showcase five key milestones in chronological order. Fully editable in Canva, PowerPoint, Keynote, and Google Slides—making it easy to adapt for any historical topic.


5 diapositivas
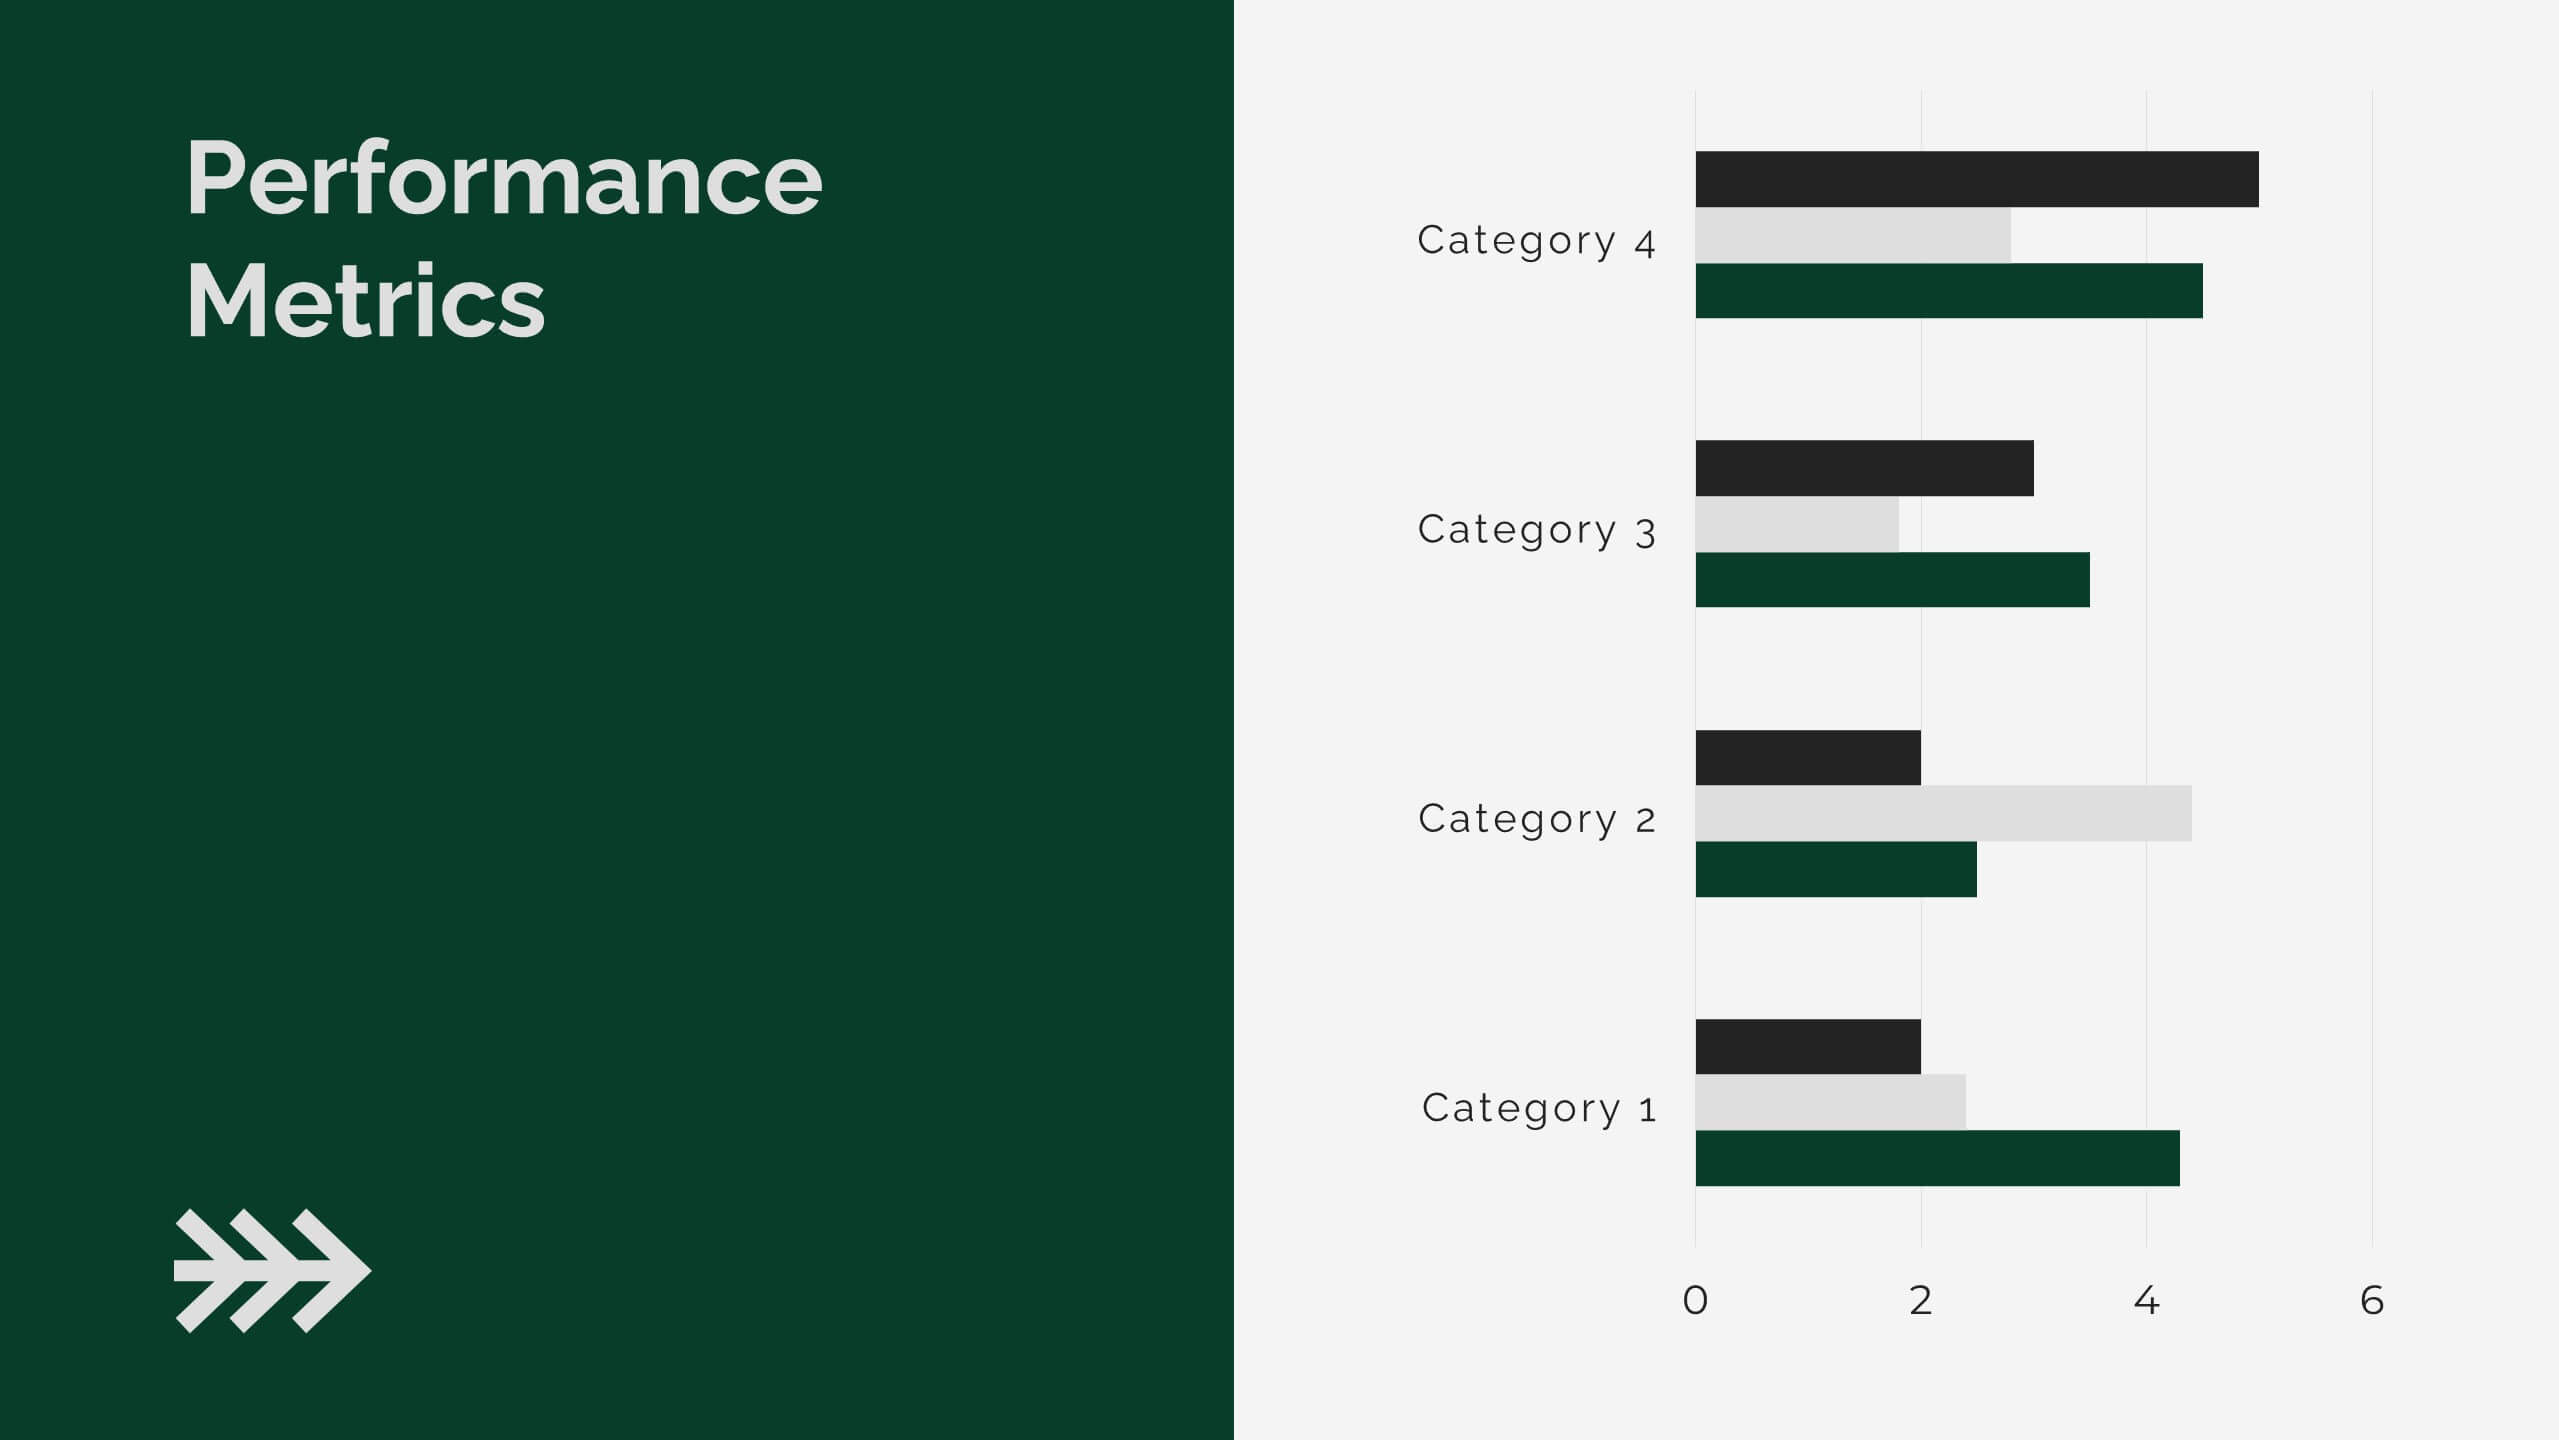
IT Service Operations Strategy Presentation
Streamline your IT presentations with the IT Service Operations Strategy Presentation template. This structured layout is designed to showcase key service operation metrics, strategies, and performance indicators in a visually engaging format. Ideal for IT teams, service managers, and business analysts, this slide helps simplify complex IT processes with clear data points and percentages. Fully customizable in PowerPoint, Keynote, and Google Slides for effortless adaptation to your needs.


8 diapositivas
Large-Scale Data Processing Tools Presentation
Simplify the complexity of data processing with this sleek and modern template for mapping large-scale tools and systems. Ideal for tech teams, data analysts, and IT professionals, this slide helps you explain how data flows through cloud-based infrastructures. Fully customizable and compatible with PowerPoint, Keynote, and Google Slides.


26 diapositivas
Remote Work Best Practices Creative Presentation
Navigate the world of telecommuting with our Remote Work Best Practices presentation template, available for Powerpoint, Google Slides, and Keynote. This template is specially designed for the modern remote work environment, incorporating a blend of professional and engaging visuals that reflect the flexibility and innovation of working from home. The template features customizable slides for outlining communication tools, scheduling, and mental health tips. Whether you're onboarding new staff or refining your company's remote policies, this template will help you present a comprehensive guide to succeeding in the remote work landscape.


6 diapositivas
Eco-Initiatives and Sustainability Efforts Presentation
Highlight your green strategy with the Eco-Initiatives and Sustainability Efforts Presentation. This template features a clean, icon-based layout to showcase up to six key eco-friendly actions or goals. Ideal for CSR reports, environmental planning, or internal sustainability updates. Fully editable in PowerPoint, Google Slides, and Canva.


7 diapositivas
Editable List Slide Presentation
Organize your ideas with style and simplicity using this clean, structured layout designed for clarity and impact. Ideal for summarizing key points, checklists, or action plans, it keeps your content professional and easy to follow. Fully customizable and compatible with PowerPoint, Keynote, and Google Slides for seamless presentation design.


4 diapositivas
Corporate Governance Structure Presentation
Build transparency and leadership clarity with this clean, layered presentation layout that visualizes company hierarchies and decision-making systems. Ideal for explaining organizational roles, responsibilities, and reporting flows, it simplifies complex structures into easy visuals. Fully editable and compatible with PowerPoint, Keynote, and Google Slides for professional, flexible use.

23 diapositivas
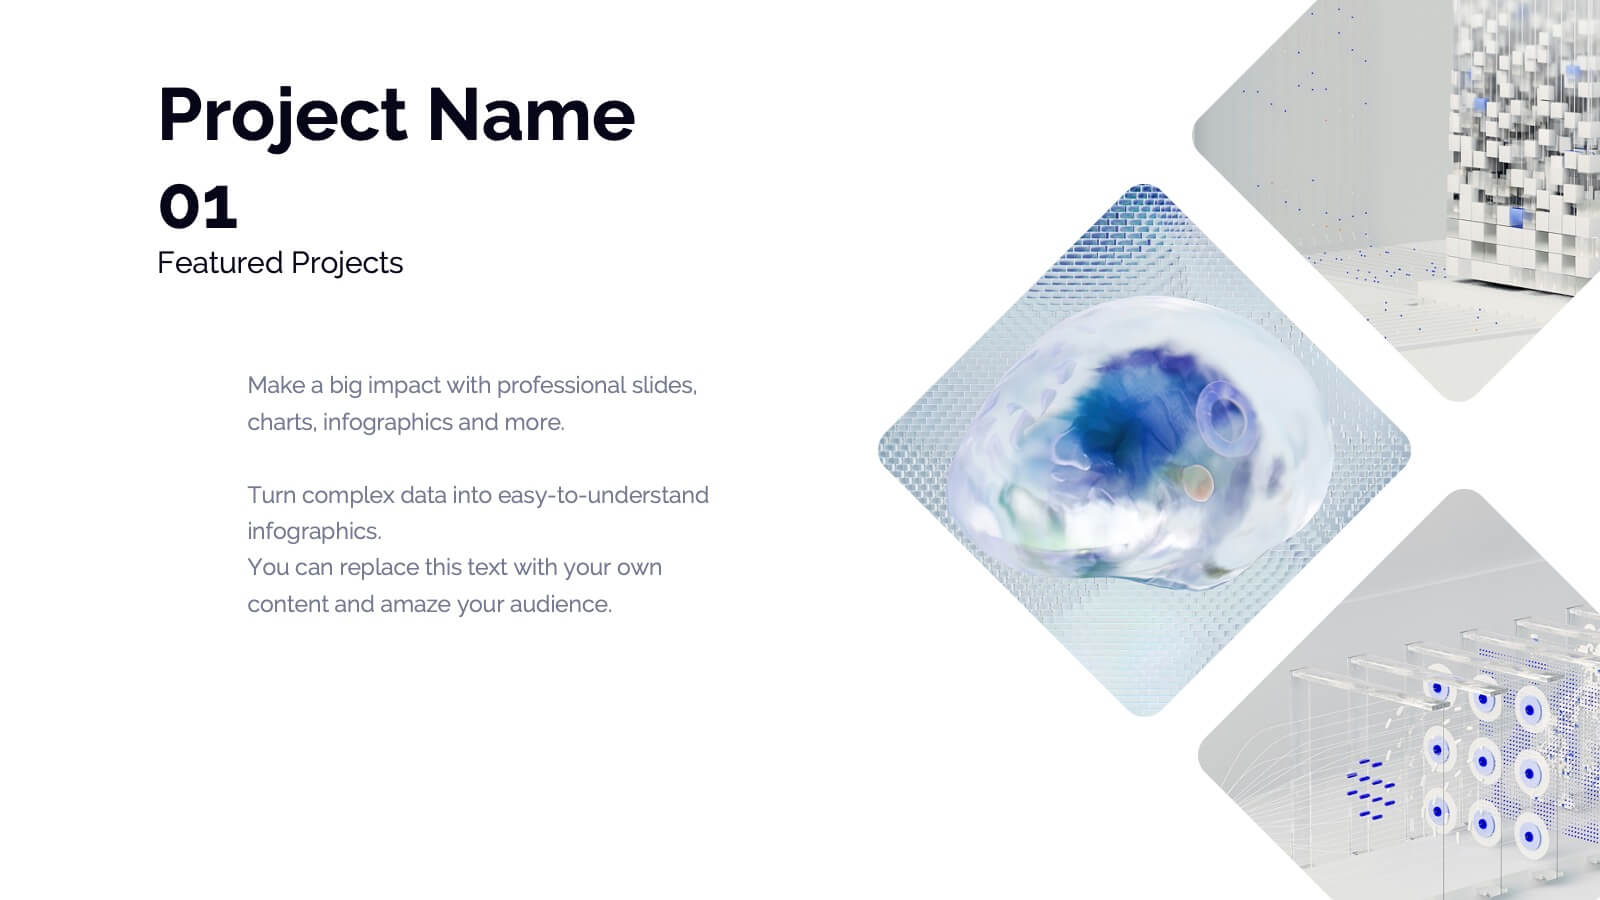
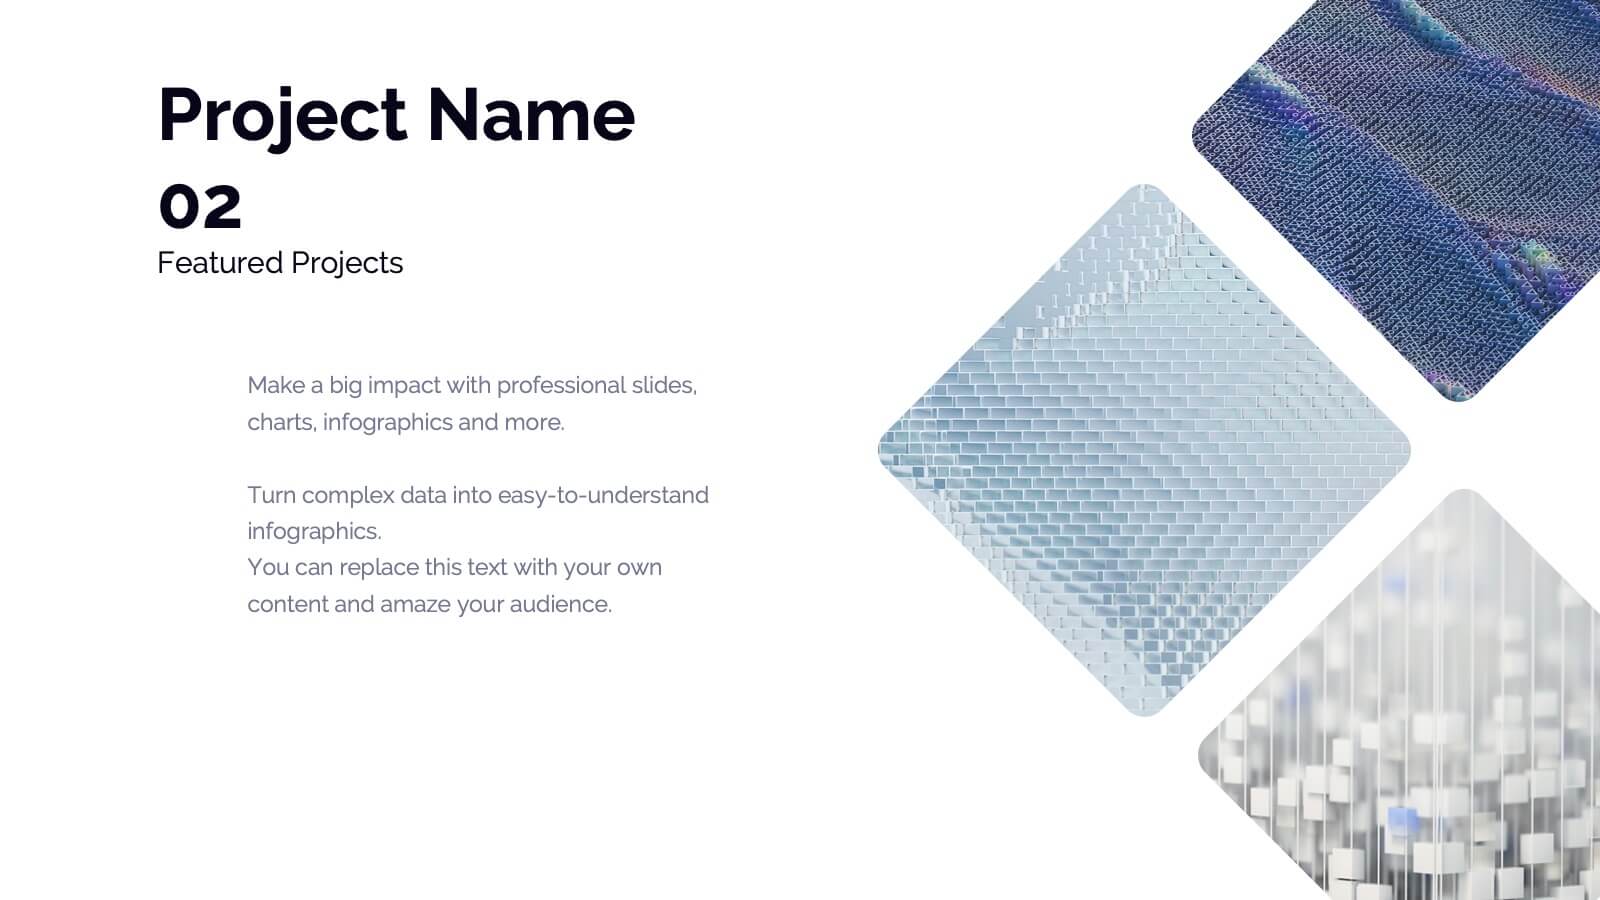
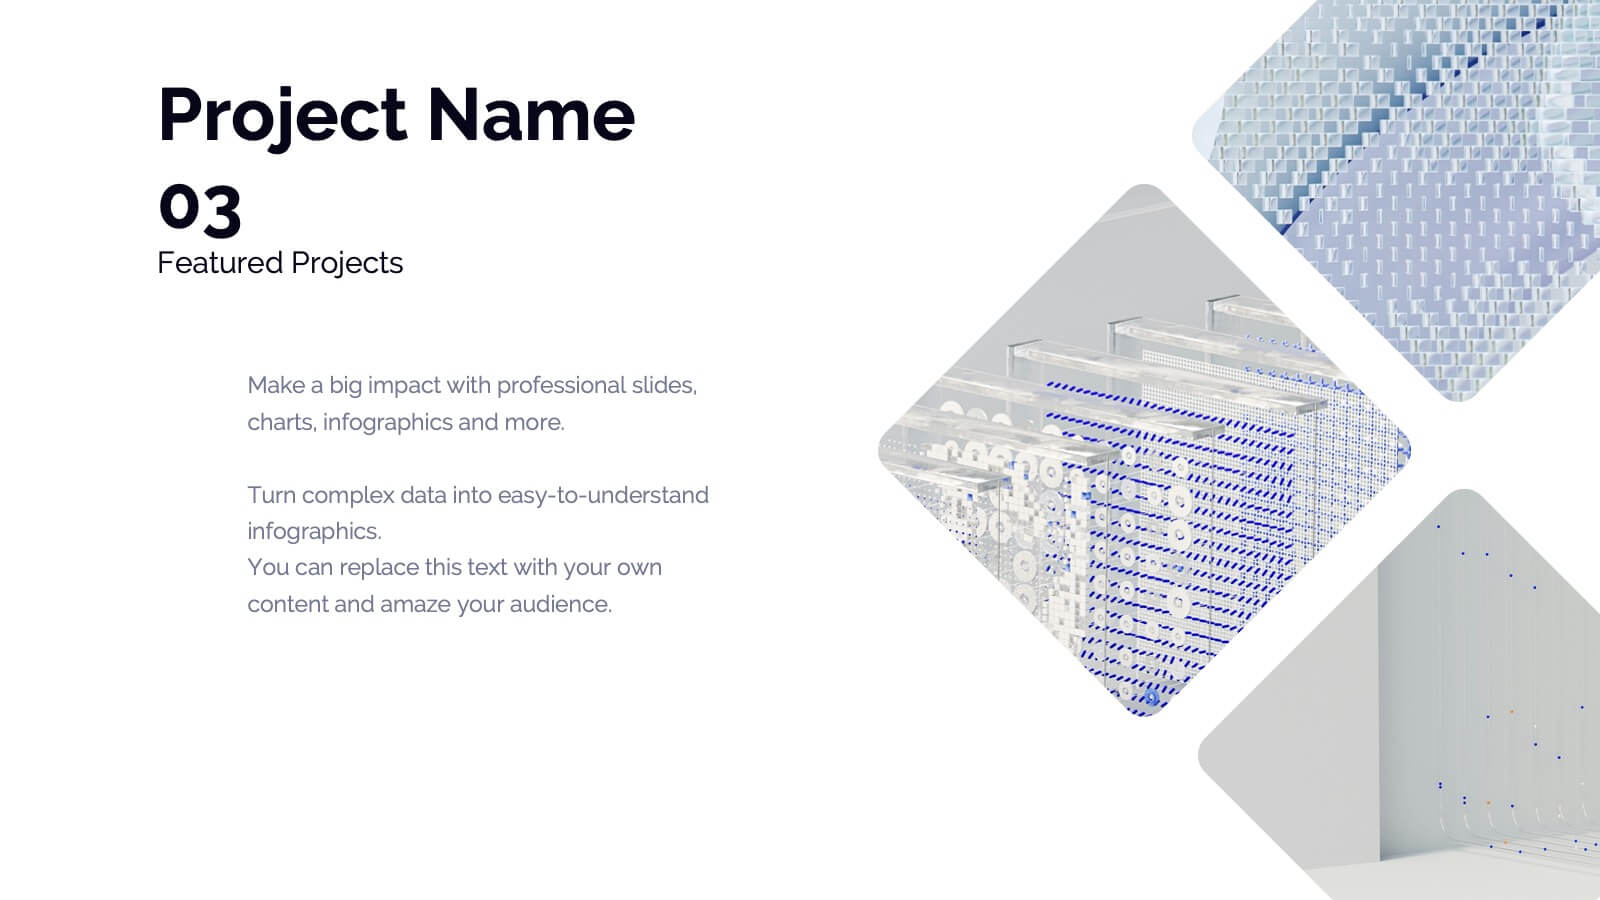
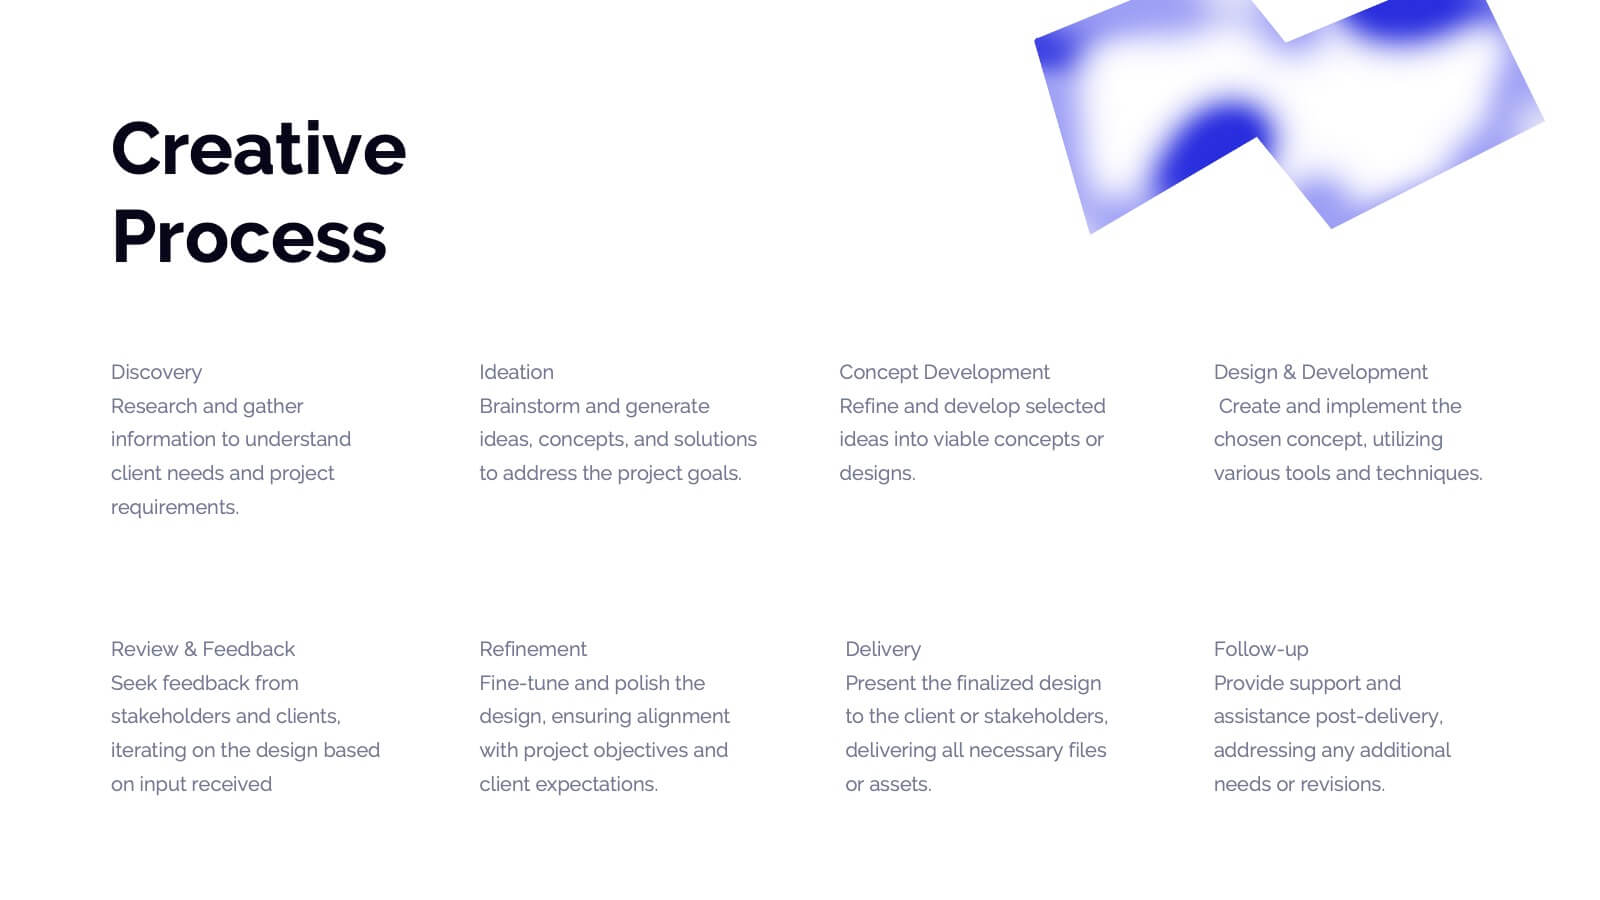
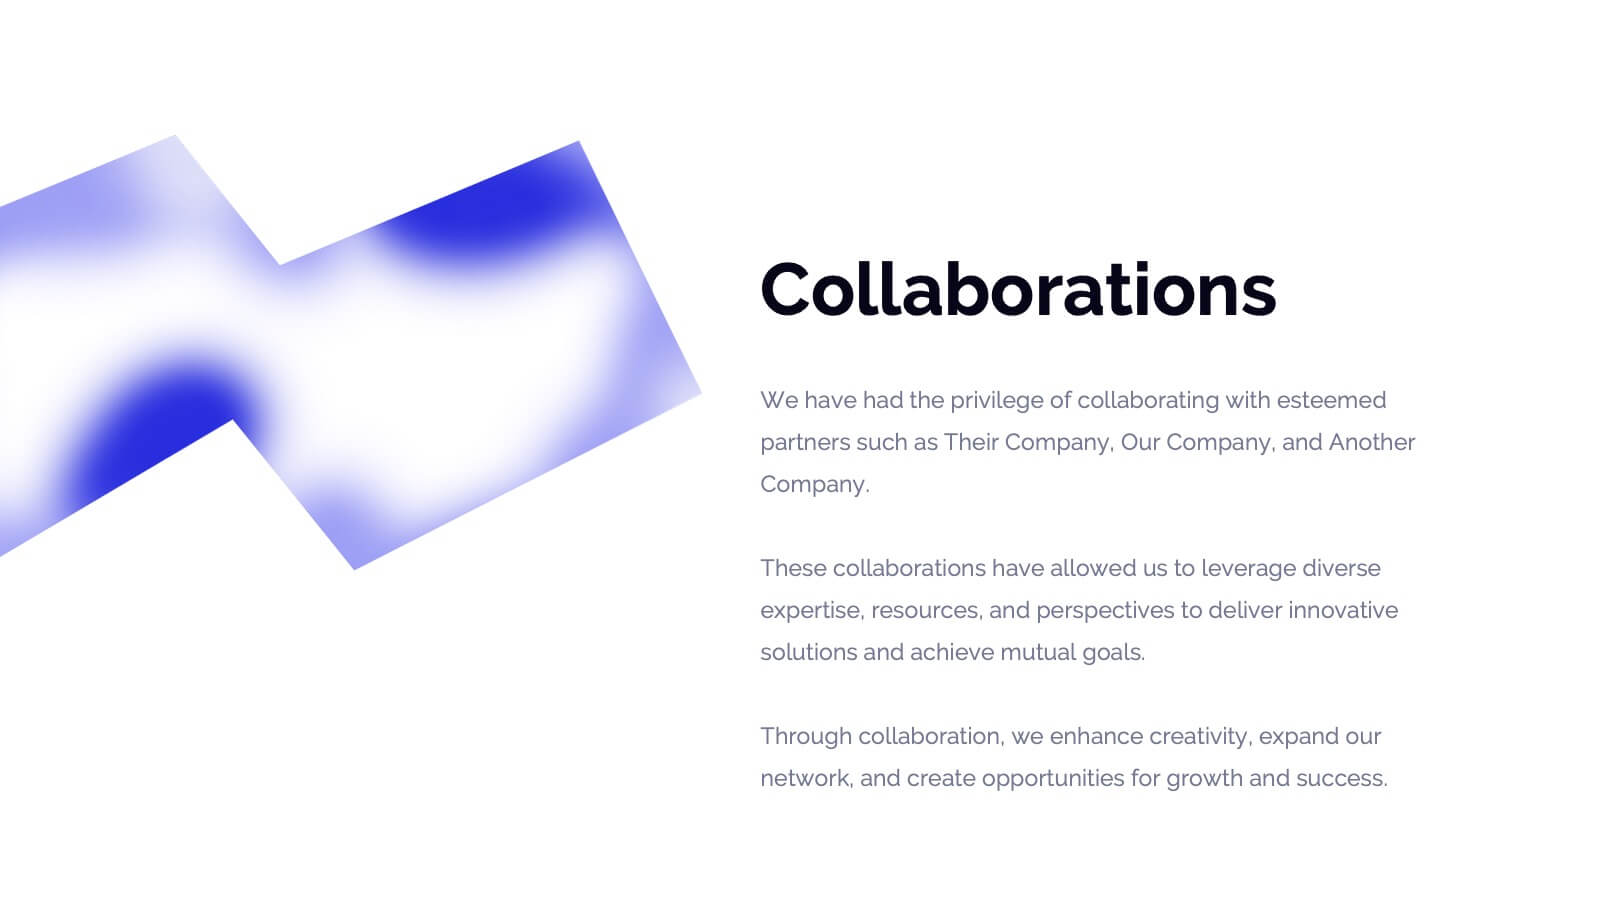
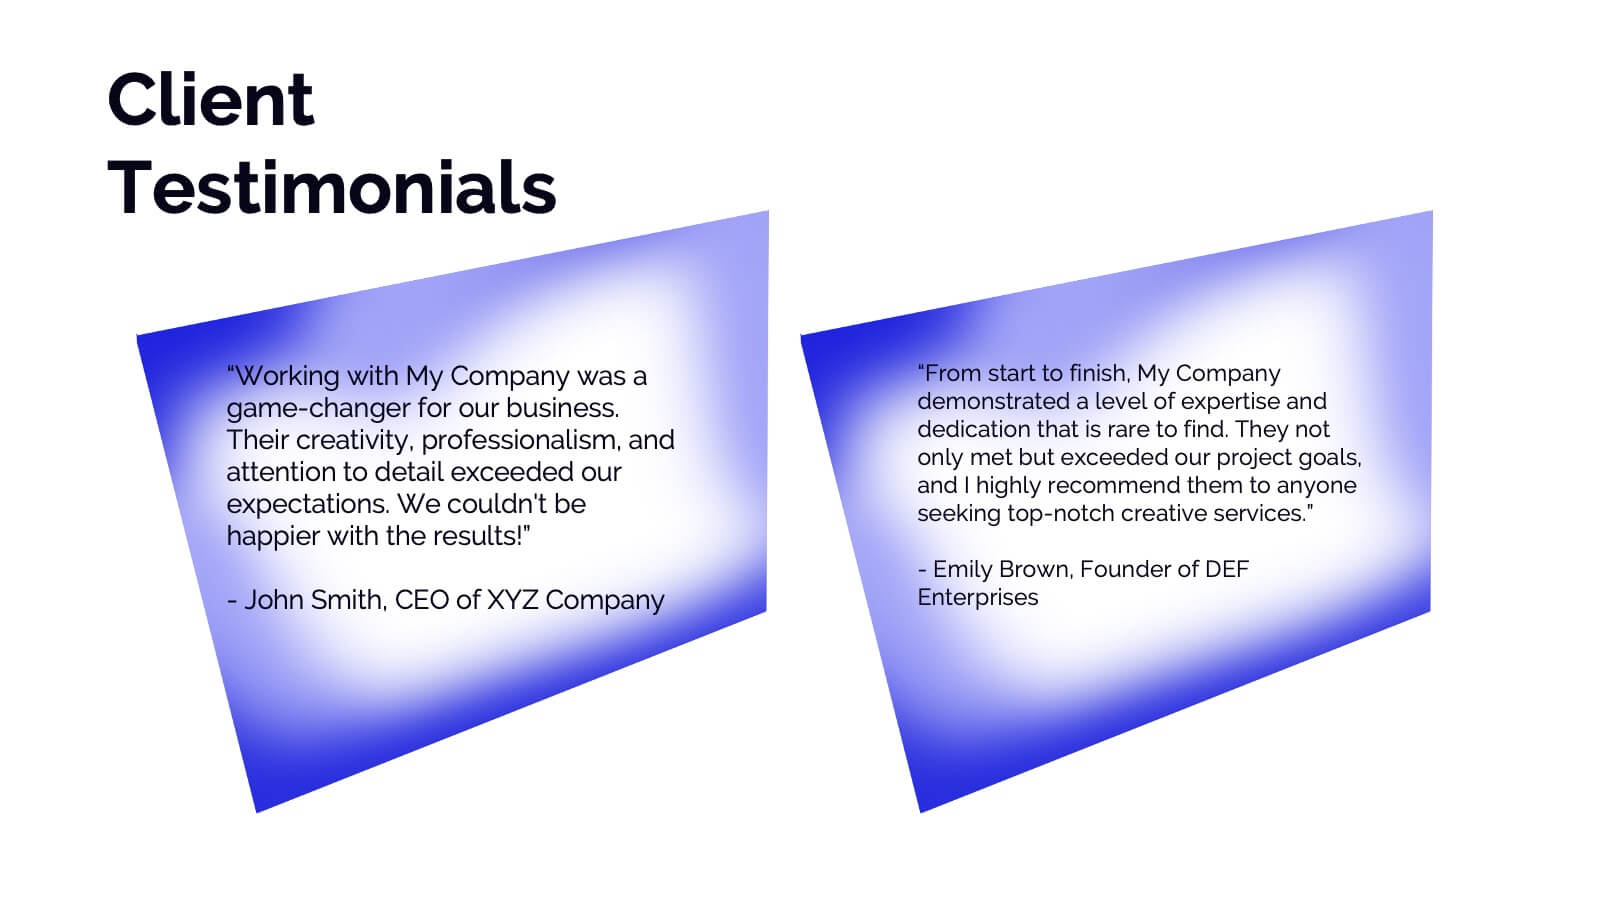
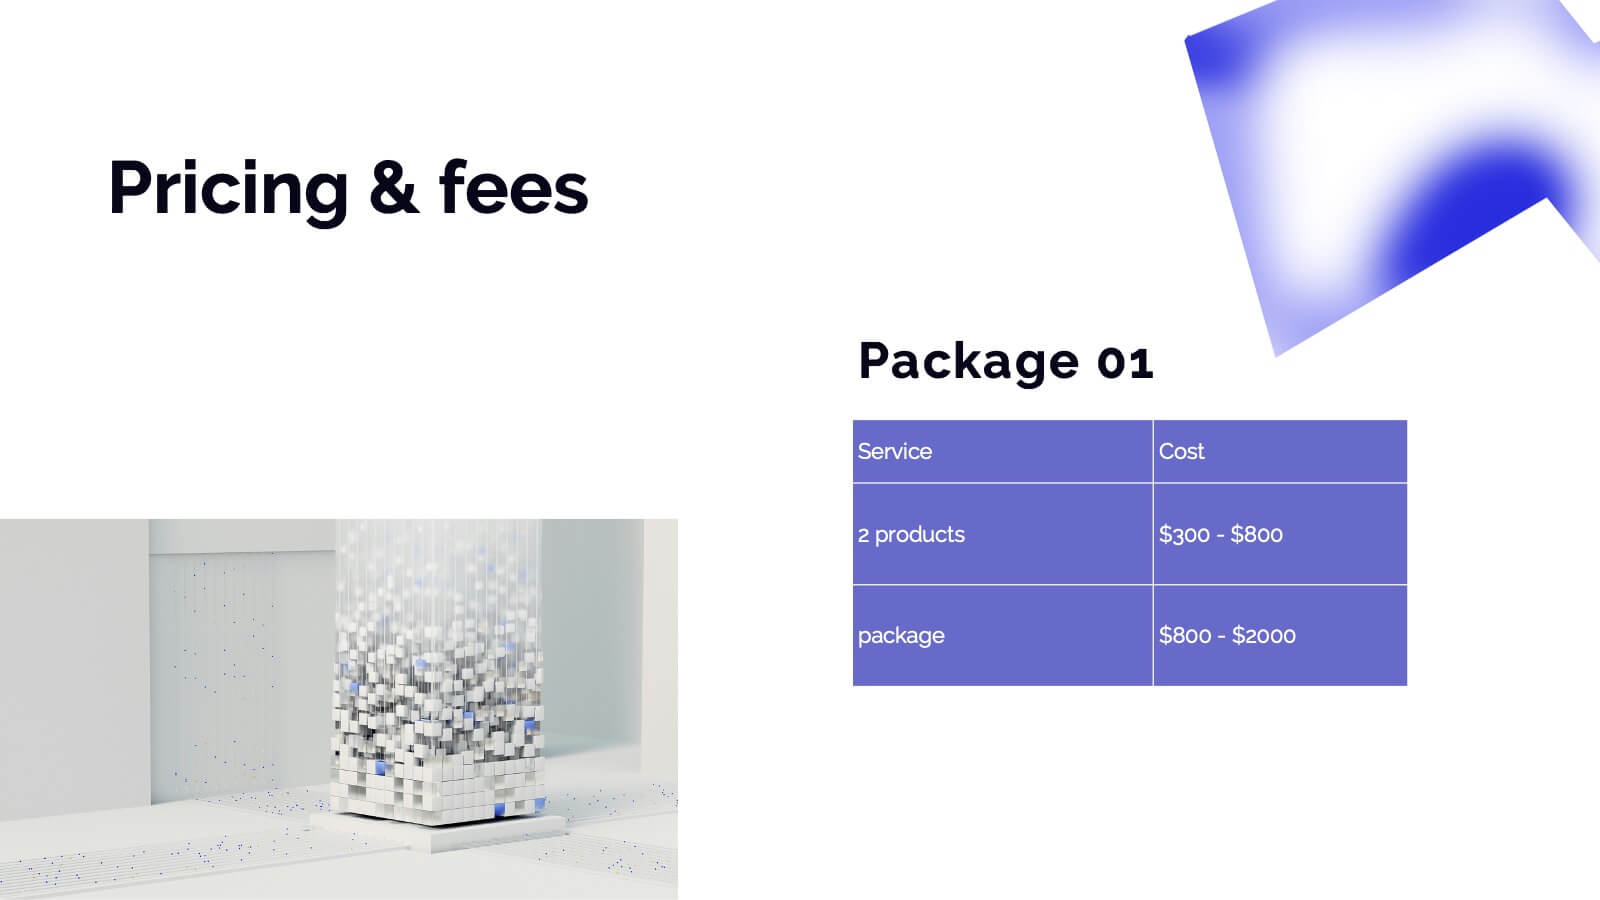
Dryad Photography Portfolio Template Presentation
Showcase your photography skills with this elegant and professional portfolio presentation template! Perfect for highlighting your projects, style, and creative process, this template covers everything from client testimonials to pricing and services offered. It’s ideal for photographers wanting to present their work with style and clarity. Compatible with PowerPoint, Keynote, and Google Slides for effortless sharing and presentations.


4 diapositivas
Professional Team Profiles and Roles Presentation
Showcase your team with impact using the Professional Team Profiles and Roles Presentation. Ideal for company introductions, this slide highlights key members with photo, name, title, and a brief role description. Clean, modern layout makes it easy to customize in PowerPoint, Canva, or Google Slides to match your brand.


6 diapositivas
Customer Needs and Segmentation Profile Presentation
Pinpoint what truly drives your audience with the Customer Needs and Segmentation Profile Presentation. This template helps you clearly map customer motivations, preferences, and pain points through segmented icons and visuals. Ideal for marketers and business analysts. Fully editable in Canva, PowerPoint, or Google Slides for easy customization.


4 diapositivas
Business Role Structure Diagram Presentation
Bring your team structure to life with a clear, engaging visual that makes every role instantly understandable. This presentation helps you map relationships, outline responsibilities, and communicate workflow with ease. Designed for simple customization and professional clarity, it supports PowerPoint, Keynote, and Google Slides for seamless editing across platforms.


4 diapositivas
Target Market Strategy Map Presentation
Bring your strategy to life with a bold visual that makes your target market impossible to miss. This presentation helps you outline customer priorities, growth opportunities, and key competitive insights in a clean, intuitive format that keeps teams aligned and focused. Fully compatible with PowerPoint, Keynote, and Google Slides.


10 diapositivas
Lean Business Model Planning Presentation
Streamline your startup strategy with this Lean Canvas presentation template. Designed for entrepreneurs and agile teams, it breaks down your business plan into 9 essential blocks—from Problem and Solution to Revenue Streams and Cost Structure. Easy to edit in PowerPoint, Keynote, or Google Slides for fast, effective planning and pitch presentations.


3 diapositivas
Short-Term and Long-Term Action Goals Presentation
Plan with purpose using the Short-Term and Long-Term Action Goals Presentation. This clear, side-by-side layout helps you organize initiatives by timeframe—perfect for project planning, strategy roadmaps, or goal tracking. Fully editable in Canva, PowerPoint, and Google Slides for easy customization across teams and presentations.


6 diapositivas
Actionable Steps with Visual Checklist Presentation
Simplify complex processes with the Actionable Steps with Visual Checklist Presentation. This engaging layout uses a curved flow and bold circular icons to represent each step in a clear, logical sequence. Ideal for outlining strategic plans, onboarding procedures, or milestone-driven workflows. With five customizable steps and tick-mark visuals, it's easy to showcase completed and pending tasks. Fully compatible with PowerPoint, Keynote, and Google Slides—great for any team-driven or instructional presentation.


6 diapositivas
Next-Gen Wireless Solutions Overview Presentation
Give your wireless solutions pitch a sleek, professional edge with this futuristic globe-style layout. Perfect for tech-driven topics, this infographic highlights six key areas in a clear, visually engaging format. Fully customizable and easy to use in PowerPoint, Keynote, and Google Slides—ideal for product overviews, innovation briefings, or strategy updates.


26 diapositivas
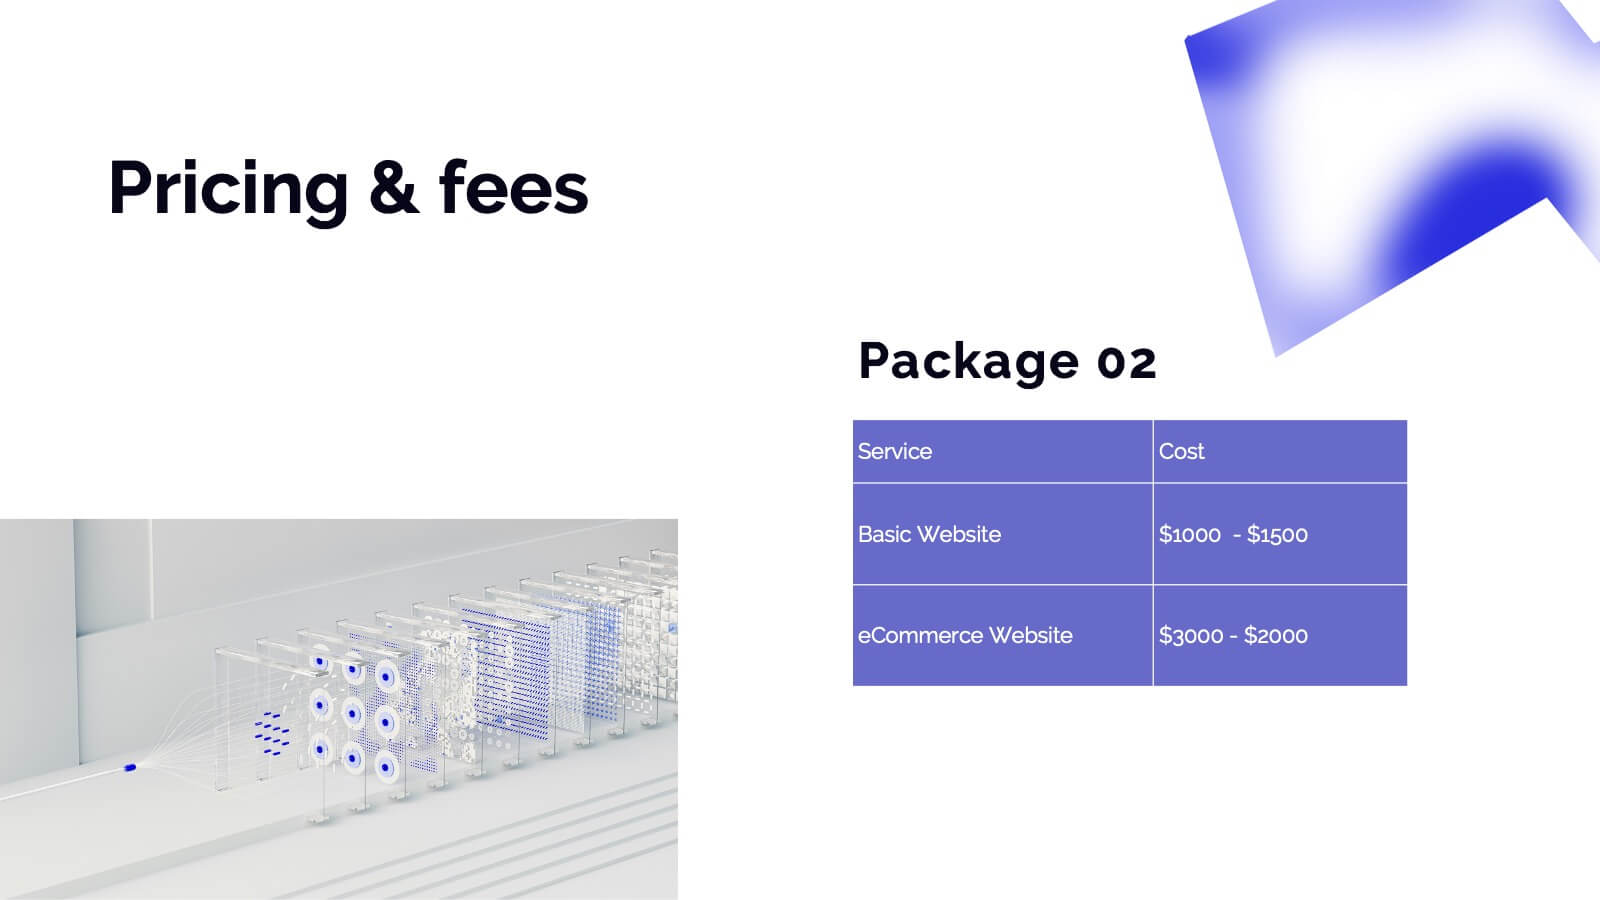
Salus Rebranding Project Plan Presentation
This rebranding project plan template offers a clear framework for presenting brand identity transformation. Covering brand values, identity components, target audience, positioning, and guidelines, it’s ideal for companies refreshing their brand. Compatible with PowerPoint, Keynote, and Google Slides, it ensures a streamlined, professional presentation of your rebranding strategy.