


Características


¿Tienes alguna pregunta?
Recomendar


4 diapositivas
Wheel of Progress Planning Tool Presentation
Visualize goals, track development stages, or outline key initiatives with the Wheel of Progress Planning Tool Presentation. This dynamic circular design divides progress into four customizable quadrants (A–D), perfect for strategic planning, KPI tracking, or team milestone updates. Each segment features editable labels and supporting descriptions. Ideal for PowerPoint, Keynote, and Google Slides.


6 diapositivas
Communication Plan Infographic
A communication plan is a strategic document that outlines how an organization or project team intends to communicate with various stakeholders. This infographic template is designed with a structured approach to deliver consistent and effective messages to ensure that all viewers are informed, engaged, and aligned. This template outlines the strategies and tactics for effectively conveying information within an organization or to a target audience. Compatible with Powerpoint, Keynote, and Google Slides. This serves as a quick reference guide for effective communication strategies and help your audience understand the key elements of your plan.


6 diapositivas
Environmental Policy and Sustainability Plan Presentation
Bring your sustainability message to life with a visual that flows as smoothly as your plan. This infographic presentation template helps explain your environmental goals, action steps, and policy structure using a dynamic, easy-to-follow circular layout. Perfect for eco reports and green strategy briefs. Compatible with PowerPoint, Keynote, and Google Slides.


4 diapositivas
Customer Persona Slide Presentation
Bring your audience closer to your ideal customer with this clean, visual layout designed for clarity and storytelling. Perfect for marketing, branding, and strategy presentations, it helps you highlight key traits, motivations, and insights with ease. Fully compatible with PowerPoint, Keynote, and Google Slides for effortless customization.


4 diapositivas
Operational Flow Mapping and Control Presentation
Streamline complex processes with the Operational Flow Mapping and Control Presentation. This template uses a clear, hierarchical layout to visualize workflows, decision points, and operational branches. Ideal for SOPs, business systems, or process improvement plans. Fully editable in Canva, PowerPoint, and Google Slides to fit any project or team need.


5 diapositivas
Business Project Status Review Presentation
Present your team's progress with clarity using this hexagon-icon based project review layout. Designed for status updates, this slide includes four visually distinct sections with toggle-style indicators for highlighting progress, milestones, or tasks. Ideal for project managers, corporate teams, or consultants. Fully editable in PowerPoint, Keynote, and Google Slides.


23 diapositivas
Volt Business Plan Presentation
The Business Plan Presentation Template offers 23 refined slides to convey goals, strategies, achievements, and action plans. Perfect for team updates, resource allocation, and collaboration opportunities. Designed for PowerPoint, Keynote, and Google Slides, its warm, professional layout ensures clarity while fostering effective communication for corporate or project presentations. Fully customizable.


4 diapositivas
Task Delegation via RACI Model
Simplify task delegation and boost accountability with this clean RACI-based layout—perfect for clarifying roles and responsibilities across teams. Whether you're planning a project or tracking execution, this slide makes it easy to map who’s in charge, consulted, or informed. Fully compatible with PowerPoint, Keynote, and Google Slides.


20 diapositivas
Astralisque Sales Proposal Presentation
This Sales Proposal Presentation is designed to help businesses outline their sales strategies with a bold and dynamic style. Covering key elements such as competitive analysis, objectives, pricing strategy, and sales performance metrics, it ensures a professional look. Fully customizable and compatible with PowerPoint, Keynote, and Google Slides.


7 diapositivas
Objective Reasoning Infographic
Objective reasoning is pivotal in making informed decisions, and its importance cannot be overstated in today's fast-paced world. Our objective reasoning infographic, illuminated with shades of green, blue, and yellow, serves as a visual guide for systematically breaking down complex issues. Tailored for educators, business professionals, and decision-makers, this template outlines the core components and steps of objective reasoning. Its compatibility with PowerPoint, Keynote, and Google Slides ensures a seamless integration into your presentations, empowering your audience with a clear understanding of reasoned decision-making.


5 diapositivas
4-Stage Gap Identification Presentation
A clear, engaging way to map progression, this presentation helps you illustrate each stage of identifying business gaps with structure and clarity. It guides audiences through challenges, priorities, and opportunities in a simple step-by-step flow that’s easy to follow and present. Fully compatible with PowerPoint, Keynote, and Google Slides.


4 diapositivas
Project Brainstorming Mind Map Layout Presentation
Spark creativity with this Project Brainstorming Mind Map Layout presentation. Featuring a bold lightbulb centerpiece, this layout visually organizes four idea clusters around key project themes. Ideal for creative teams, planning sessions, or innovation workshops. Fully editable in Canva, PowerPoint, and Google Slides for easy personalization and professional impact.


14 diapositivas
Business Expense and Cost Control Presentation
Optimize your financial strategy with the Business Expense and Cost Control Presentation template. This slide helps visualize cost management, spending efficiency, and budgeting strategies with a clear, data-driven layout. Ideal for financial planners, business analysts, and executives aiming to streamline operational expenses. Fully customizable in PowerPoint, Keynote, and Google Slides.

22 diapositivas
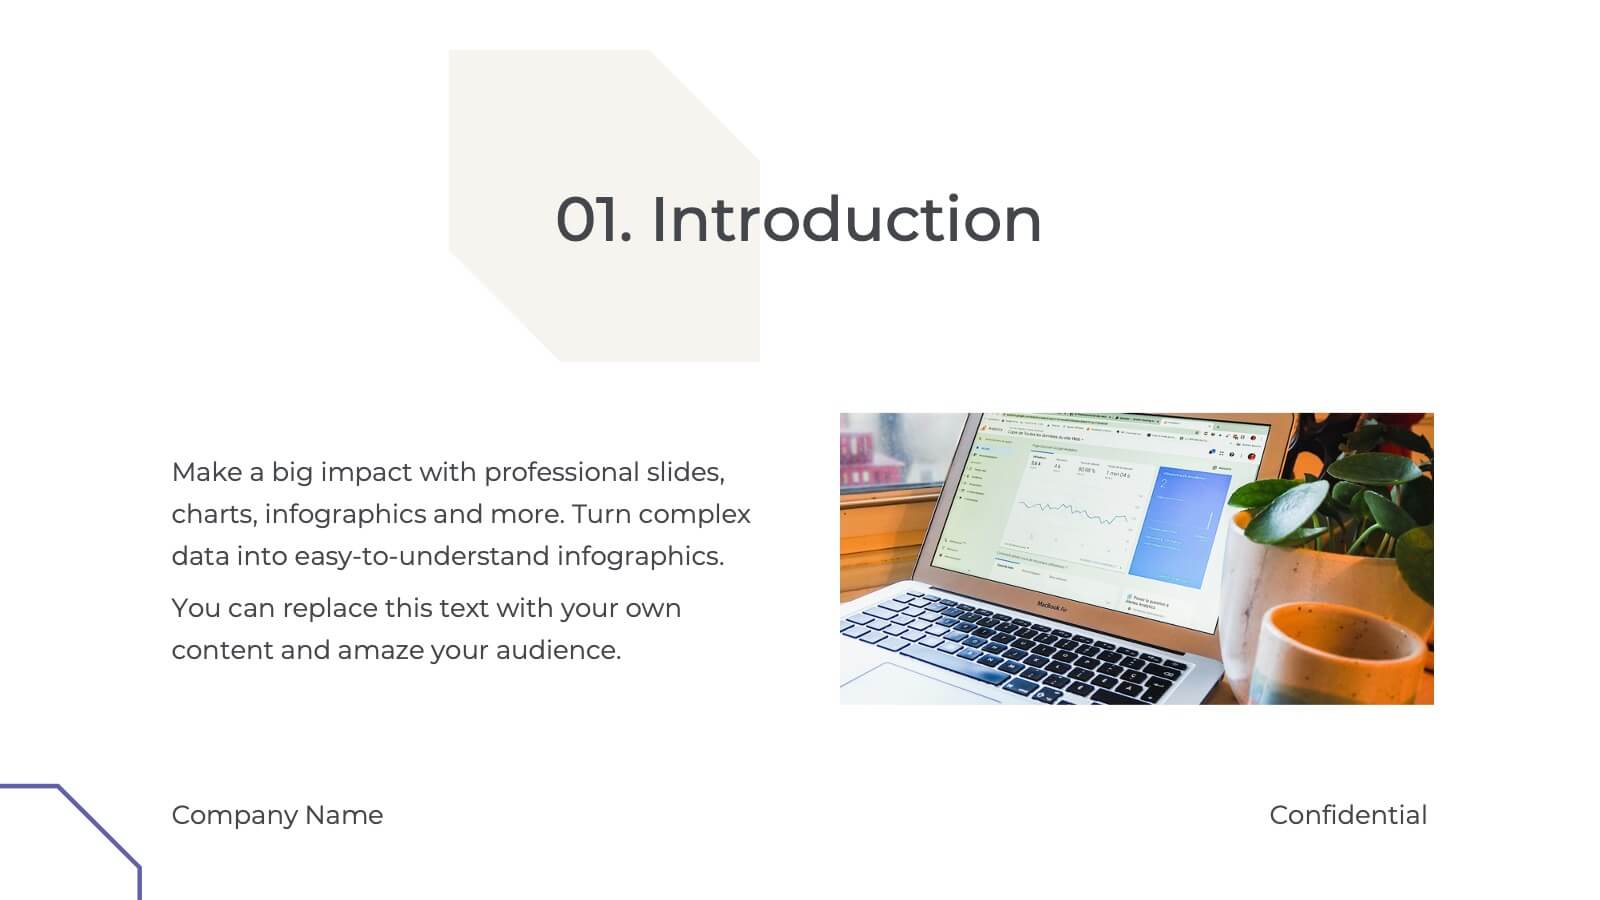
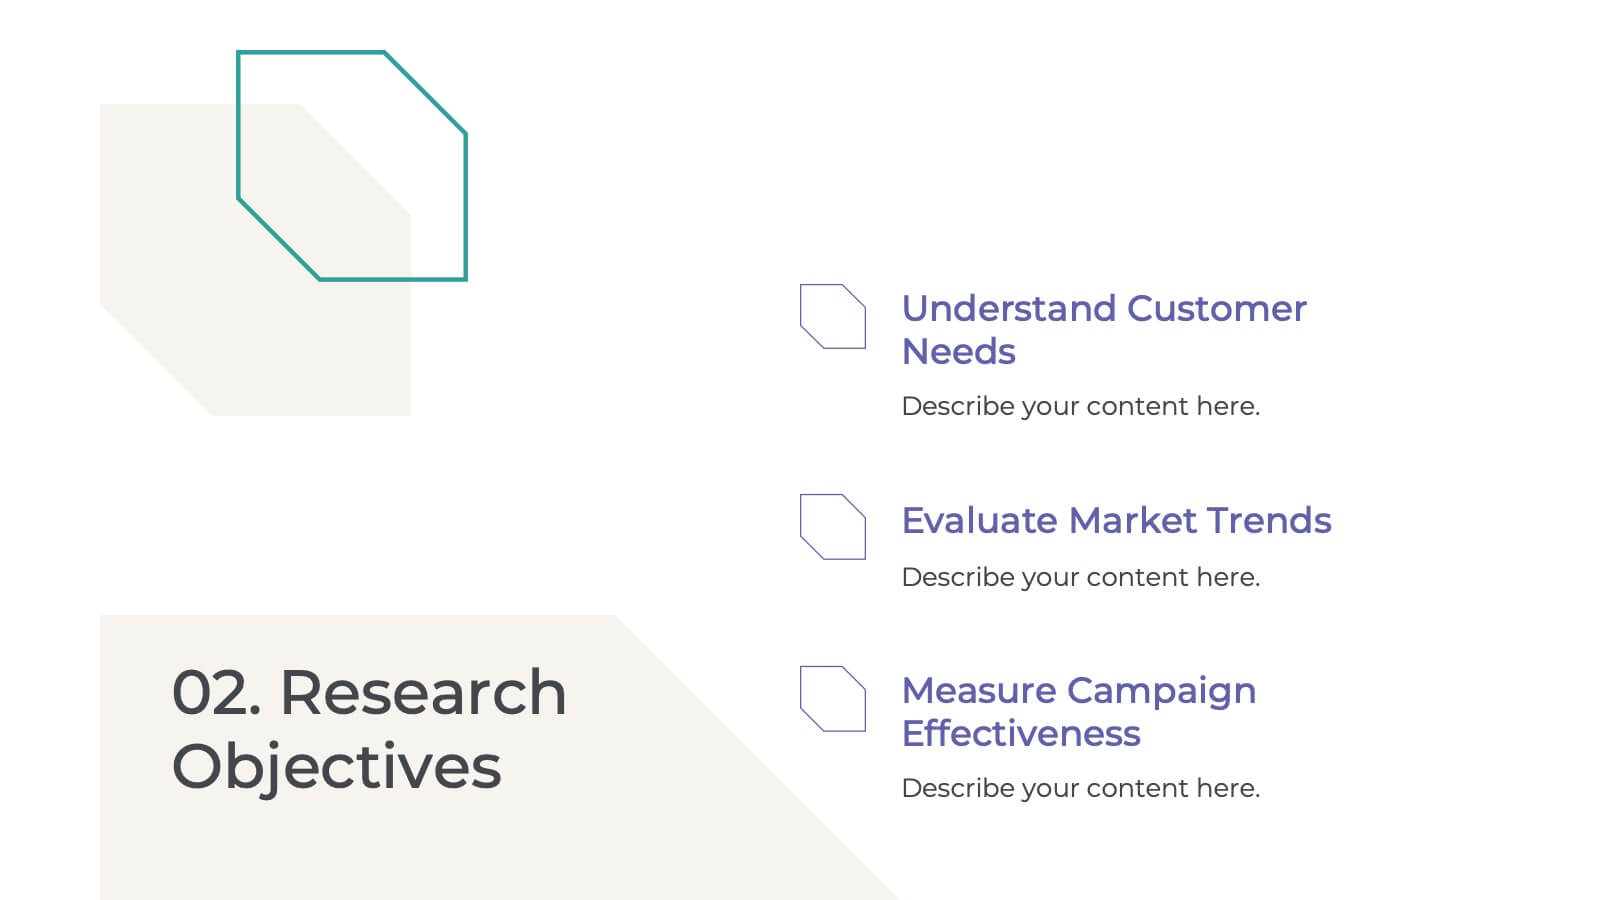
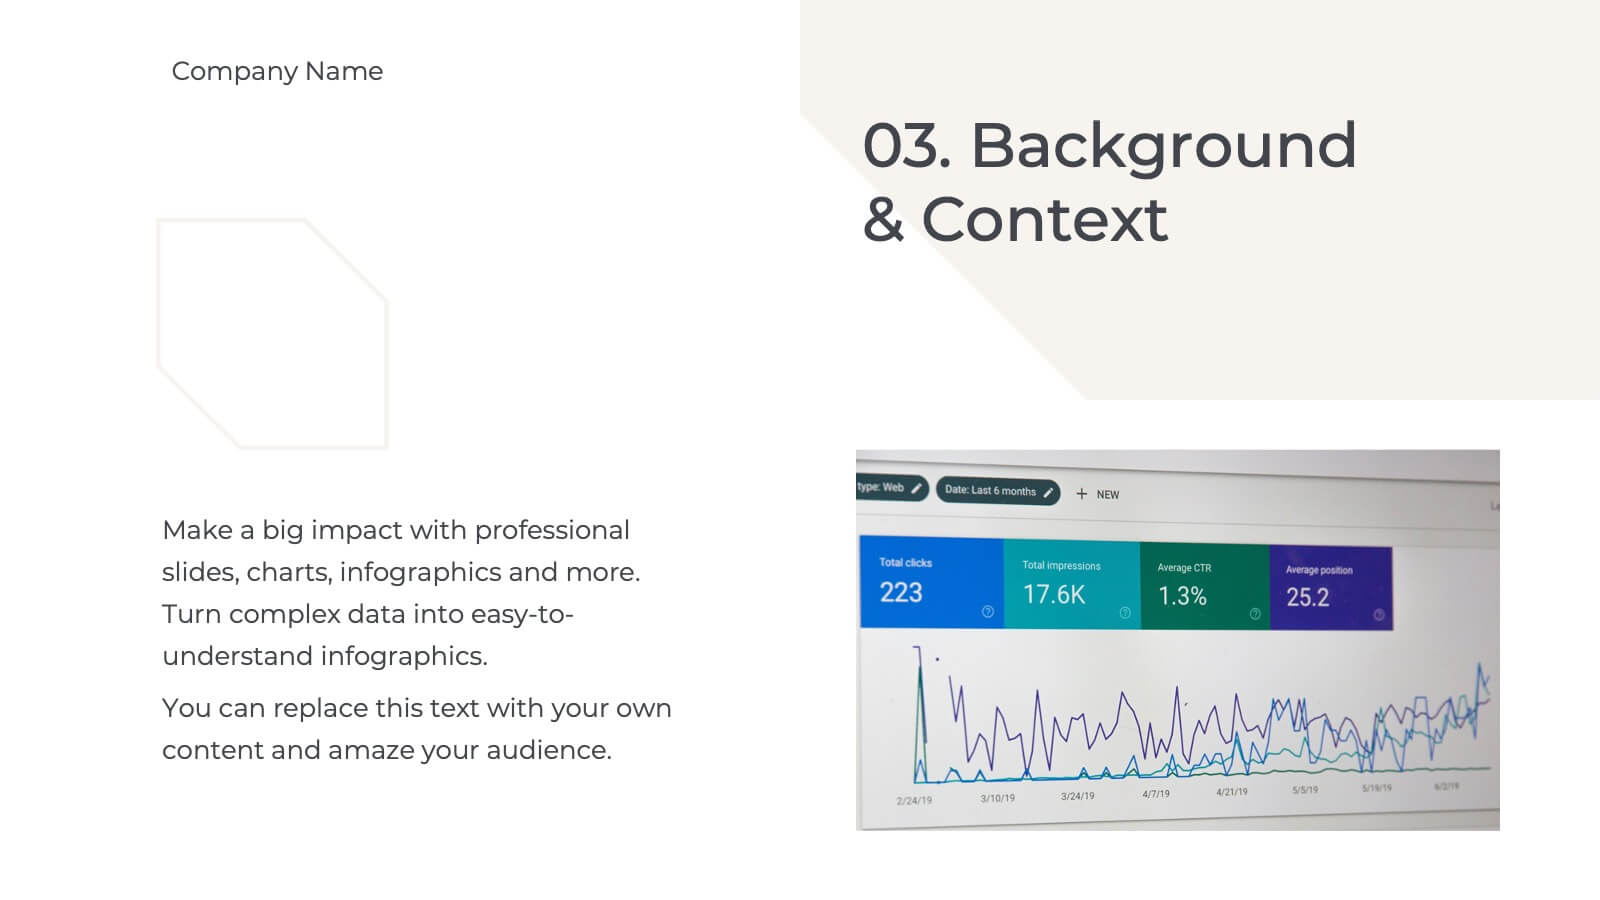
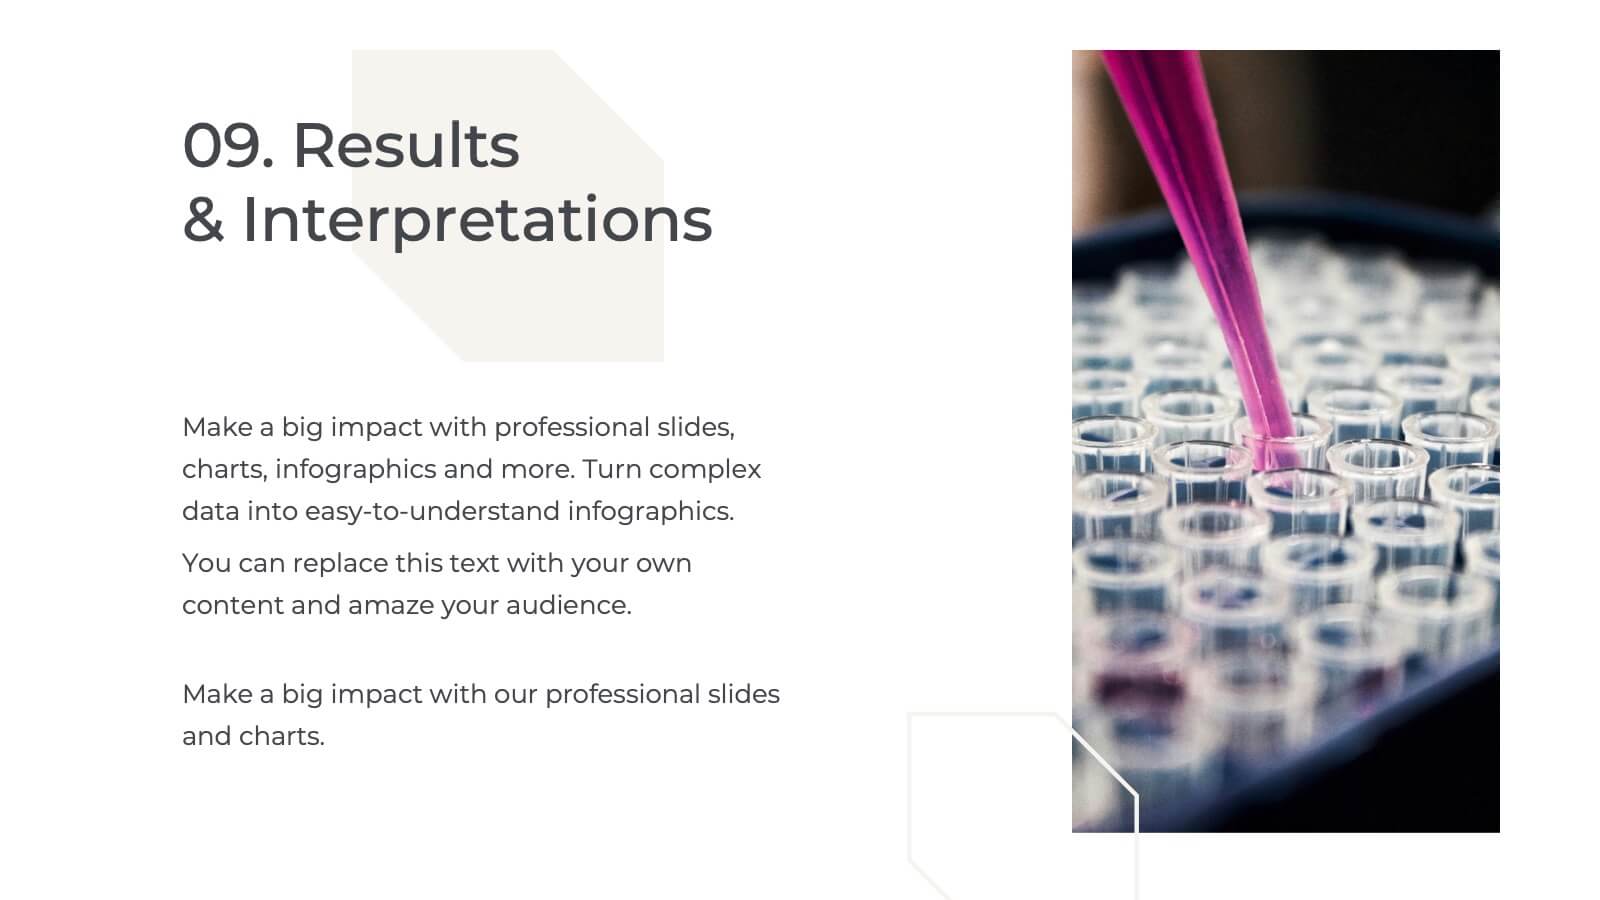
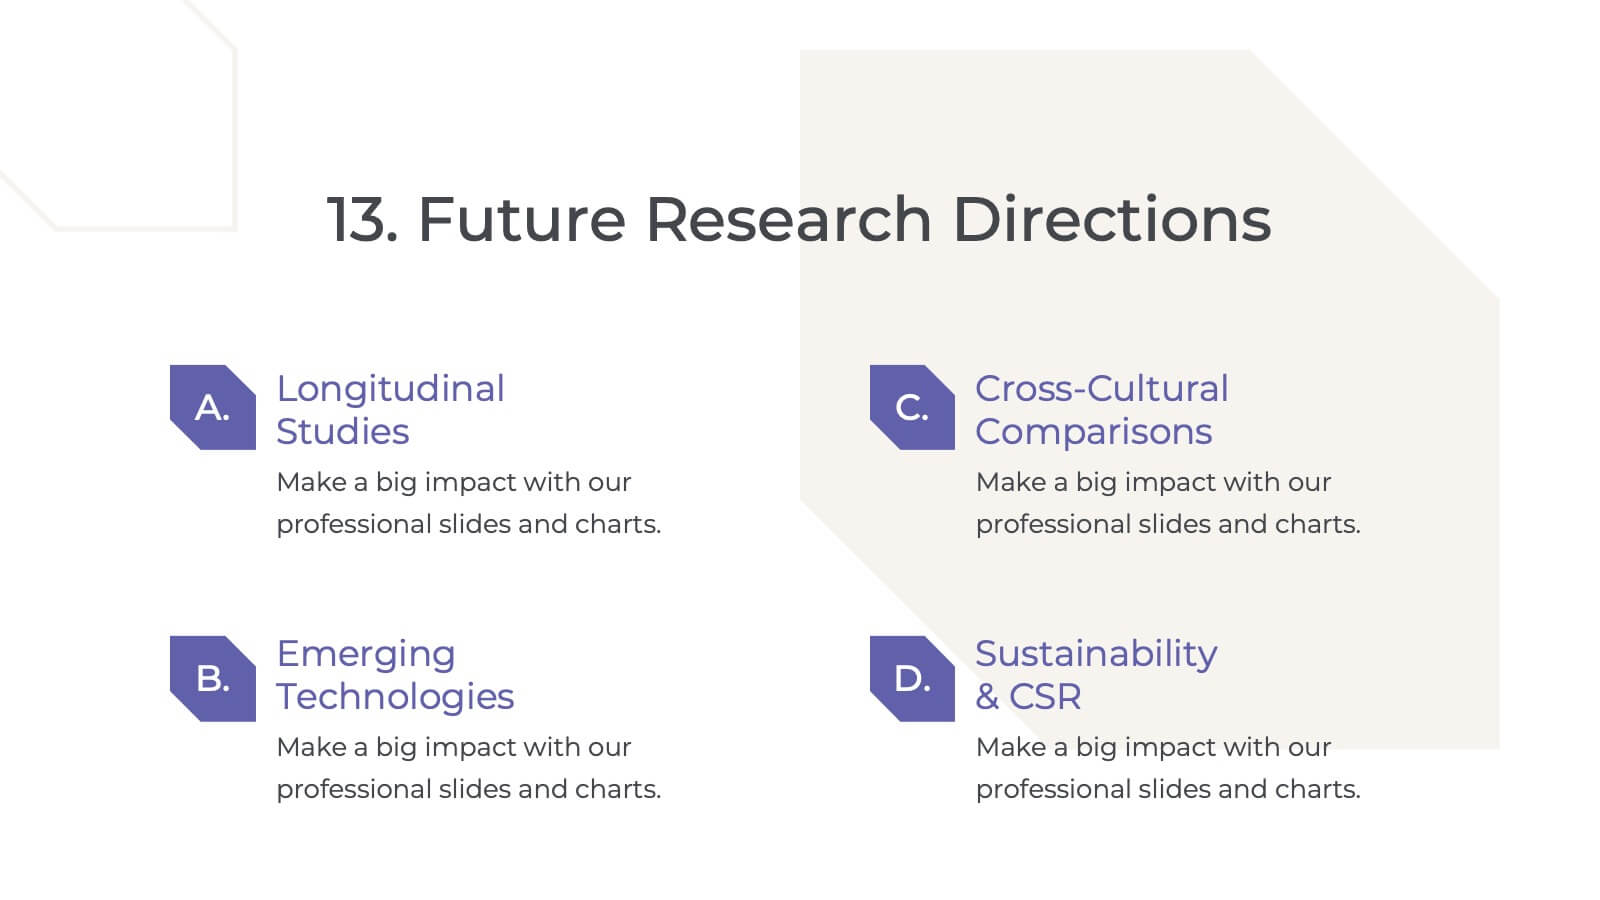
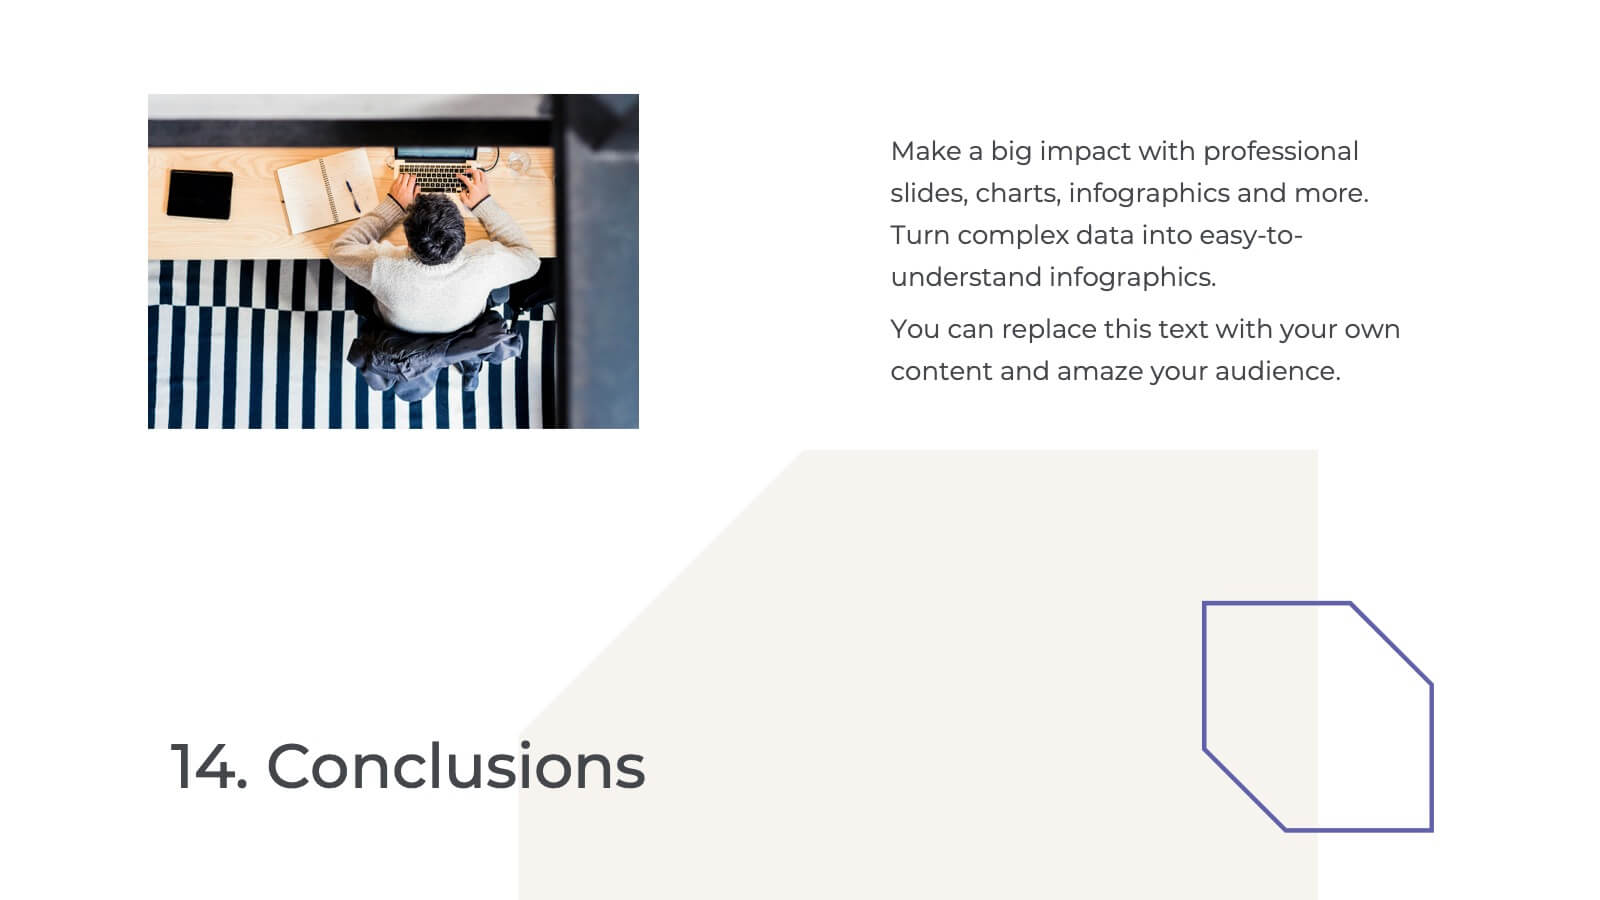
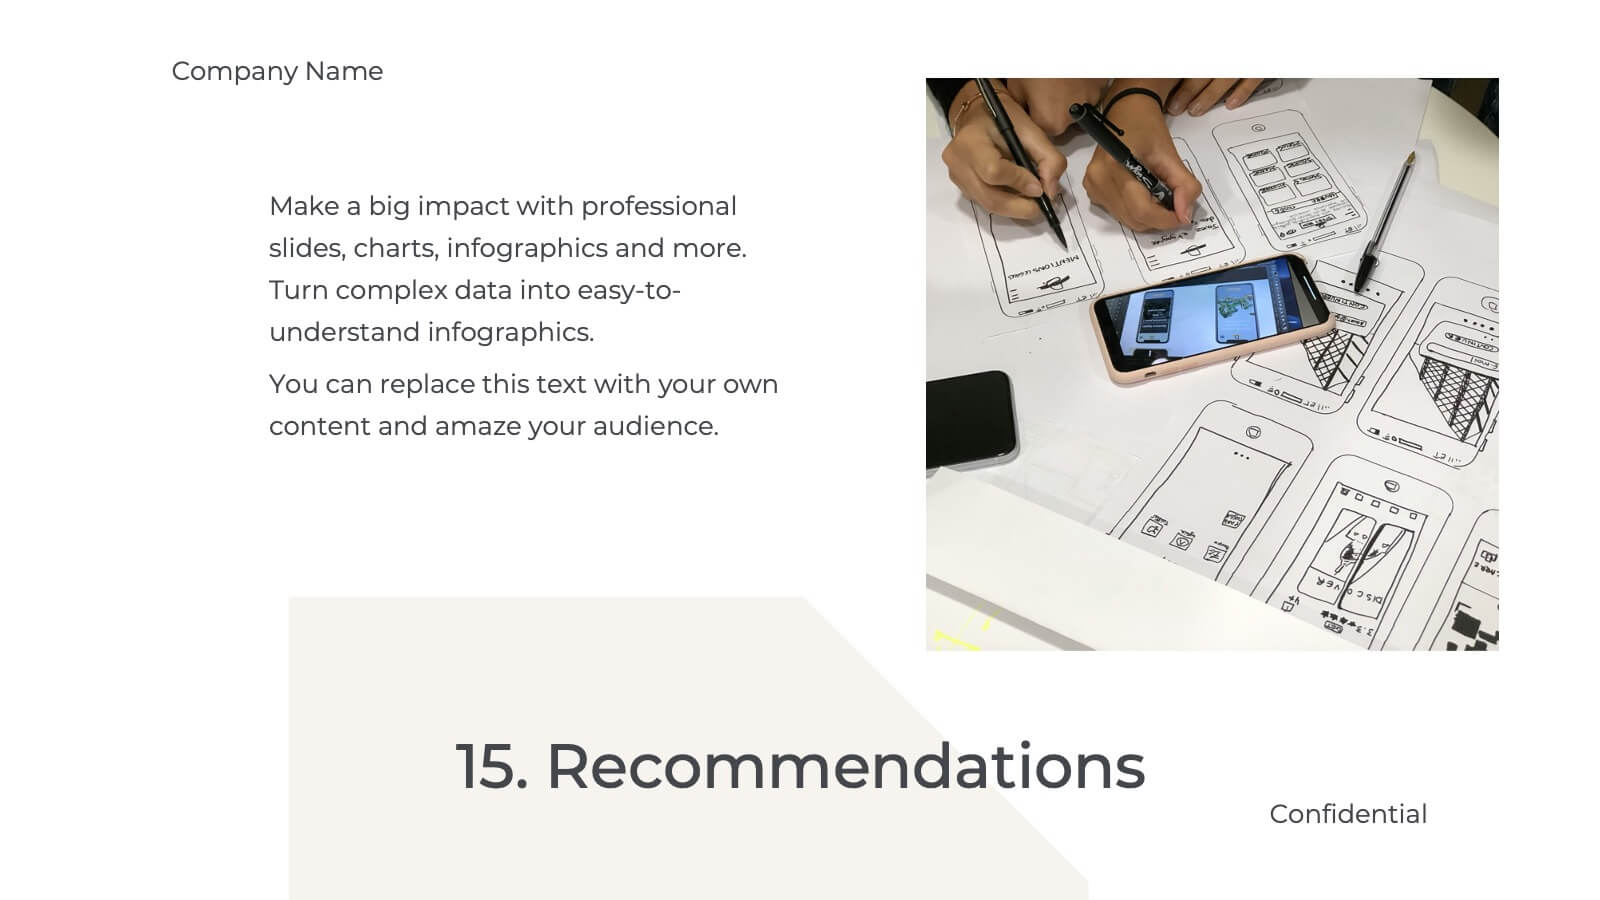
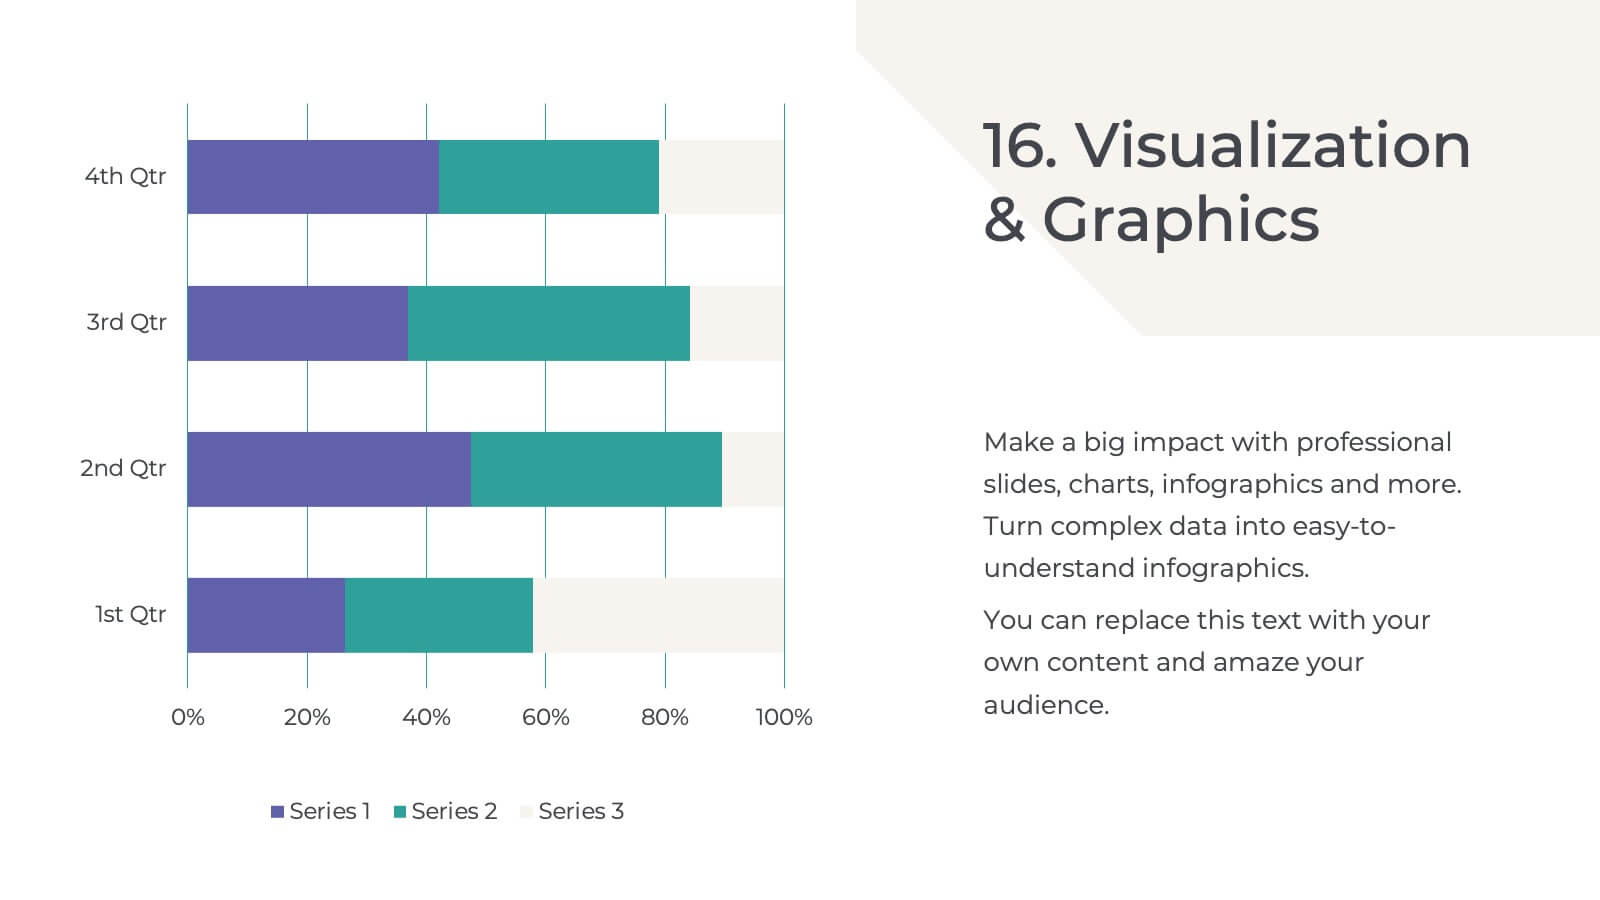
Palladium Qualitative Research Findings Presentation
Present your qualitative research findings effectively with this sleek, professional template. It includes sections for objectives, data analysis, key findings, and recommendations. Ideal for organizing research insights clearly, it's customizable and compatible with PowerPoint, Keynote, and Google Slides, ensuring smooth collaboration and impactful presentations for your audience.


2 diapositivas
Professional Closing Thank You Presentation
End your presentation on a high note with this professional thank-you slide template! Featuring a clean and modern layout, this design includes space for contact details and a call to action, making it perfect for business meetings, proposals, and networking events. Fully customizable and compatible with PowerPoint, Keynote, and Google Slides.


6 diapositivas
Project Roadmap with Strategic Phases Presentation
Visually guide your team through every phase with the Project Roadmap with Strategic Phases Presentation. This template features a curved arrow layout to illustrate project milestones, making it perfect for planning, strategy, or progress updates. Fully customizable in PowerPoint, Google Slides, and Canva for seamless integration into any workflow.

20 diapositivas
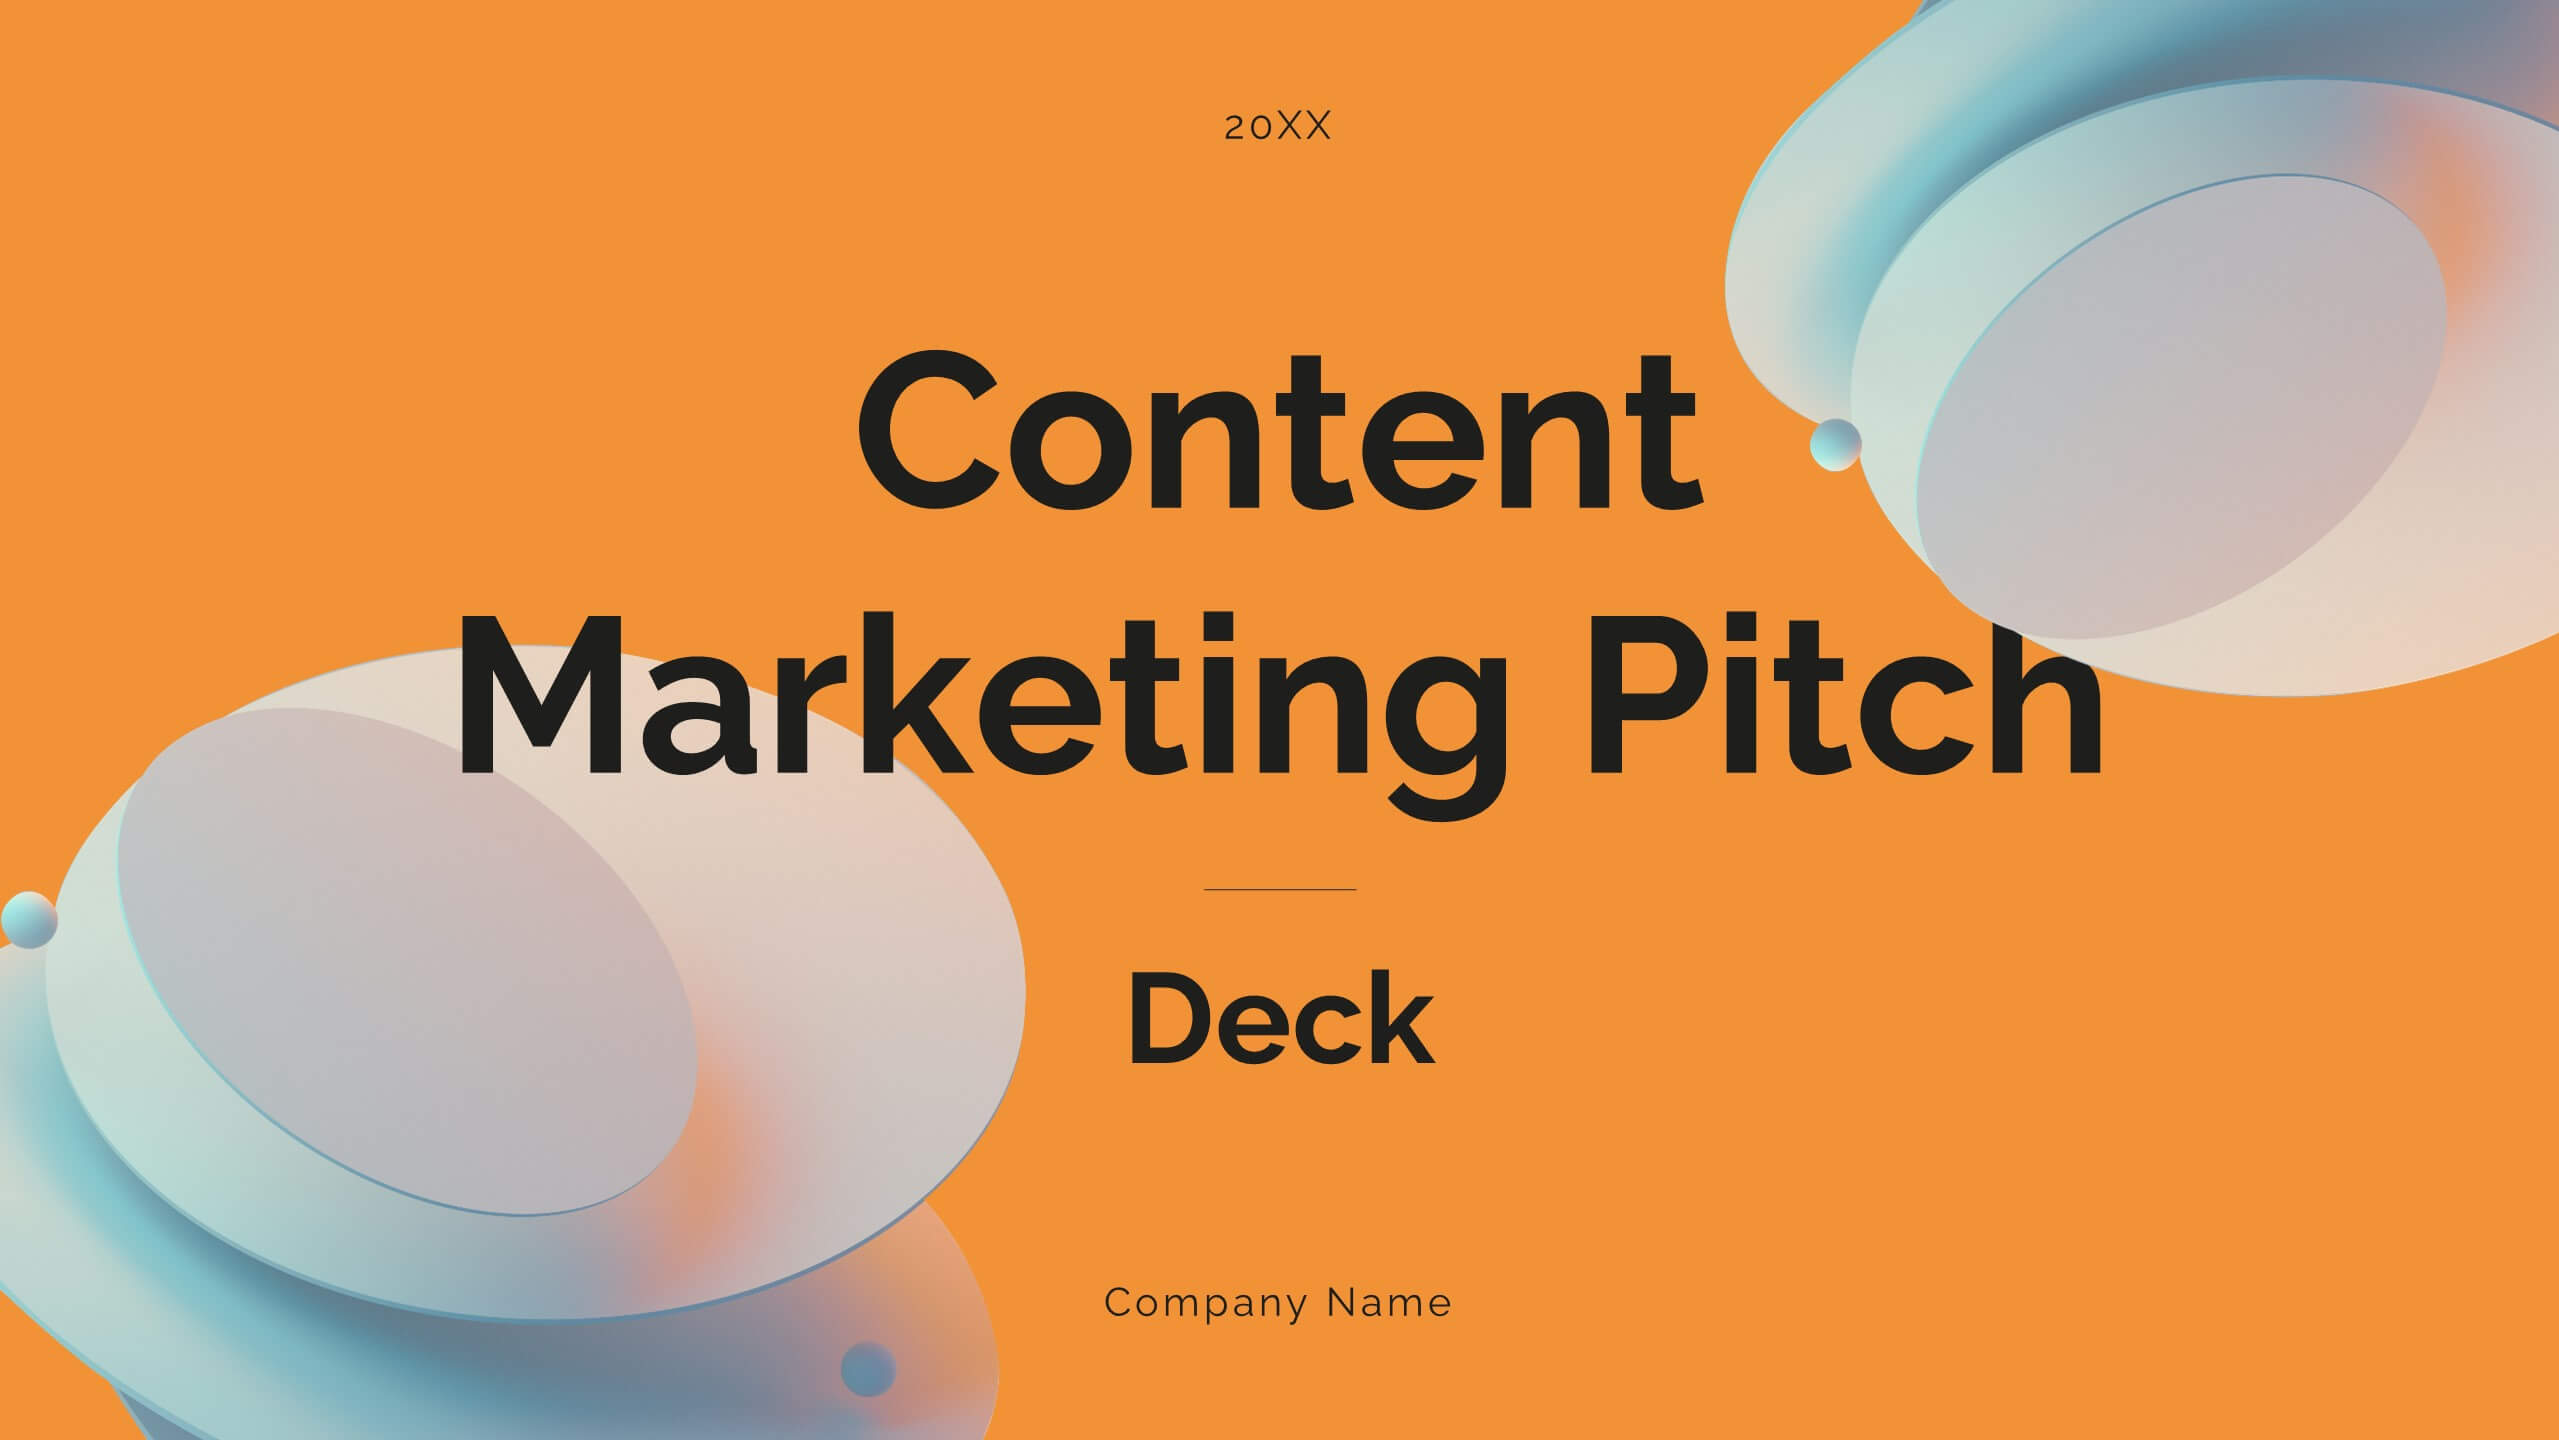
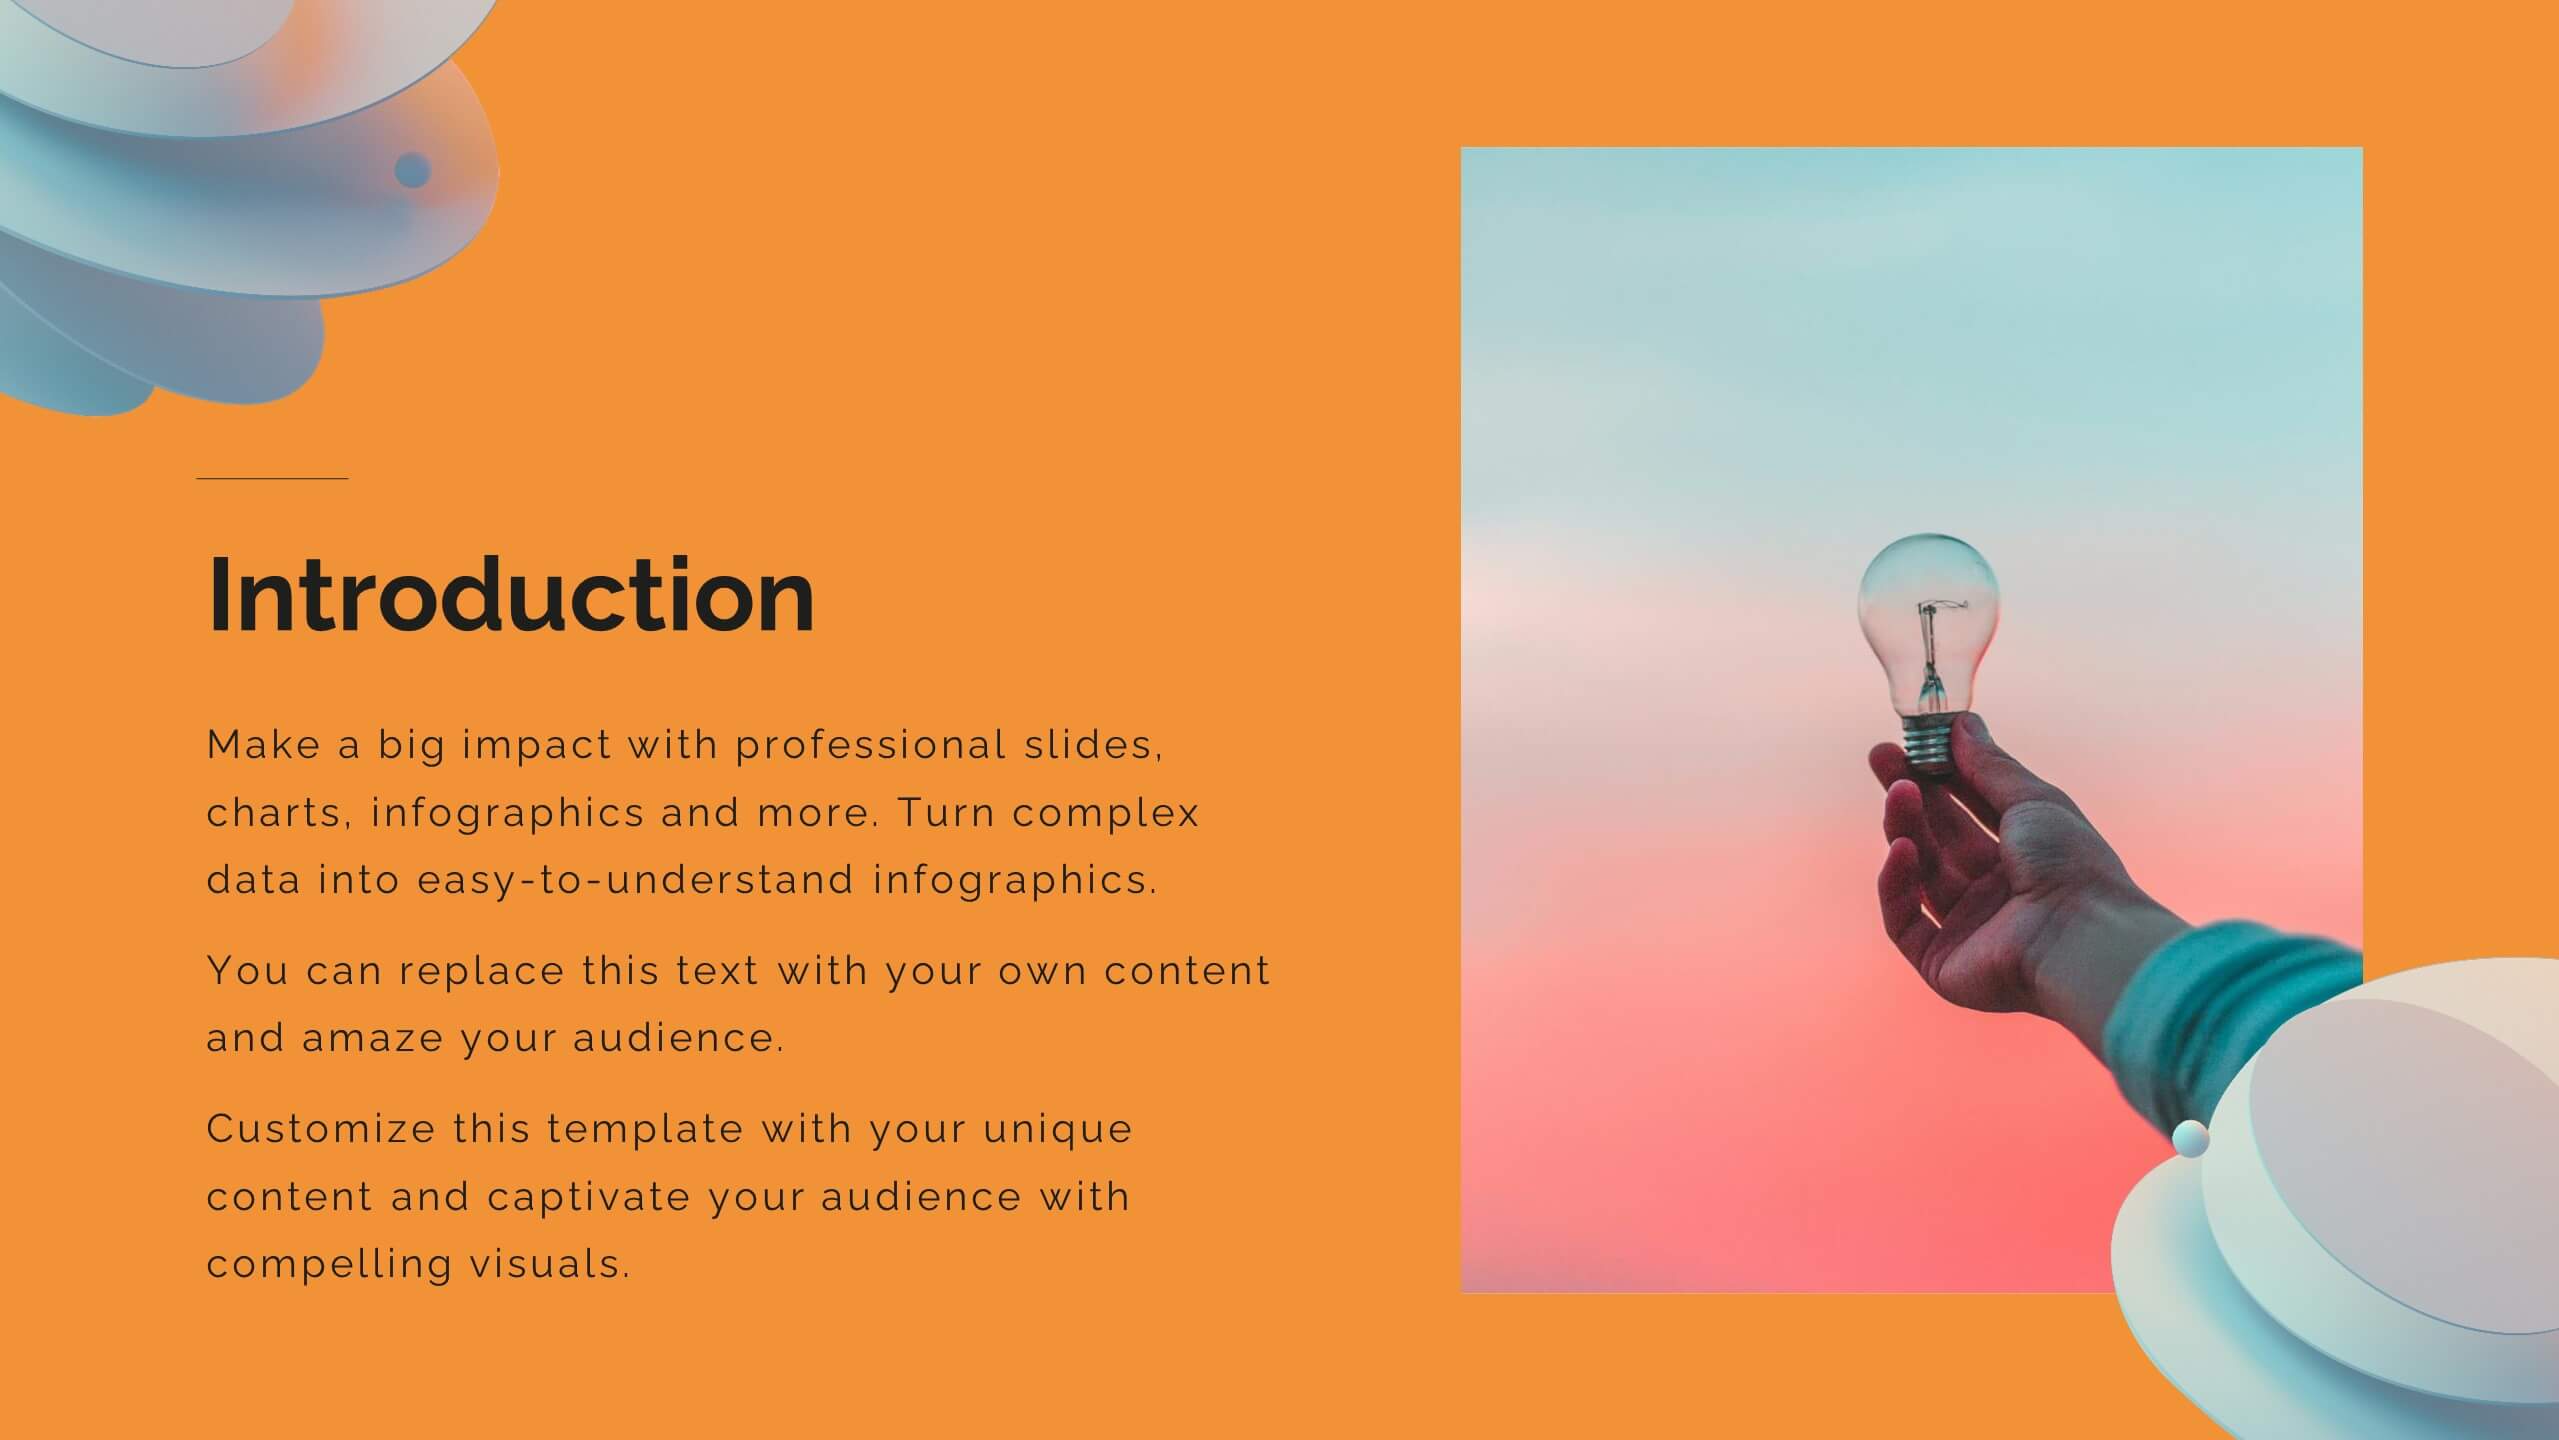
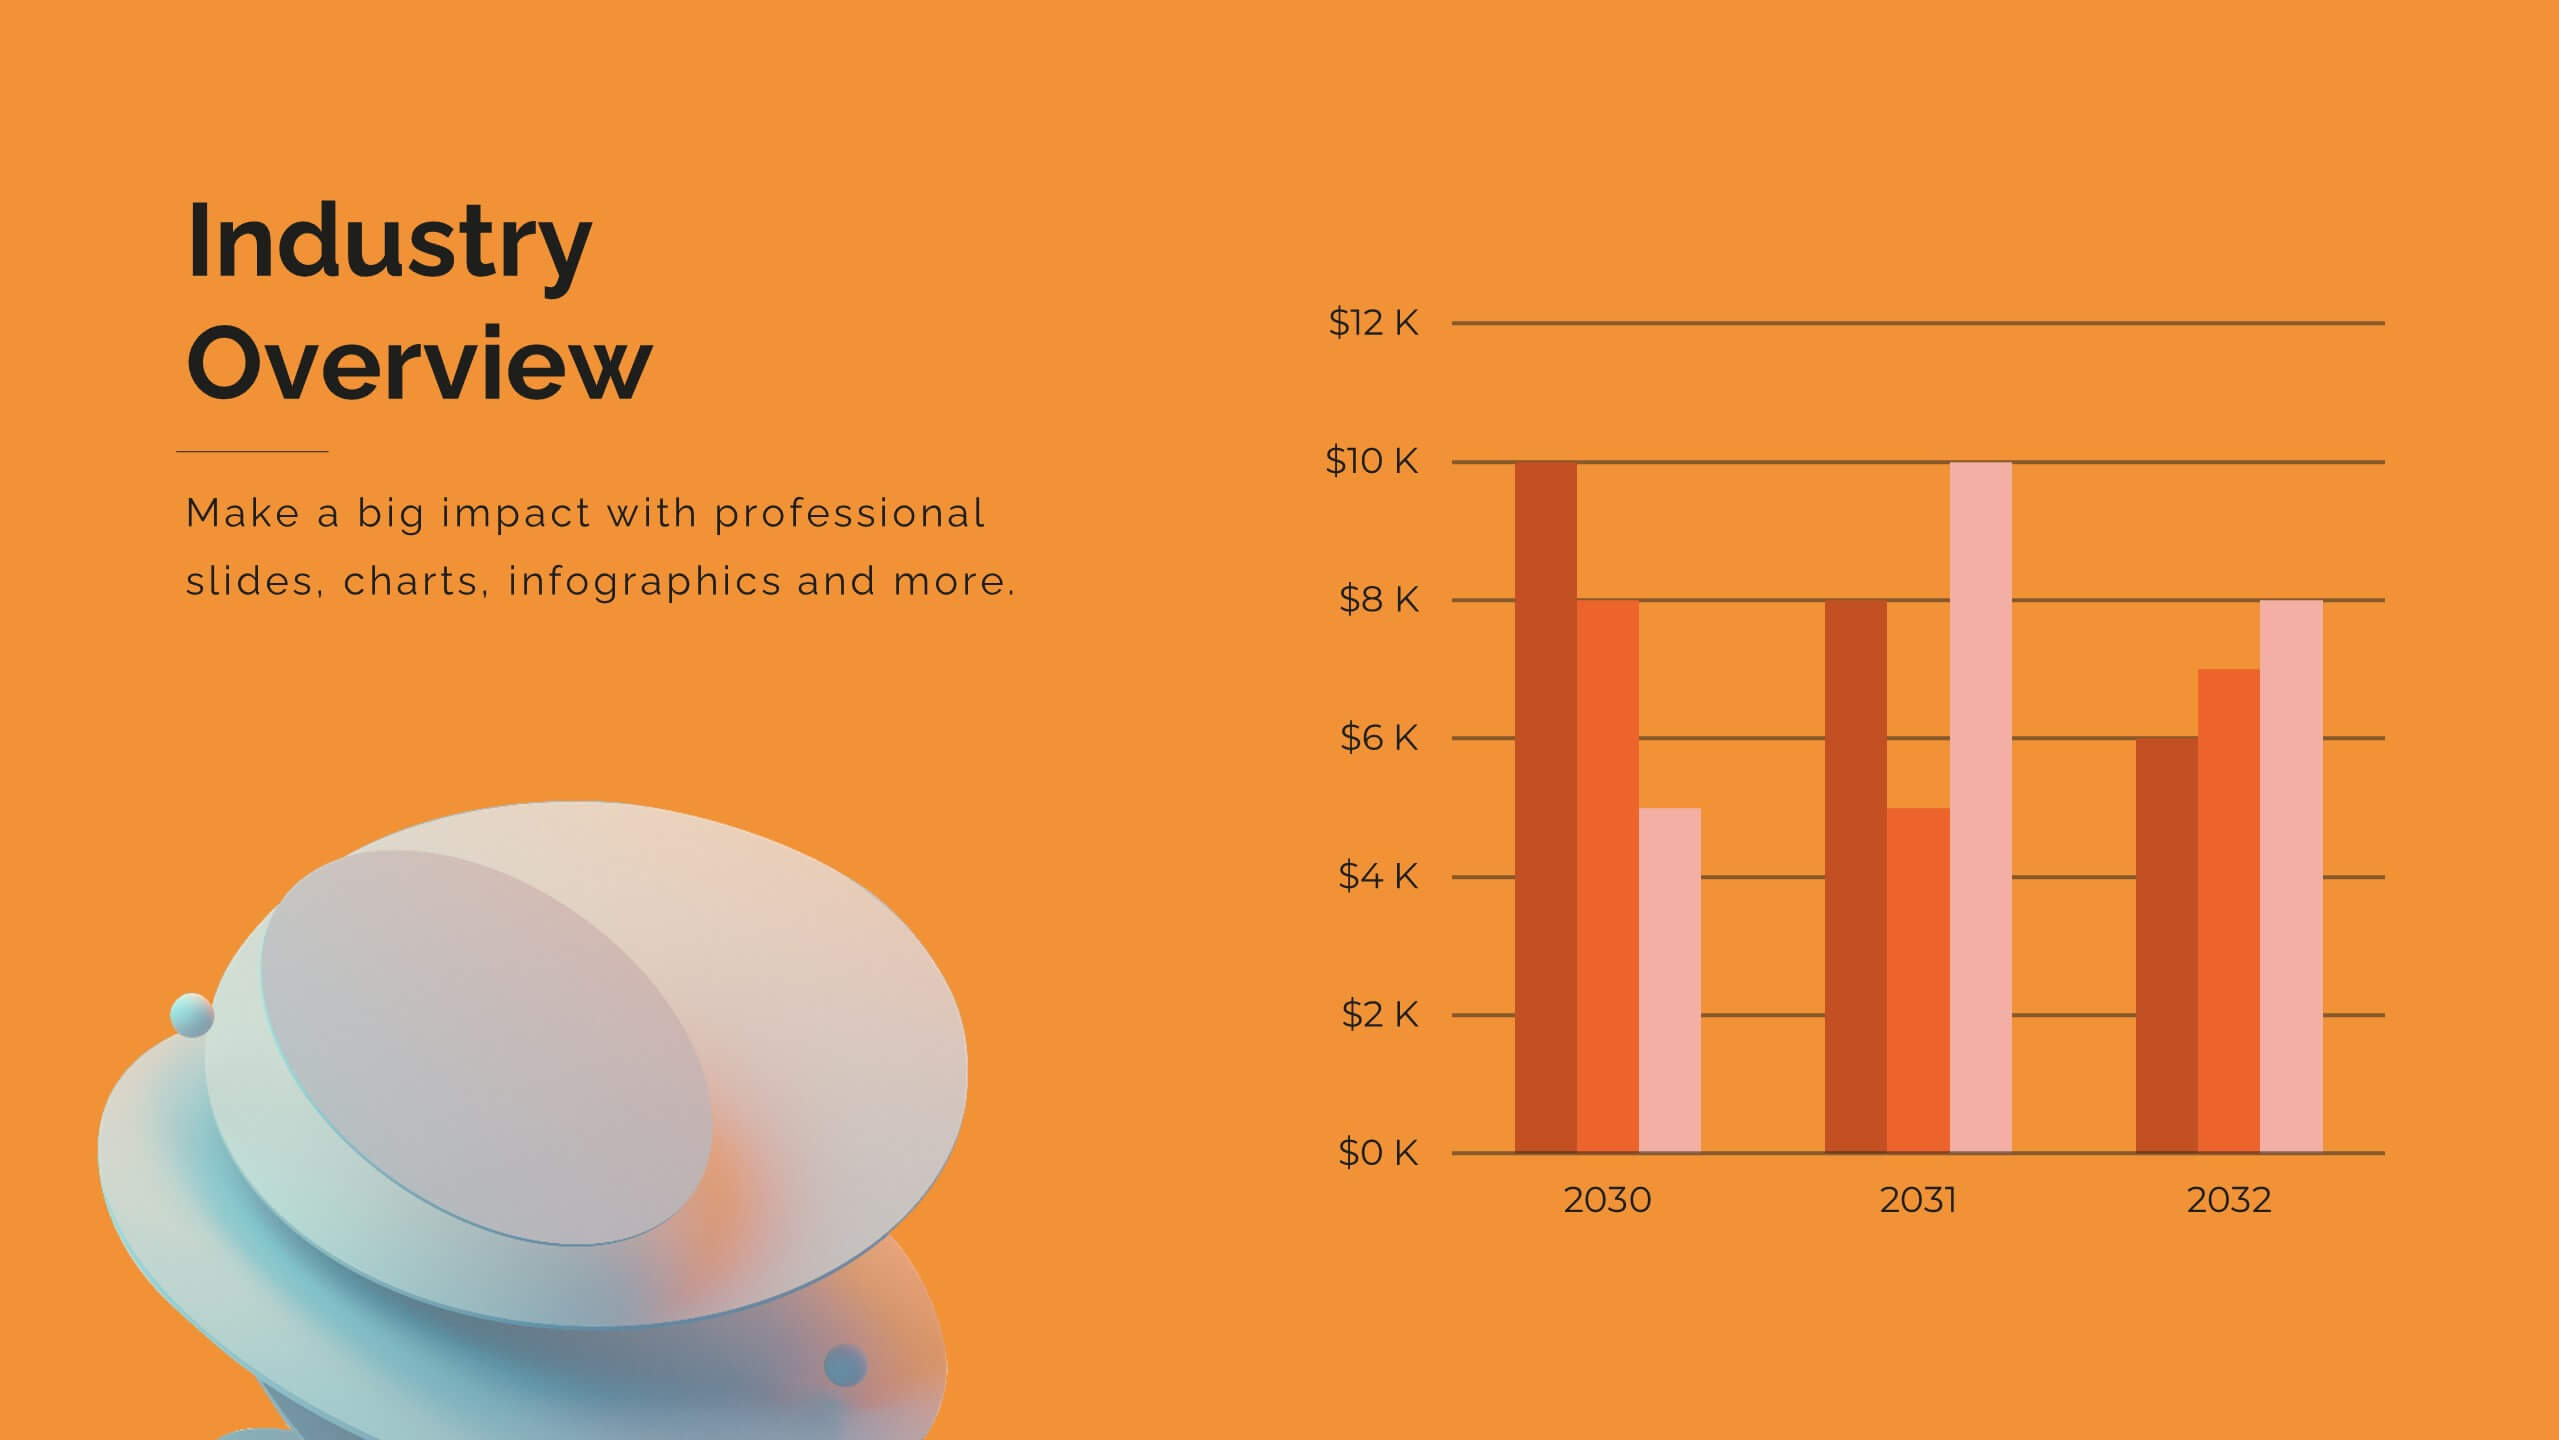
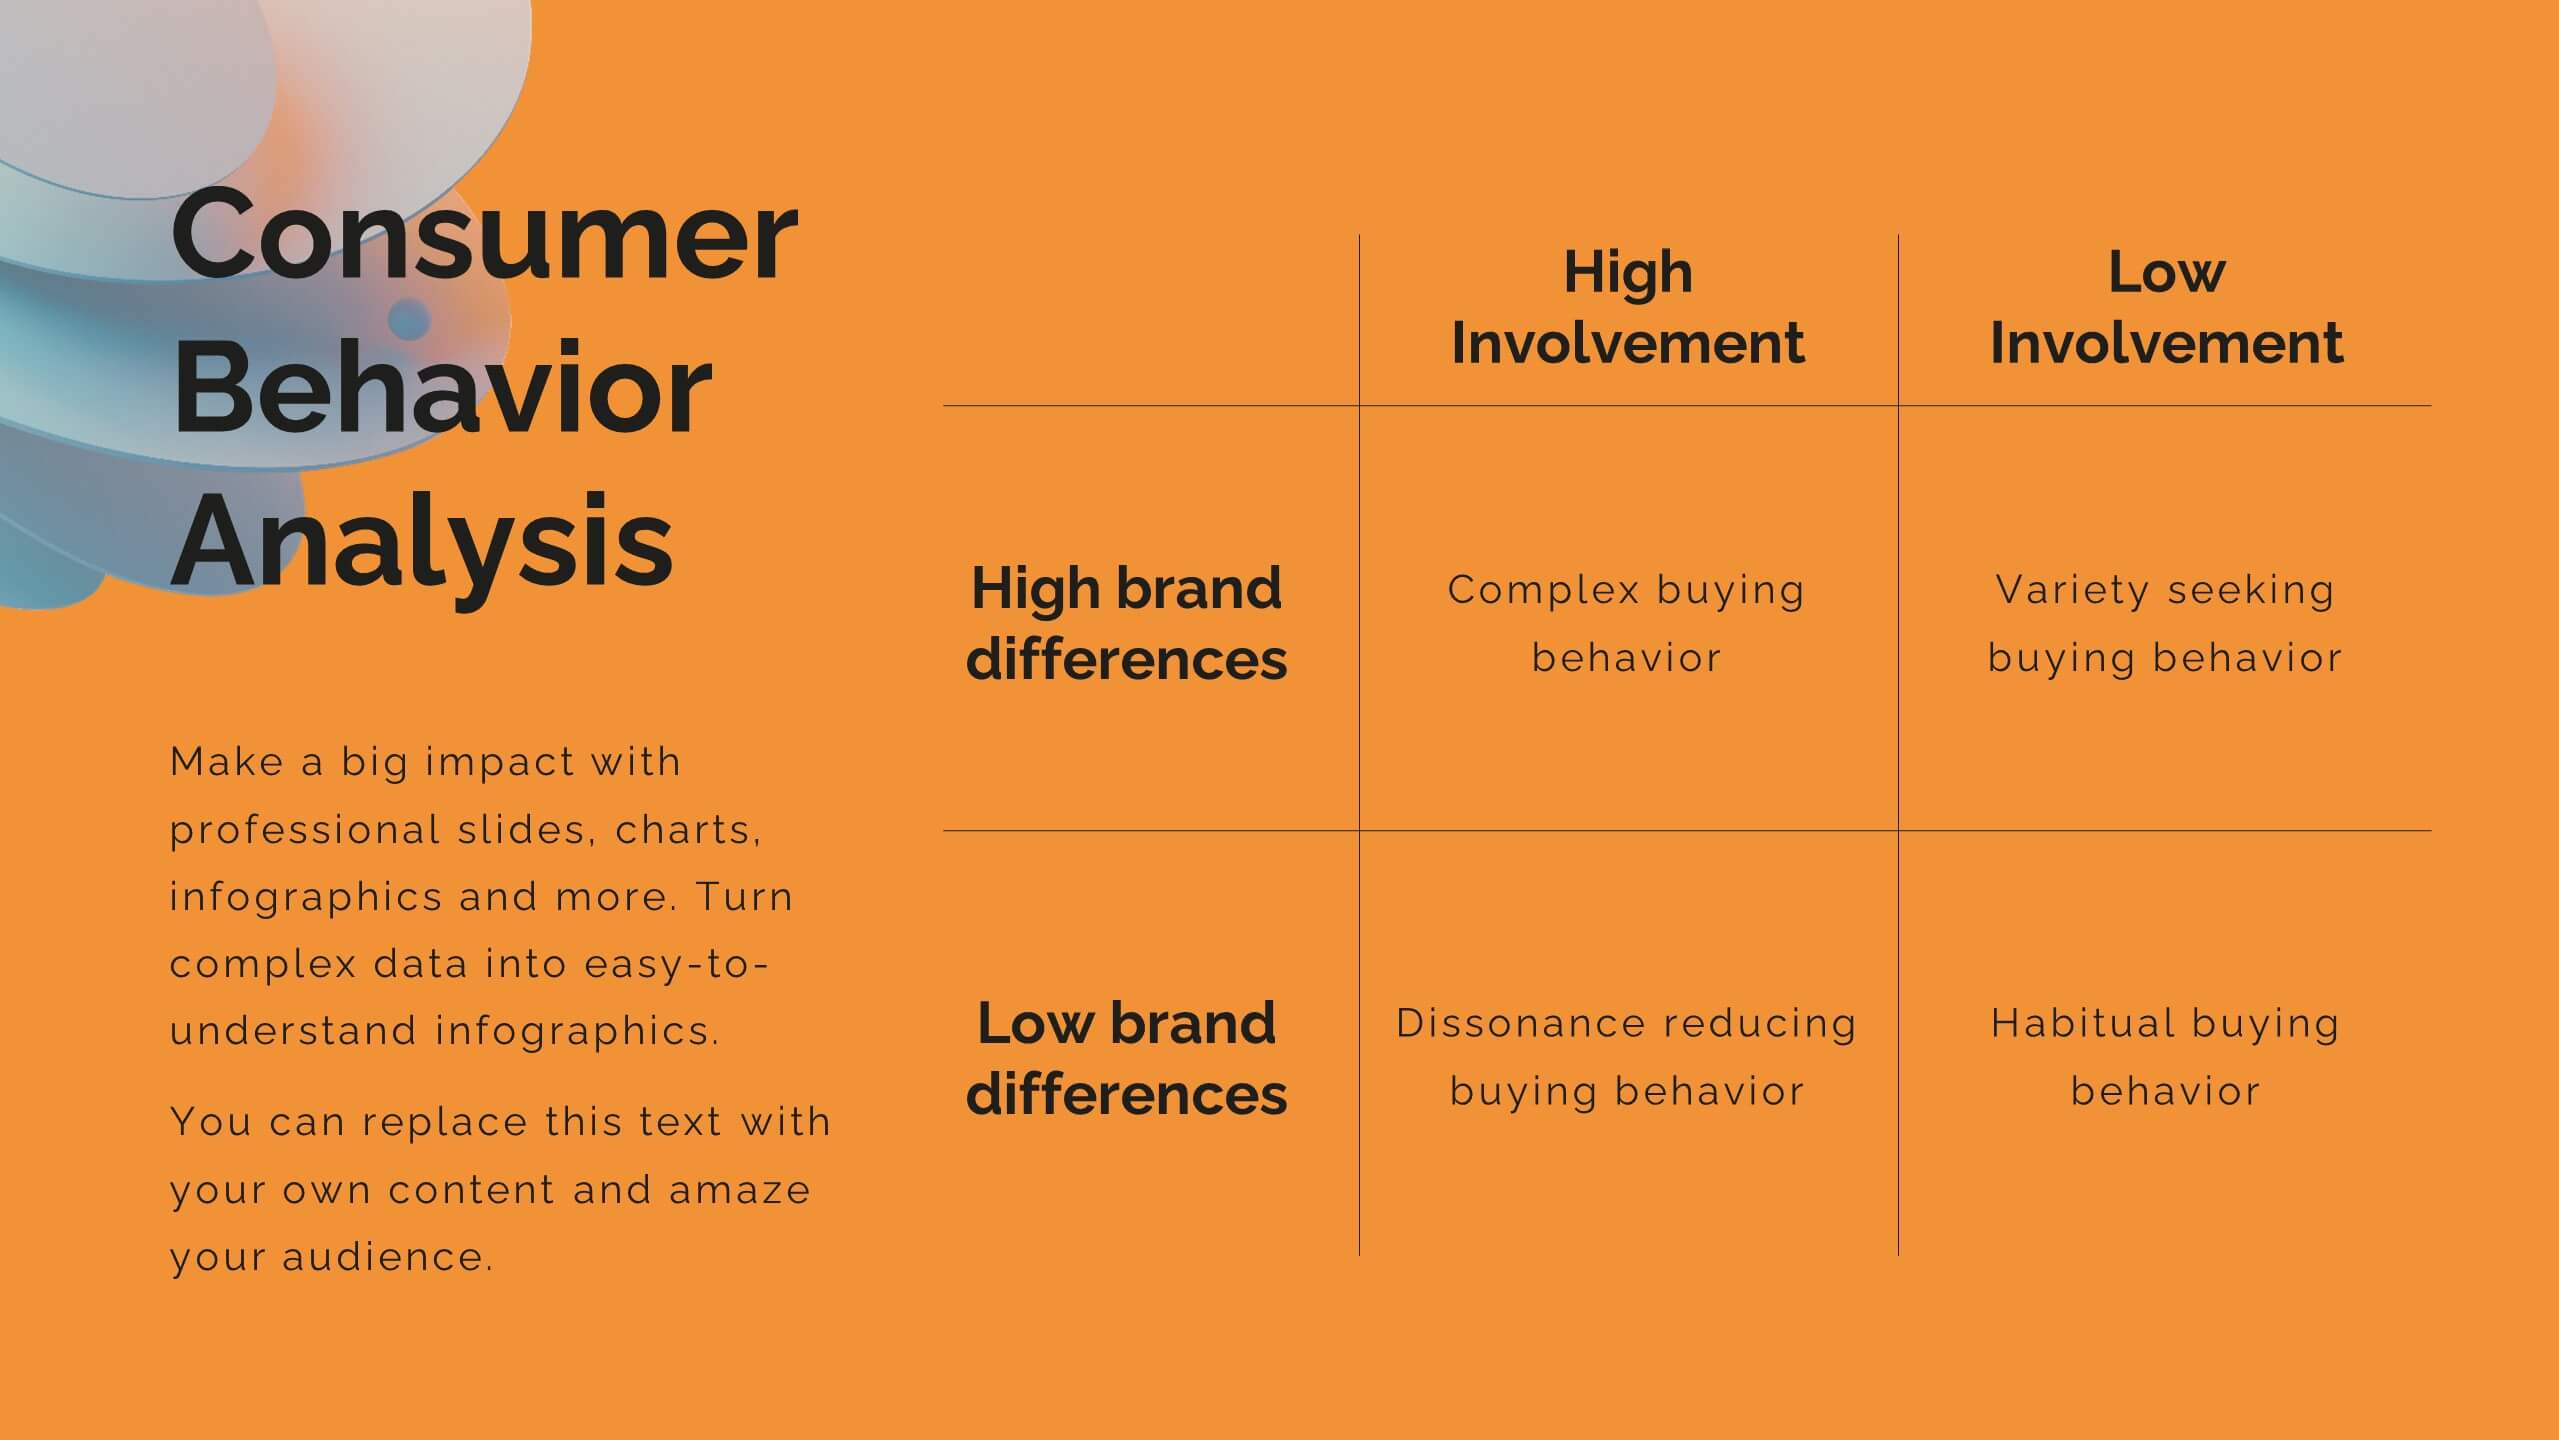
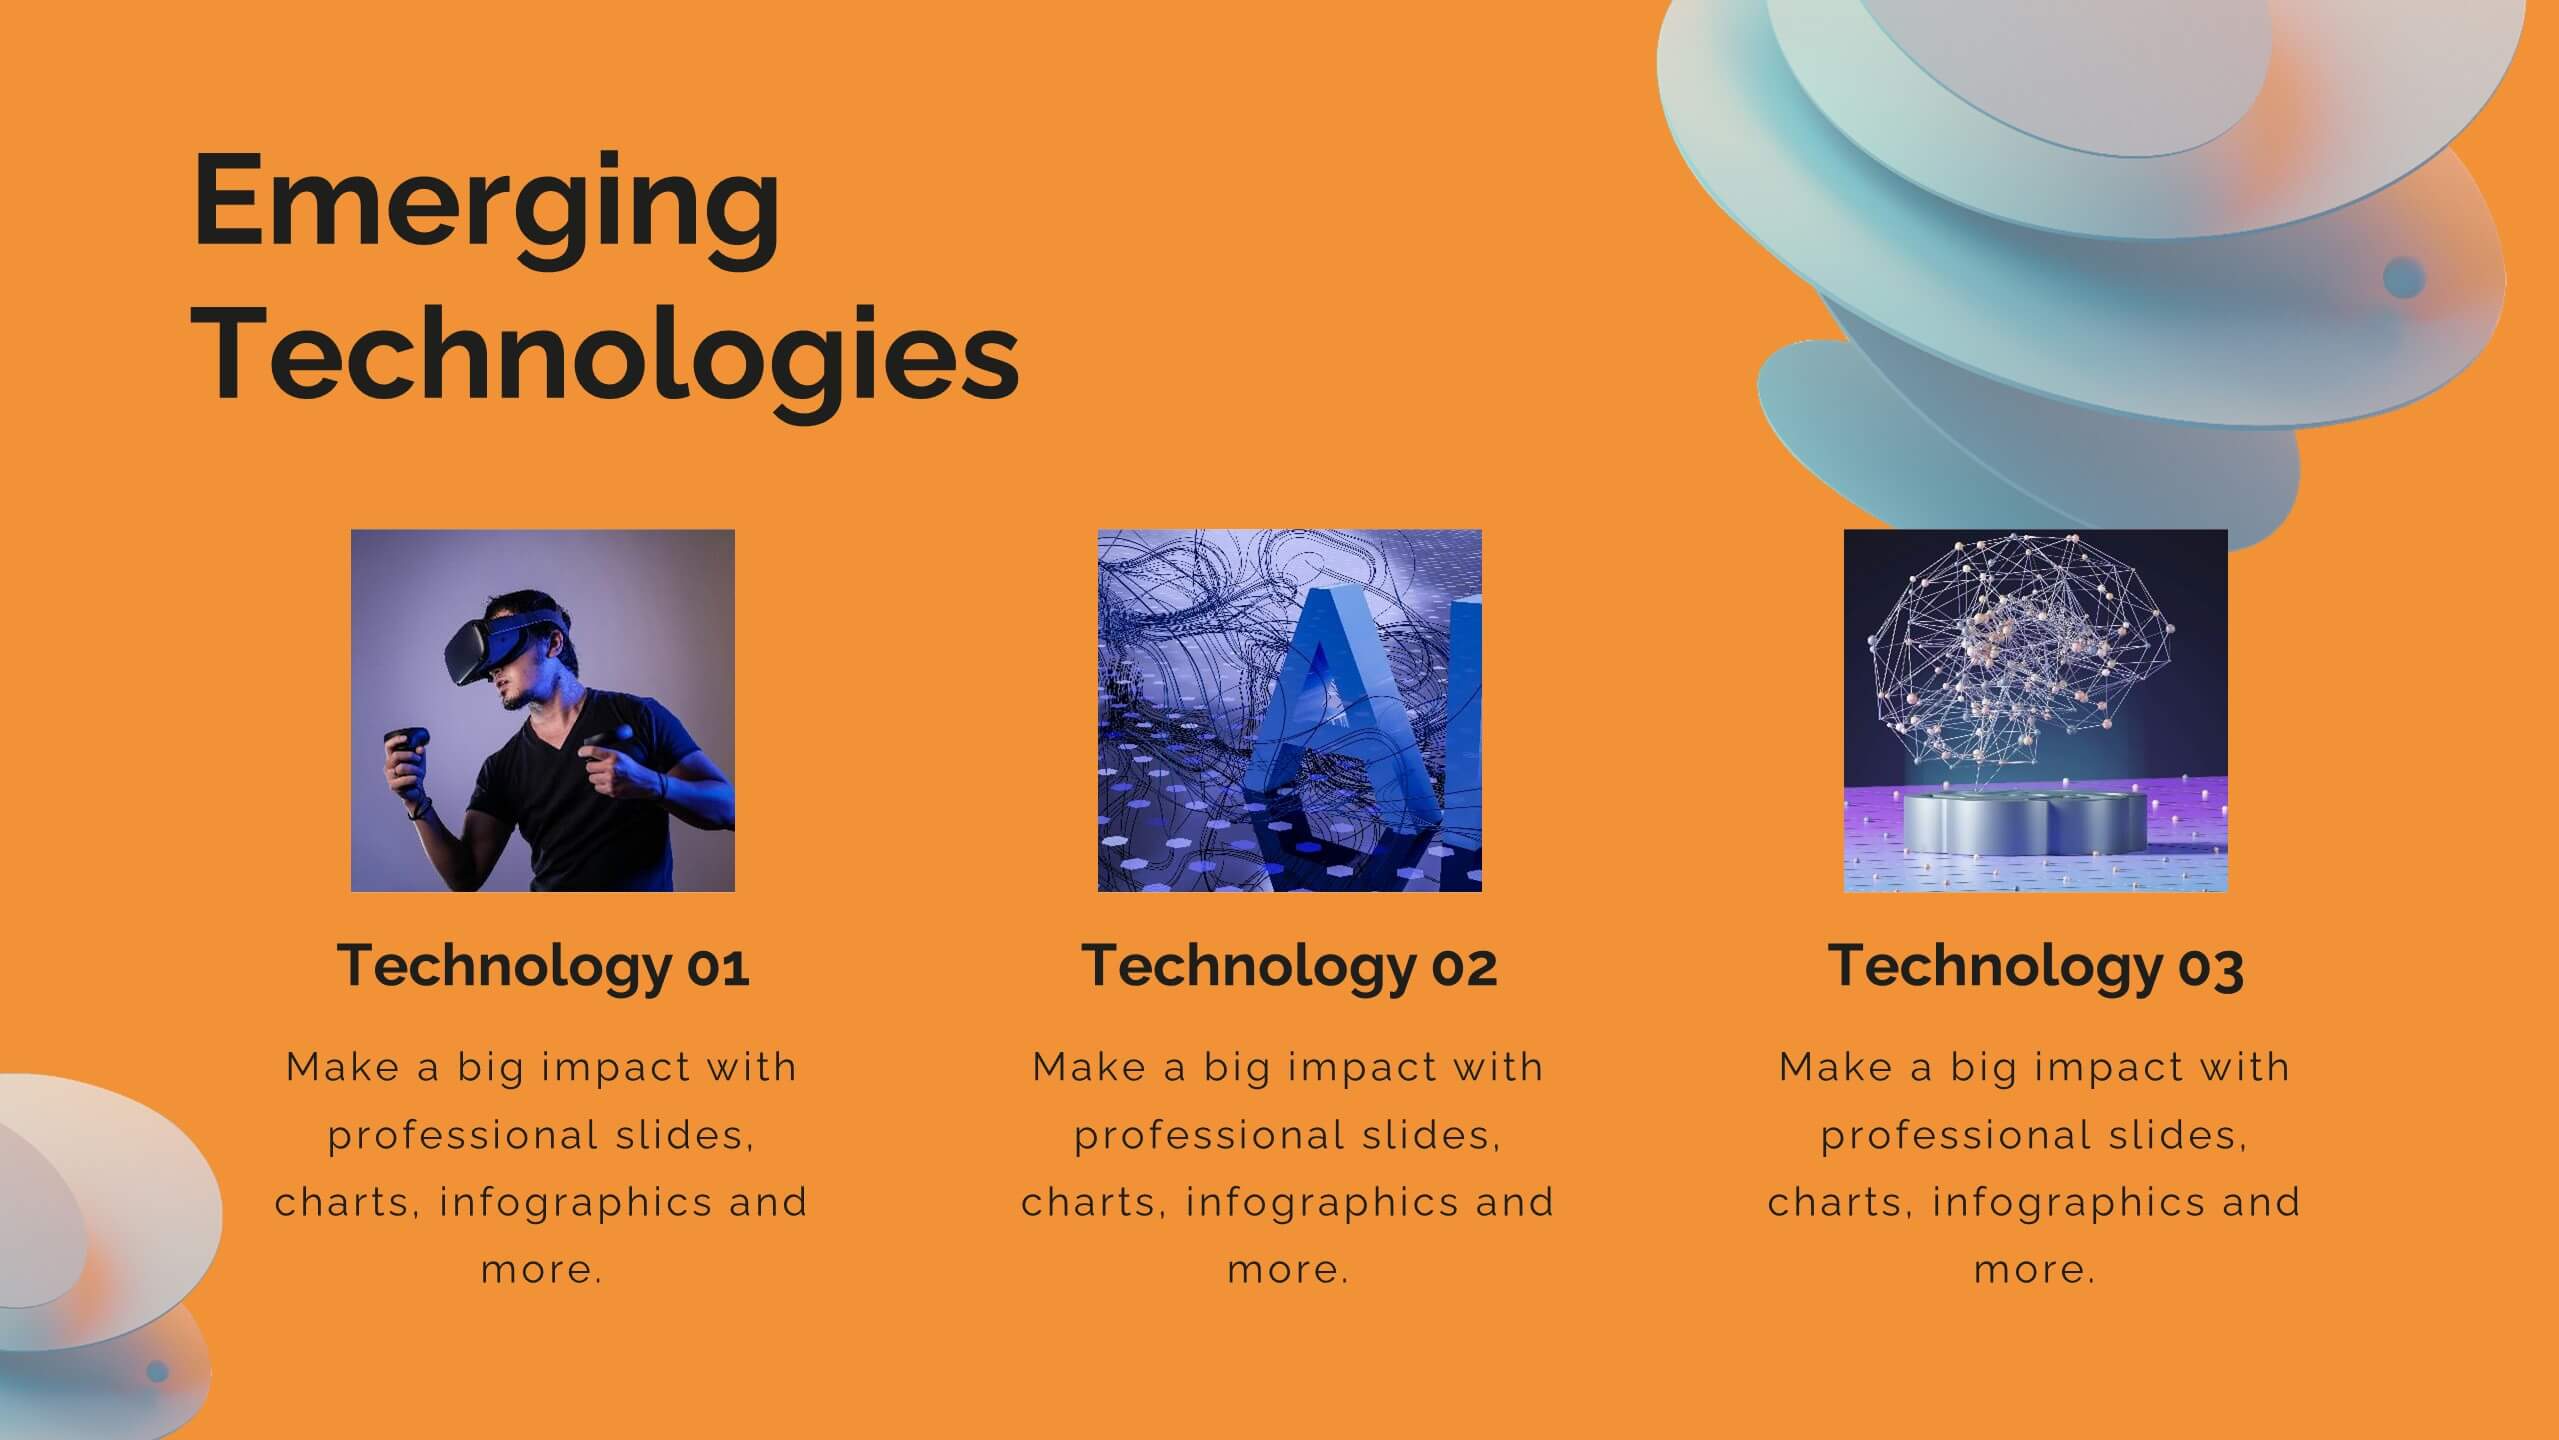
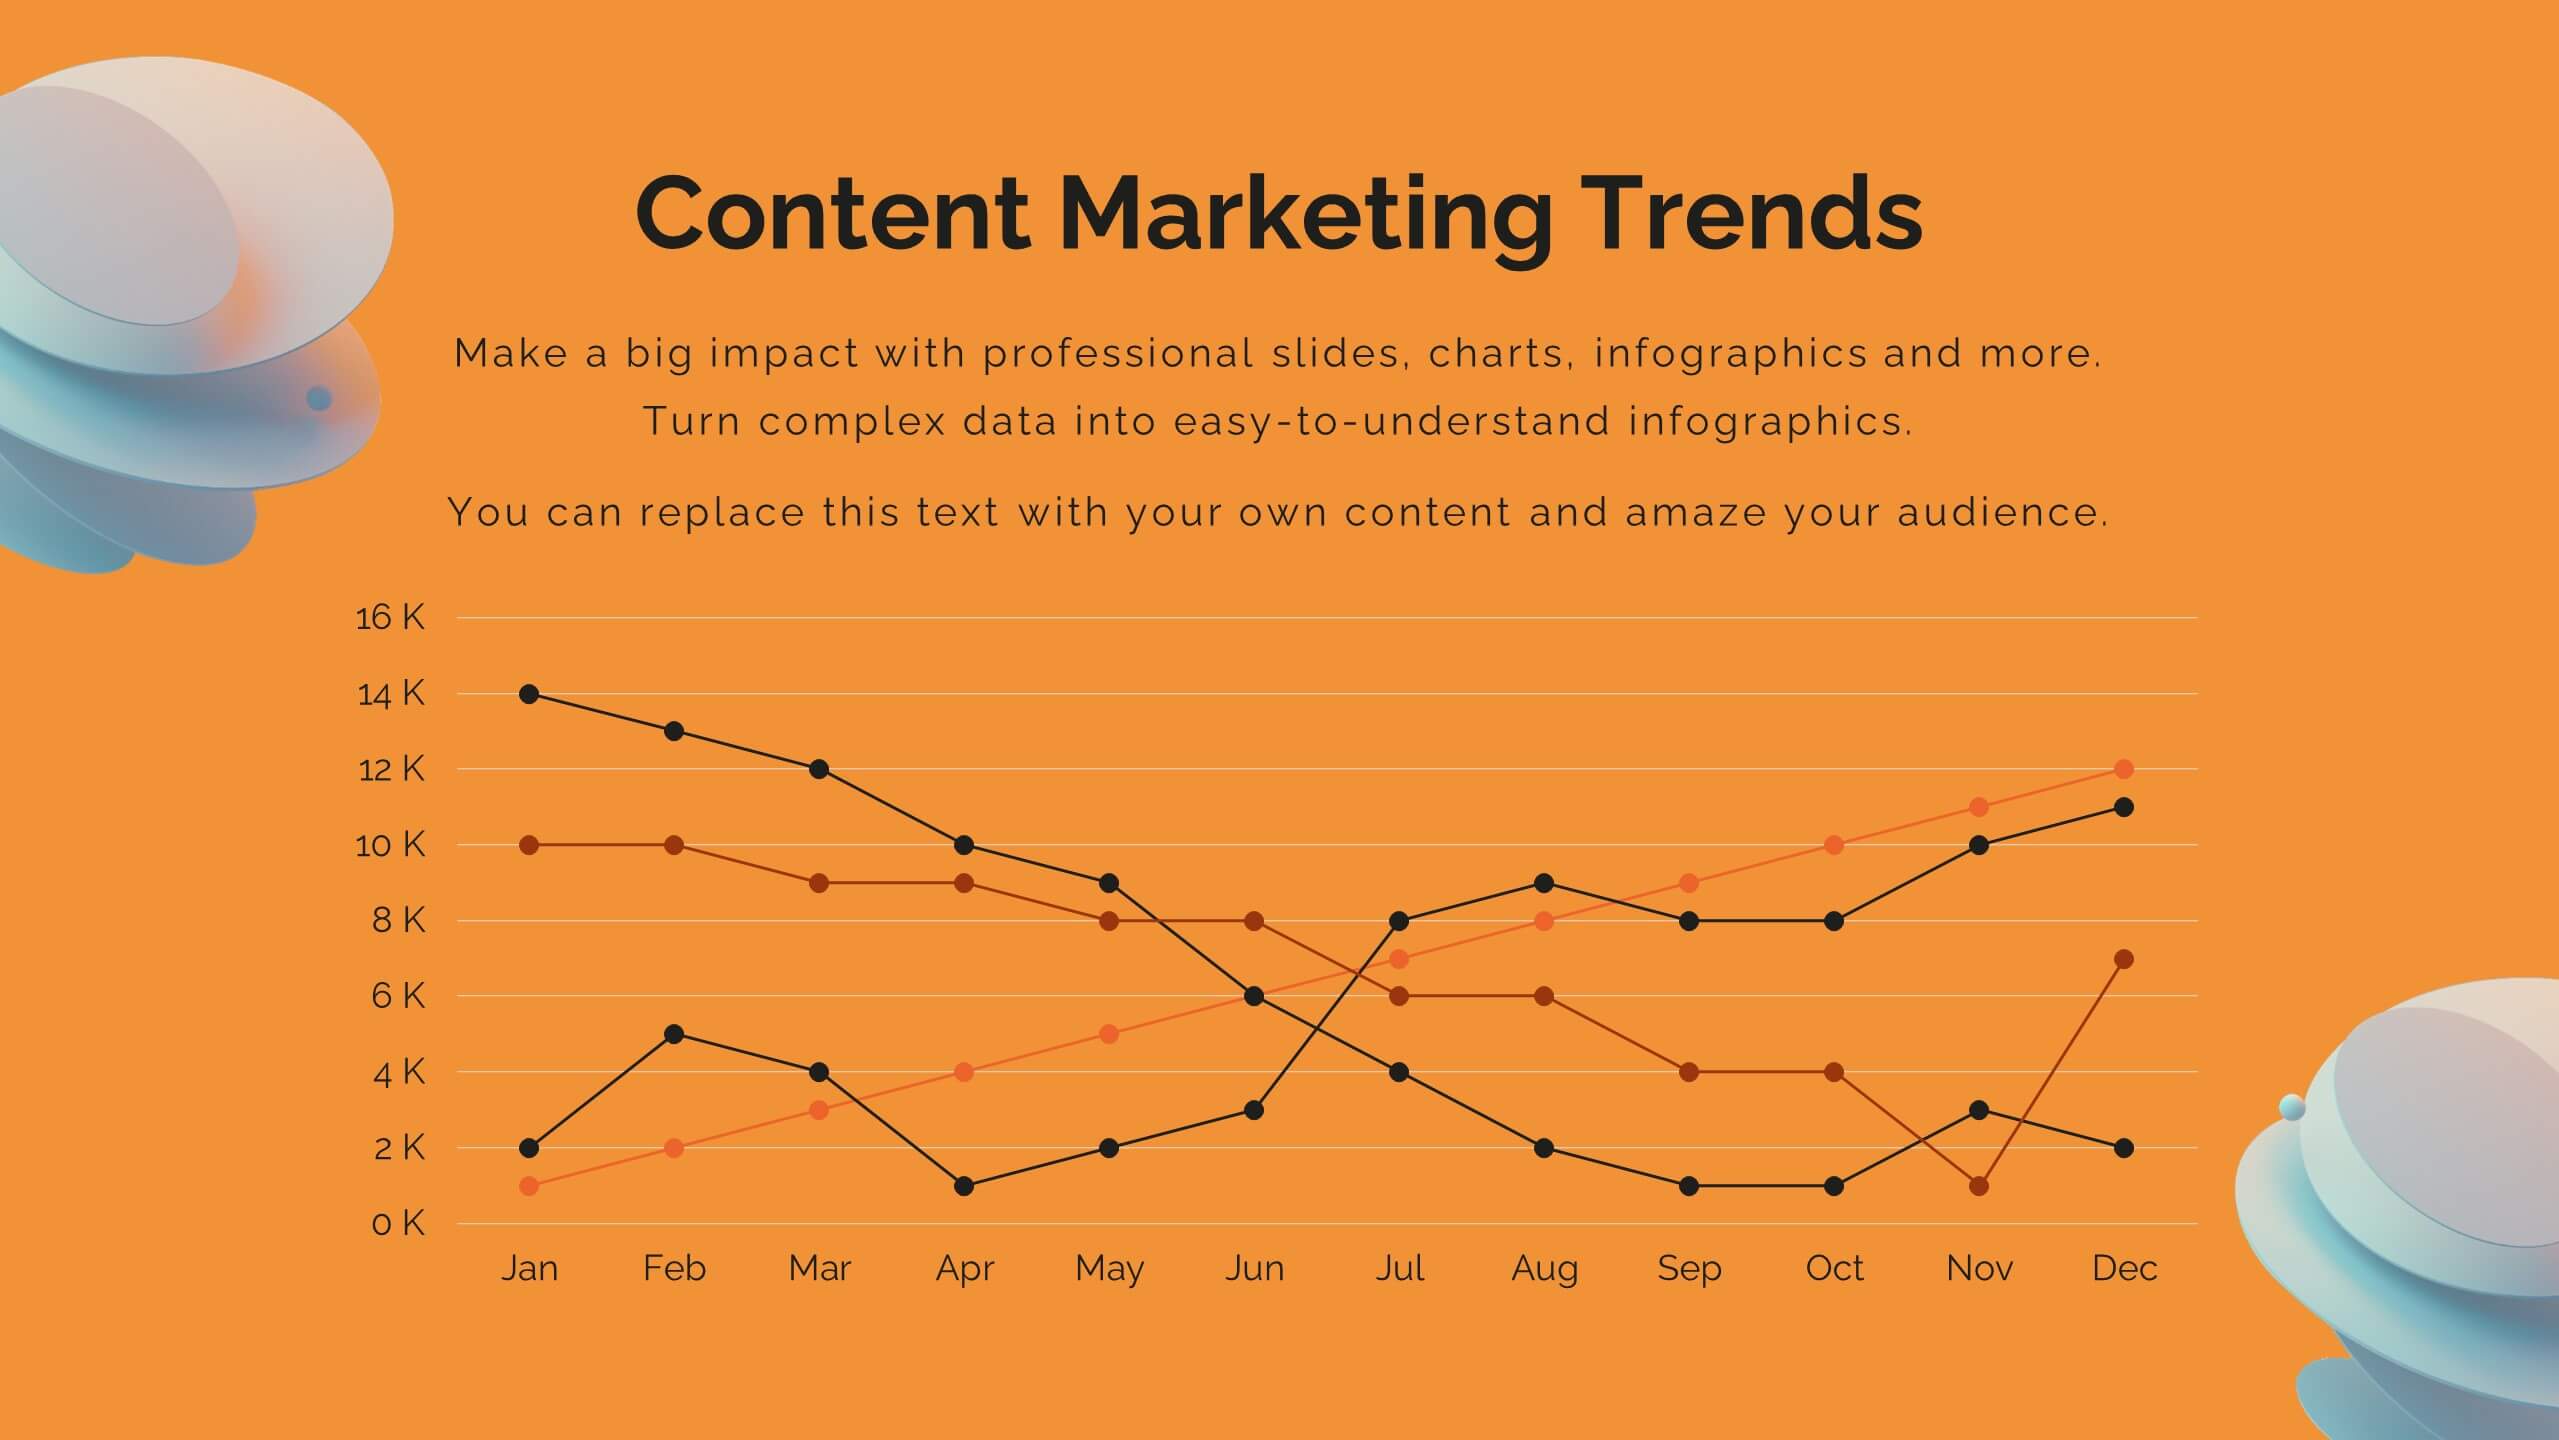
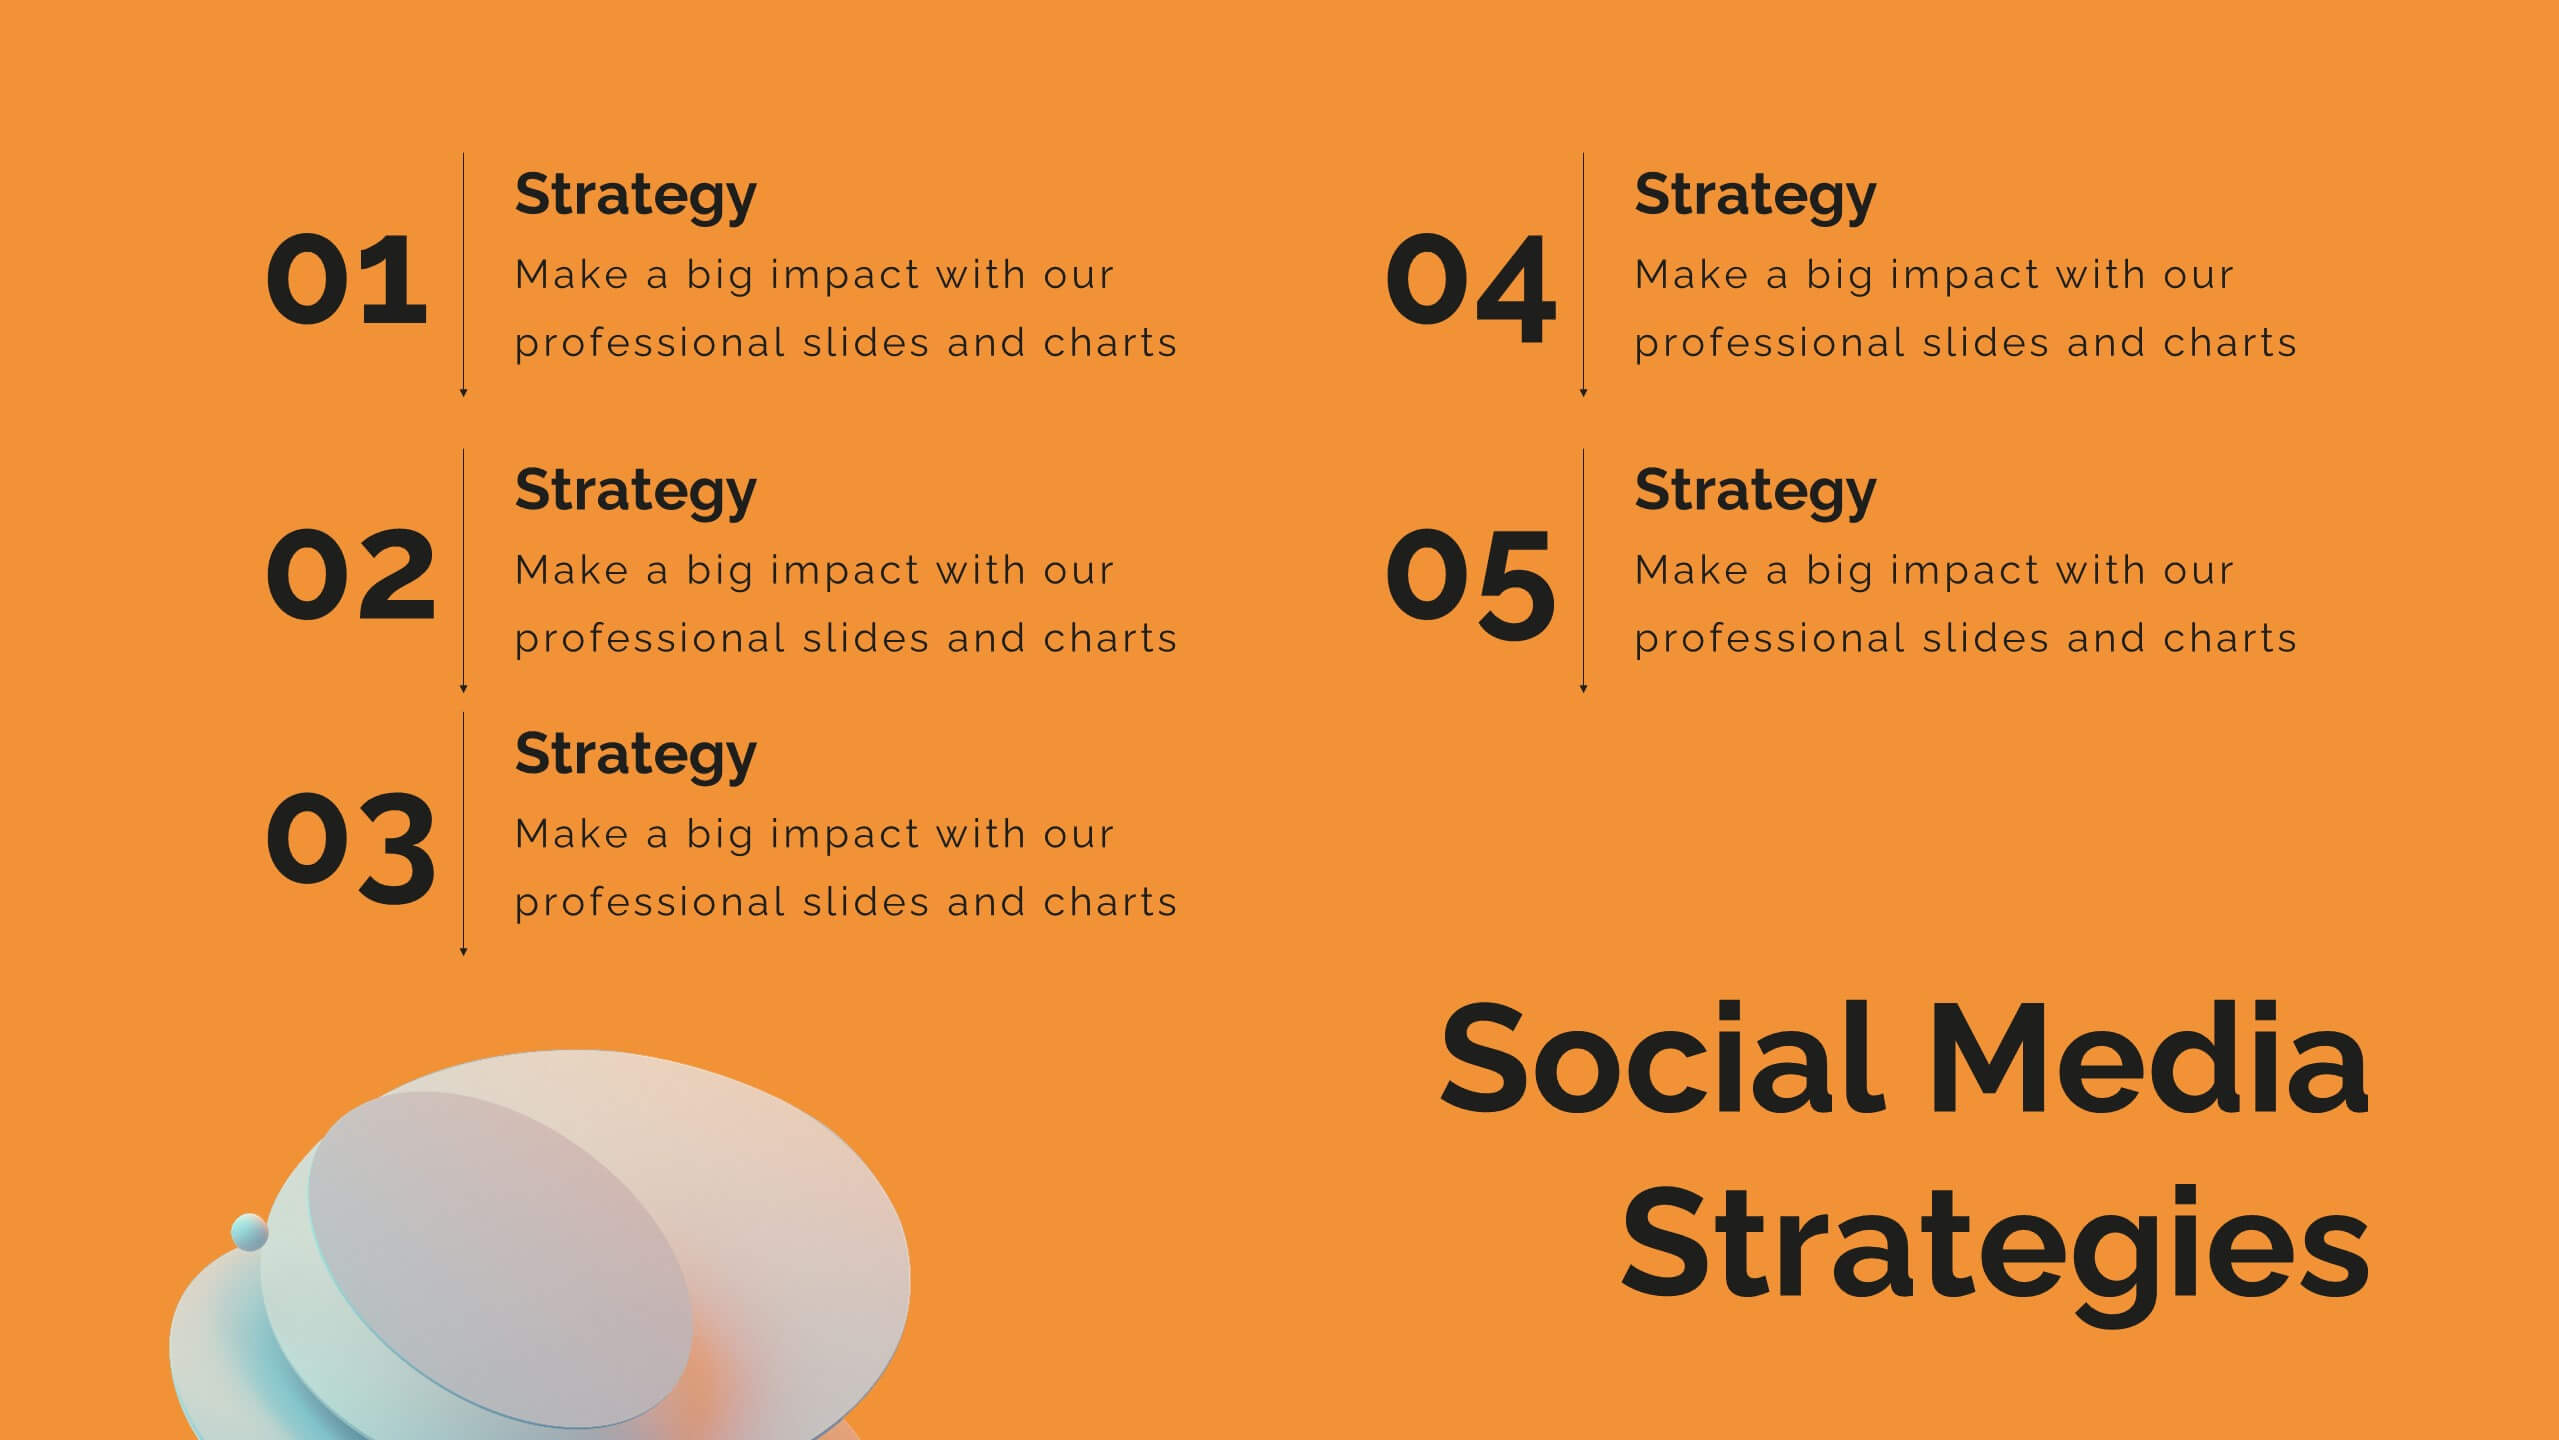
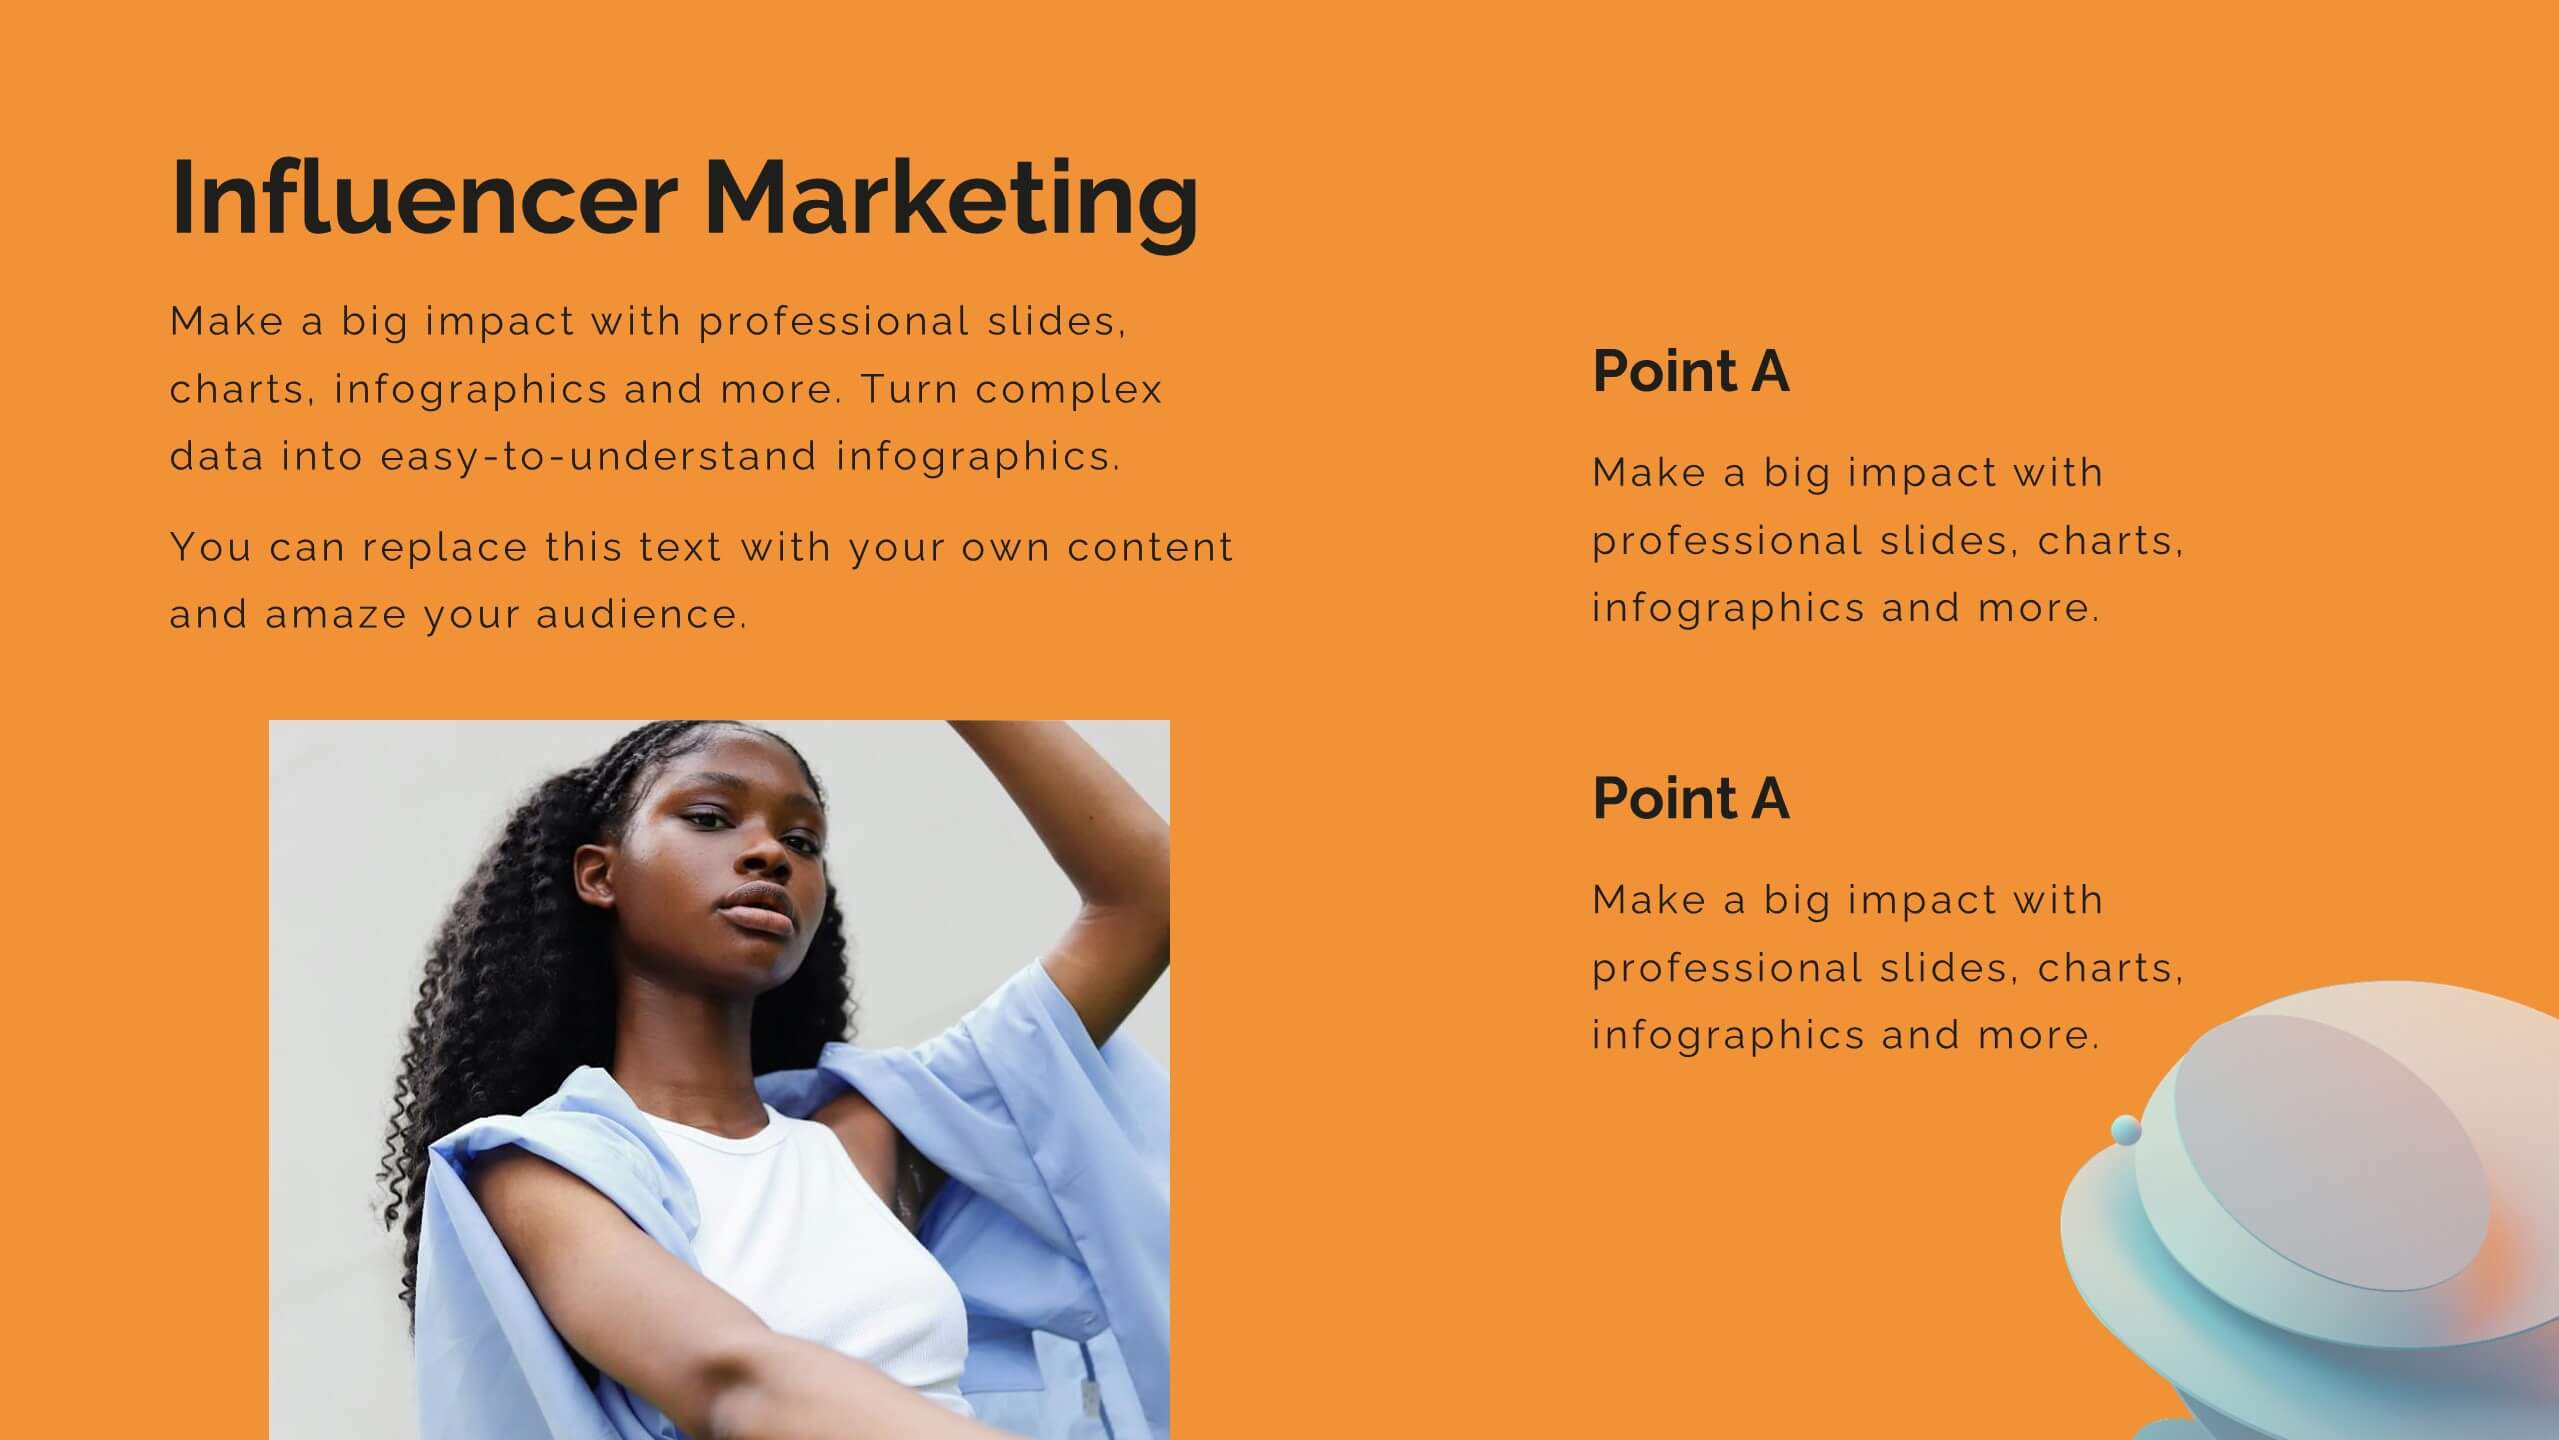
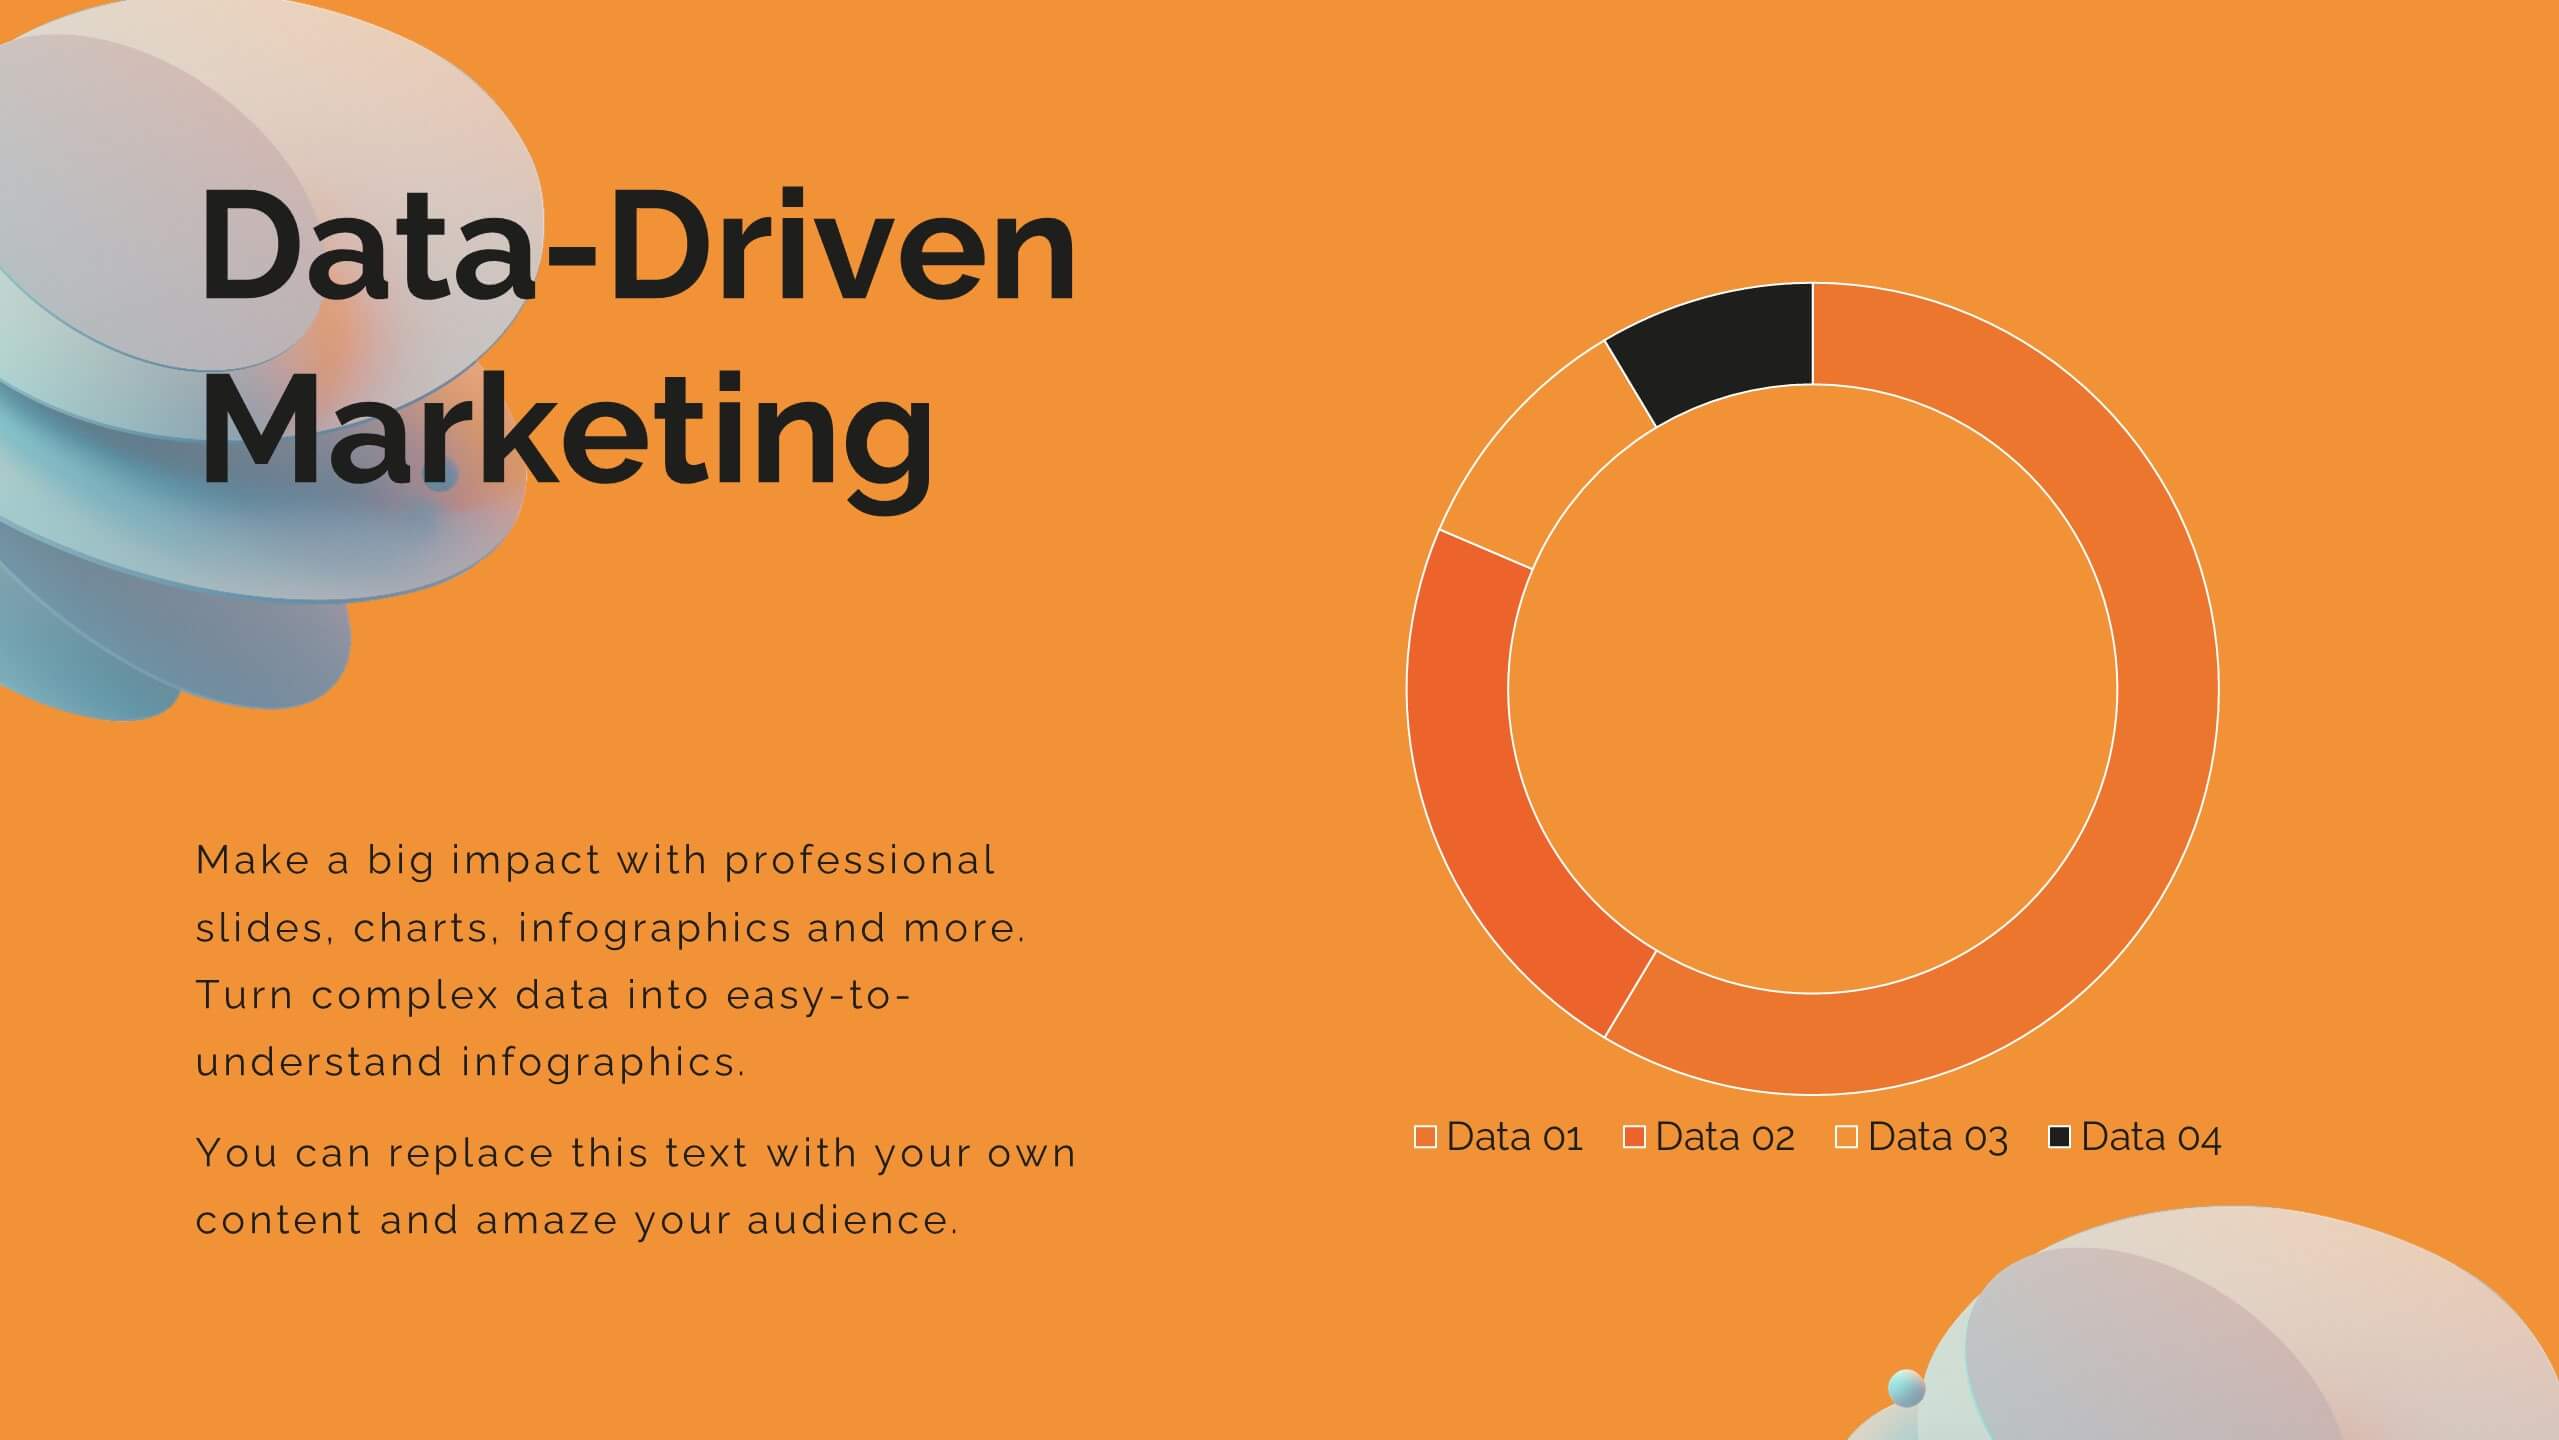
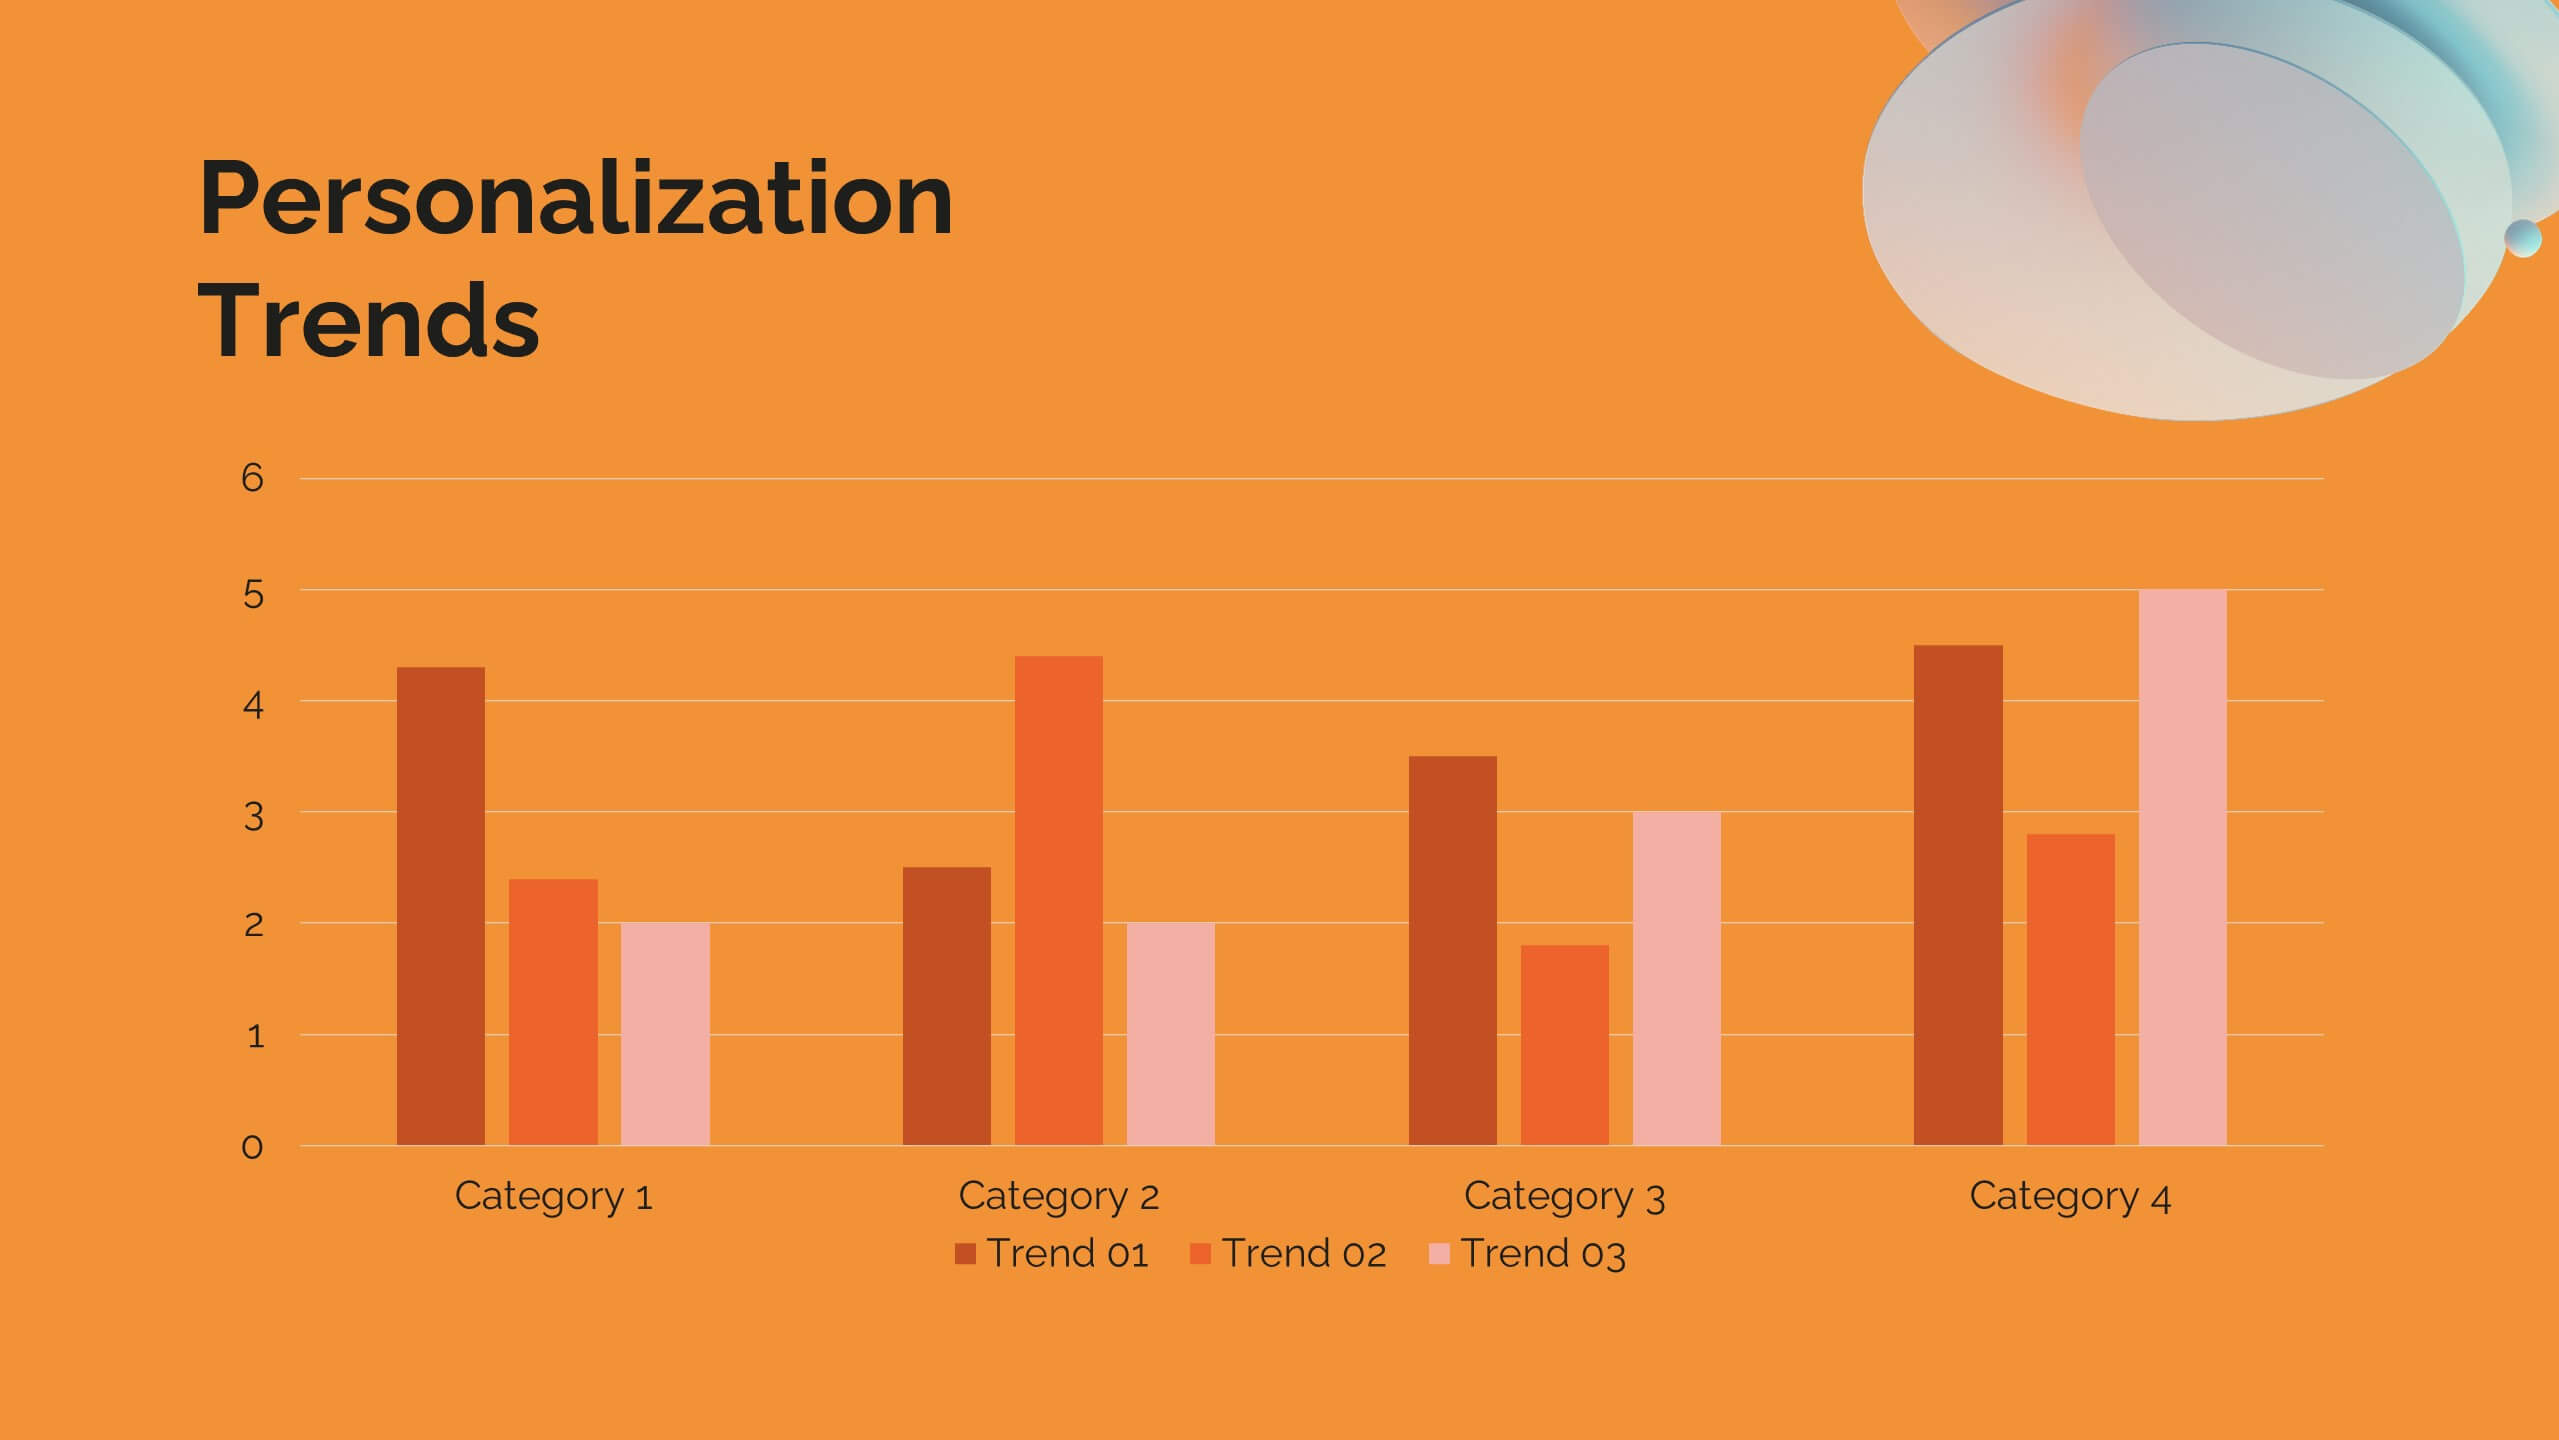
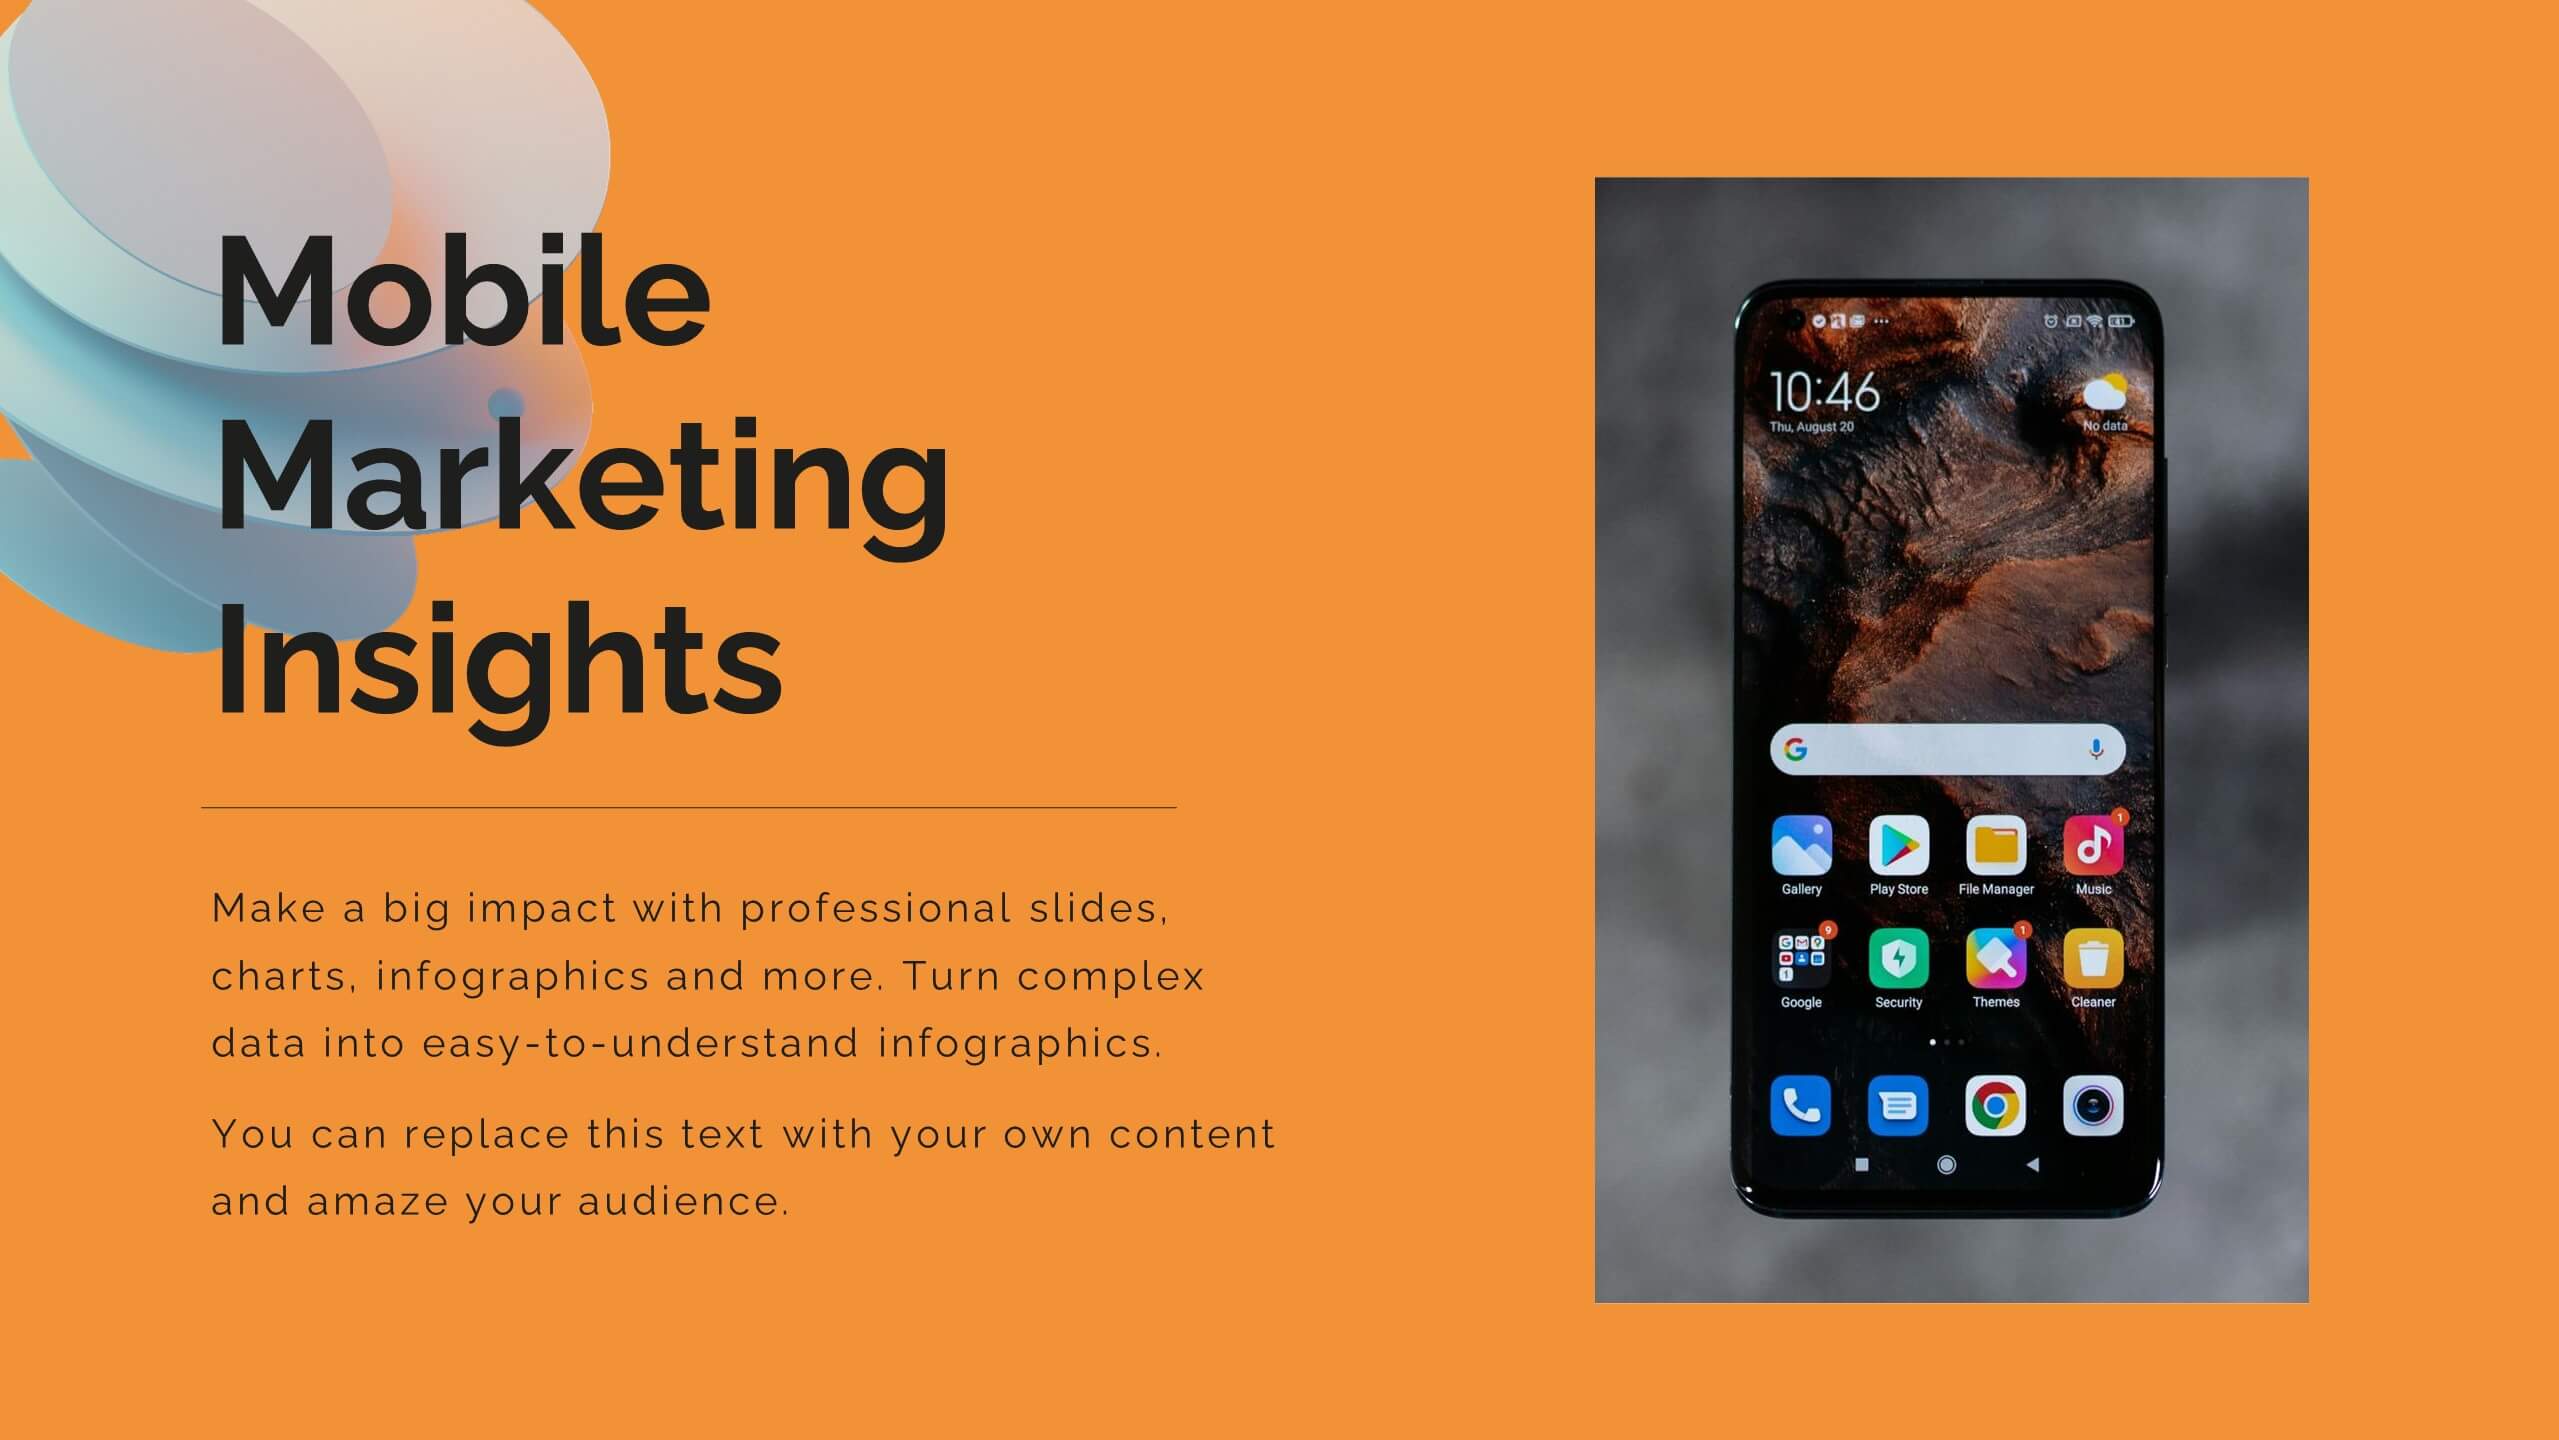
Breeze Content Marketing Pitch Deck Presentation
Elevate your content marketing strategy with this vibrant pitch deck! Perfect for outlining industry trends, consumer behavior, and innovative techniques. Ideal for marketers aiming to impress clients and stakeholders. Compatible with PowerPoint, Keynote, and Google Slides, this template ensures your pitch is engaging, persuasive, and professional. Achieve marketing success today!