


Características


¿Tienes alguna pregunta?
Recomendar


6 diapositivas
Startup Business Validation Plan Presentation
Present your startup’s validation strategy with this structured, color-coded framework. Ideal for mapping business assumptions, customer segments, and testing stages. Includes five top-phase boxes and supporting rows for team input or feedback. Fully editable in PowerPoint, Keynote, or Google Slides—perfect for founders, incubators, or pitch decks.


7 diapositivas
Business Model Canvas Infographic Presentation Template
The Business Model Canvas is a tool for articulating a strategy in the form of a business model for a start-up or existing enterprise. This template provides a visual overview for entrepreneurs and innovators to write about the critical components of their business, from different perspectives. With this template presenting information in graphical format, the Canvas aids communication between business people with different backgrounds and skill sets, helping to align ideas. We created a simple and effective presentation that will help you to grasp the concepts of this tool in a few minutes!


6 diapositivas
Ishikawa Diagram Analysis Presentation
Break down complex problems and identify root causes with this Ishikawa Diagram Analysis template. Ideal for quality control, project management, and strategic planning. Clean, editable design allows easy customization to fit your needs. Compatible with PowerPoint, Keynote, and Google Slides for seamless workflow integration.


6 diapositivas
Deluxe Loyalty Program Infographics
Explore the Deluxe Loyalty Program with our customizable infographic template. This template is fully compatible with popular presentation software like PowerPoint, Keynote, and Google Slides, allowing you to easily customize it to showcase the features, benefits, and advantages of the Deluxe Loyalty Program. The Deluxe Loyalty Program infographic template offers a visually engaging platform to highlight the rewards, incentives, and exclusive offers available to members of the program. Whether you're a business owner, marketer, or customer relations specialist, this template provides a user-friendly canvas to create informative presentations and promotional materials for your loyalty program. Optimize your loyalty program's visibility and appeal with this SEO-optimized infographic template, thoughtfully designed for clarity and ease of use. Customize it to showcase program tiers, benefits, points accumulation, and member testimonials, ensuring that your audience understands the value of participating in the Deluxe Loyalty Program. Start crafting your personalized infographic today to promote customer loyalty and engagement effectively.


21 diapositivas
Flamelore Agile Project Plan Presentation
Organize and deliver your Agile Project Plan seamlessly with this dynamic presentation template. Designed to align with Agile principles, it features a comprehensive structure covering objectives, scope of work, and key deliverables. The template helps you outline a detailed project timeline and budget breakdown to keep stakeholders informed. Illustrate complex information with visual aids such as pyramids, charts, and process diagrams, making data interpretation effortless. Highlight team members, their roles, and responsibilities to foster transparency and accountability. With slides dedicated to risk assessment and evaluation criteria, you can confidently navigate potential challenges. This fully editable template works across PowerPoint, Google Slides, and Keynote, providing flexibility and a polished design for project managers, teams, and business professionals. Whether you're pitching to stakeholders or aligning your team, this Agile framework ensures clear communication and actionable steps.


10 diapositivas
Startup Pitch Deck Presentation
Make your big idea impossible to ignore with a sleek, investor-ready design that tells your startup’s story with clarity and confidence. This presentation helps you outline your vision, market potential, and business strategy in a compelling way. Fully compatible with PowerPoint, Keynote, and Google Slides for effortless customization.


7 diapositivas
E-Learning Tools Infographic Presentation
E-learning refers to any type of learning that occurs through electronic devices, and offers numerous benefits, including flexibility, cost-effectiveness, continuous learning, and environmental friendliness. This E-Learning Template is designed to make your online training and educational material more engaging and effective. The template is fully customizable and compatible with presentation software such as Powerpoint, Keynote, and Google Slides. This template is a powerful tool for anyone who wants to create engaging and effective online training and educational material!


5 diapositivas
Corporate Strategic Planning Presentation
Create a winning strategy with this corporate strategic planning template. Designed for business leaders, it helps structure goals, initiatives, and key performance areas in a clear, visual format. Ideal for strategic decision-making and long-term planning. Fully customizable and compatible with PowerPoint, Keynote, and Google Slides for seamless editing and presentation.


22 diapositivas
Eclipser Qualitative Research Findings Presentation
This Qualitative Research Findings Presentation is designed to effectively showcase research insights with a clean and modern layout. It covers key areas such as research objectives, methodology, data analysis, findings, and recommendations. Fully customizable and compatible with PowerPoint, Keynote, and Google Slides for seamless editing and professional results.
5 diapositivas
PM Milestone Planning and Tracking Layout Presentation
Track your project progress with clarity using the PM Milestone Planning and Tracking Layout Presentation. This curved arrow timeline visually guides stakeholders through five key stages of your project plan, highlighting each milestone with clear labels. Fully editable in Canva, PowerPoint, Keynote, and Google Slides for flexible use.


6 diapositivas
3D Technologies Infographics
Dive into the world of 3D Technologies with our customizable infographic template. This template is fully compatible with popular presentation software like PowerPoint, Keynote, and Google Slides, allowing you to easily customize it to showcase various aspects and applications of 3D technologies. The 3D Technologies infographic template provides a visually engaging platform to explore and explain the world of three-dimensional technology, from 3D printing and modeling to virtual reality and augmented reality. Whether you're an enthusiast, educator, or industry professional, this template offers a user-friendly canvas to create informative presentations and educational materials. Elevate your understanding of 3D Technologies with this SEO-optimized infographic template, thoughtfully designed for clarity and ease of use. Customize it to highlight the key principles, applications, and innovations within the 3D technology landscape, making complex concepts accessible to your audience. Start crafting your personalized infographic today to delve into the exciting realm of 3D Technologies.


4 diapositivas
Business Executive Summary Report
Get straight to the point with a clean, colorful slide designed to capture big-picture business insights at a glance. Perfect for summarizing key metrics, strategies, and results, this executive summary template keeps your presentation sharp, structured, and impactful. Fully compatible with PowerPoint, Keynote, and Google Slides for maximum flexibility.


6 diapositivas
Customer Journey Map Presentation
Visualize the customer experience step-by-step with the Customer Journey Map Presentation. This sleek infographic helps you outline key touchpoints from awareness to post-purchase, making it ideal for marketing strategies, service design, or UX presentations. Fully editable and compatible with PowerPoint, Keynote, and Google Slides.


5 diapositivas
Modern Home Layout Slides Presentation
Give your design ideas a modern edge with this clean, architectural presentation. Perfect for showcasing home layouts, interior concepts, or real estate projects, it combines structure and creativity to keep viewers engaged. Fully customizable and compatible with PowerPoint, Keynote, and Google Slides for effortless editing and professional delivery.


4 diapositivas
Property Investment Pitch Deck Presentation
Impress investors with a sleek and confident presentation designed to highlight property opportunities and market growth. This professional layout helps you showcase financial insights, projections, and investment strategies with clarity and style. Fully customizable and compatible with PowerPoint, Keynote, and Google Slides for effortless editing and impactful delivery.


5 diapositivas
Global Warming Activism Infographics
Dive into environmental advocacy with the global warming activism infographics template, steeped in earthy tones of green and brown, reflecting our planet's natural palette. This vertical collection, abundant with nature and animal-themed elements, is a tool for activists, and NGOs driving change. It melds visuals with stark realities, using striking graphics, icons, and adaptable image placeholders to spotlight climate change's impacts and the urgent strides needed for ecological preservation. Compatible with Powerpoint, Keynote, and Google Slides. By simplifying complex information, it empowers community engagement and fosters a united front for global healing efforts.

22 diapositivas
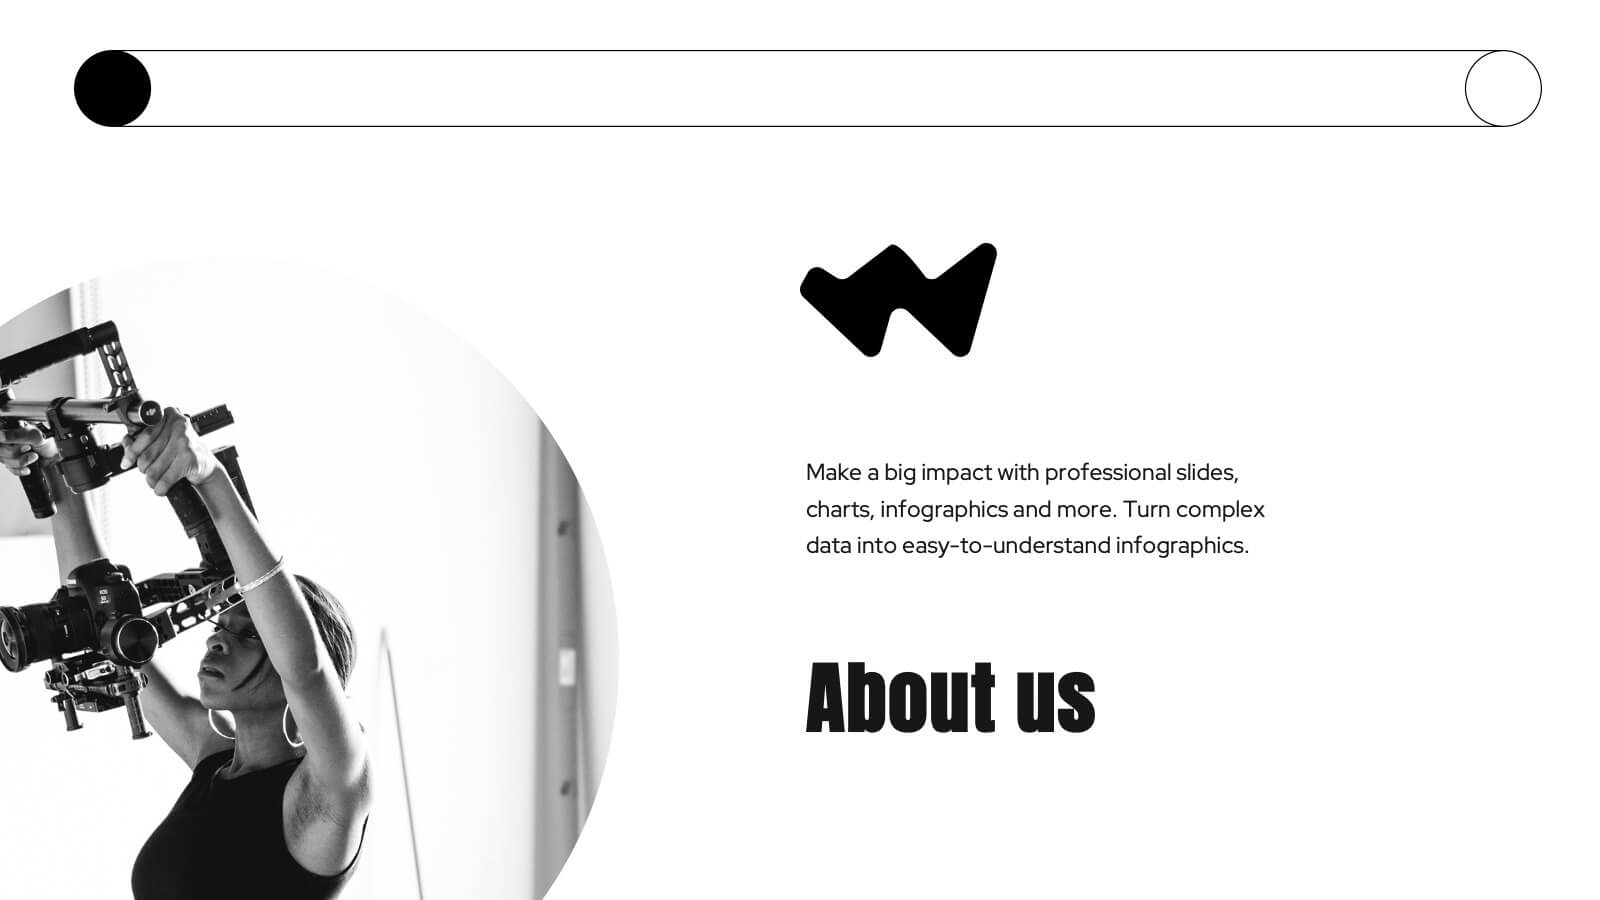
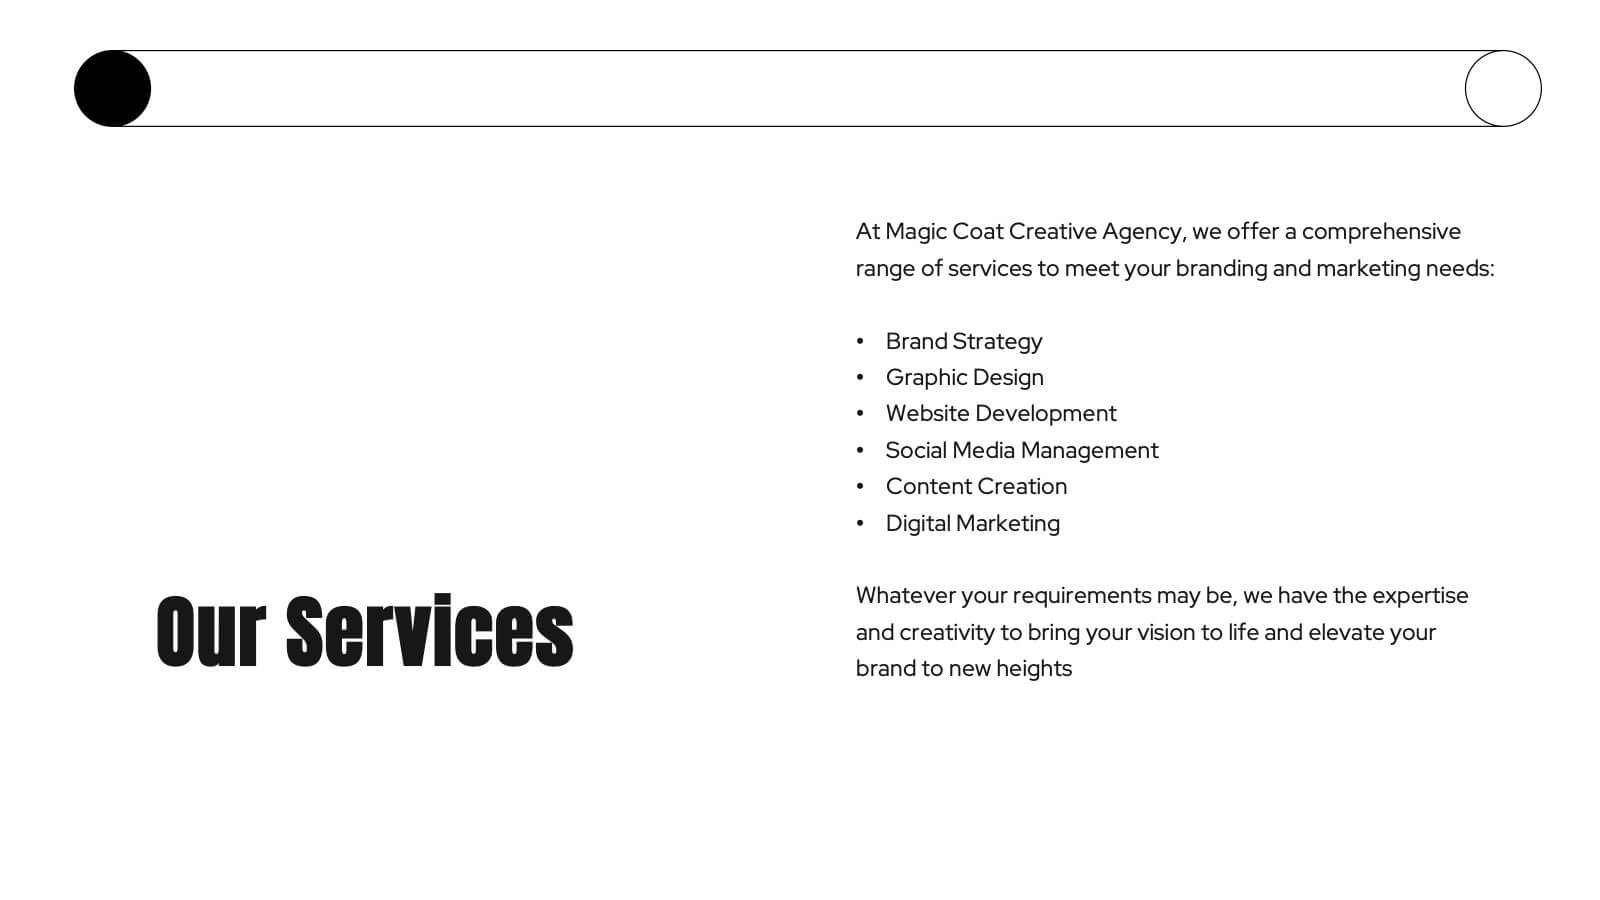
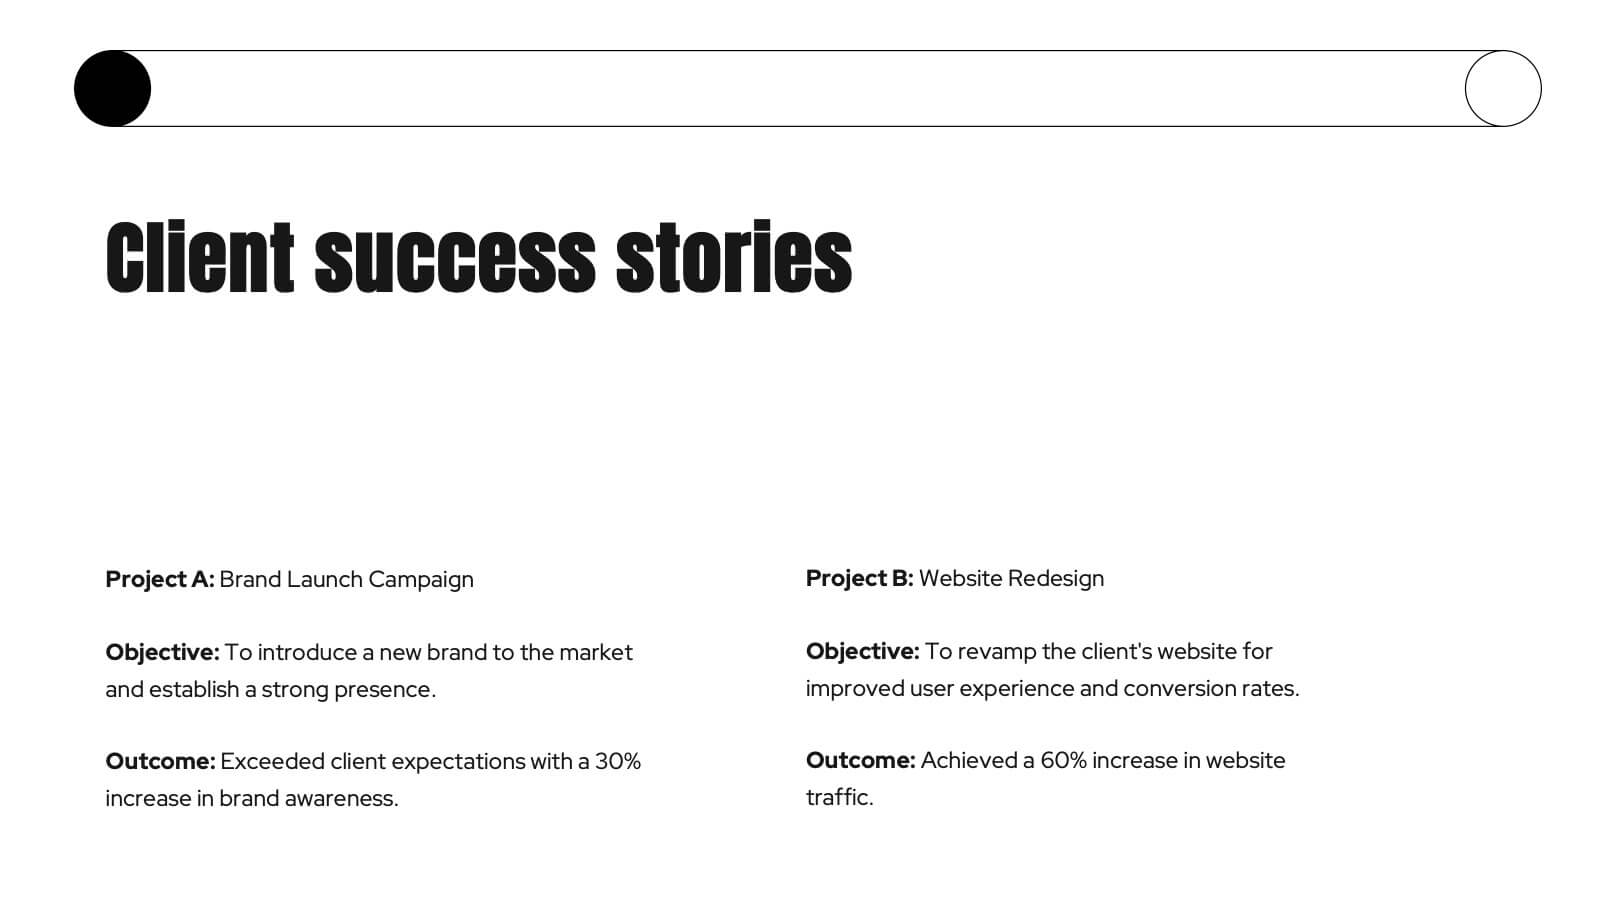
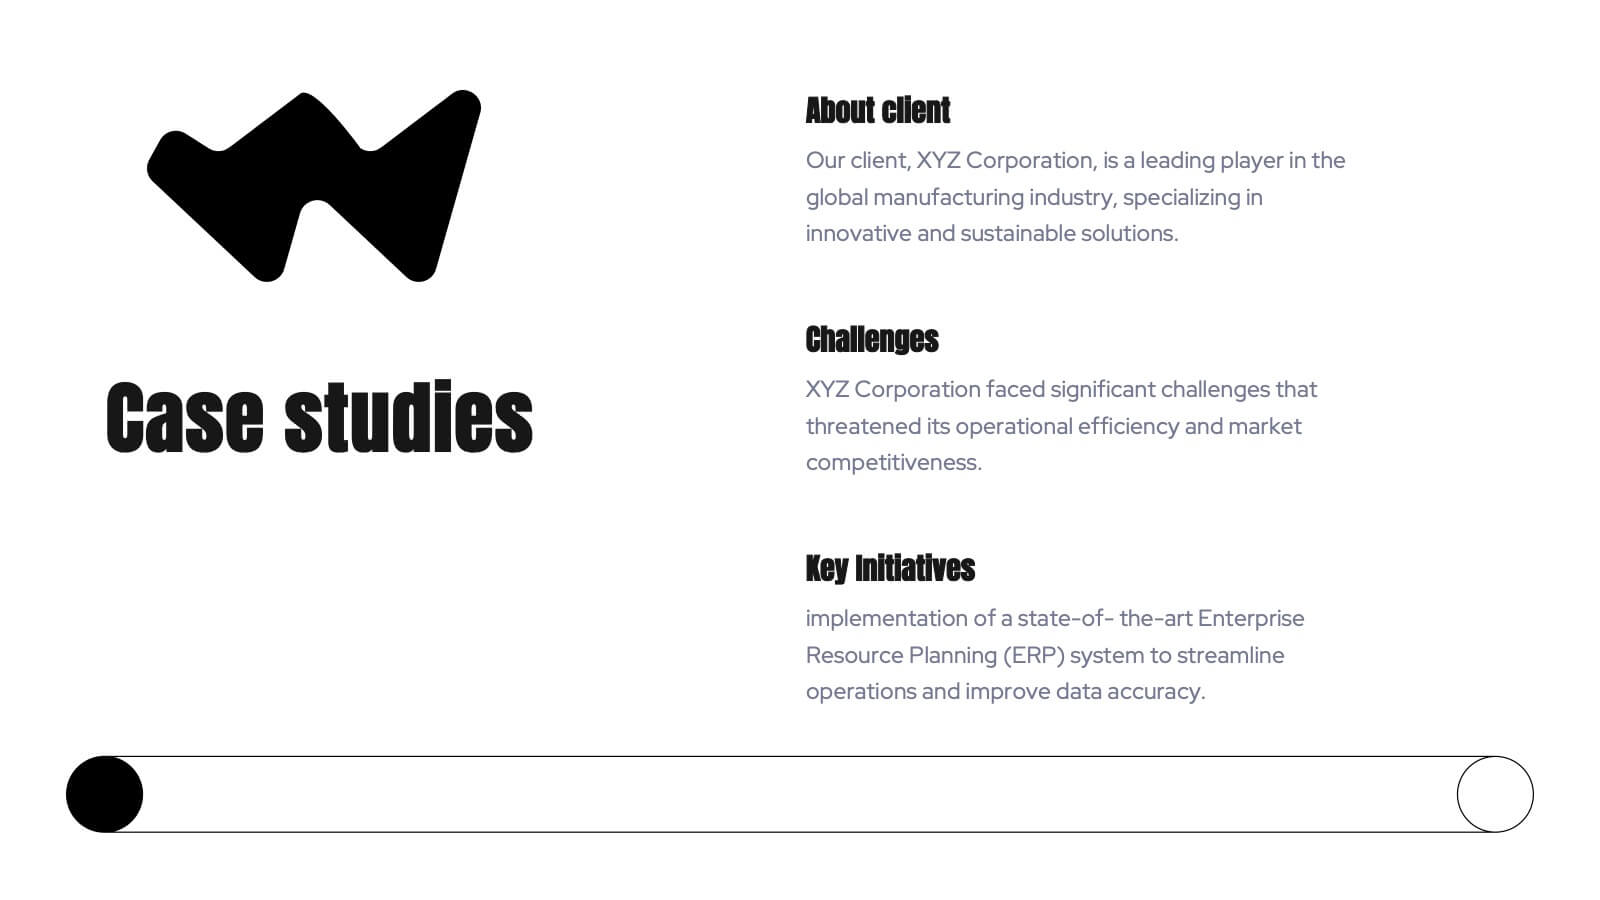
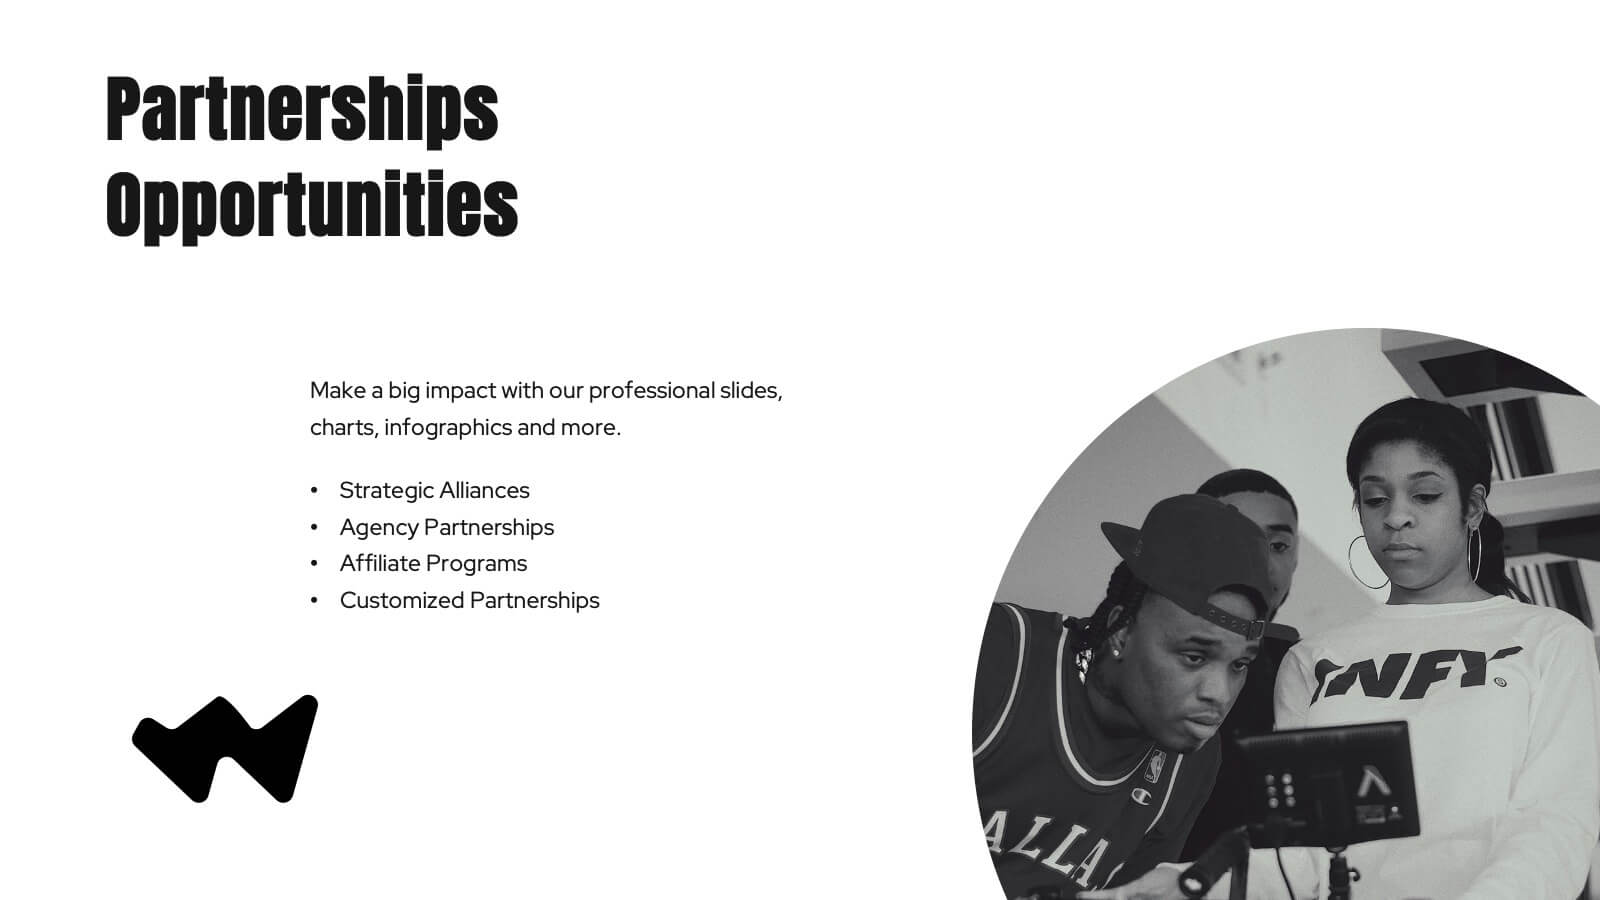
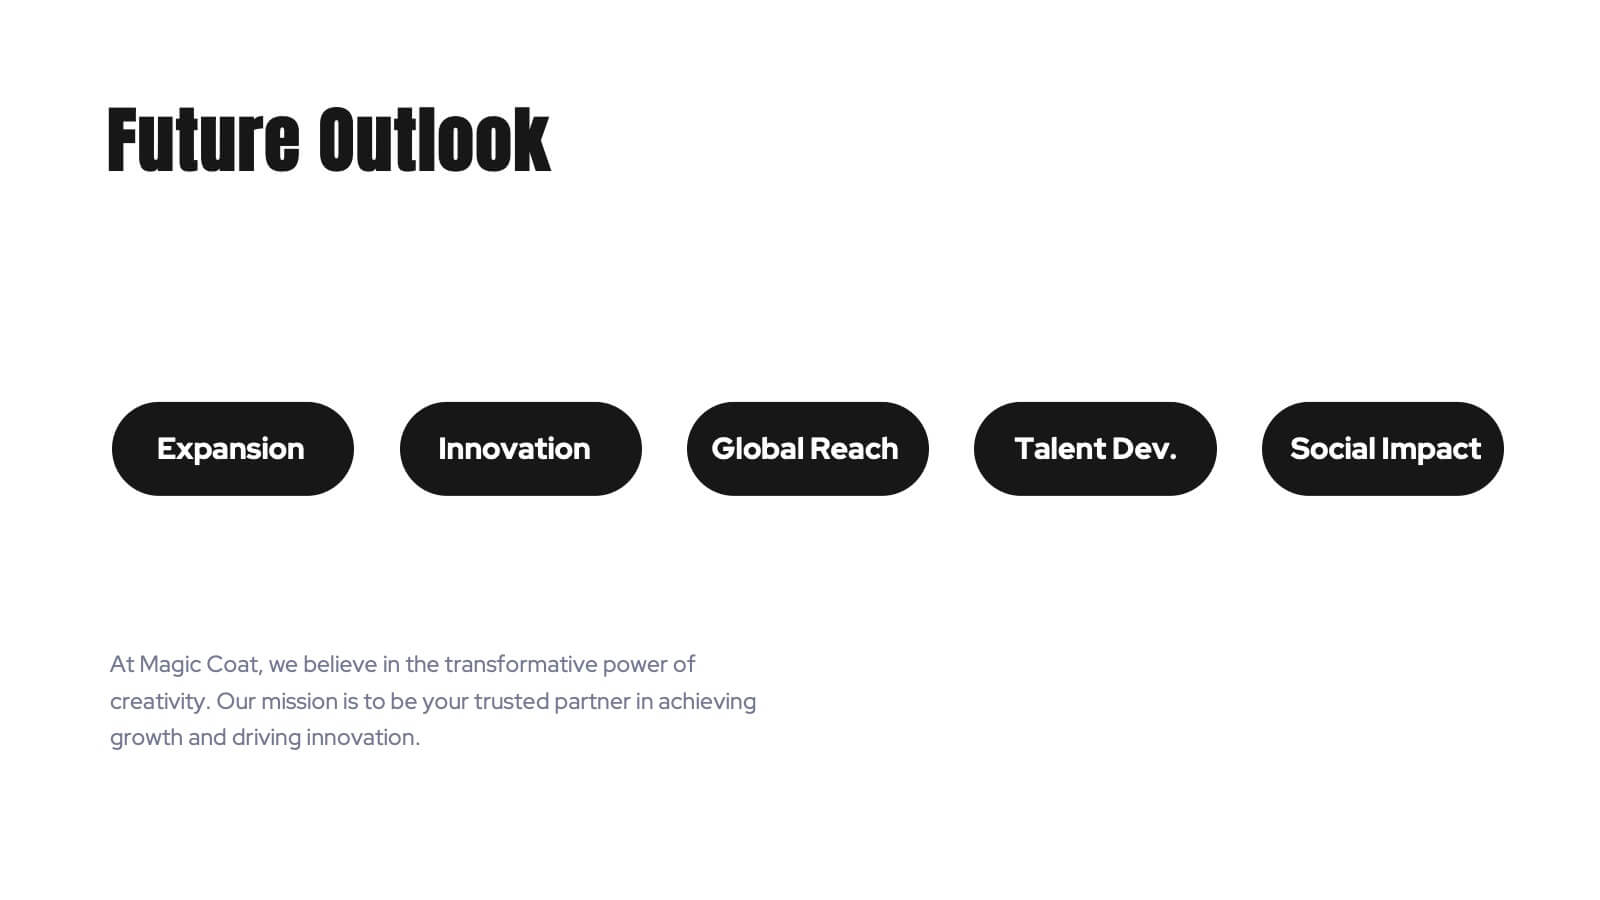
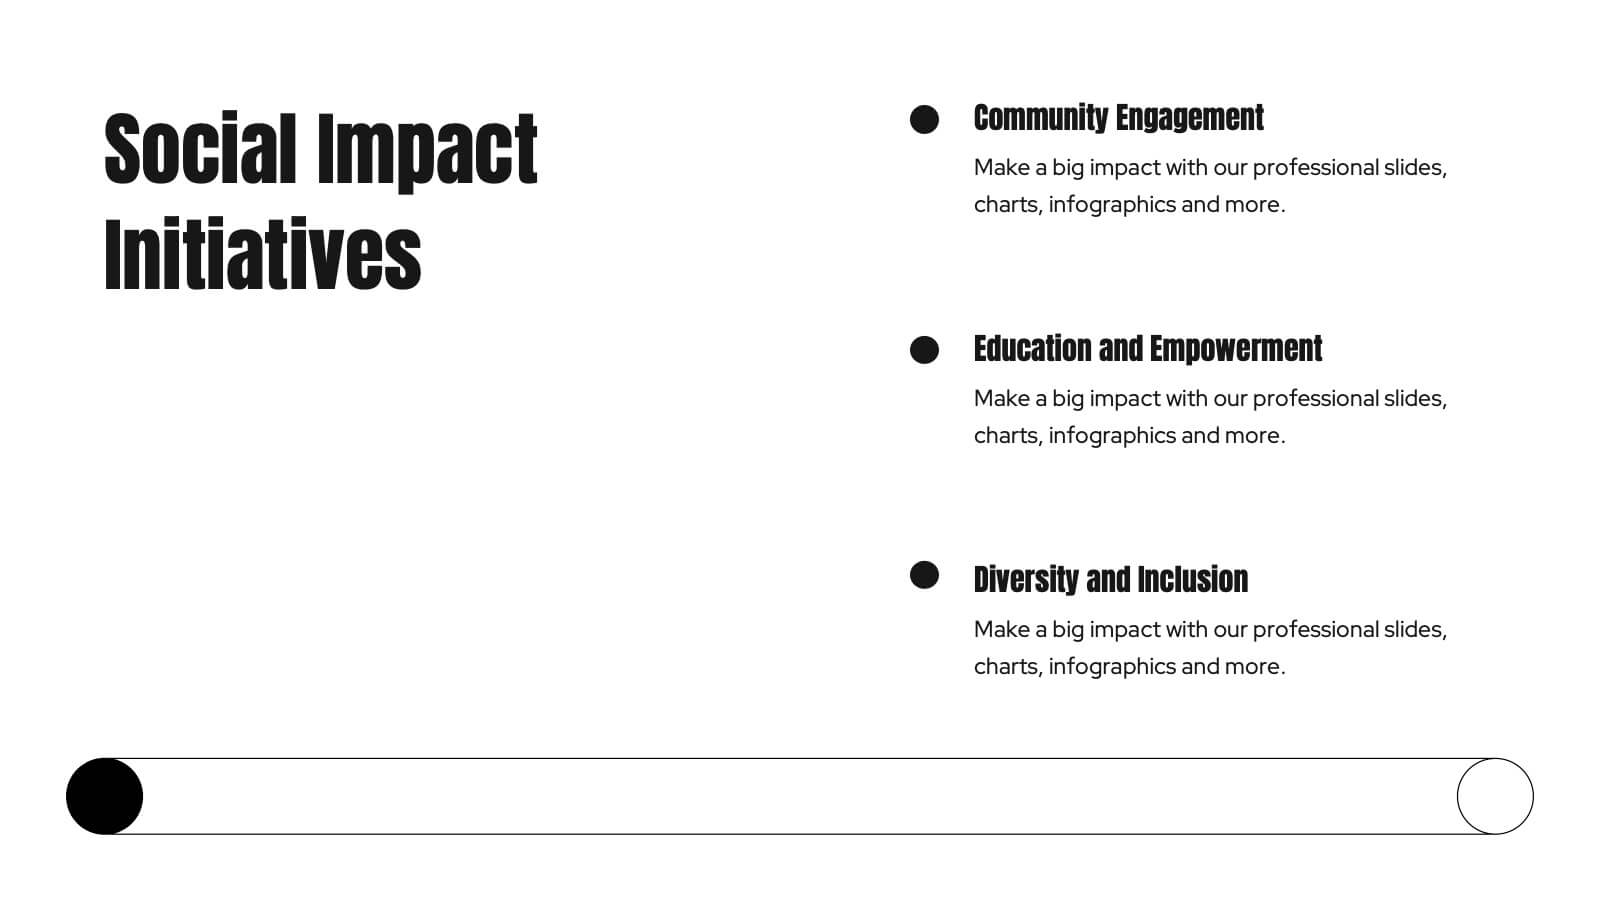
Kraken Agency Portfolio Presentation
This agency portfolio template showcases your agency's work and expertise with a sleek, modern design. It features slides for client success stories, case studies, services, market analysis, and creative process. Perfect for demonstrating your team’s skills and approach. Compatible with PowerPoint, Keynote, and Google Slides for easy customization and presentation.