


Características


¿Tienes alguna pregunta?
Recomendar

21 diapositivas
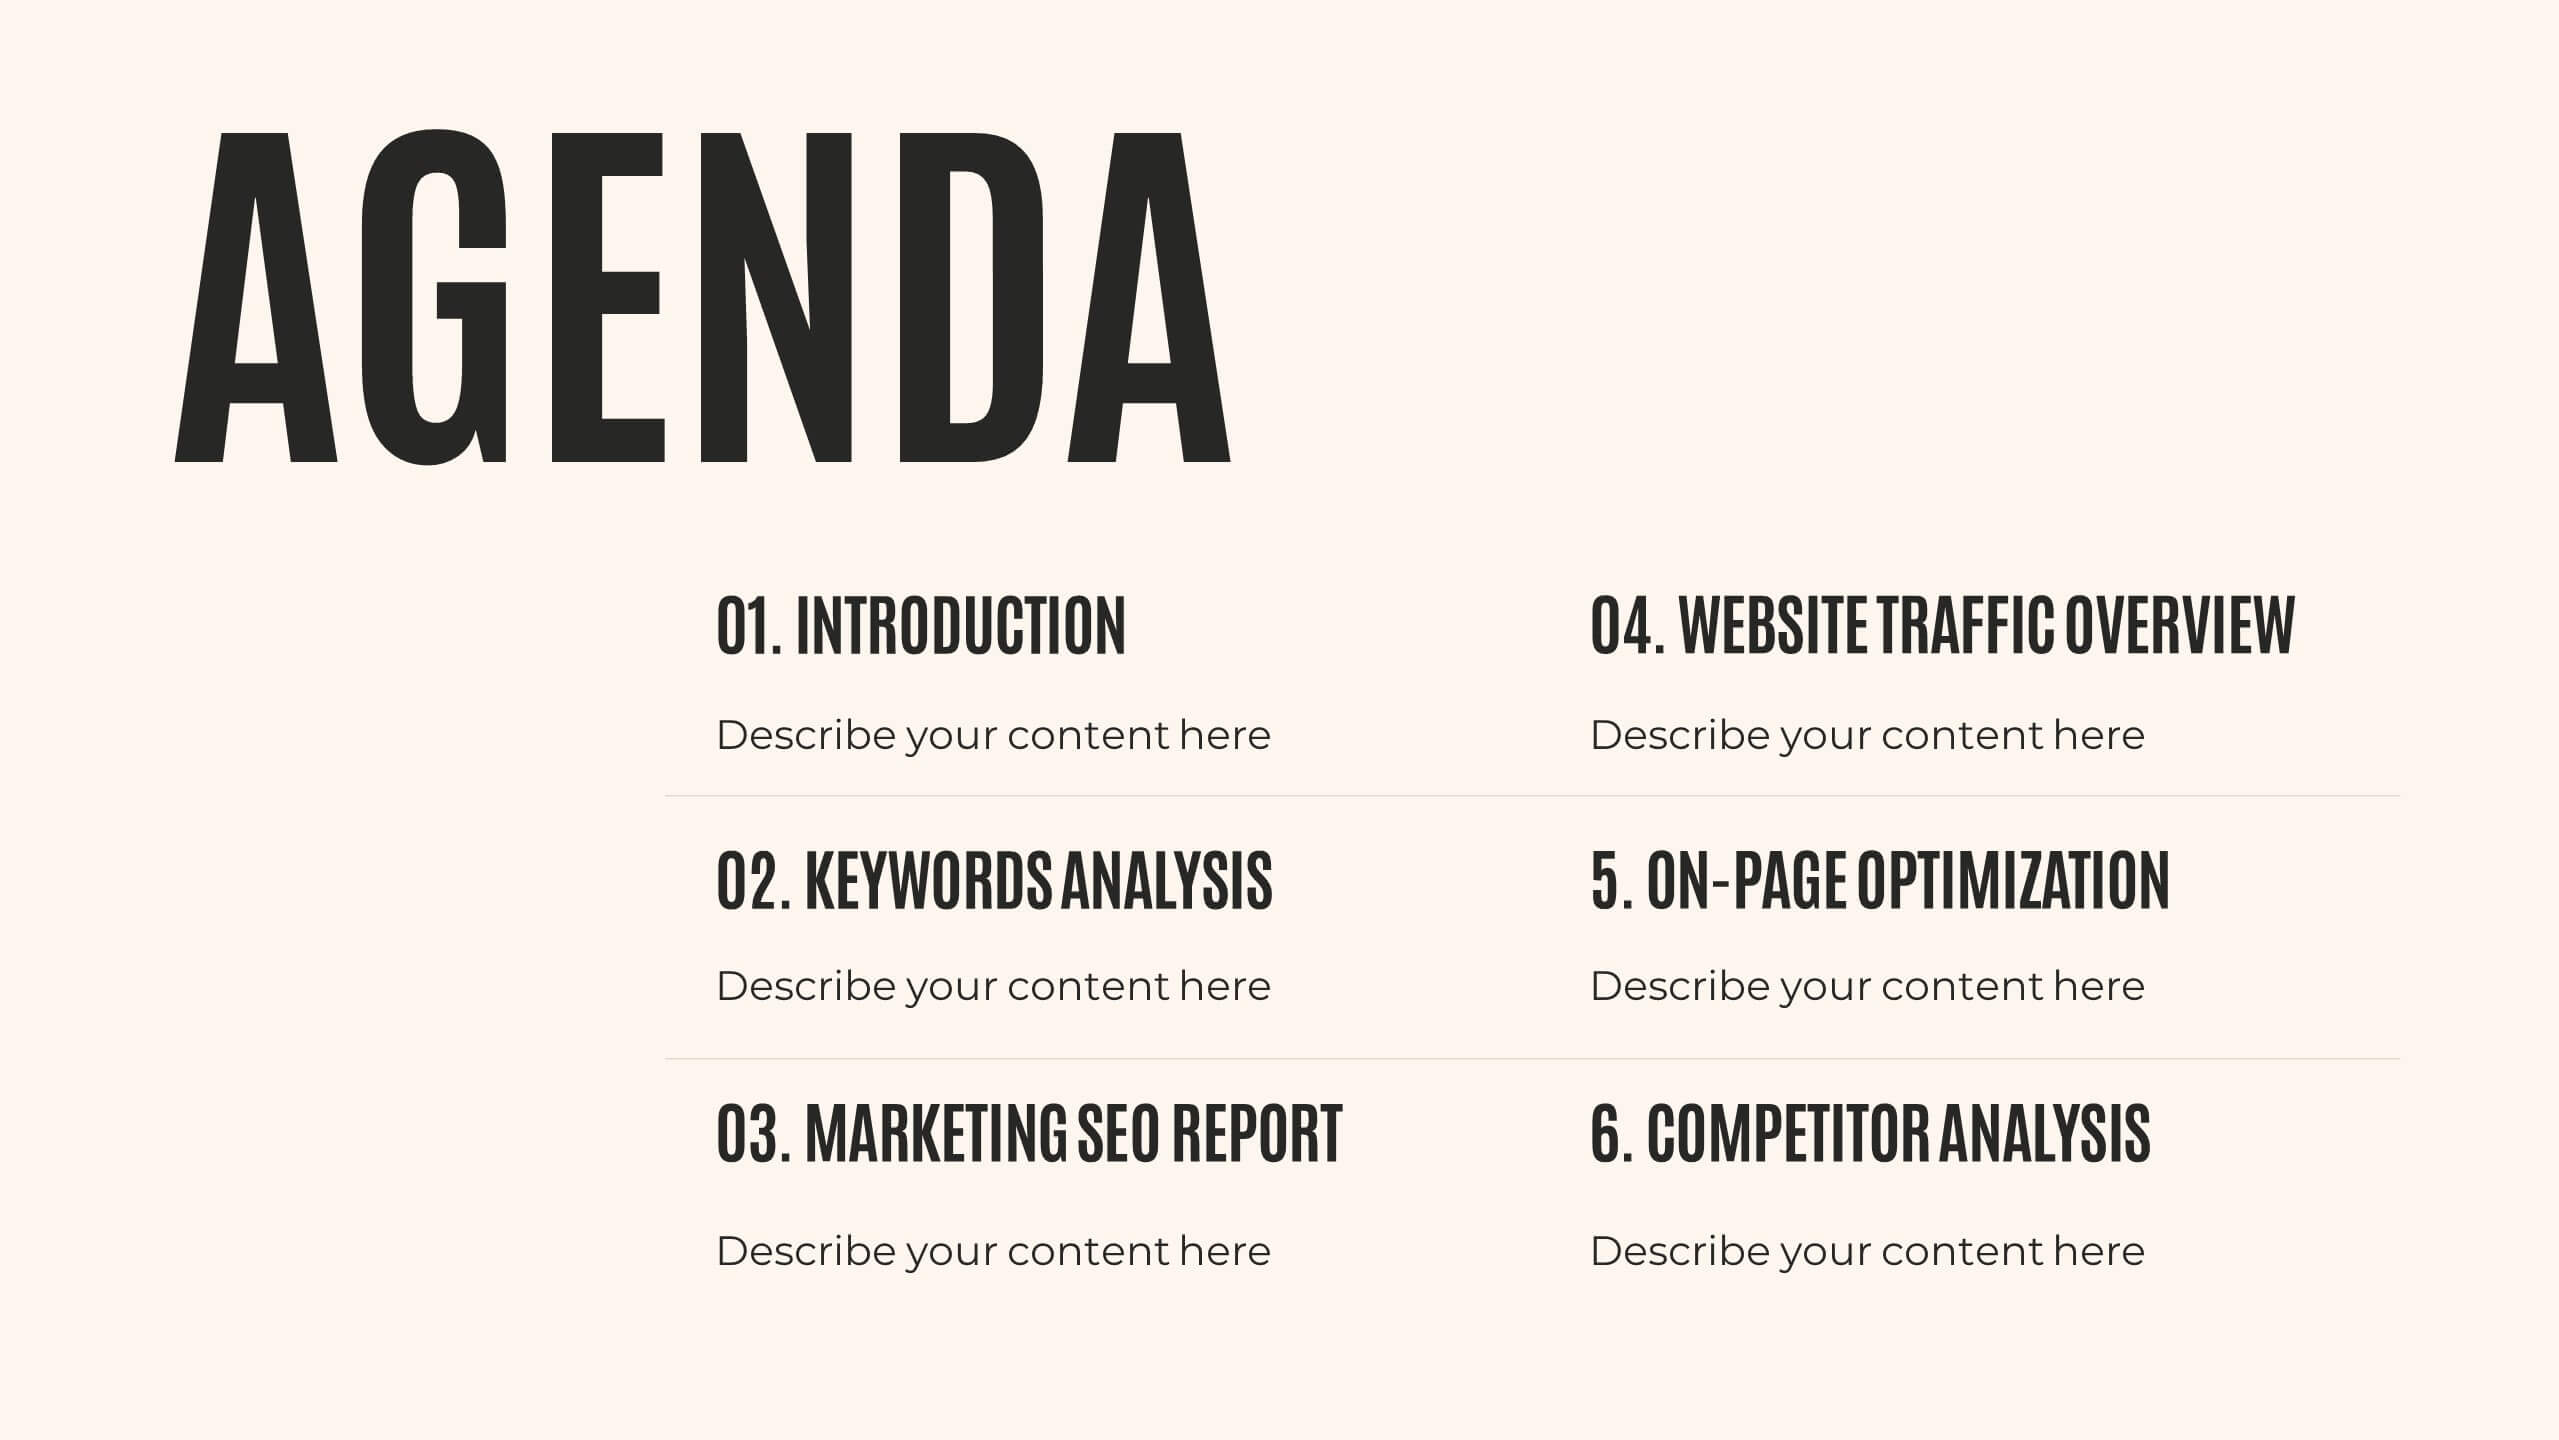
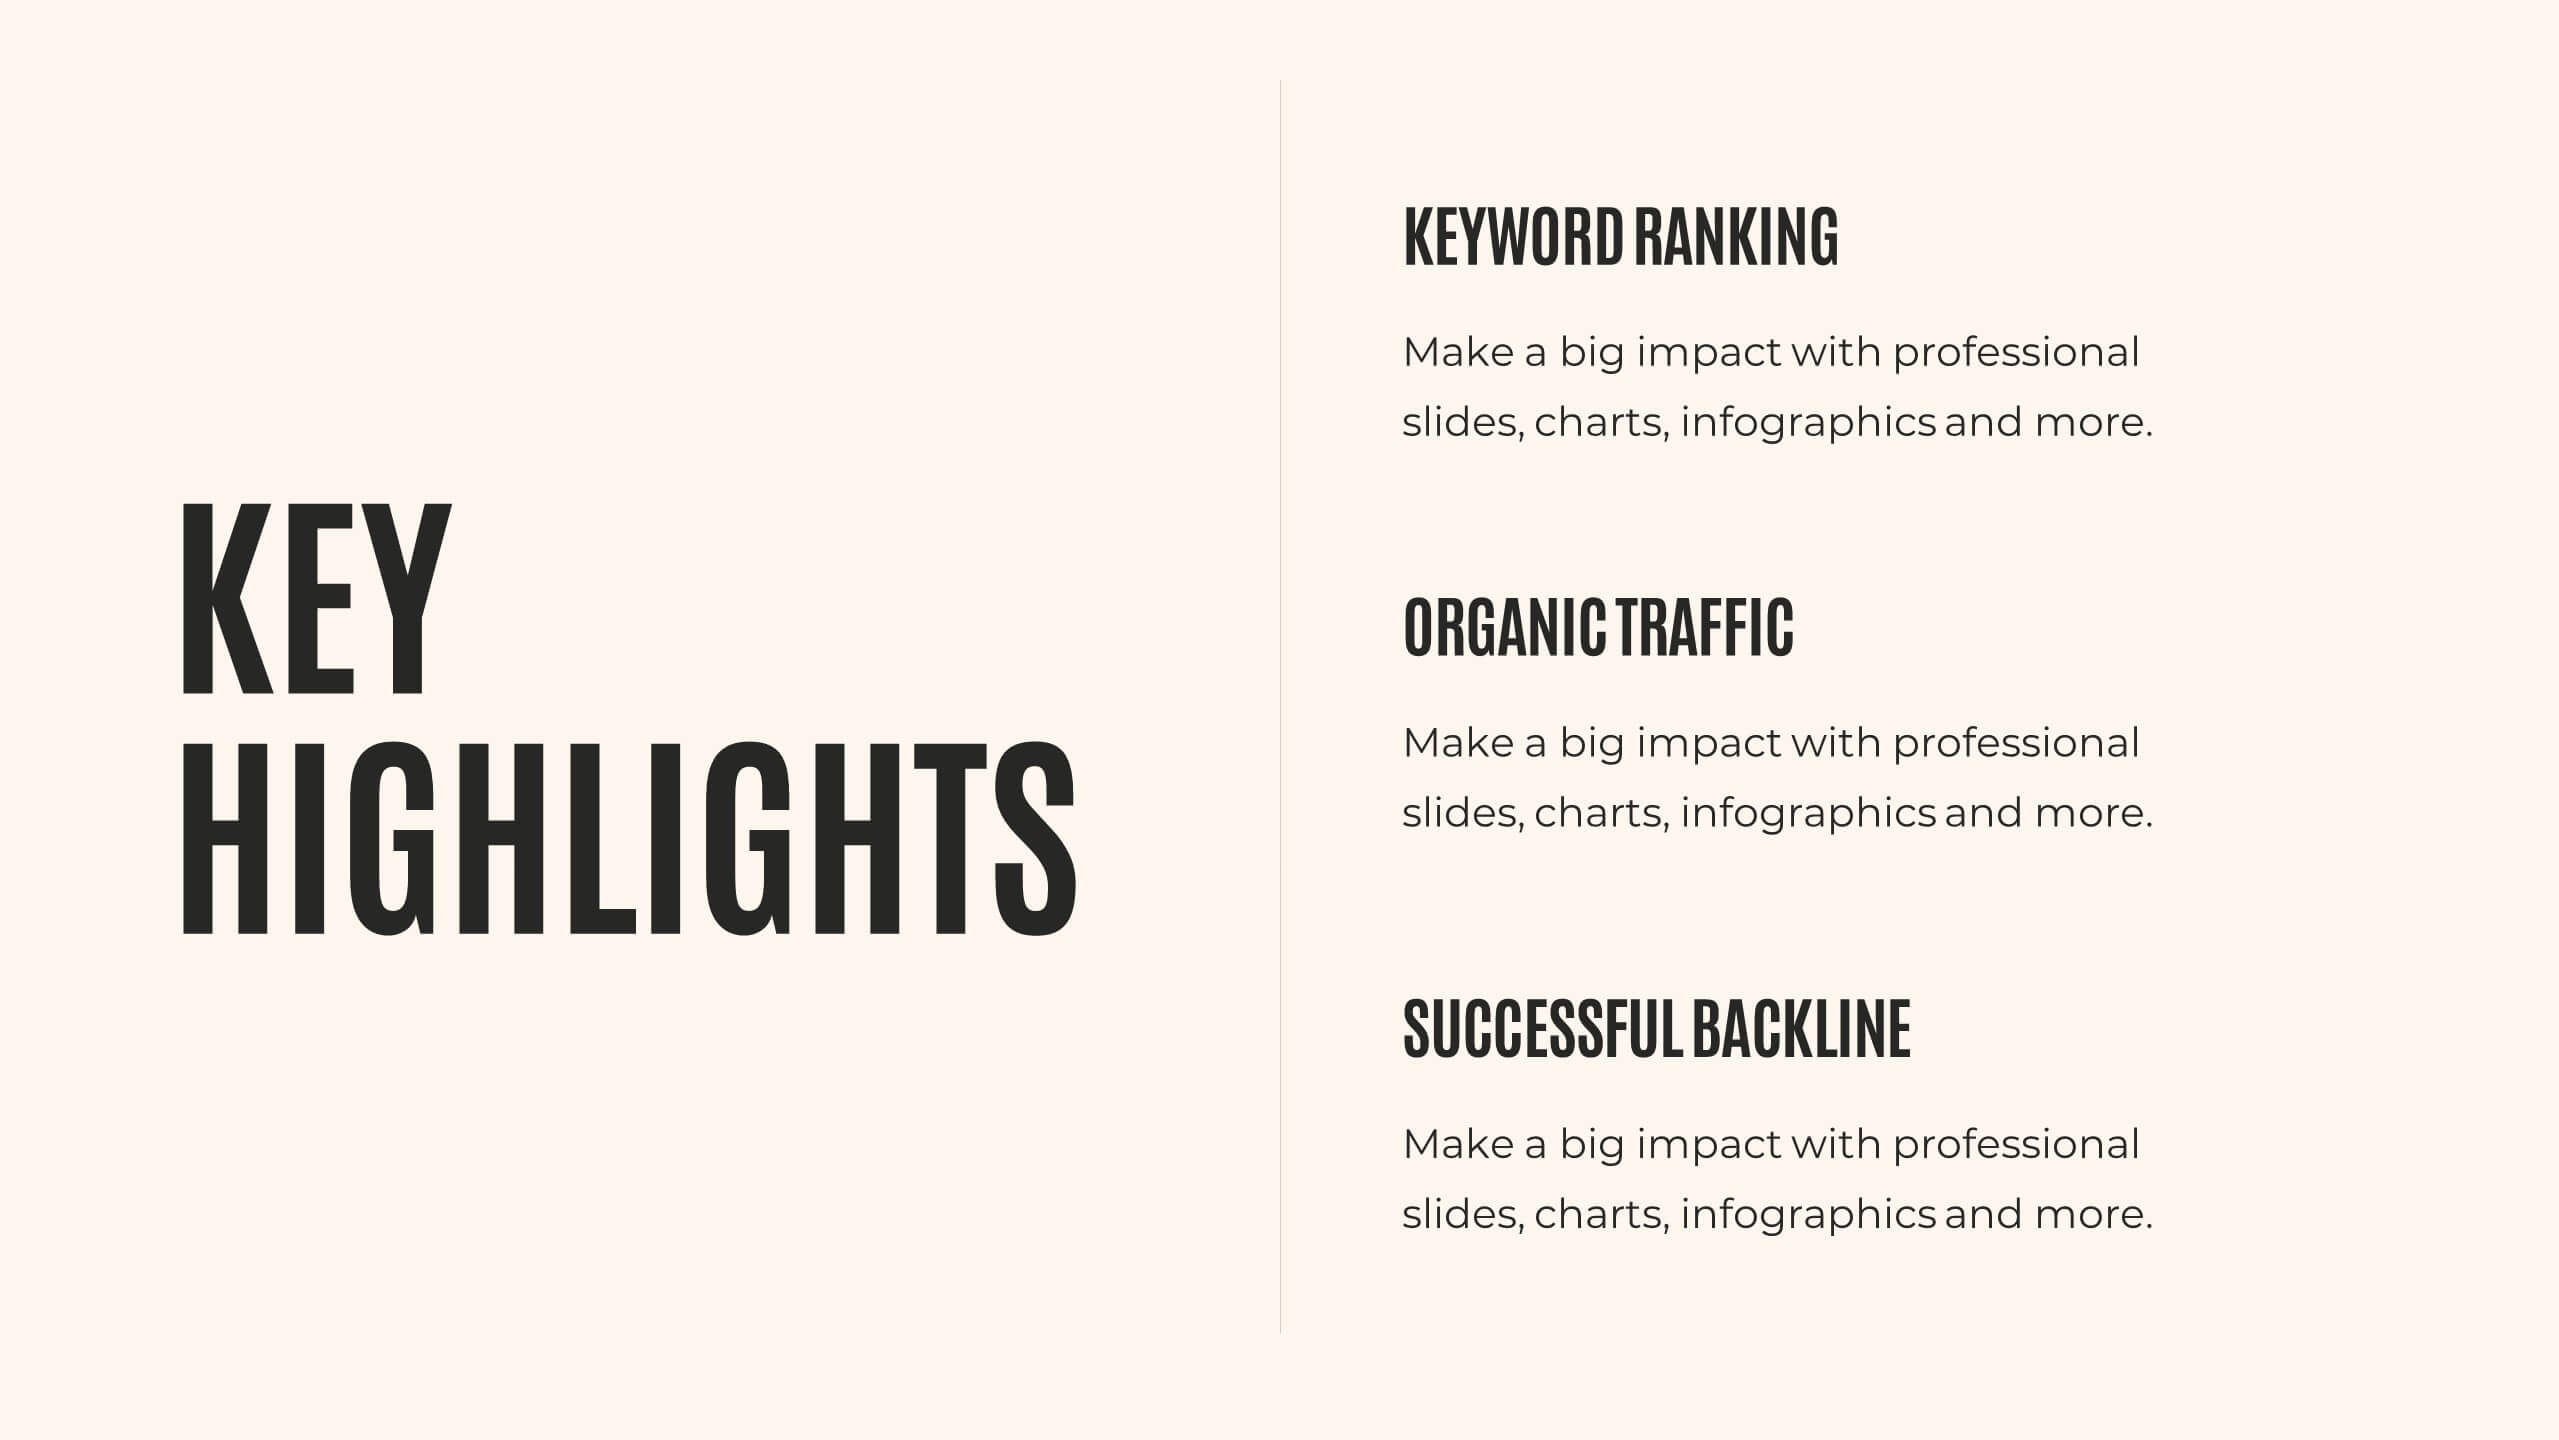
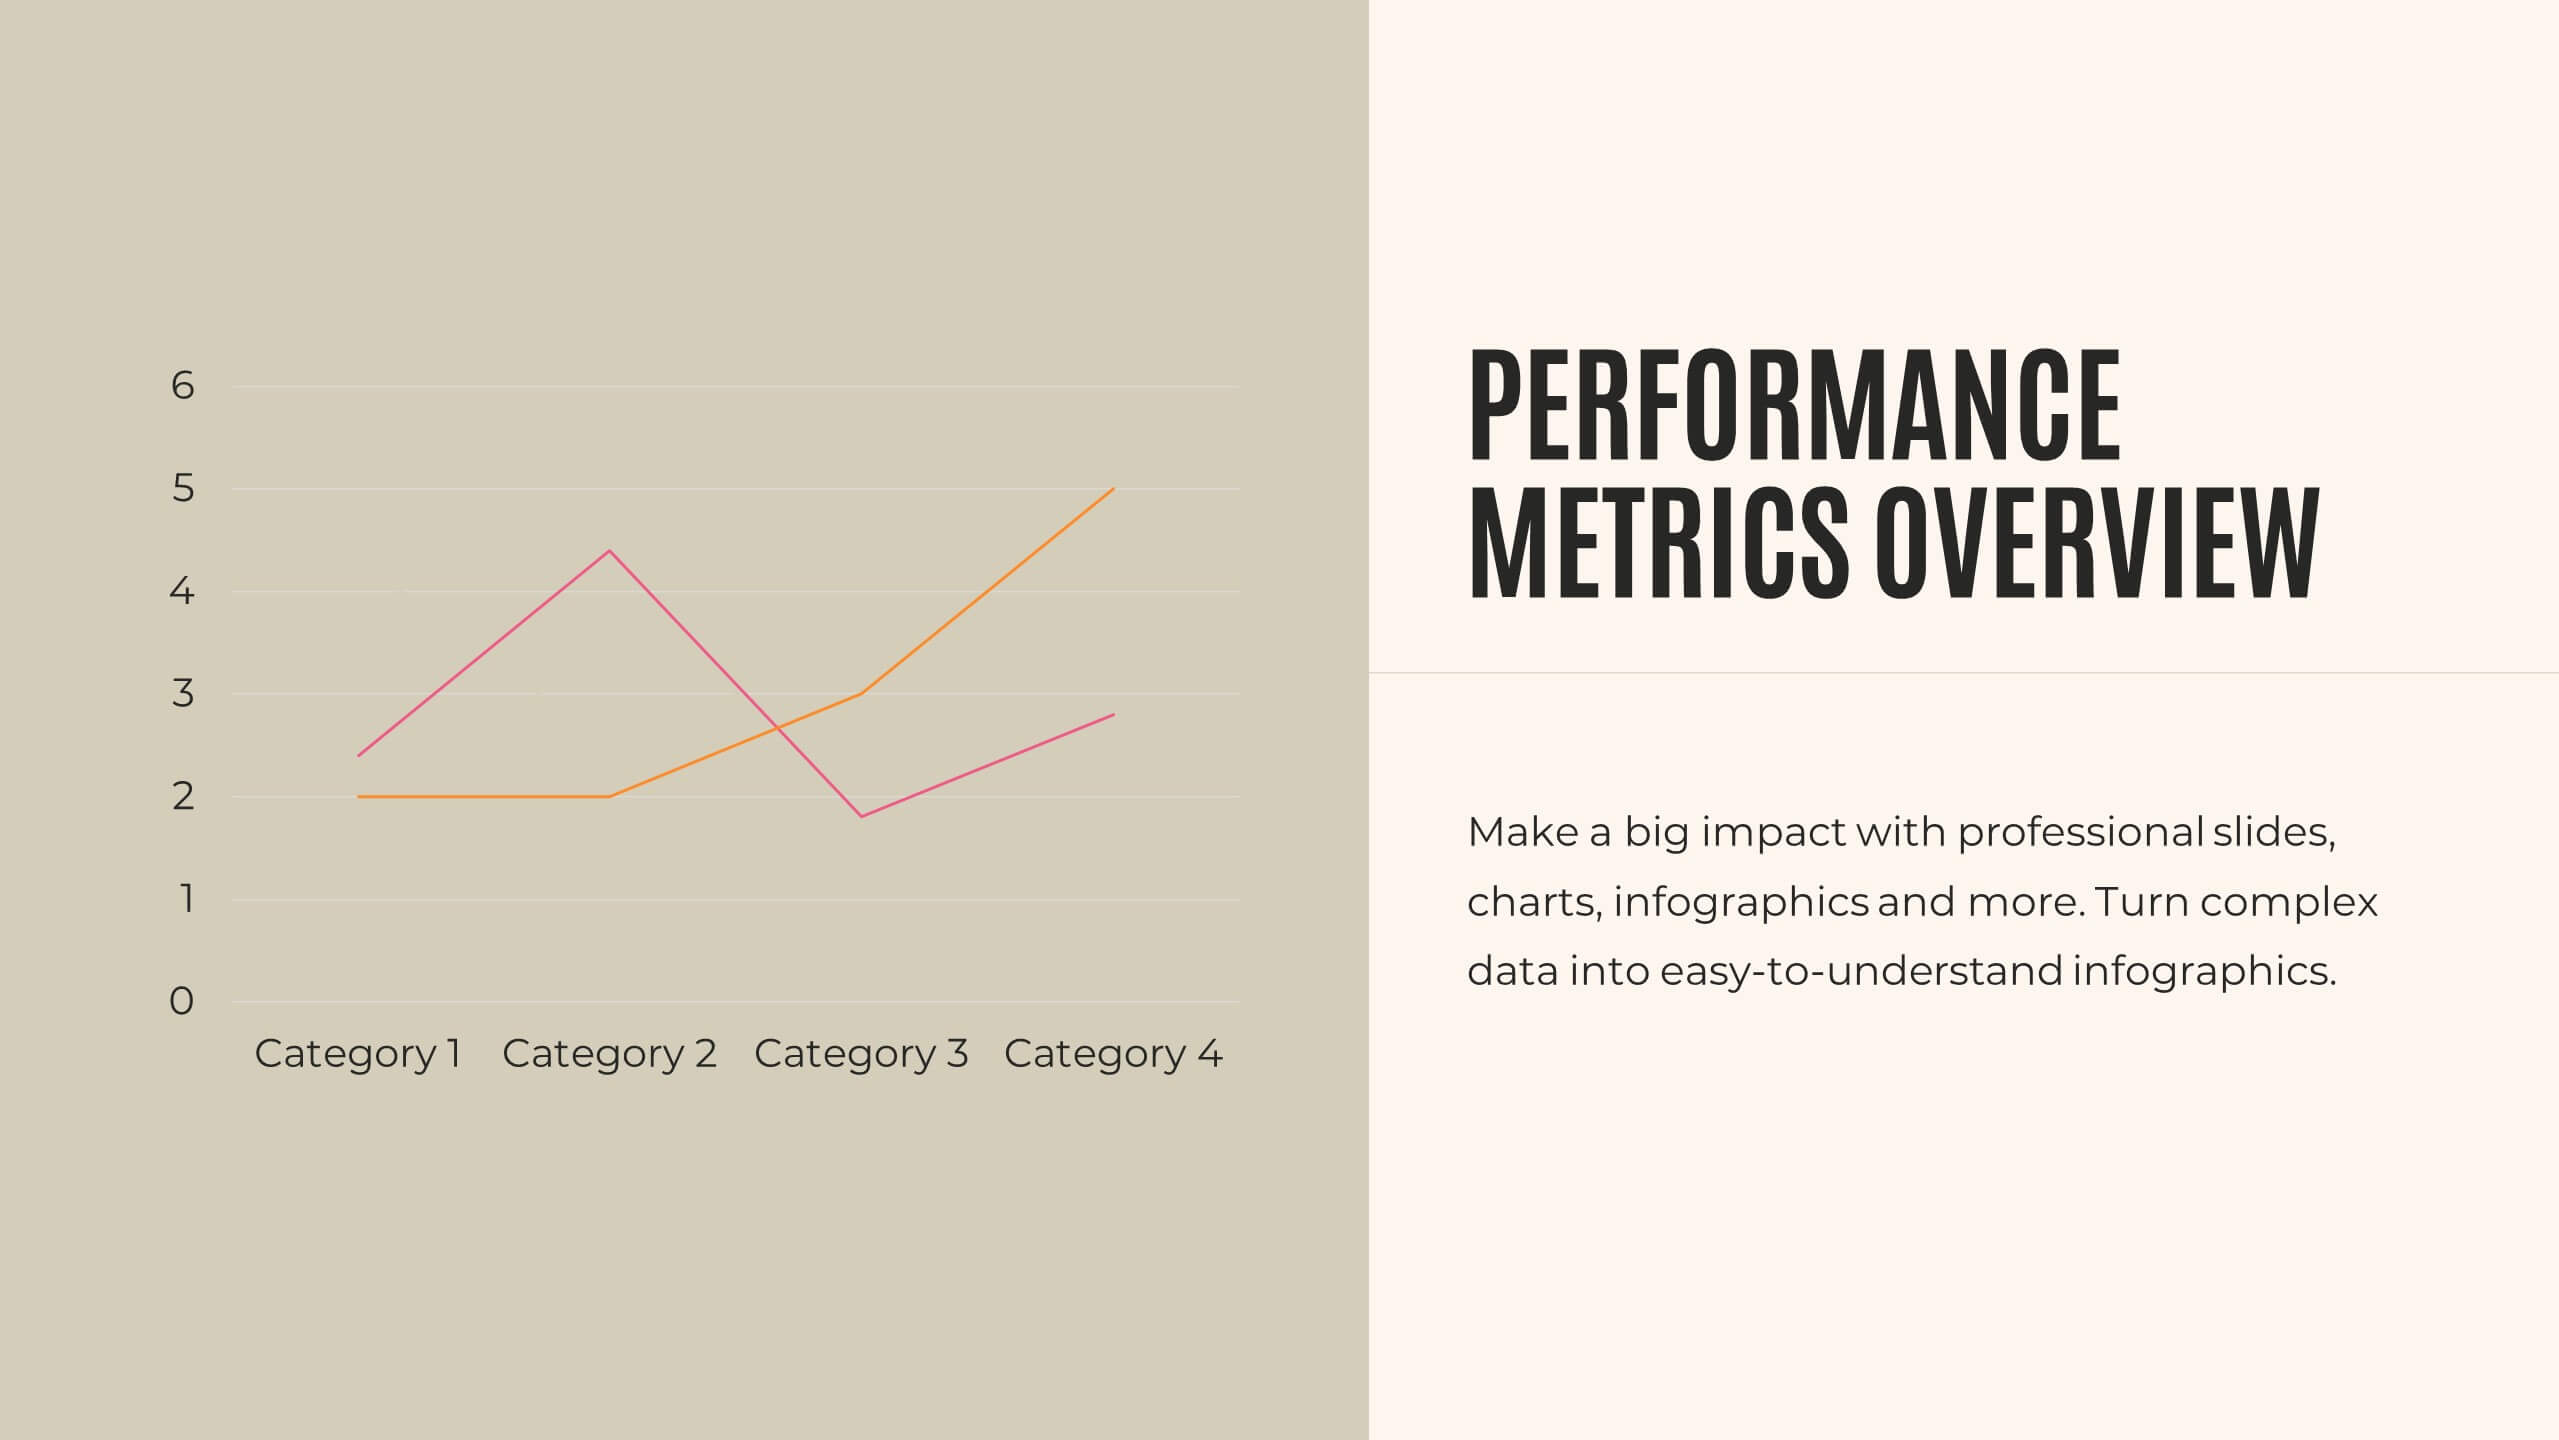
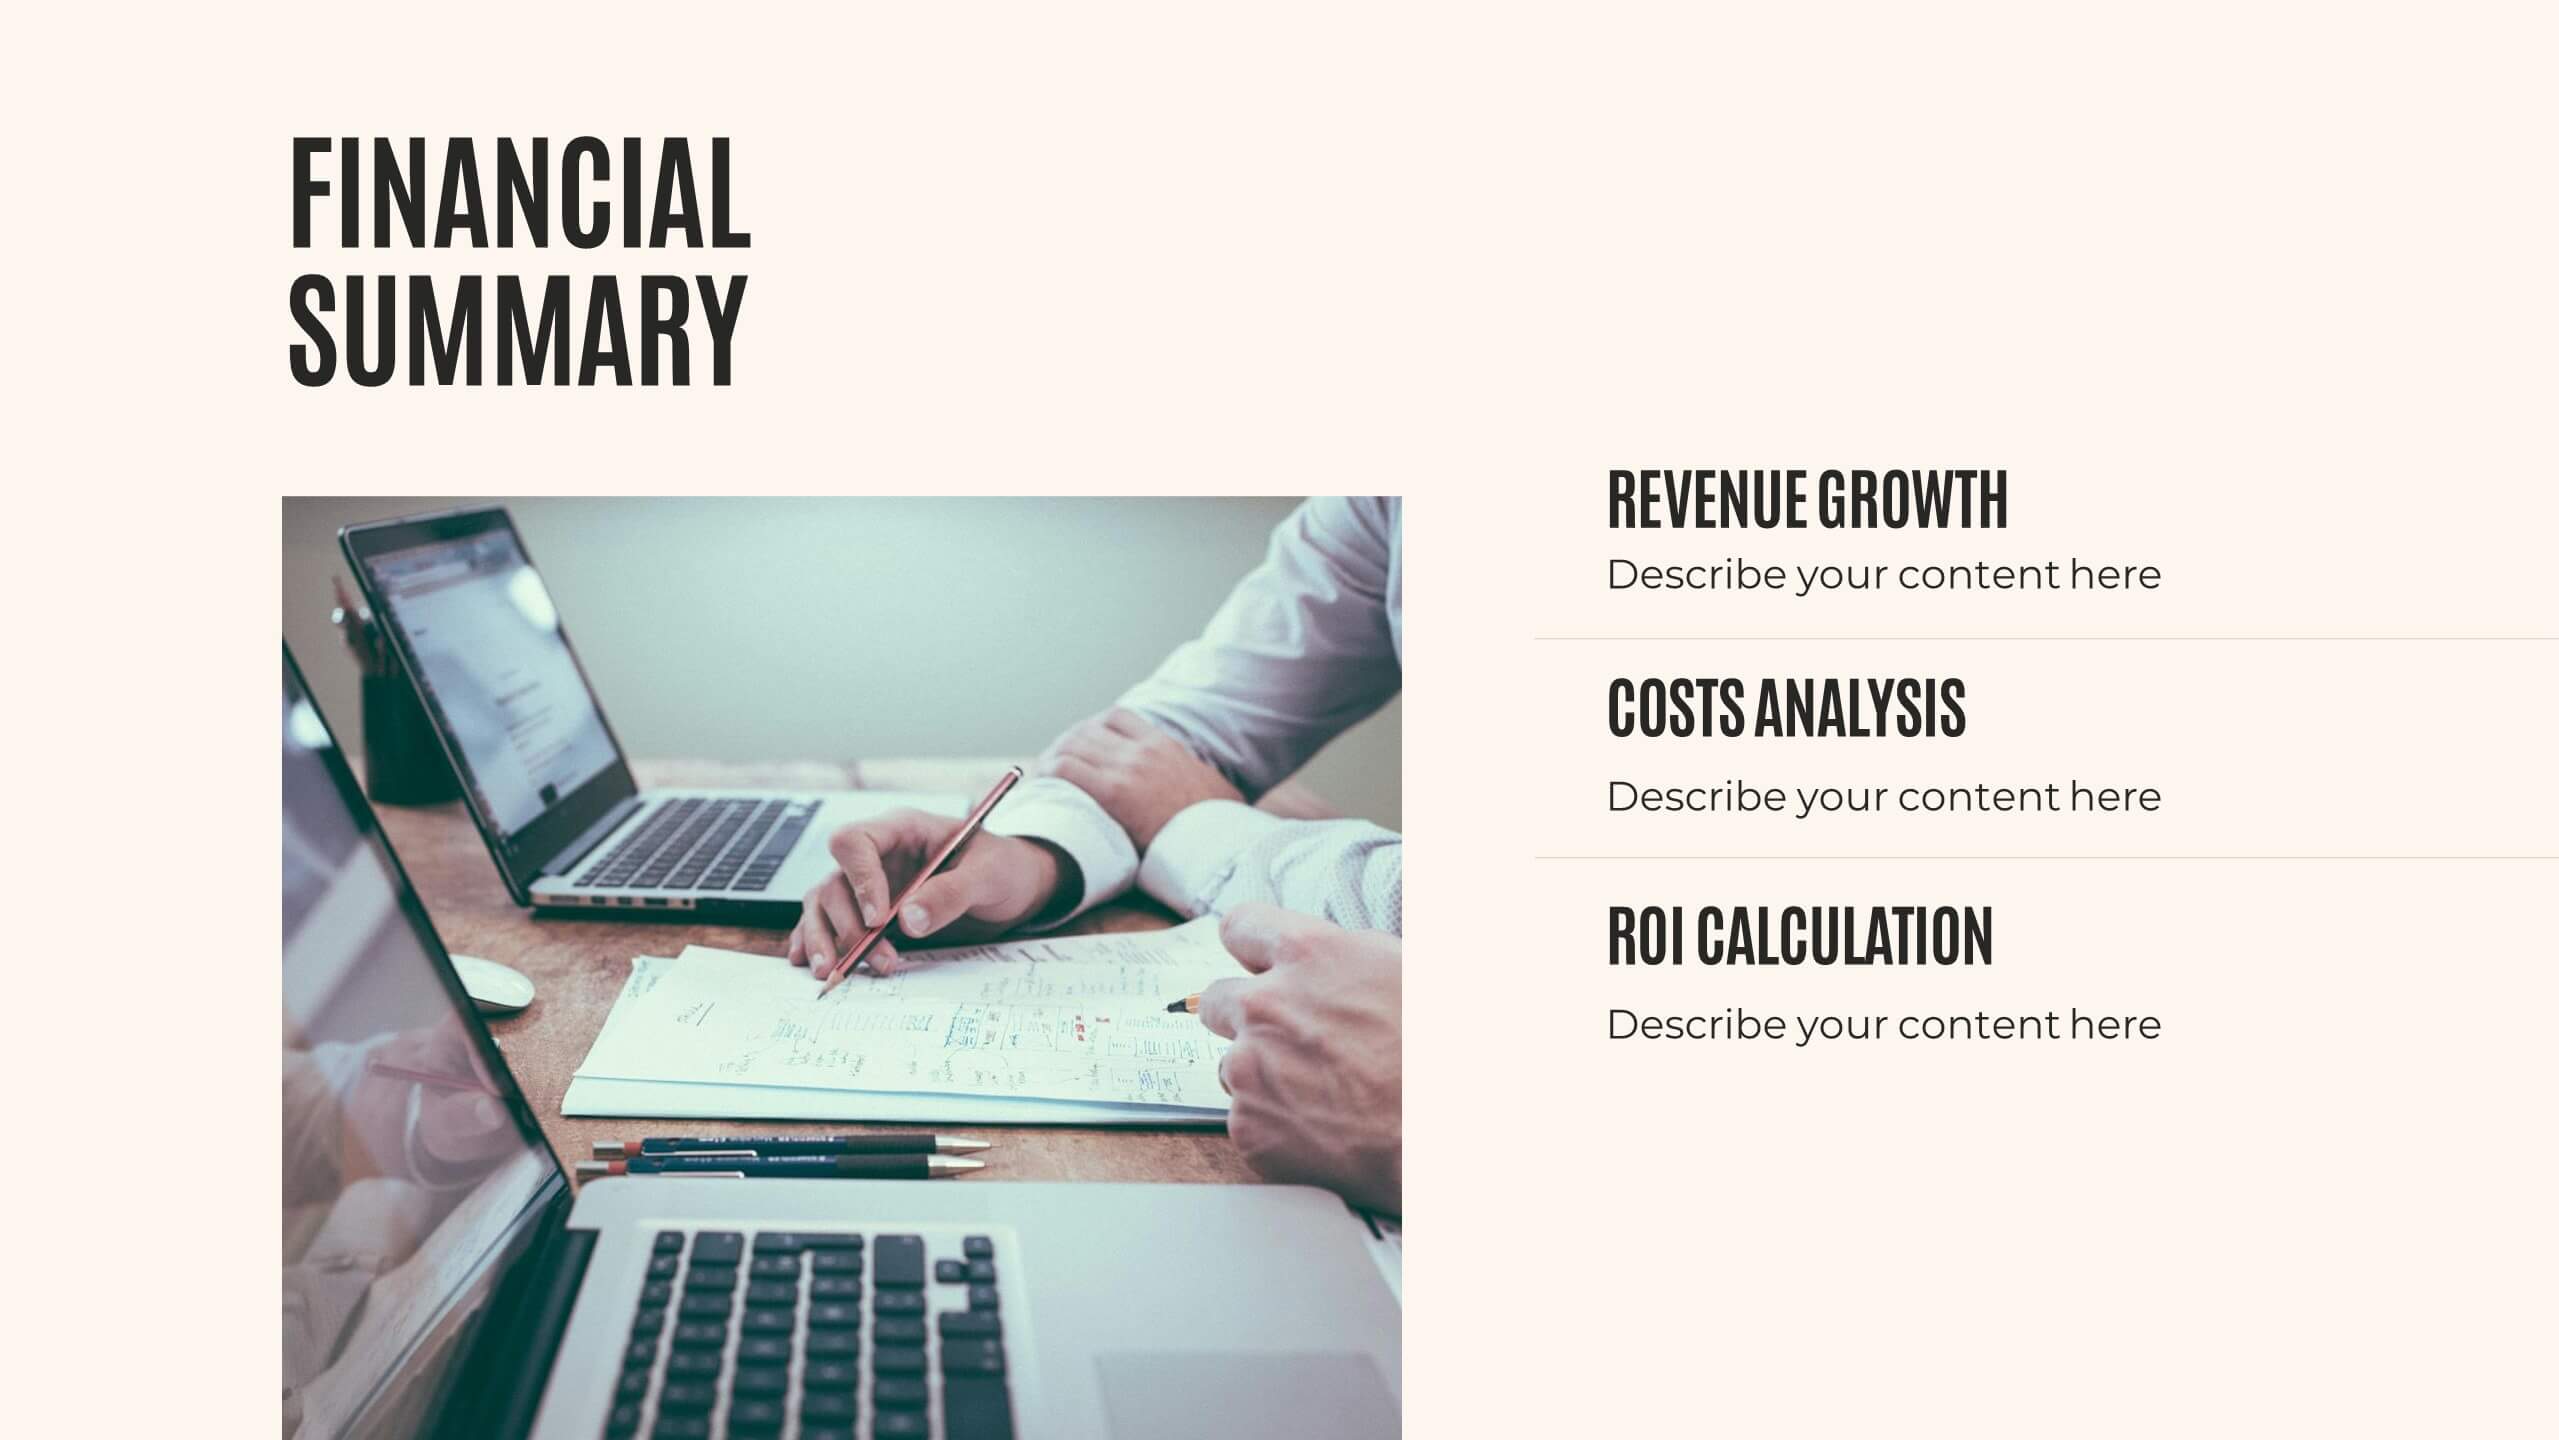
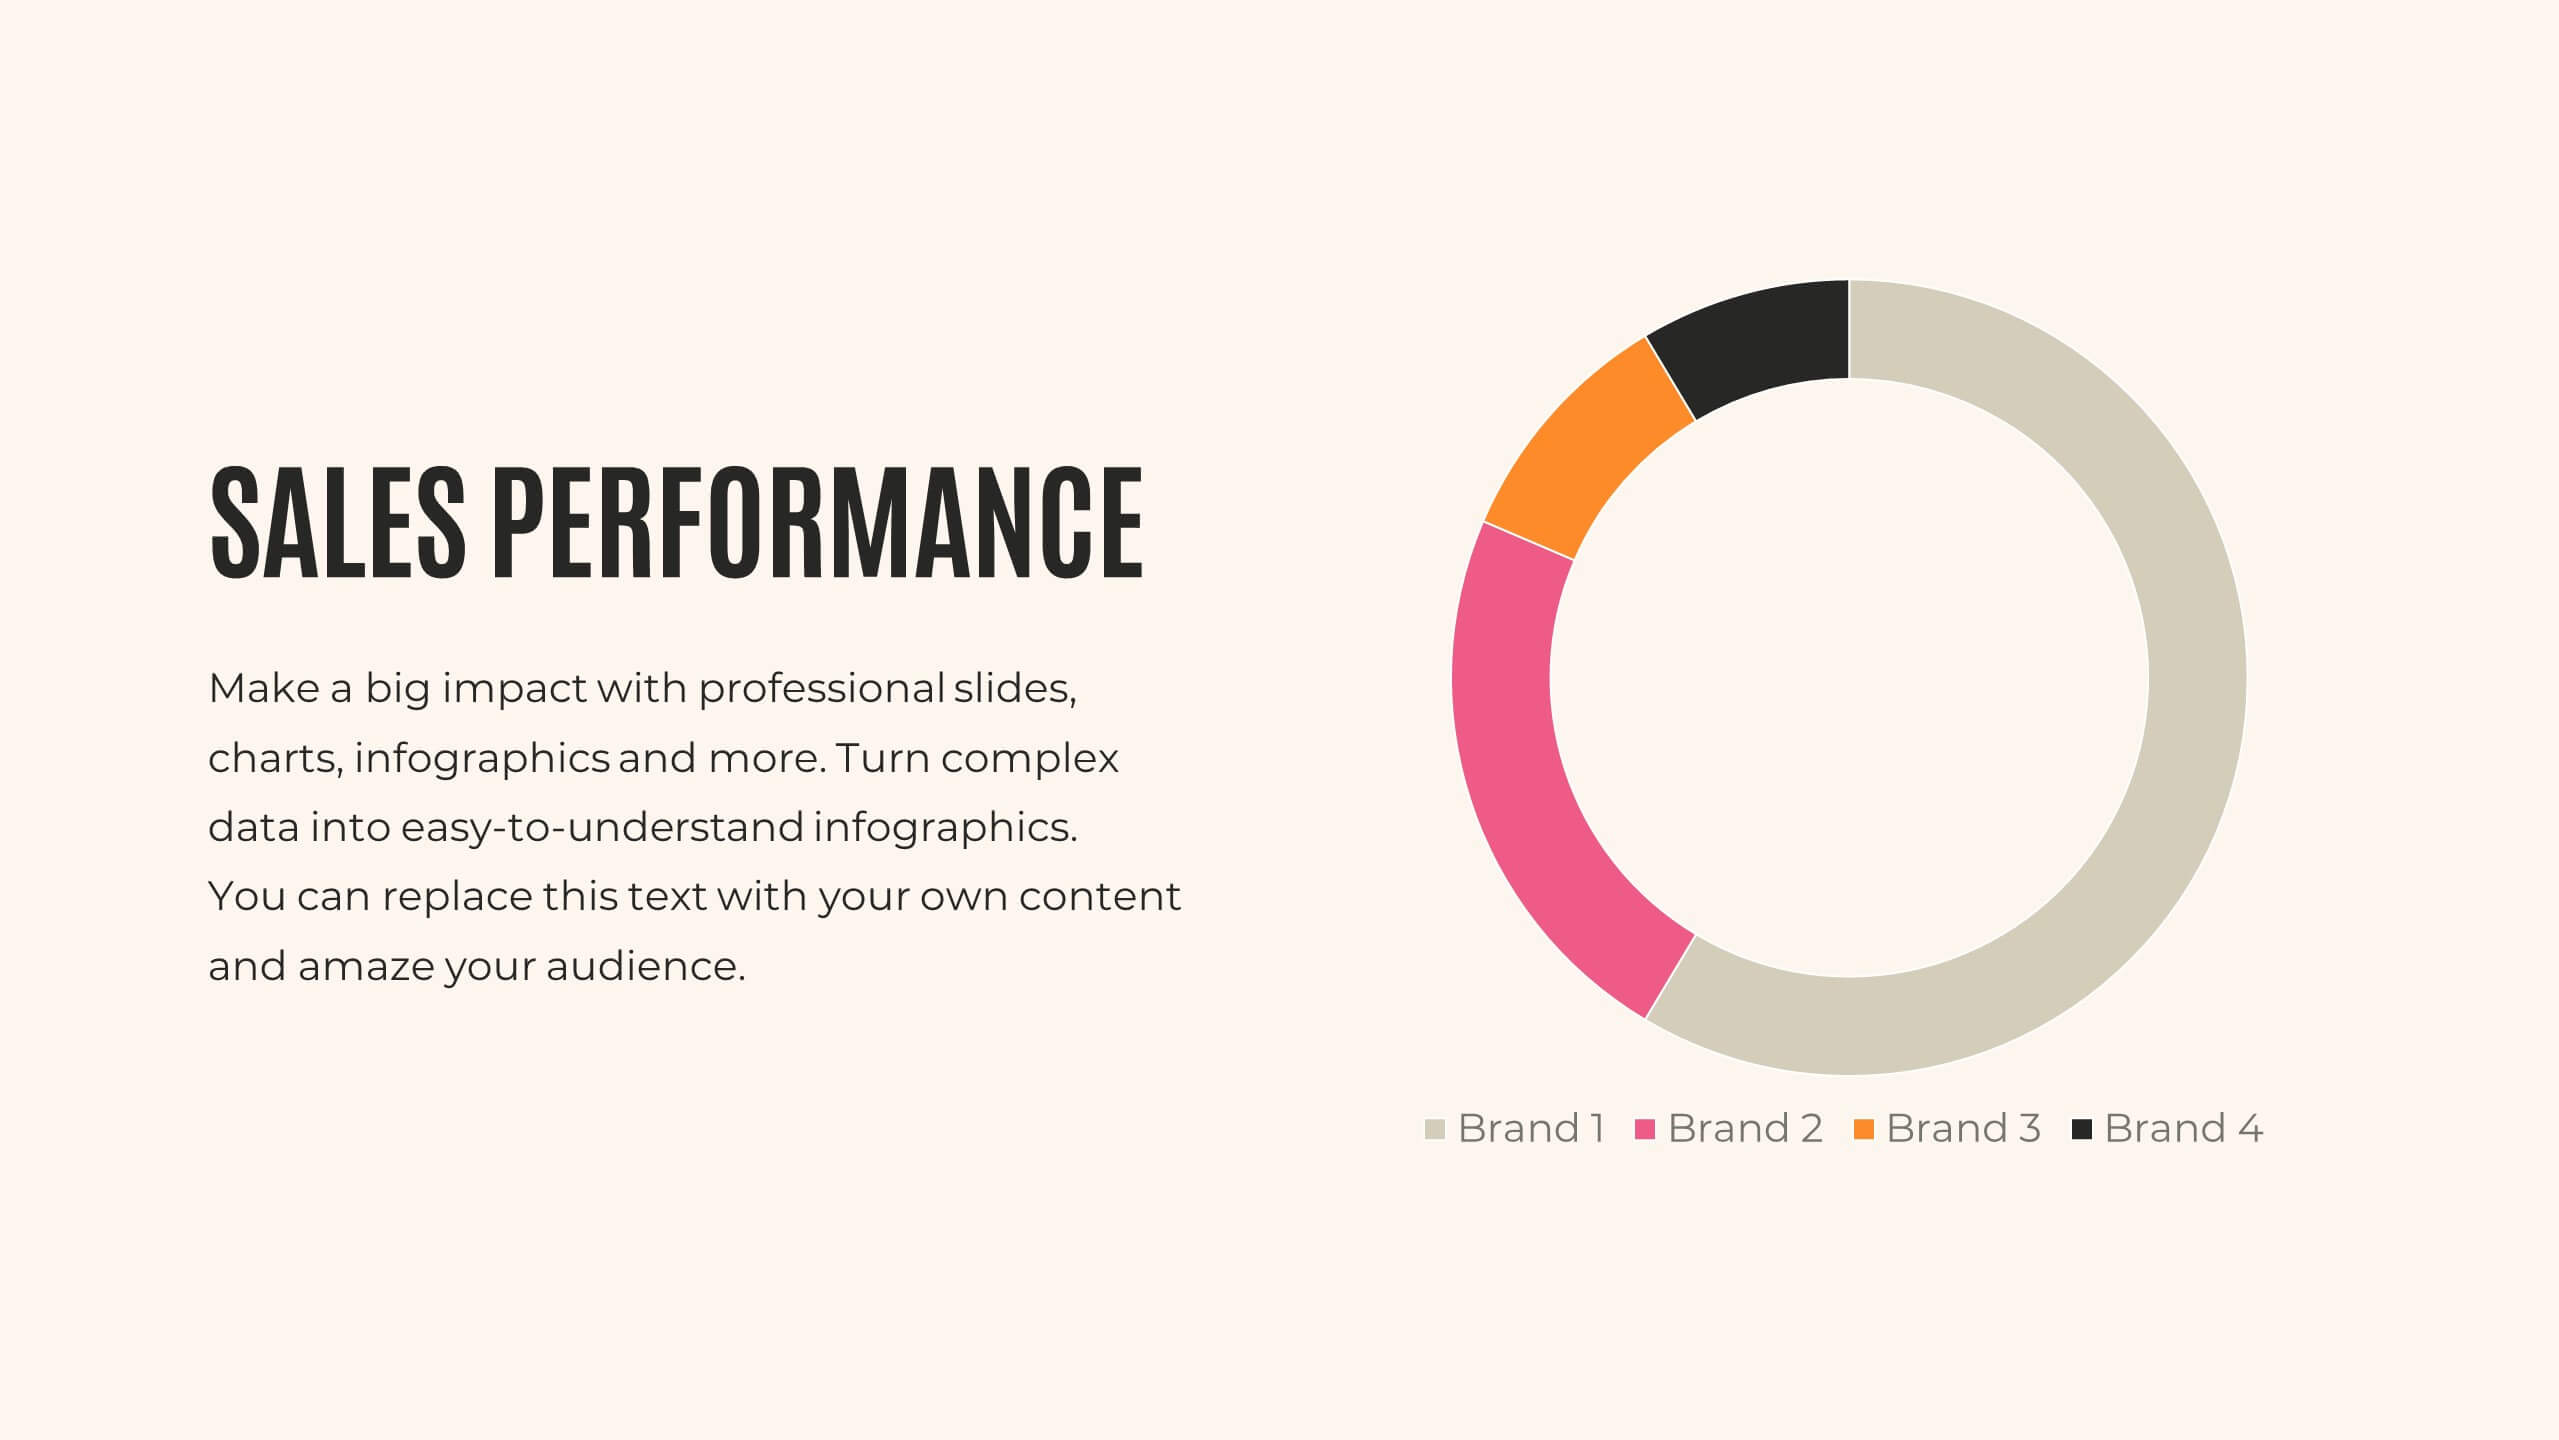
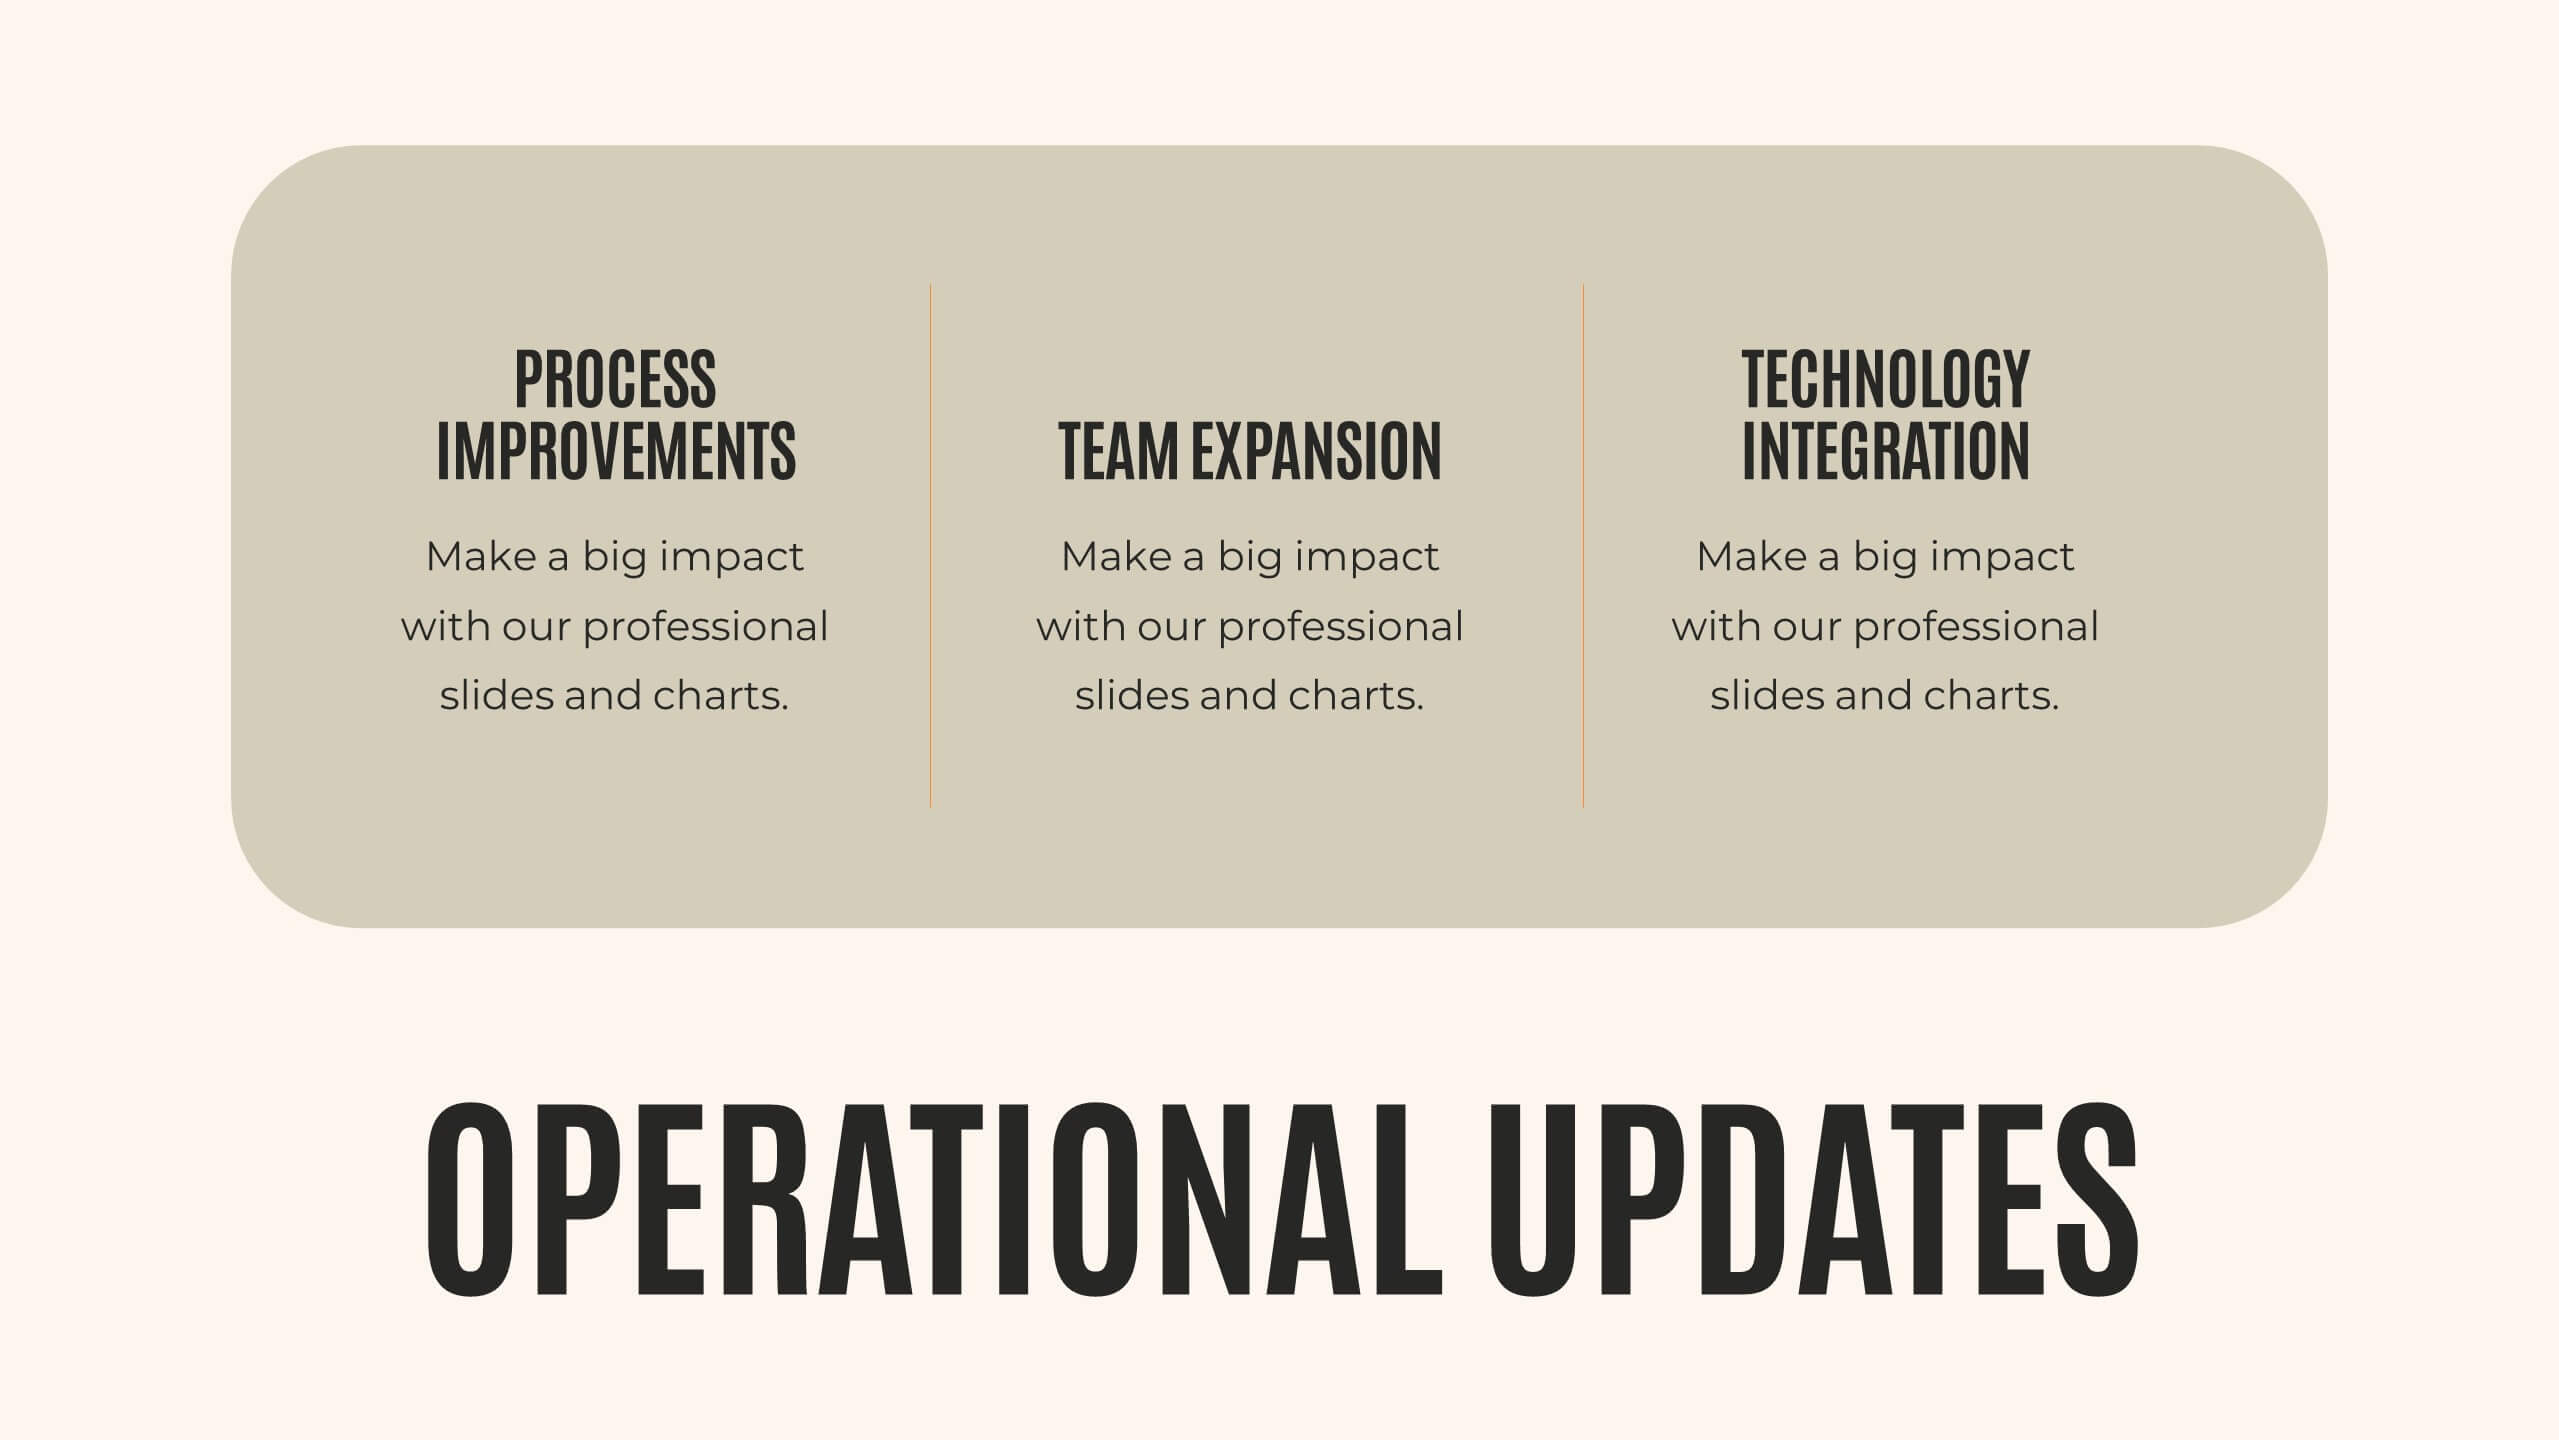
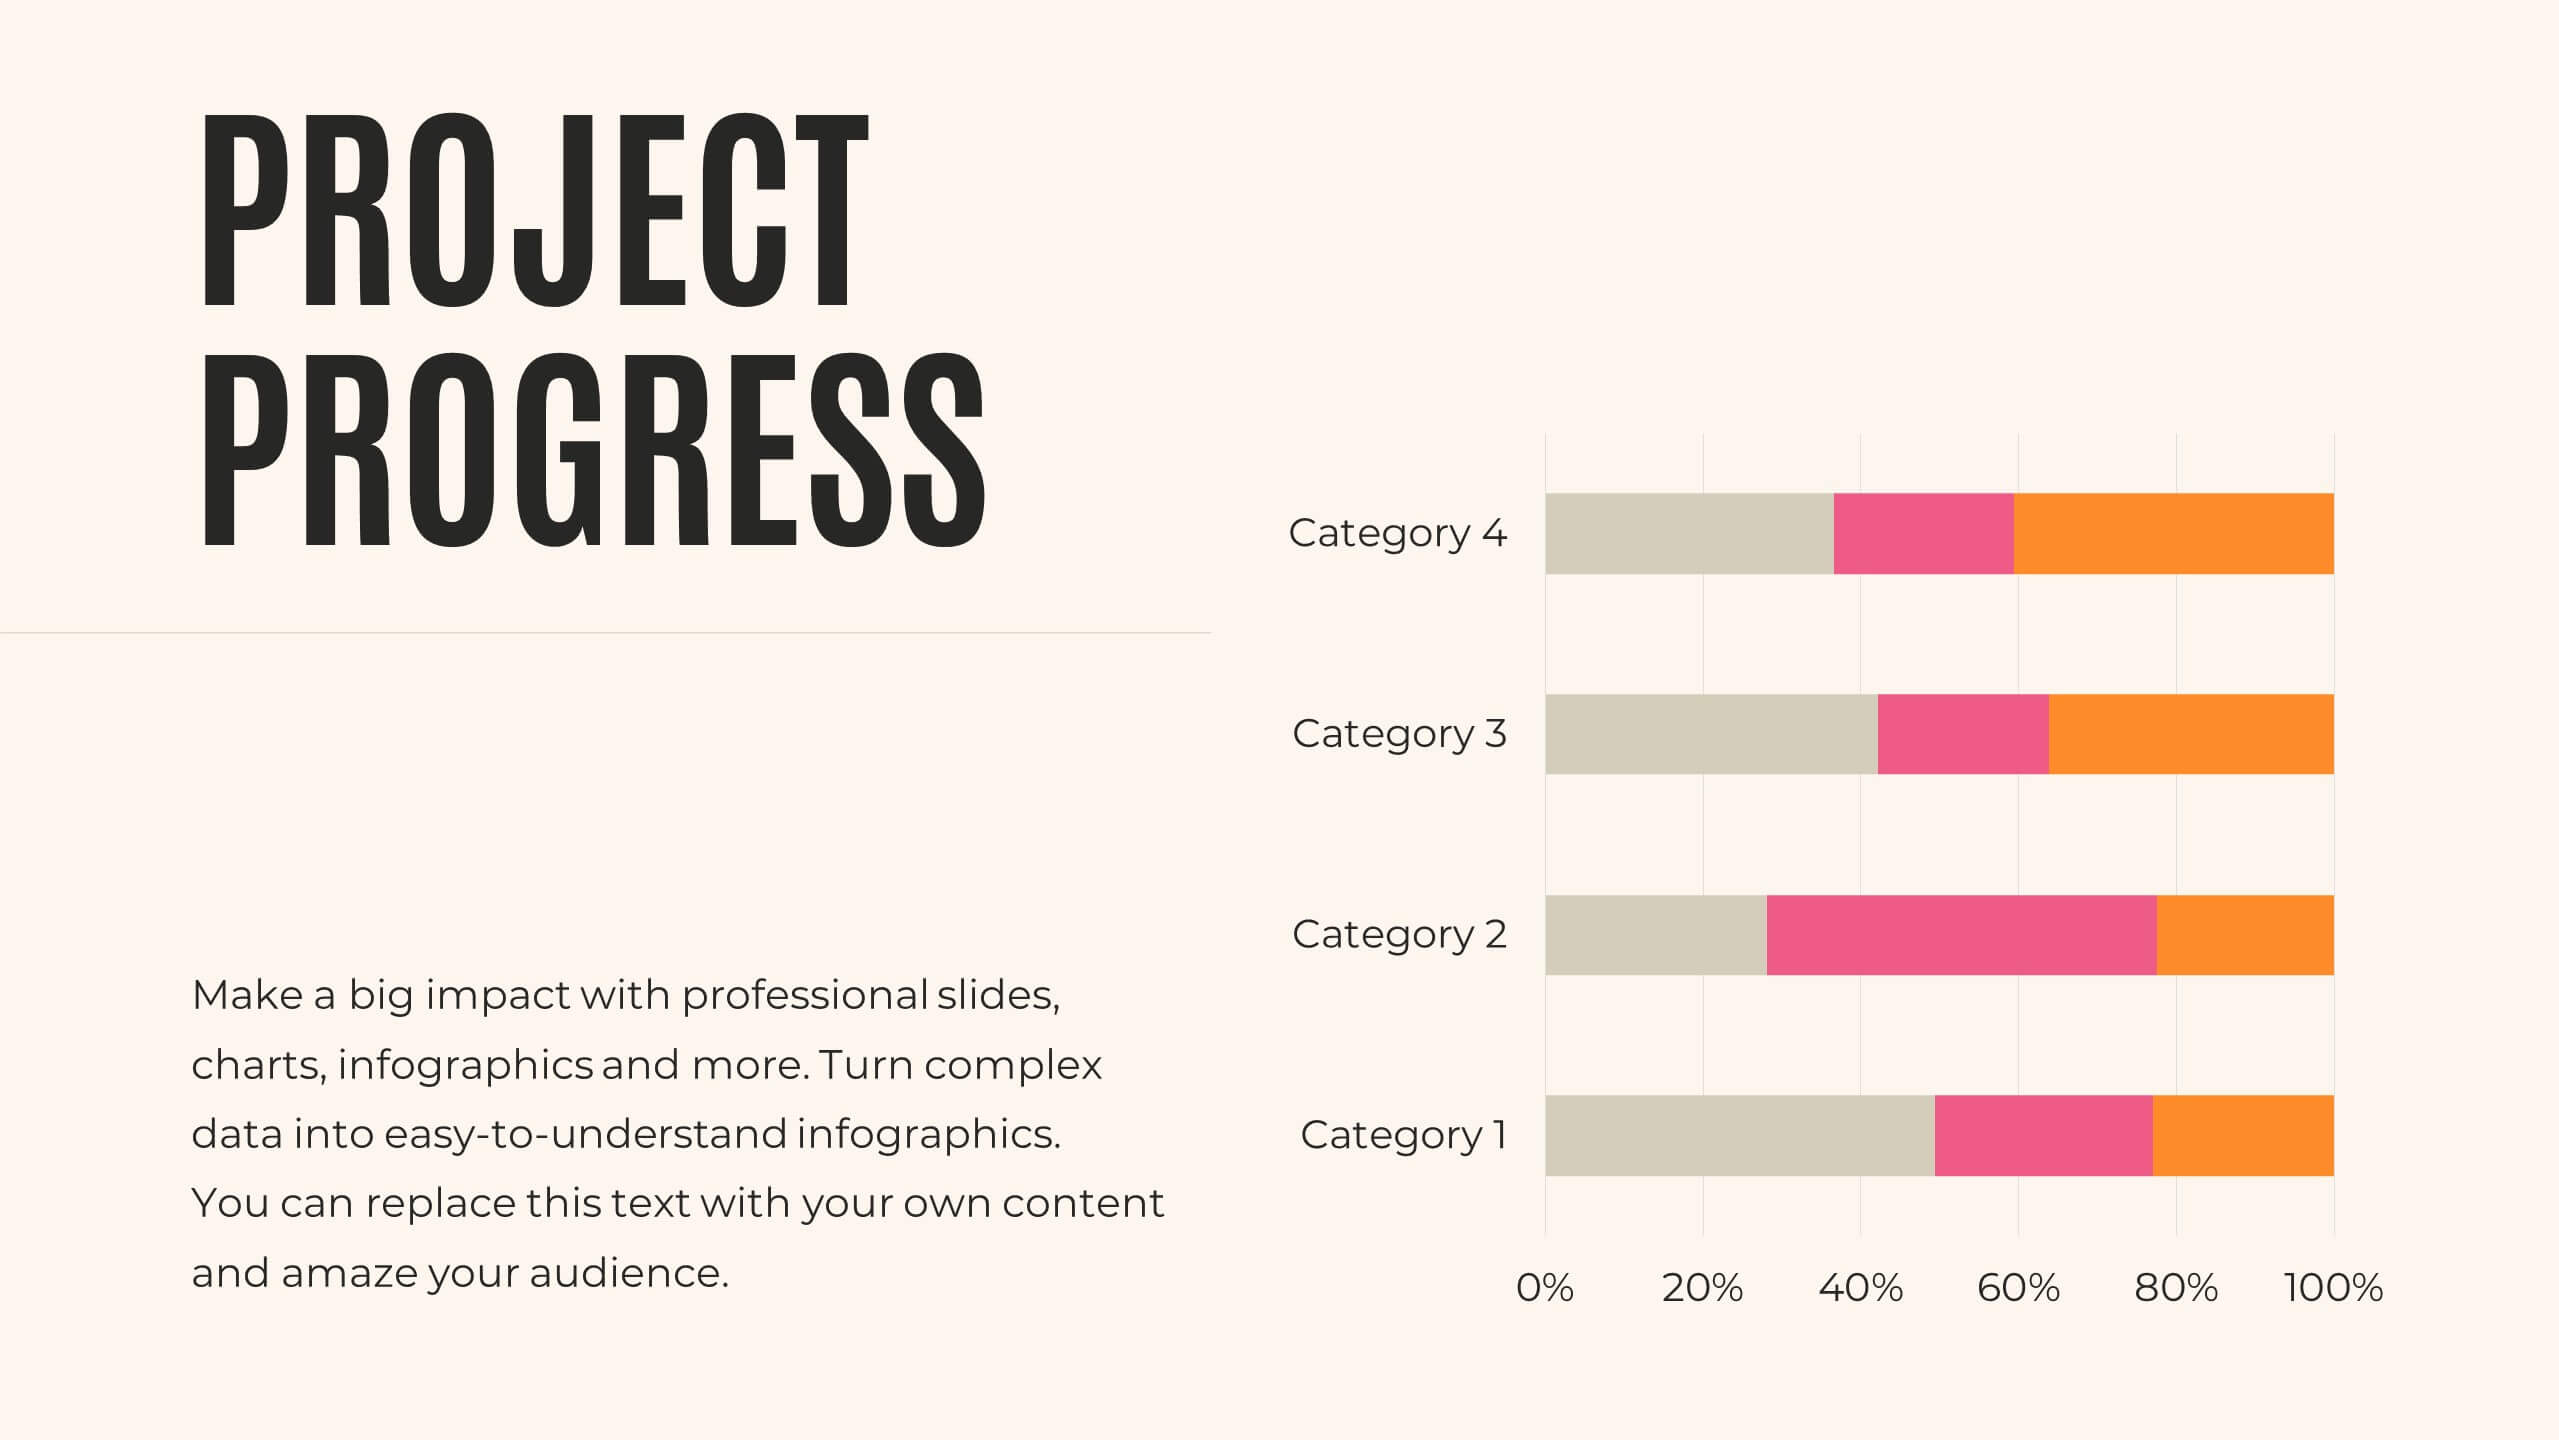
Journey Annual Report Presentation
Present your annual report with clarity and impact! This template covers agenda, key highlights, financial summary, sales performance, and project progress. Ideal for detailing achievements, insights, and future priorities. Compatible with PowerPoint, Keynote, and Google Slides, it ensures your data is visually compelling and easy to understand. Showcase your success effortlessly!


5 diapositivas
Customer Relationship Strategy Presentation
Refine your approach to customer interactions with the "Customer Relationship Strategy" presentation templates. Perfect for delineating clear, actionable strategies to enhance client engagement and satisfaction, these templates are a must-have for businesses focused on building lasting customer relationships. Compatible with PowerPoint, Keynote, and Google Slides, they provide the tools to effectively communicate your customer relationship policies and goals.


20 diapositivas
Nebula Project Proposal Presentation
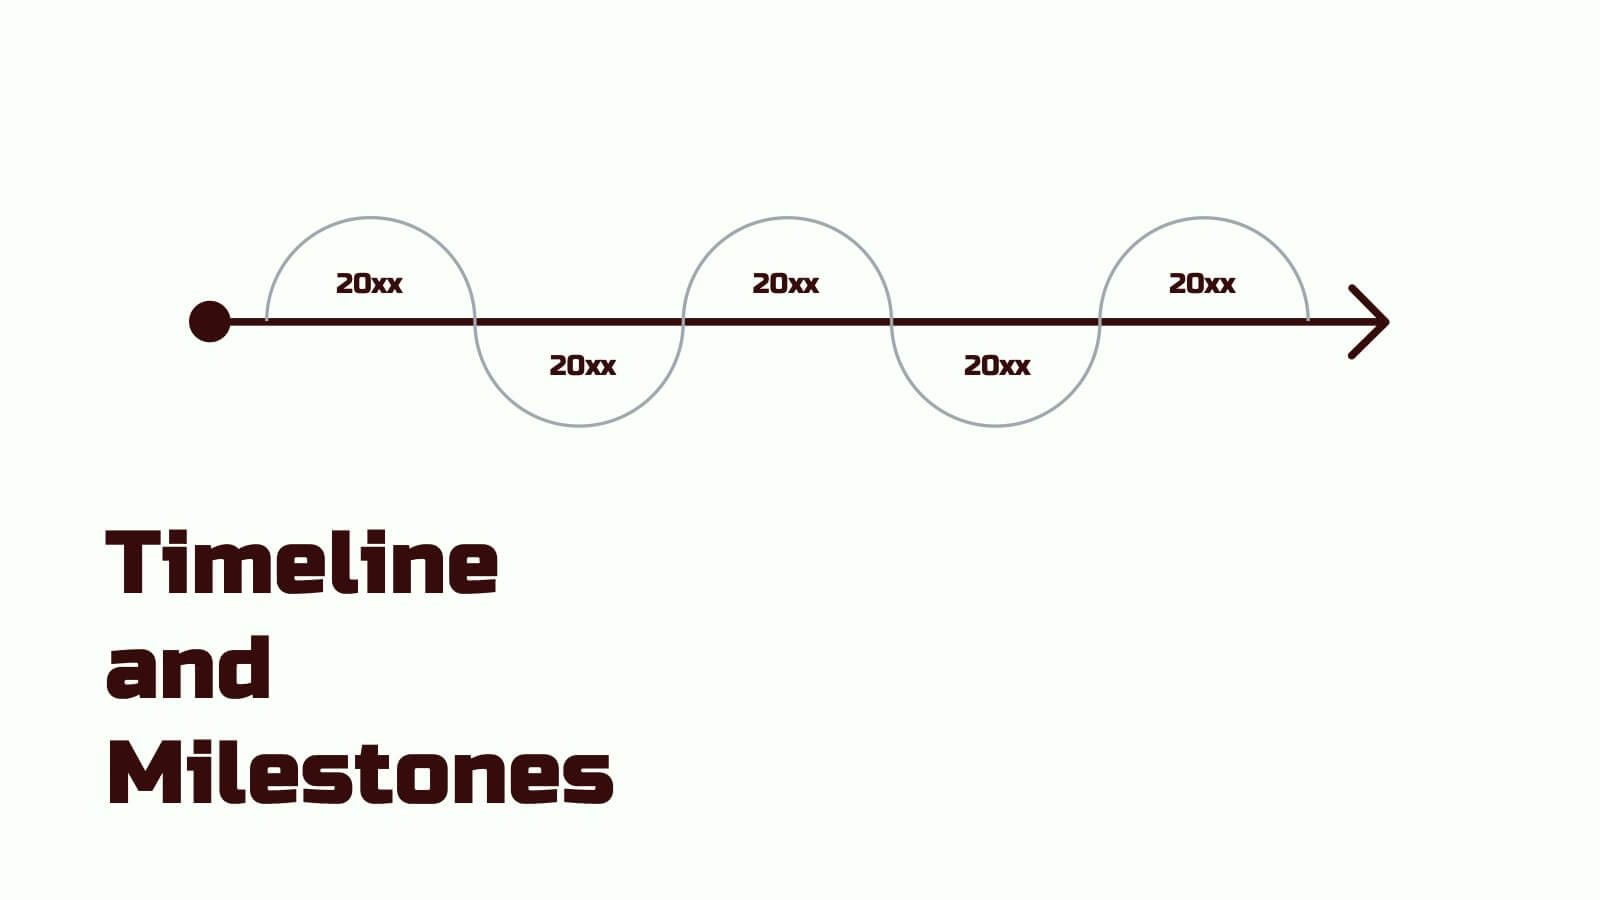
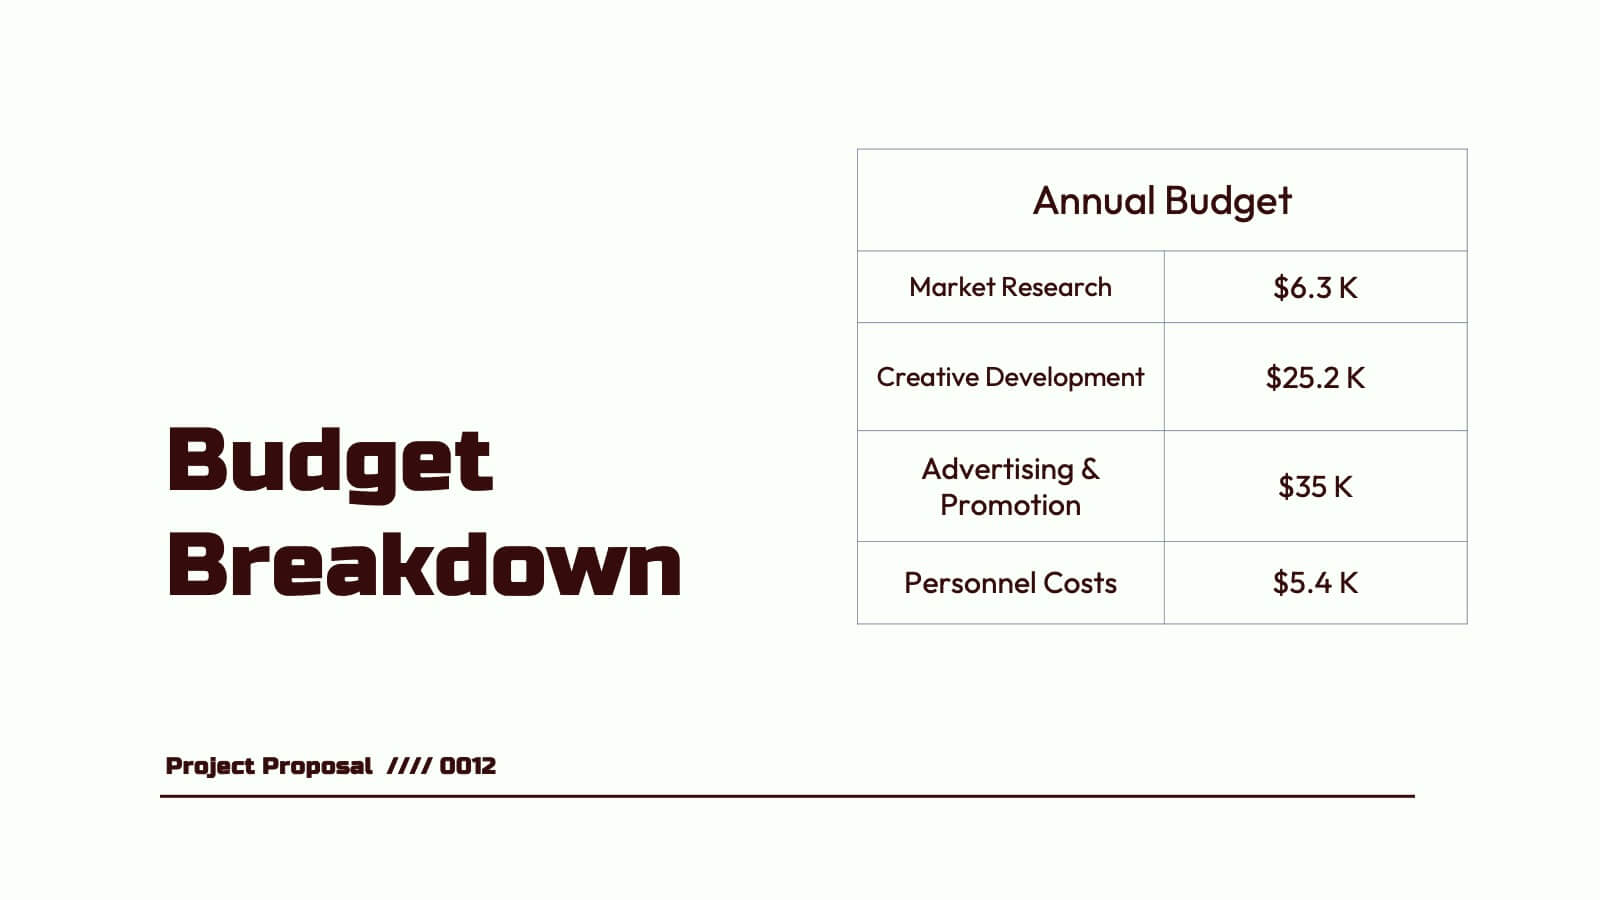
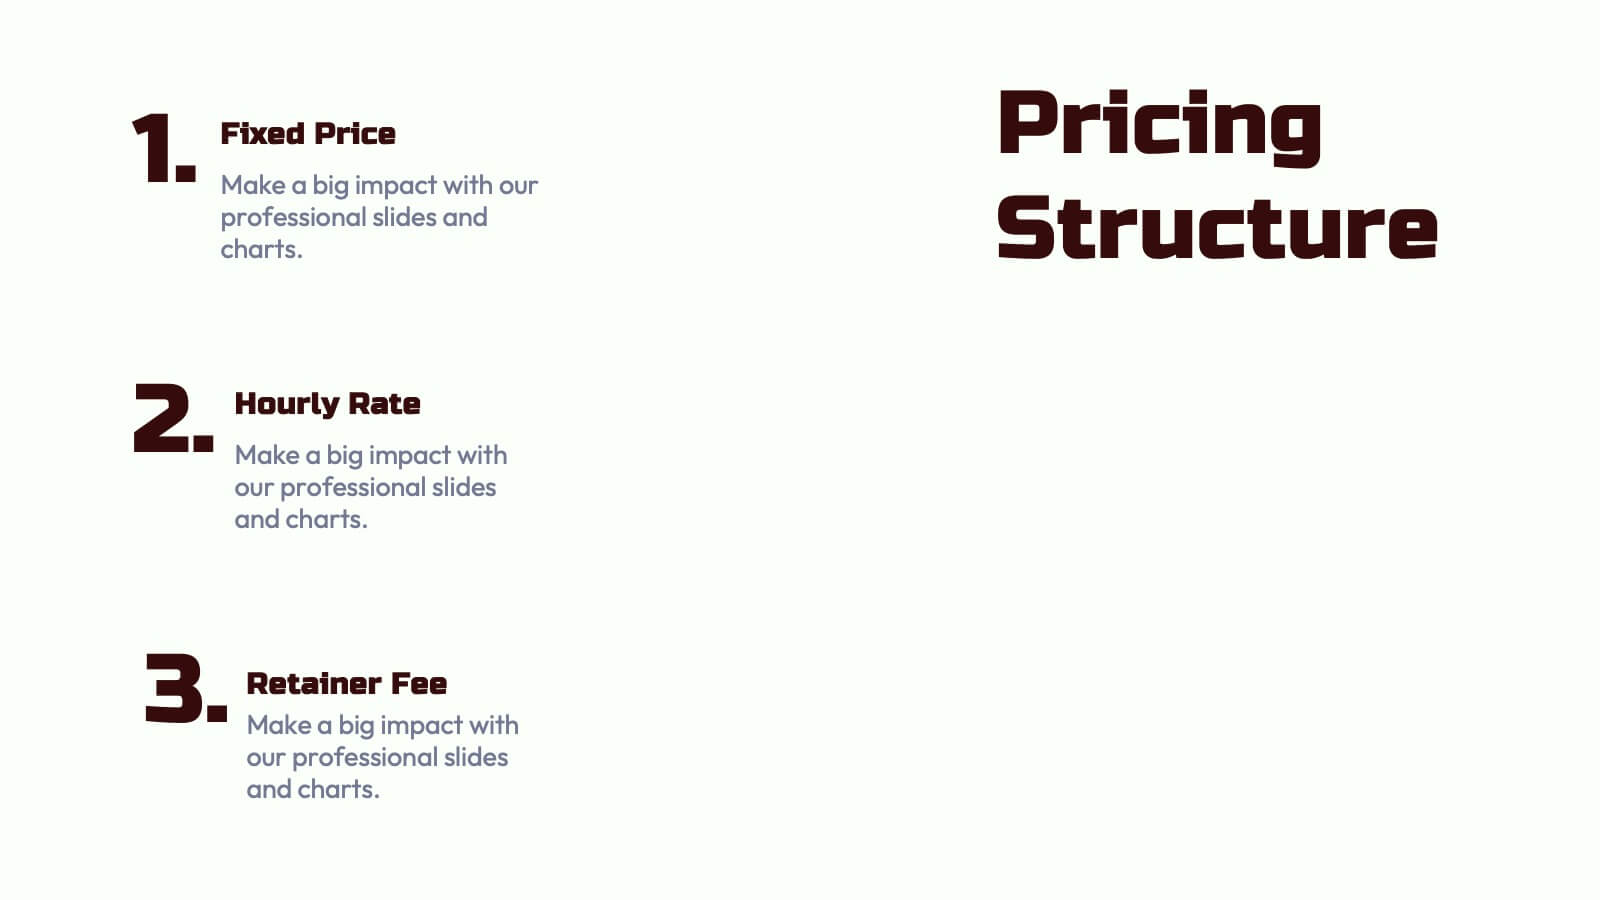
Create a compelling project proposal with this structured, professional template! It includes sections for problem statements, proposed solutions, goals, timelines, and pricing. Perfect for organizing your ideas clearly and professionally, it's fully customizable and compatible with PowerPoint, Keynote, and Google Slides. This template makes it easy to present your proposals effectively and win clients.


6 diapositivas
Modern Agriculture Industry Trends
Highlight key data and insights with this visually engaging agriculture-themed slide. Designed with circular data visuals and crop illustrations, it's perfect for showcasing percentages, trends, or growth stats in modern farming, agri-tech, and sustainability initiatives. Fully editable in PowerPoint, Keynote, and Google Slides.


8 diapositivas
Business Growth with TAM SAM SOM Framework Presentation
Illustrate Your Market Expansion Strategy with this Business Growth with TAM SAM SOM Framework presentation template. Clearly differentiate Total Addressable Market (TAM), Serviceable Available Market (SAM), and Serviceable Obtainable Market (SOM) to help businesses, entrepreneurs, and investors make informed growth decisions and target market opportunities. This visually engaging and fully customizable template is compatible with PowerPoint, Keynote, and Google Slides, making it ideal for business planning, market research, and investor presentations.


6 diapositivas
Three-Point Framework Triangle Diagram Presentation
Break down complex strategies with the Three-Point Framework Triangle Diagram template. This visually structured design helps you present key business components in a clear, logical format, making it ideal for decision-making, planning, and analysis. Fully customizable and easy to use, it's compatible with PowerPoint, Keynote, and Google Slides for seamless integration.


6 diapositivas
Virtual Team Collaboration and Productivity Presentation
Boost team synergy and streamline communication with this Virtual Team Collaboration and Productivity presentation. Designed around a 6-step path, this visual layout helps illustrate key strategies for remote teamwork, digital workflows, and efficient task distribution. Each step is clearly labeled with space for your insights, making it ideal for team training, project kickoff meetings, or collaboration tool tutorials. Fully editable and compatible with PowerPoint, Keynote, and Google Slides.


5 diapositivas
Project Status Update Report Presentation
Keep your project tracking transparent and effective with the "Project Status Update Report" presentation templates. These templates help you visually communicate the progress of tasks, timelines, and milestones, ensuring stakeholders stay informed and engaged. Ideal for project managers needing a streamlined, professional format compatible with PowerPoint, Keynote, and Google Slides, they simplify reporting and enhance project visibility.


23 diapositivas
Sunstone Investor Pitch Presentation
Captivate investors with this professionally crafted pitch deck, showcasing sections for company overview, problem and solution, market opportunity, revenue model, competitive landscape, and growth projections. Present your team, financials, milestones, and funding requirements effectively. Ideal for securing investment and support. Fully customizable for PowerPoint, Keynote, and Google Slides.


5 diapositivas
How To Stop Fake News Infographics
Dive into the realm of media literacy with our how to stop fake news infographics. Crafted with striking shades of trust-inspiring blues and engaging, colorful accents, this vertical, informative, and creatively styled template is a beacon for journalists, educators, social media users, and advocates of truth. It is specifically designed to aid in the identification, debunking, and prevention of the spread of misinformation. Compatible with Powerpoint, Keynote, and Google Slides. The infographic encapsulates compelling graphics, easy-to-understand icons, and versatile image placeholders pertinent to the battle against fake news.


5 diapositivas
Building Timeline Presentation
Bring structure and progress to your ideas with this visually engaging presentation design. Ideal for showcasing project milestones, construction phases, or business growth timelines, it helps you communicate progress clearly and professionally. Fully customizable and compatible with PowerPoint, Keynote, and Google Slides for seamless presentation editing and delivery.


3 diapositivas
Remote Work Culture and Guidelines Presentation
Bring remote teamwork to life with visuals that speak your culture. This presentation template simplifies how you communicate expectations, structure, and values for virtual teams. Perfect for onboarding, policy updates, or outlining collaboration tools, it’s designed to keep your message clear and consistent. Fully compatible with PowerPoint, Keynote, and Google Slides.


4 diapositivas
Strategic SWOT Matrix Overview Presentation
Present your strategic insights with clarity using the Strategic SWOT Matrix Overview Presentation. This modern slide layout features a sleek horizontal design that separates Strengths, Weaknesses, Opportunities, and Threats into visually distinct segments. Ideal for business planning, strategy reviews, or team discussions. Fully editable in PowerPoint, Canva, and Google Slides.


20 diapositivas
Professional Business Presentation
Deliver impactful insights with our Professional Presentation template. Ideal for enterprise projects, it features slides for introductions, methodology, budget breakdowns, and more. This template facilitates thorough business analyses and clear communication of objectives and results, compatible with PowerPoint, Keynote, and Google Slides.


5 diapositivas
Project Management Plan Presentation
Bring structure and clarity to every phase of your workflow with this clean, arrow-based layout designed to outline tasks, milestones, and key deliverables. This presentation makes planning feel organized, engaging, and easy to follow for any audience. Fully editable and ready to use in PowerPoint, Keynote, and Google Slides.


20 diapositivas
Scriptorium Design Portfolio Presentation
Showcase your creative work with a sophisticated design portfolio presentation template tailored for designers and creators. This template includes clean, minimalist slides to highlight your introduction, portfolio overview, design philosophy, and style. Showcase featured projects with dedicated project highlight slides, complete with client testimonials and awards for added credibility. With sections for your design process, services, pricing, and blog integration, this template provides a professional framework for sharing your creative journey. The editable layout ensures seamless customization to reflect your unique brand, making it suitable for freelancers, agencies, or design teams. Compatible with PowerPoint, Google Slides, and Keynote, this versatile template offers an elegant way to communicate your expertise and leave a lasting impression on clients or stakeholders. Tailor it to your needs and take your portfolio presentations to the next level!


5 diapositivas
Visionary Leadership Models in Business
Illustrate transformative leadership approaches with the Visionary Leadership Models in Business Presentation. This slide features a central vertical timeline with bold icons and text areas that highlight four key principles or stages of leadership. Ideal for strategy sessions, keynote addresses, or leadership training programs. Fully compatible with PowerPoint, Keynote, and Google Slides.