


Características


¿Tienes alguna pregunta?
Recomendar


28 diapositivas
Legacy Brand Development Pitch Deck Presentation
Elevate your brand presentations with this sleek, modern template. Perfect for outlining brand identity, market analysis, and unique selling propositions, it features a stylish design with vibrant colors. Highlight your brand's voice, tone, and positioning to captivate your audience. Compatible with PowerPoint, Keynote, and Google Slides, it ensures seamless presentations on any platform.


7 diapositivas
Money Exchange Infographic Presentation
Money exchange is an important aspect of international trade and commerce, and it serves many important functions. Create a professional visual aid for your next presentation with this infographic on money exchange. The template includes customizable layouts, charts and 7 unique photo layouts. You can add or delete columns of information as desired, change fonts and sizes as well as fill text boxes with titles, descriptions and more. This colorful design is great for reporting on business growth, expenses and more. This presentation is designed in Powerpoint, Keynote and Google Slides.


24 diapositivas
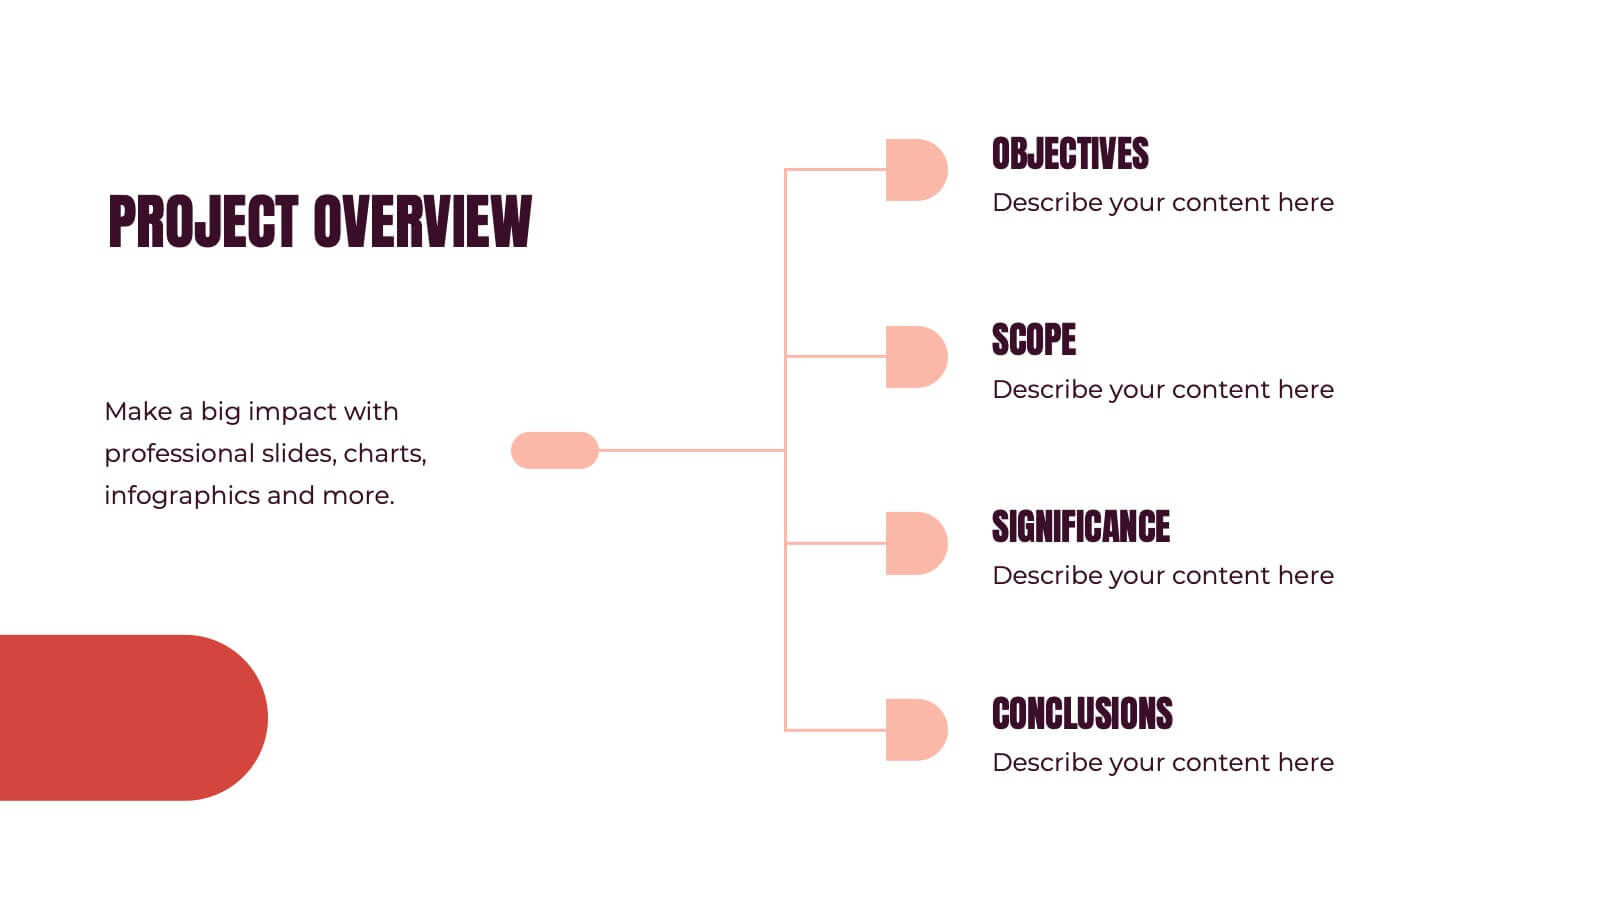
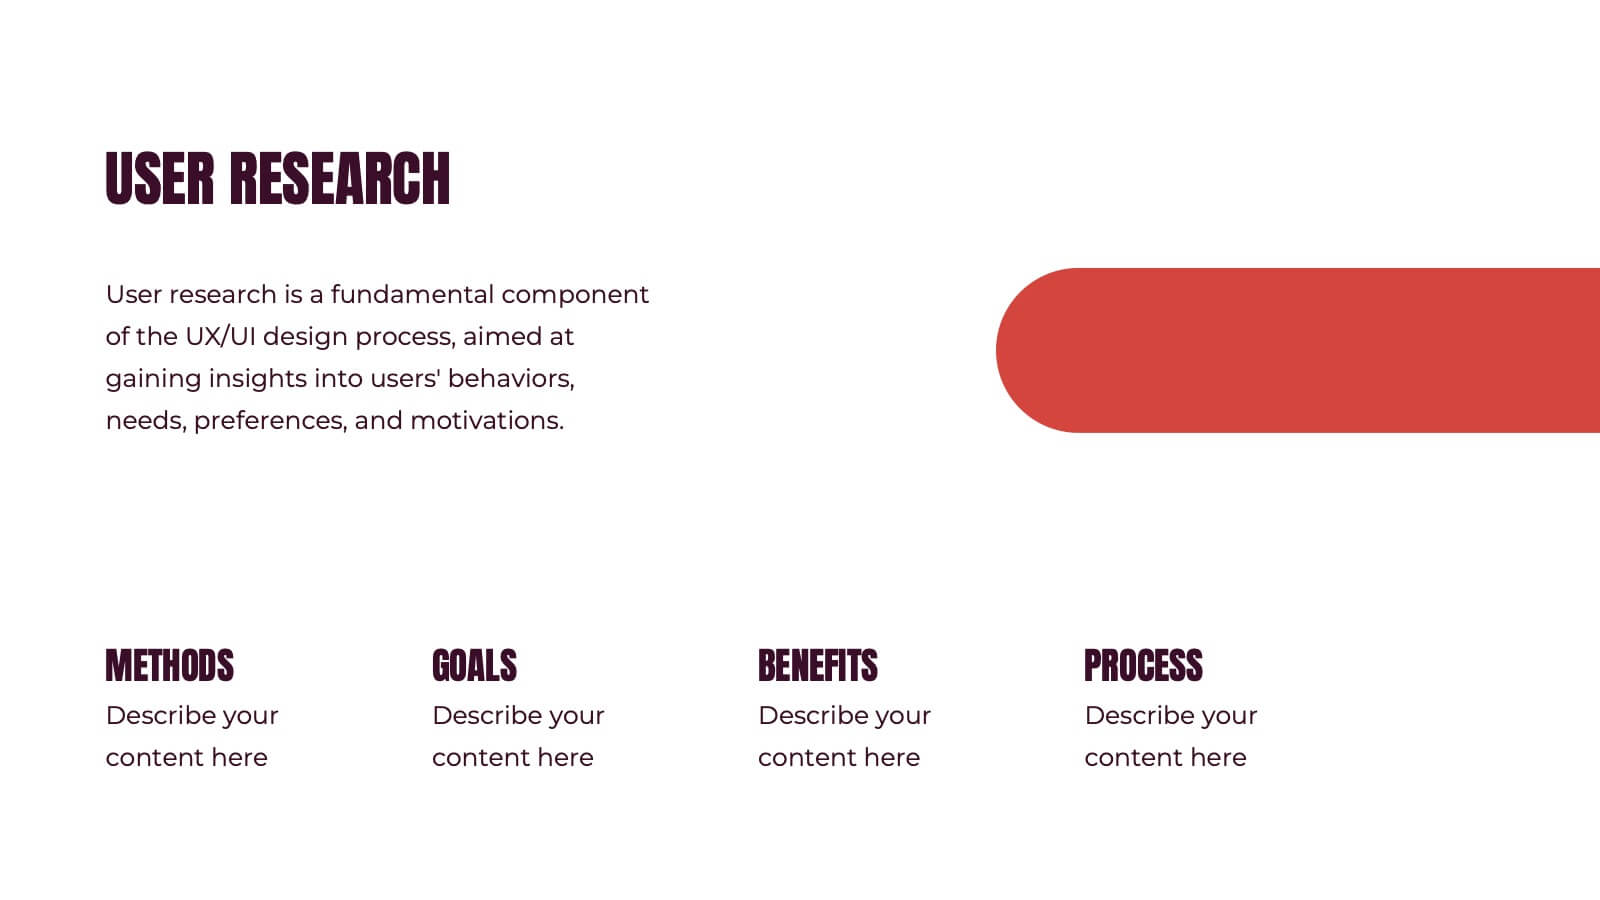
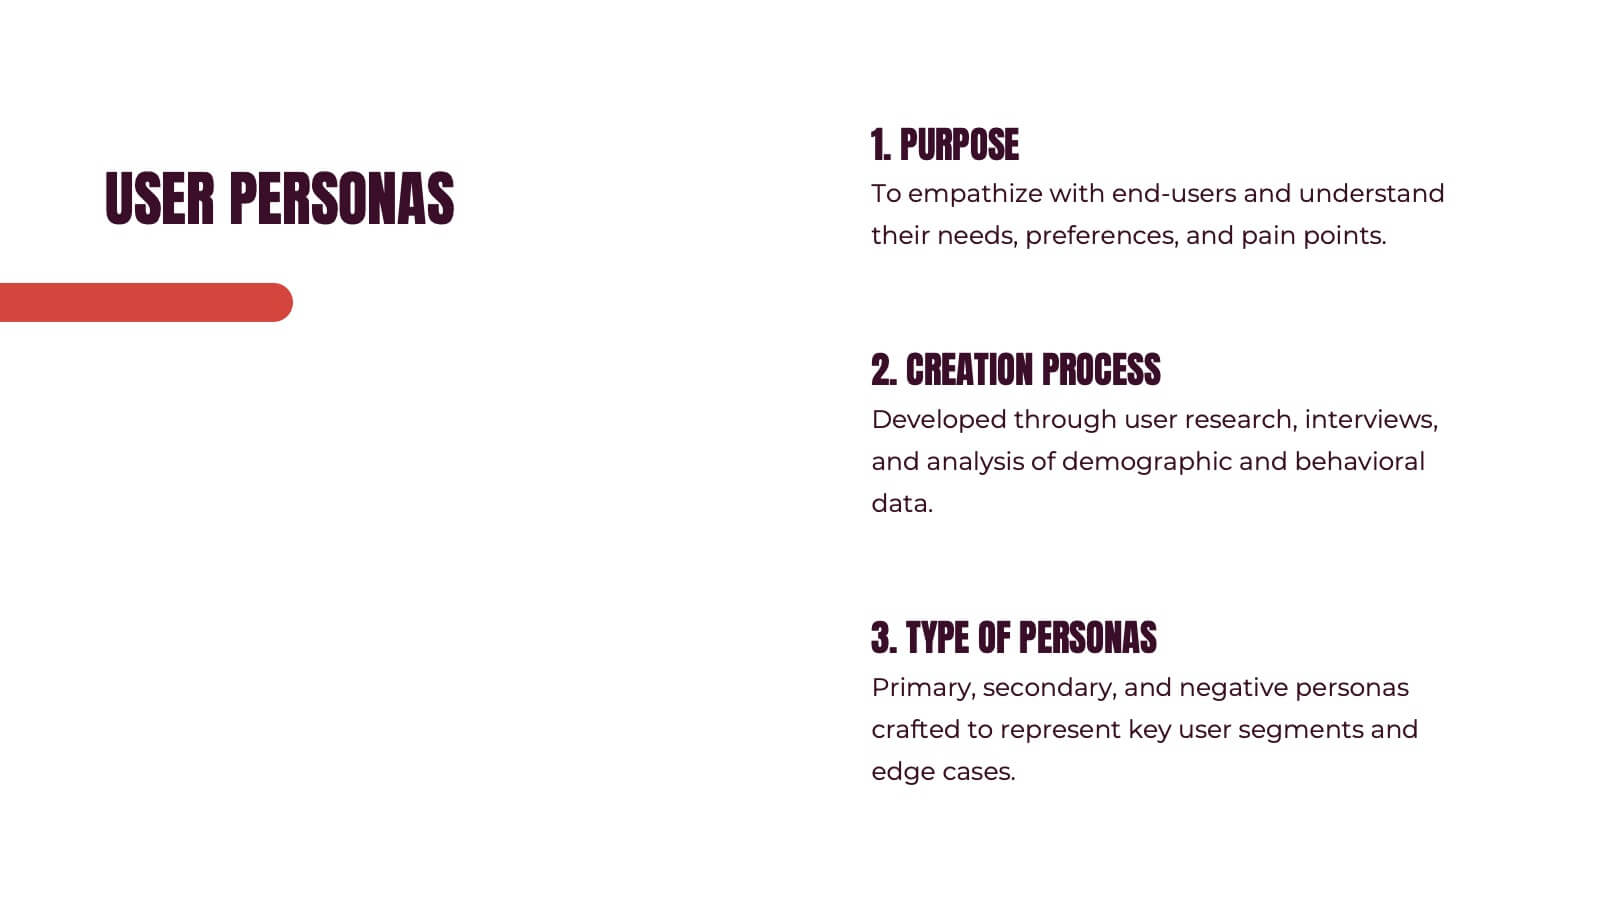
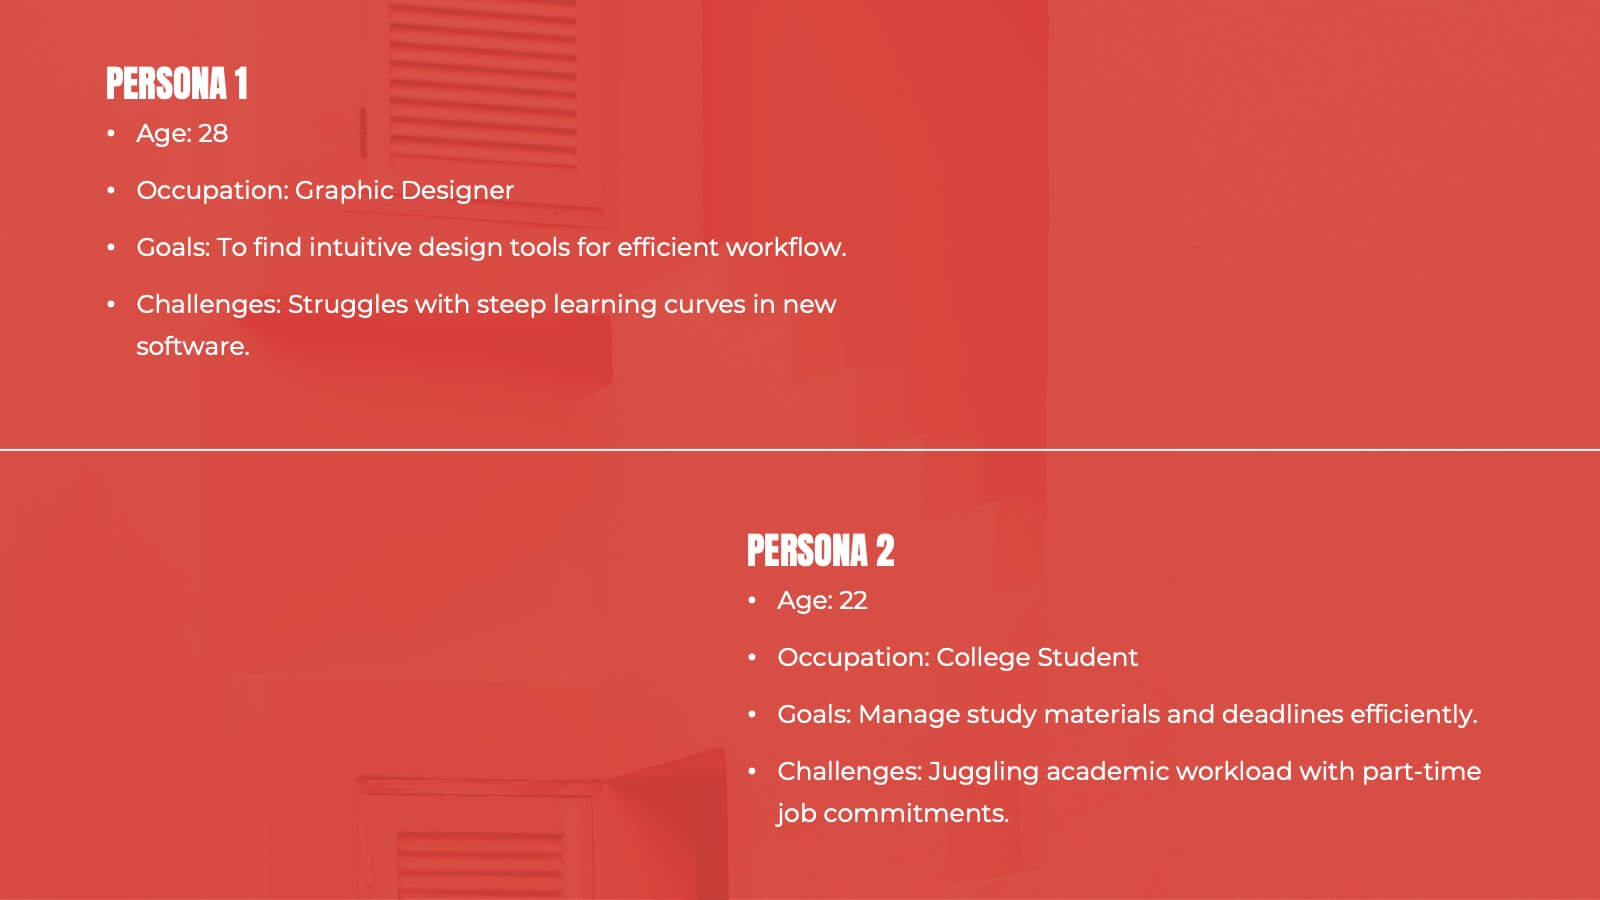
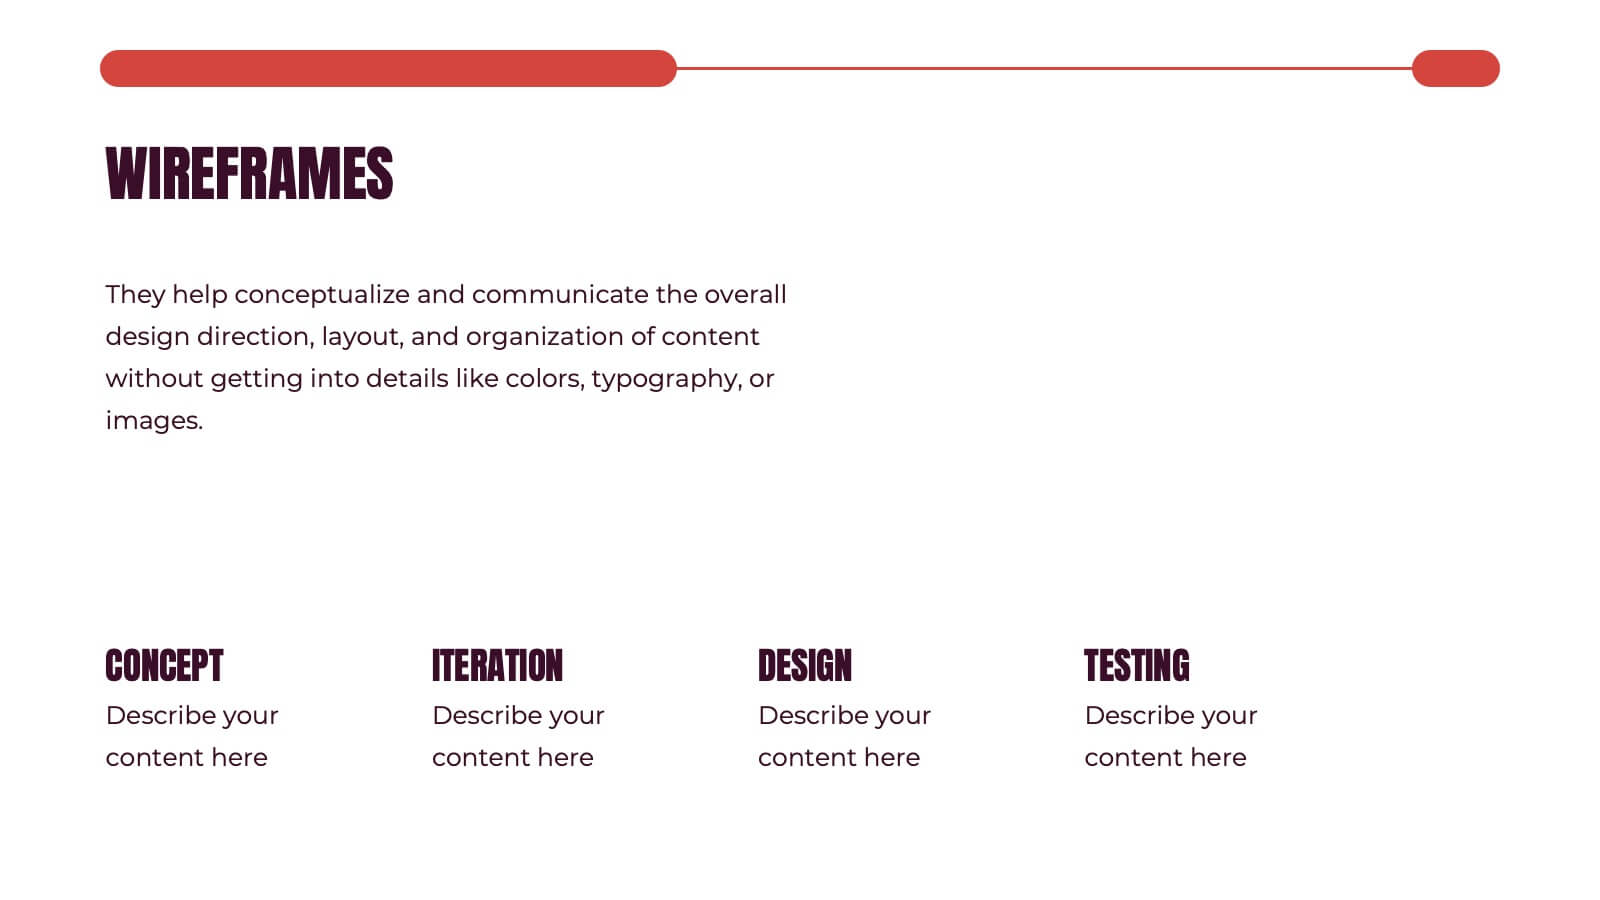
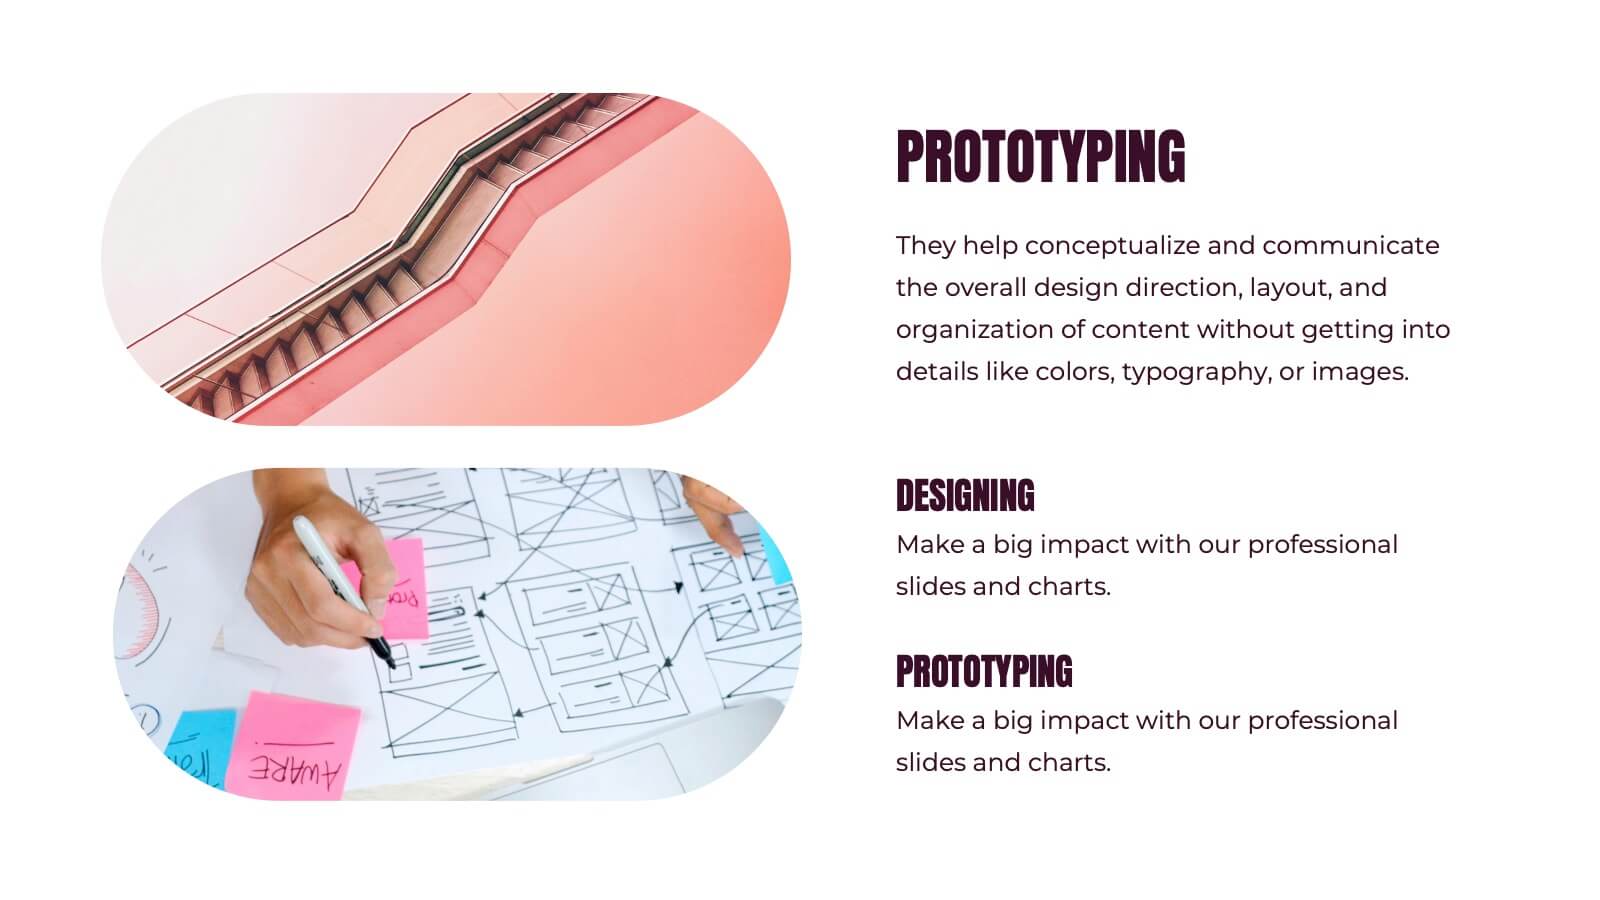
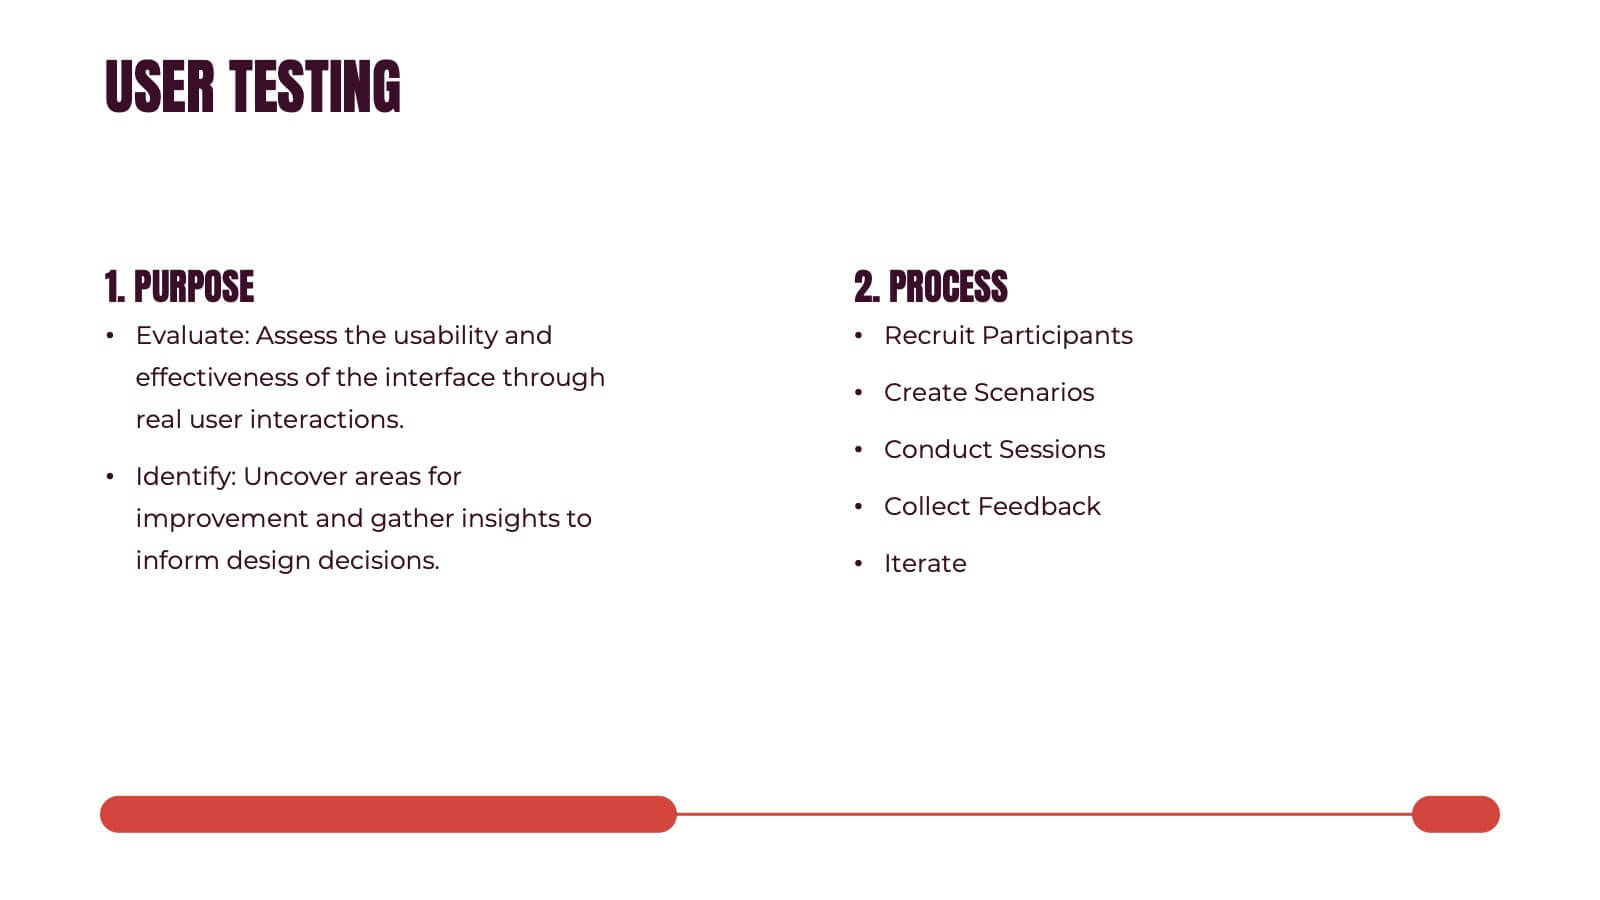
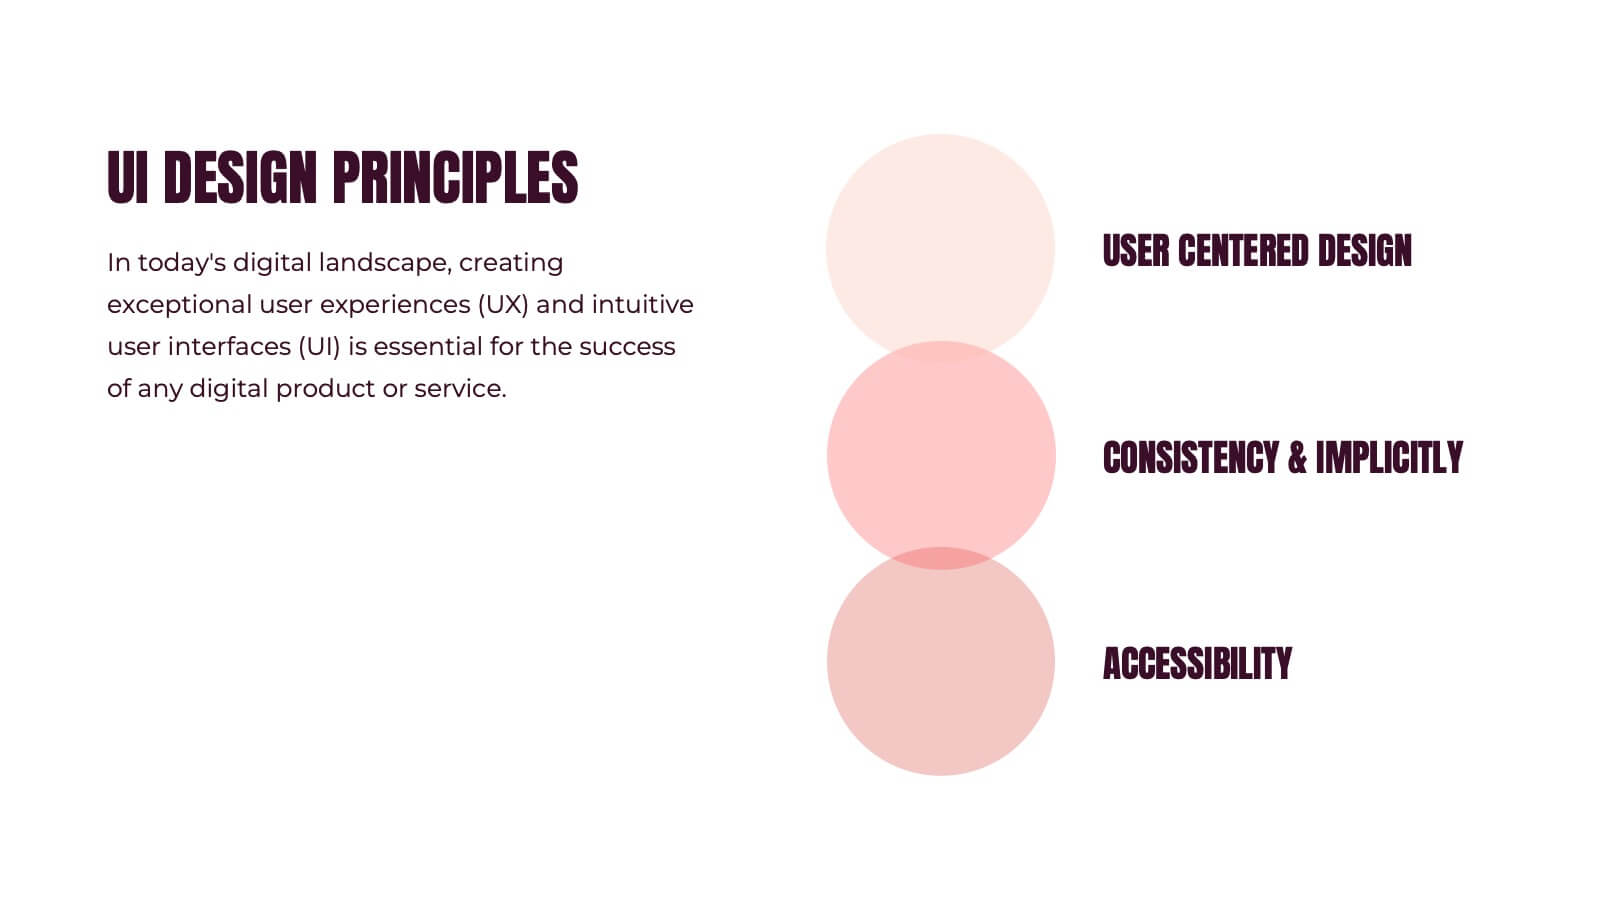
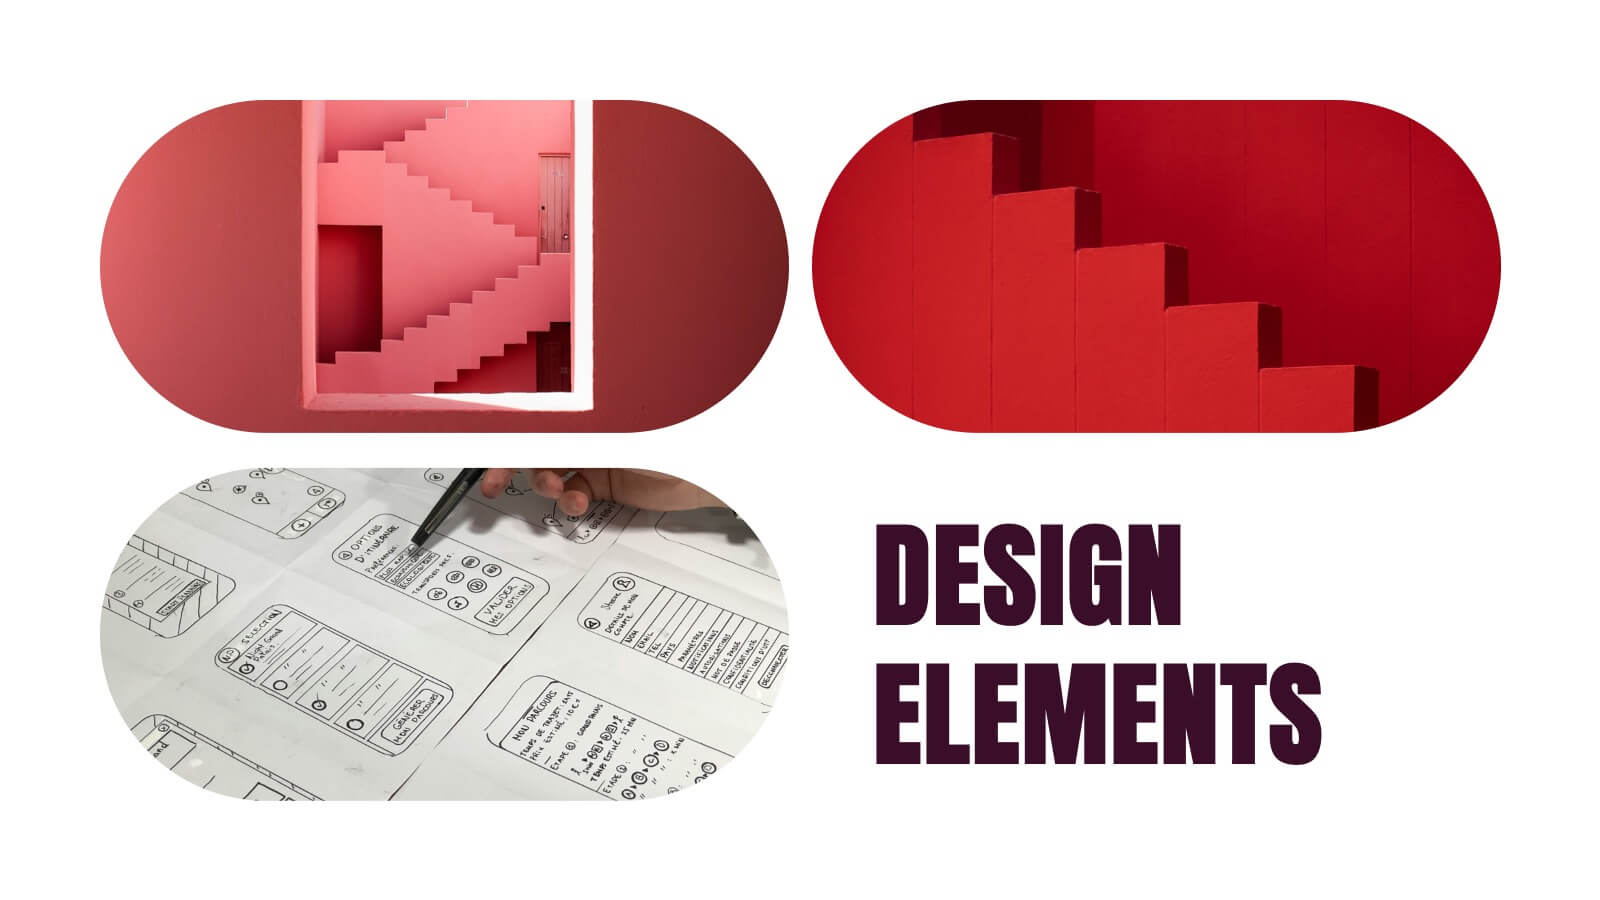
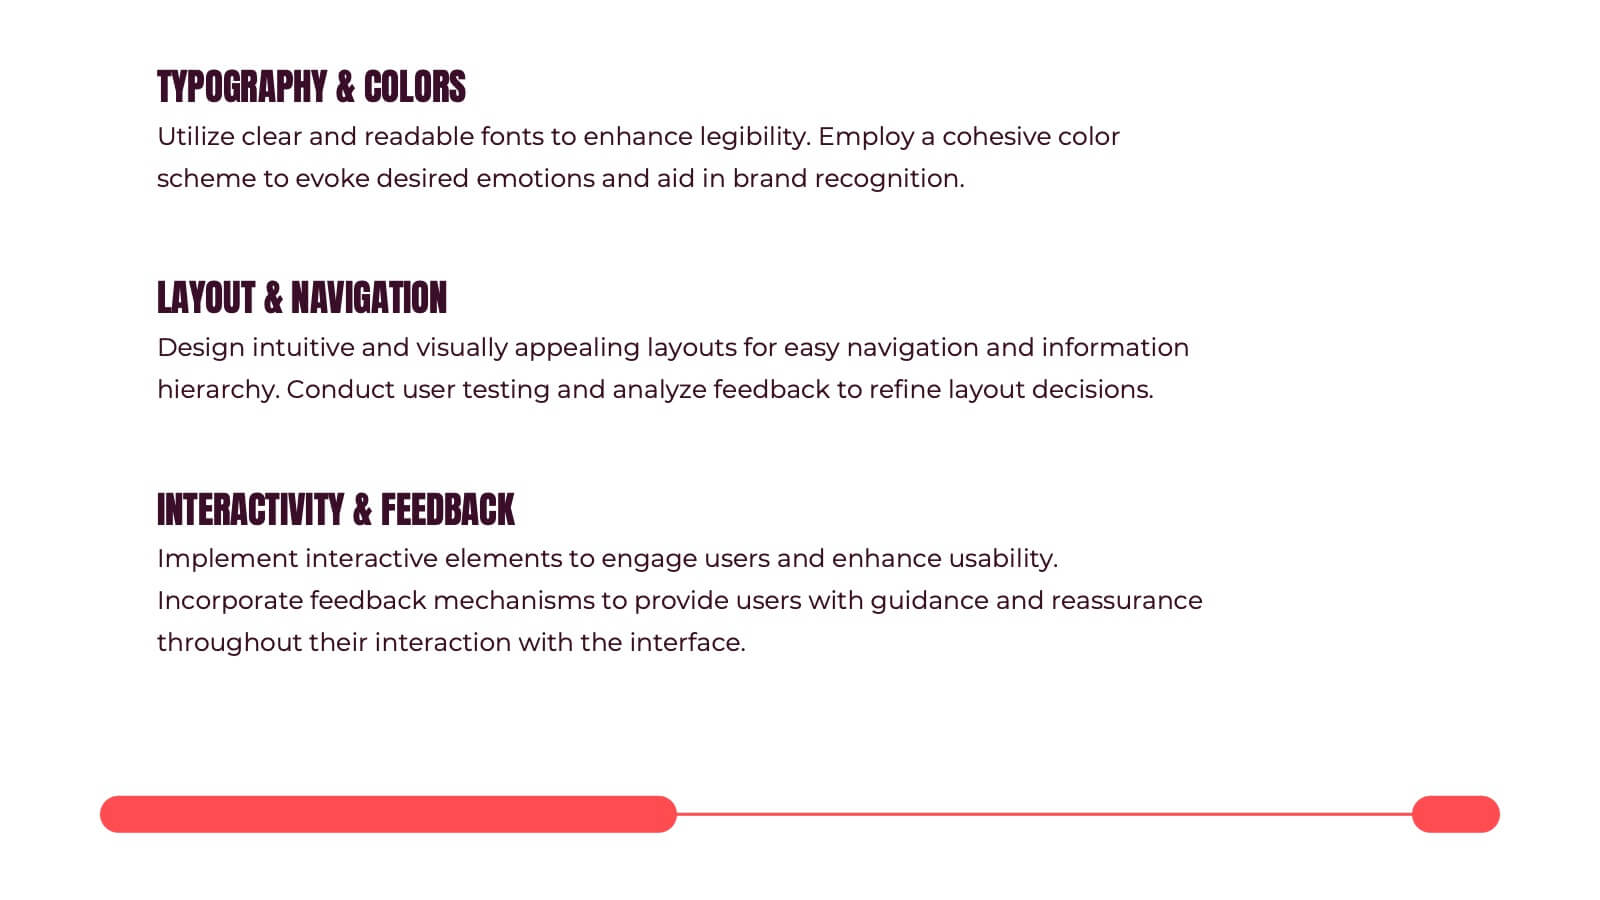
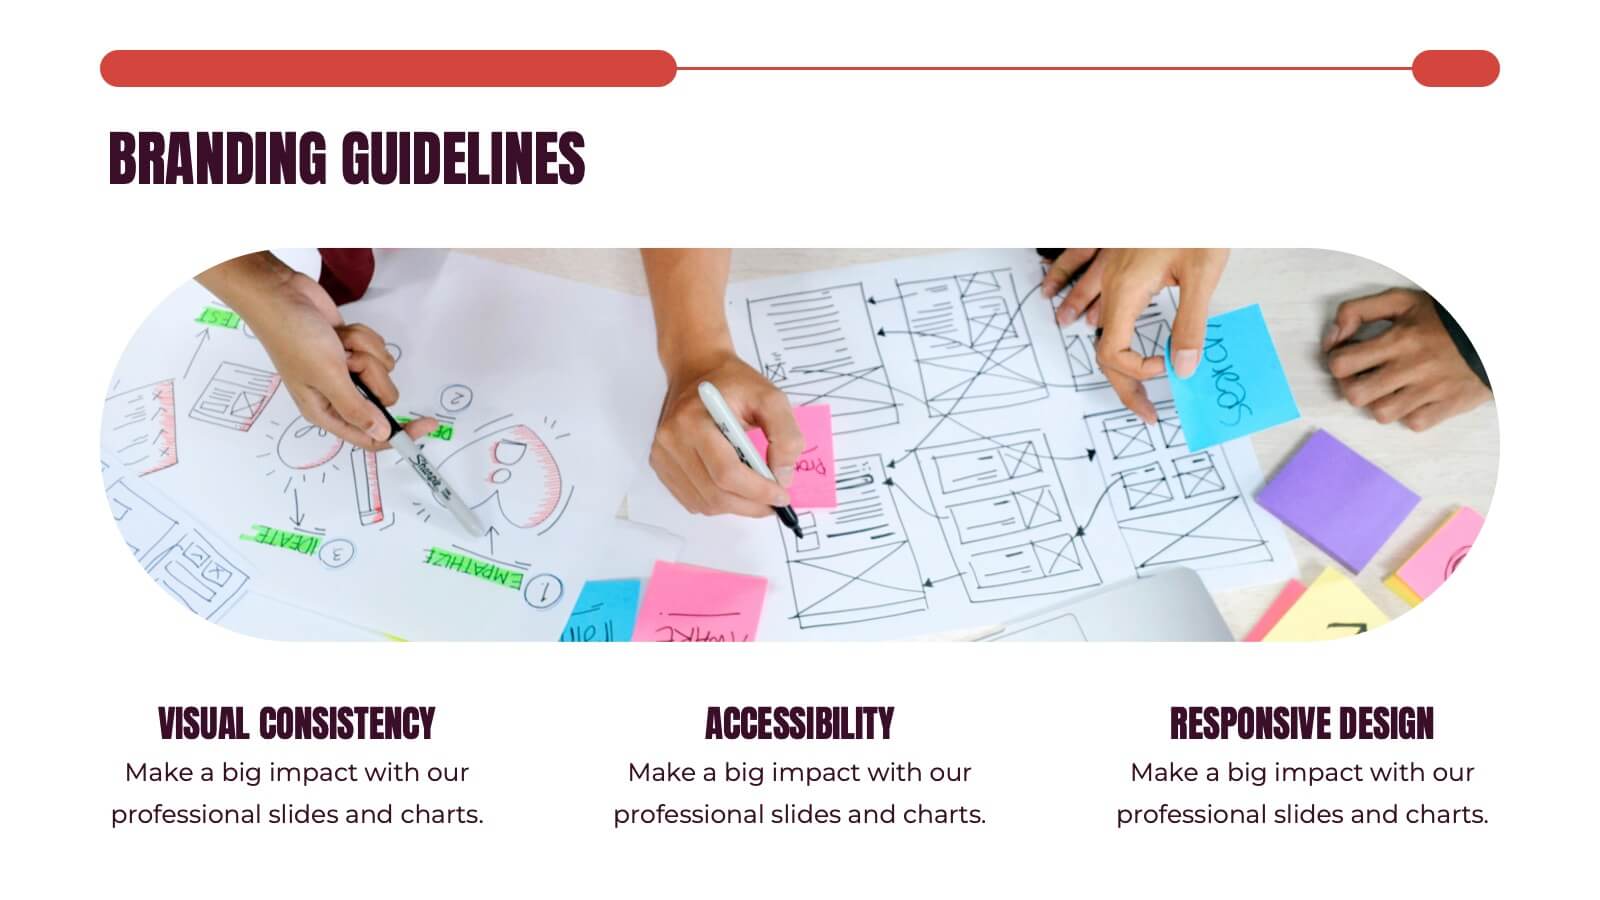
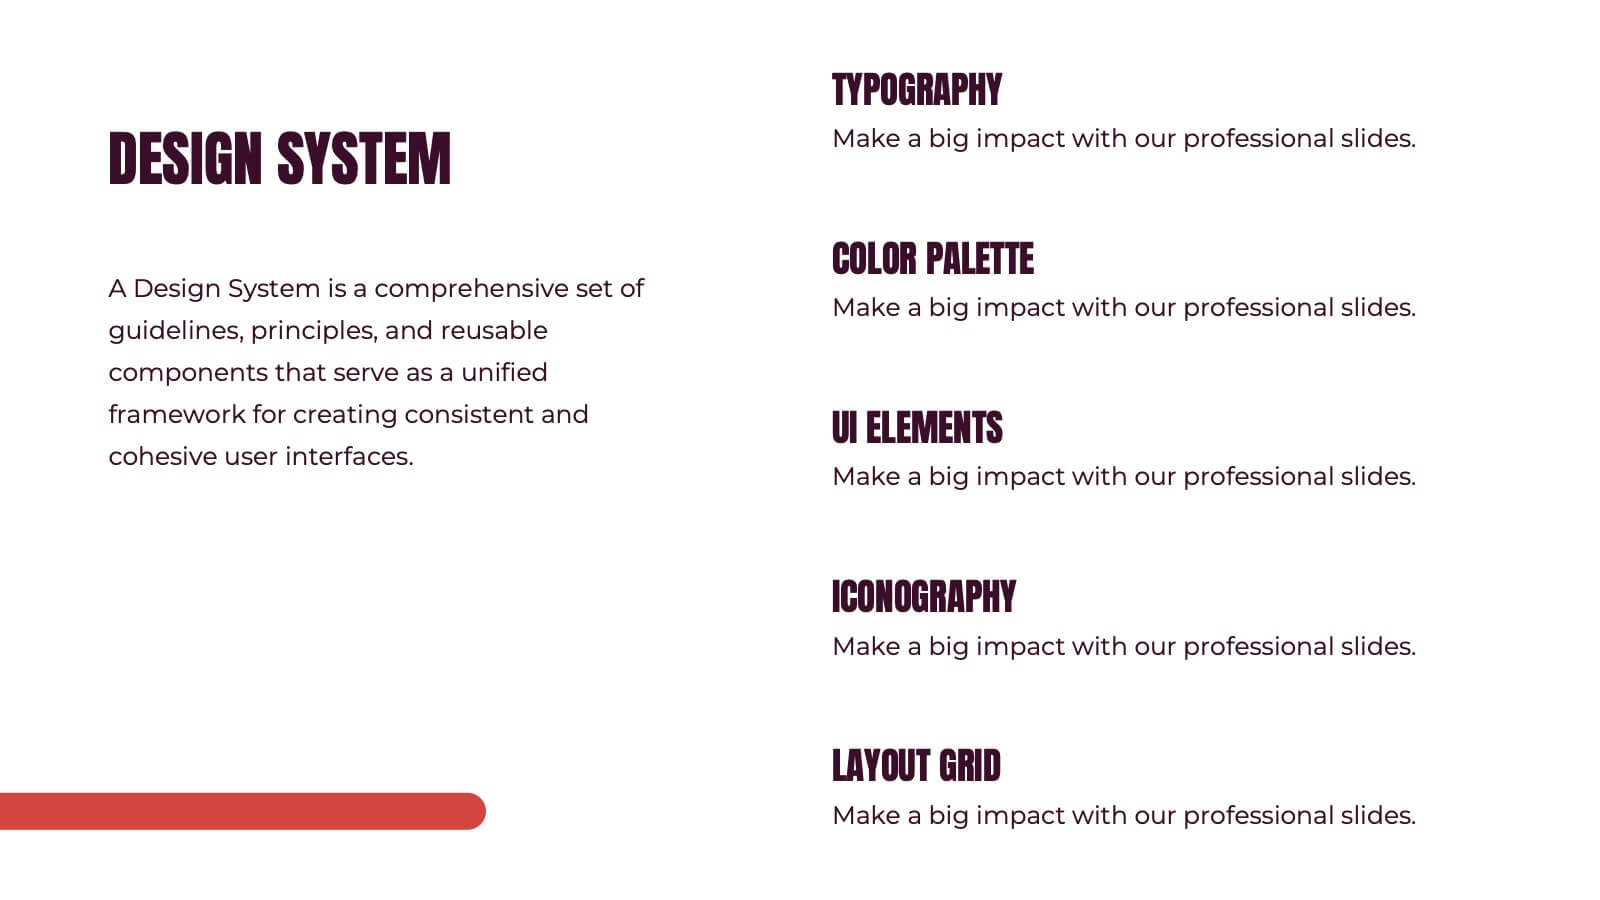
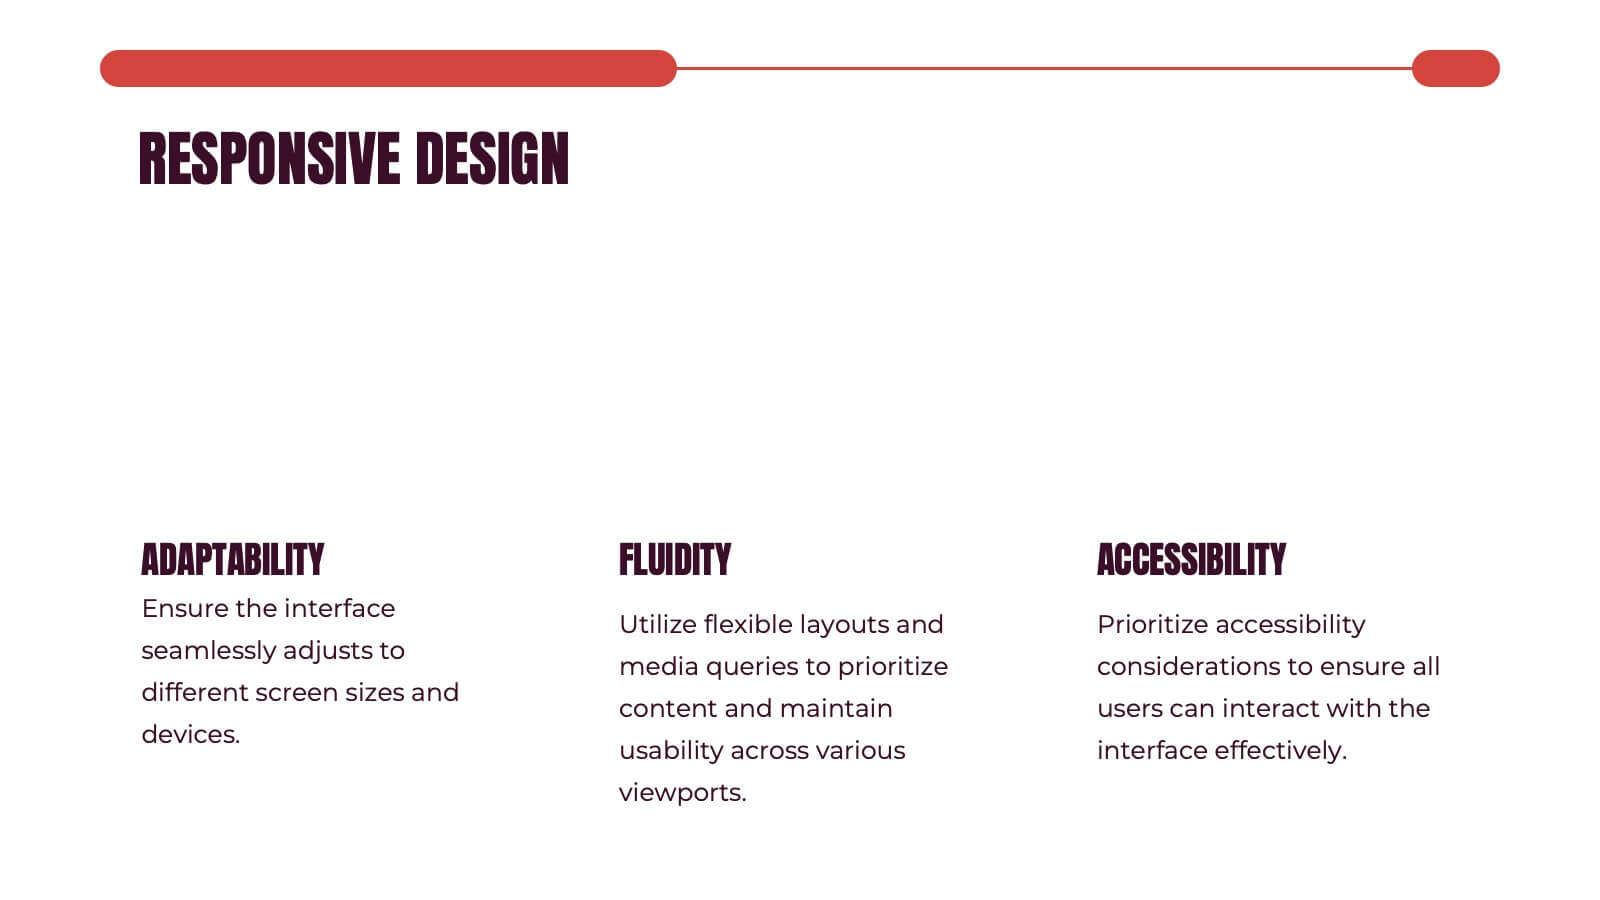
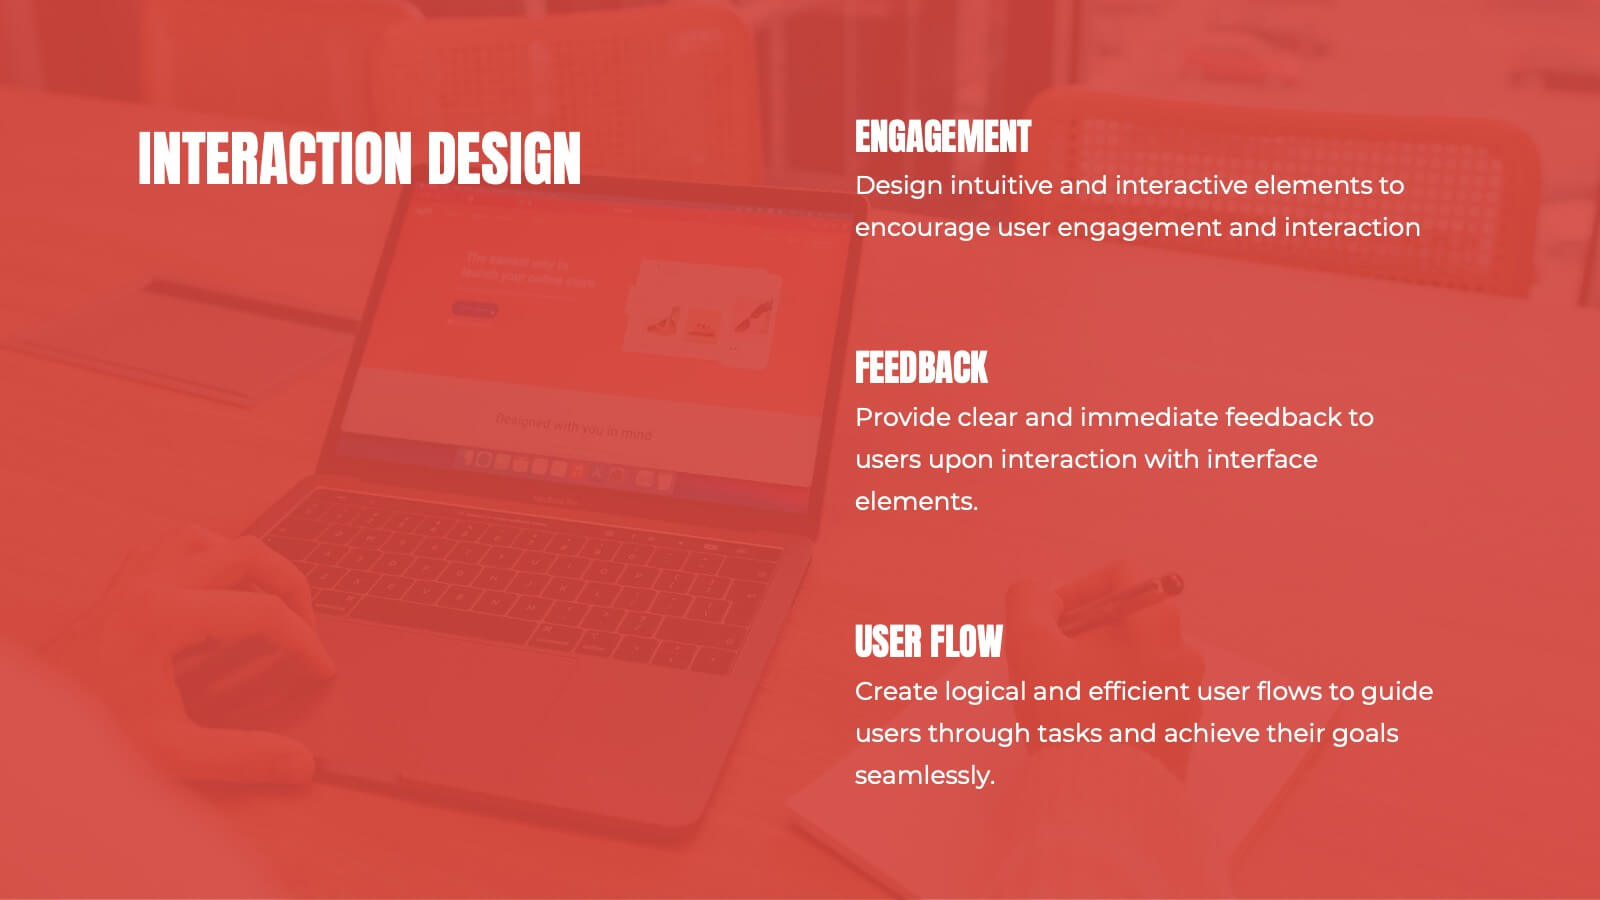
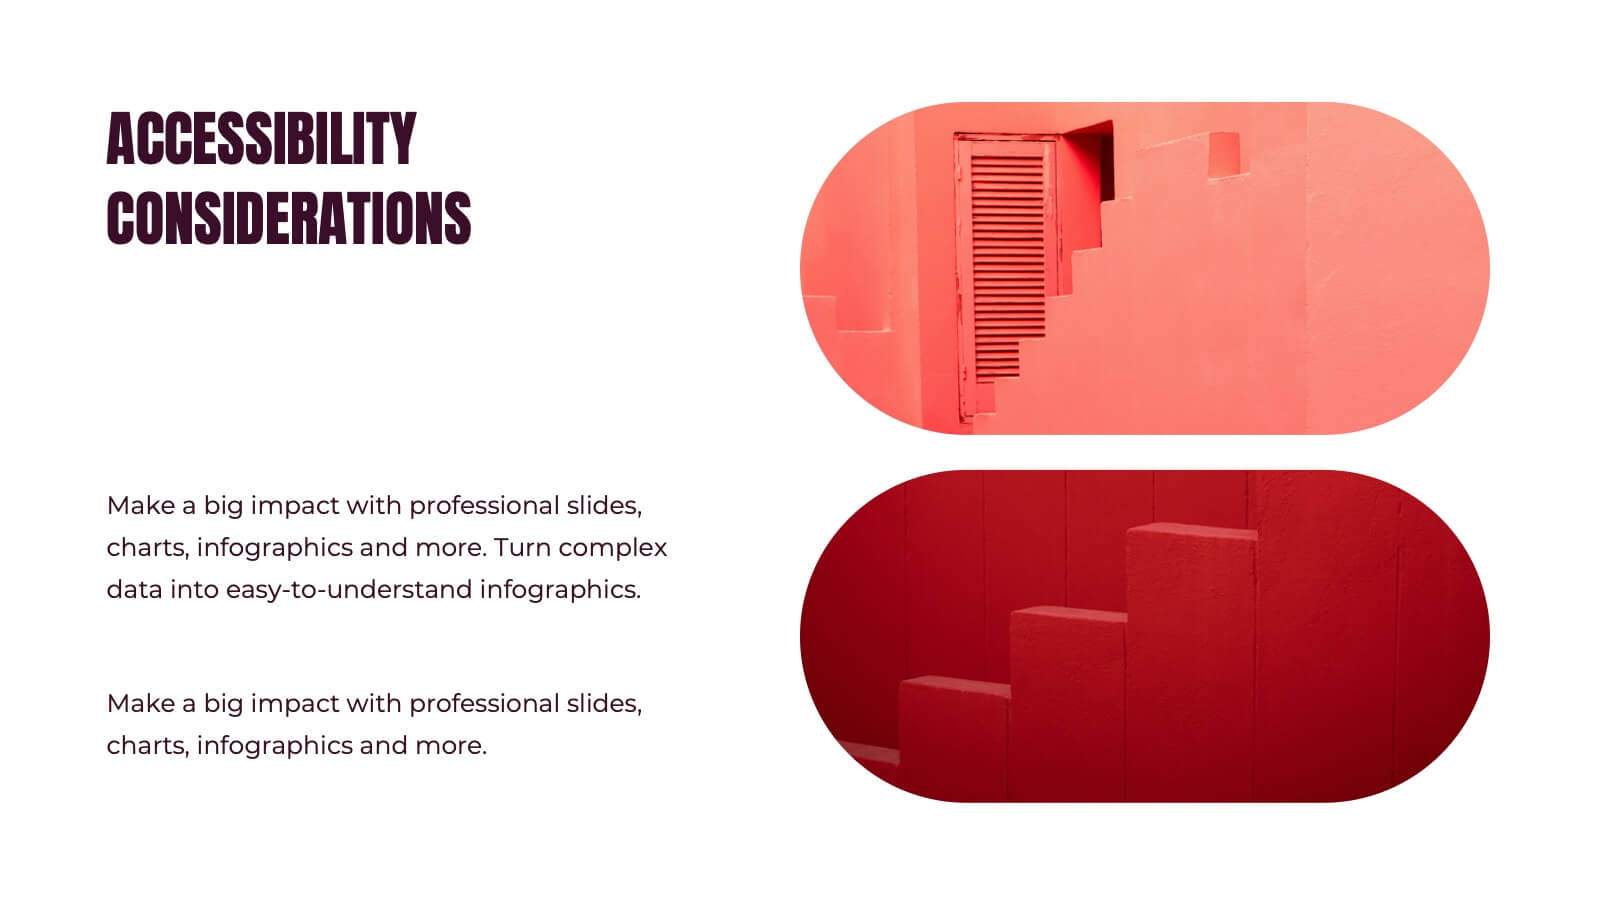
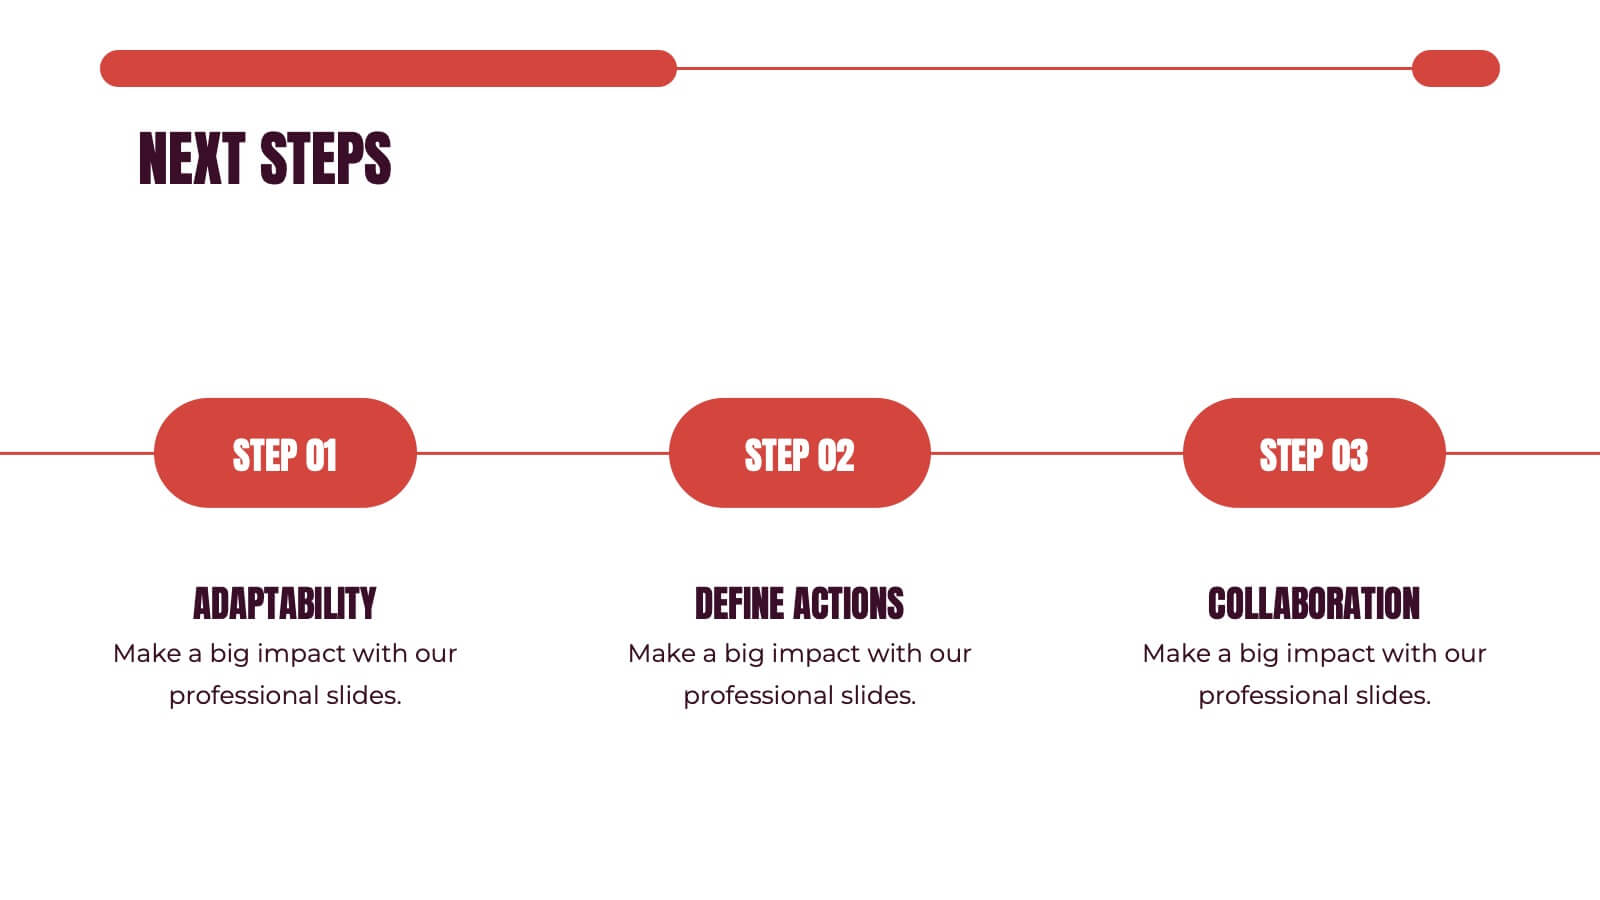
Machina UX Design Presentation
The UX Design Presentation Template is tailored for user experience projects. Covering sections like user research, personas, wireframes, prototyping, and usability guidelines, it offers a clean, professional layout. Fully customizable and compatible with PowerPoint, Keynote, and Google Slides, it's perfect for showcasing your design process and insights with clarity.


10 diapositivas
Effective Leadership Strategy Presentation
Unveil the secrets to transformative leadership with our Effective Leadership Strategy Presentation. This template guides you through essential leadership stages with visually engaging graphics, ideal for molding influential leaders. Fully compatible with PowerPoint, Keynote, and Google Slides, it's perfect for enhancing your leadership training sessions.


5 diapositivas
Hidden Risks Iceberg Model Diagram Presentation
Spotlight what lies beneath the surface with the Hidden Risks Iceberg Model Diagram Presentation. This slide helps you visually distinguish between visible issues and deeper, less obvious risks—perfect for risk assessments, compliance, safety briefings, and executive strategy discussions. Fully editable in PowerPoint, Keynote, and Google Slides for quick customization.


4 diapositivas
AI Trends and Use Cases Presentation
Step into the future with a clean, modern layout that makes complex technology easy to grasp and exciting to explore. This presentation helps you break down emerging innovations, real-world applications, and industry opportunities using clear visuals and structured sections. Fully customizable and compatible with PowerPoint, Keynote, and Google Slides.


28 diapositivas
Pitch Deck Entrepreneur's Canvas Presentation
Sharpen your business presentation with this Pitch Deck template. It covers essential areas such as market opportunity, business model, and competitive analysis, designed for startups and entrepreneurs. Fully customizable and compatible with PowerPoint, Keynote, and Google Slides, it's ideal for impressing investors and partners with your business vision.


7 diapositivas
Milestones Credit Card Infographic Presentation
A Milestones Infographic is a visual representation of significant events, accomplishments, or achievements in a project, business, or individual's life. This template include timelines, graphs, diagrams, and other visual elements to help convey important information. You can use this infographic to cover many different topics, including project management, business growth, personal achievements, or company history. This template is useful for businesses or individuals who want to showcase their accomplishments, highlight important dates or events, or just share progress updates.


4 diapositivas
Productivity and Task Prioritization Presentation
Streamline efficiency with structured task prioritization using this Productivity and Task Prioritization template. Designed with rating indicators, pie charts, and color-coded sections, this slide helps visualize task importance, workload distribution, and performance evaluations. Ideal for team leaders, project managers, and business strategists, this template is fully customizable and compatible with PowerPoint, Keynote, and Google Slides.


2 diapositivas
Office Interview Scenes Illustrations
Elevate your Interview experience with our office interview scenes illustrations pack! This is a burst of high-energy and lightheartedness that infuses the often nerve-wracking interview process with a touch of excitement and fun. These illustrations seamlessly fit into PowerPoint, Google Slides, and Keynote. Add a splash of color and playfulness to the serious nature of interviews, creating an environment where both interviewers and candidates can feel at ease!


5 diapositivas
Real-Time KPI Monitoring Dashboard Presentation
Track performance at a glance with this Real-Time KPI Monitoring Dashboard. This slide includes a clean layout with metrics, charts, and gauges to visualize your top KPIs. Perfect for business reviews, executive updates, and performance reports. Fully editable in PowerPoint, Keynote, and Google Slides for fast customization.


7 diapositivas
Strategic Alignment Using McKinsey 7S Presentation
Showcase organizational effectiveness with this Strategic Alignment Using McKinsey 7S Presentation. This diagram template visually maps all seven interconnected elements—Strategy, Structure, Systems, Shared Values, Skills, Style, and Staff—making it easy to communicate business alignment and transformation goals. Perfect for consultants, team leaders, and strategy professionals. Fully customizable in PowerPoint, Keynote, and Google Slides.


24 diapositivas
Kismet UX Design Presentation
Dive into the world of design with this stunning presentation template! Perfect for explaining user experience concepts, this template covers everything from wireframes to prototyping. It's designed to captivate your audience with visually engaging slides and clear, concise information. Compatible with PowerPoint, Keynote, and Google Slides for effortless use across platforms.


8 diapositivas
Architectural Design and Smart Home Trends Presentation
Showcase modern architecture insights and tech-savvy innovations with this layered home diagram slide. Ideal for real estate, construction, or smart home professionals, it highlights key features in a visually tiered format. Fully editable in PowerPoint, Keynote, and Google Slides—perfect for clean, tech-forward presentations with a sleek design.


4 diapositivas
Business Growth and Strategy Plan Presentation
Showcase your company’s path forward with this Business Growth and Strategy Plan Presentation. Designed with a curved arrow layout, it visually maps out three key milestones or initiatives. Ideal for strategic roadmaps, planning sessions, or executive updates. Fully editable in Canva, PowerPoint, or Google Slides.


5 diapositivas
Project Summary and Executive Highlights Presentation
Summarize key milestones with this Project Summary and Executive Highlights slide. Featuring a clean horizontal layout with icons and numbered steps, it’s perfect for spotlighting major achievements, phases, or metrics. Use it to present updates with clarity and professionalism. Fully editable in PowerPoint, Google Slides, or Canva.


6 diapositivas
Business Investment Market in Africa Map Presentation
Highlight key investment hotspots across Africa with this clean, location-based map template. Featuring labeled markers, progress bars, and editable data points, it’s ideal for showcasing project focus, regional funding, or development opportunities. Customize easily in PowerPoint, Keynote, or Google Slides to create compelling, data-driven business and finance presentations.