


Características


¿Tienes alguna pregunta?
Recomendar


7 diapositivas
Dashboard Infographic Presentation Template
A Dashboard Infographic is a visual representation of important data or information that is organized in a way that is easy to understand. This template is perfect for getting your important information across in a way that's easy to comprehend. This template is designed to present your data in a concise and clear way and it can be used to track and monitor different metrics. This dashboard template has the ability to tell a story with a set of graphs and charts that can be customized in several different ways. You can use the graphs and charts and customize them according to your needs.


5 diapositivas
Types of Photography Infographics
There are various types of photography that cater to different subjects, styles, and purposes. These vertical infographics are designed to serve as a comprehensive guide for individuals interested in exploring different genres and styles of photography. These will allow you to provide an overview of different genres and types of photography. They aim to inform viewers about the diverse fields of photography, allowing them to explore various styles and find their areas of interest. Whether used in photography workshops, educational materials, or creative presentations, this template provides valuable insights and inspiration for individuals passionate about the art of photography.


4 diapositivas
Project Responsibility Assignment Matrix Presentation
Visualize team roles and task accountability at a glance with this Project Responsibility Assignment Matrix. This structured layout categorizes assignments using the RACI model—Responsible, Accountable, Consulted, and Informed—organized by team and position. Ideal for project managers, team leads, and operations planners, it helps ensure clarity, reduce overlap, and promote accountability across departments. Easily editable in PowerPoint, Keynote, and Google Slides for seamless customization and cross-platform use.


21 diapositivas
Mystara Project Status Report Presentation
Keep stakeholders informed with this clean and professional project status report template. Cover key areas such as performance metrics, financial summaries, team productivity, and future priorities. Perfect for tracking progress and making data-driven decisions. Fully customizable for PowerPoint, Keynote, and Google Slides.


5 diapositivas
Procurement Strategy Presentation
ChatGPT PlusBring clarity and structure to your business process with this modern, visually engaging presentation. Perfect for outlining purchasing plans, supplier relationships, and cost-saving strategies, it helps convey information with precision and flow. Fully customizable and compatible with PowerPoint, Keynote, and Google Slides for seamless editing and professional results.


6 diapositivas
Geographic Asia Overview Template Presentation
Discover insights across Asia with a clean, professional layout that brings your regional data to life. Perfect for showcasing demographics, market distribution, or geographic highlights, this visual map design ensures clarity and impact in every slide. Fully compatible with PowerPoint, Keynote, and Google Slides for effortless editing and presentation.


6 diapositivas
Product Introduction Infographic
Showcase your new products with our series of slide templates designed for impactful product introductions. Each template is crafted to highlight the unique features and benefits of your products, making them ideal for launch presentations, marketing meetings, and stakeholder briefings. Featuring a clean and modern design, these slides are structured to guide the audience through a compelling narrative about your product, from its conception to its market entry. The use of vivid imagery, alongside detailed text descriptions, ensures that each aspect of the product is clearly communicated and visually engaging. Customizable to suit your specific needs, these templates can be adapted to feature your product’s specifications, advantages, and potential impact. They serve as a crucial tool for organizations looking to generate excitement and support for new offerings, providing a professional and persuasive presentation format.

21 diapositivas
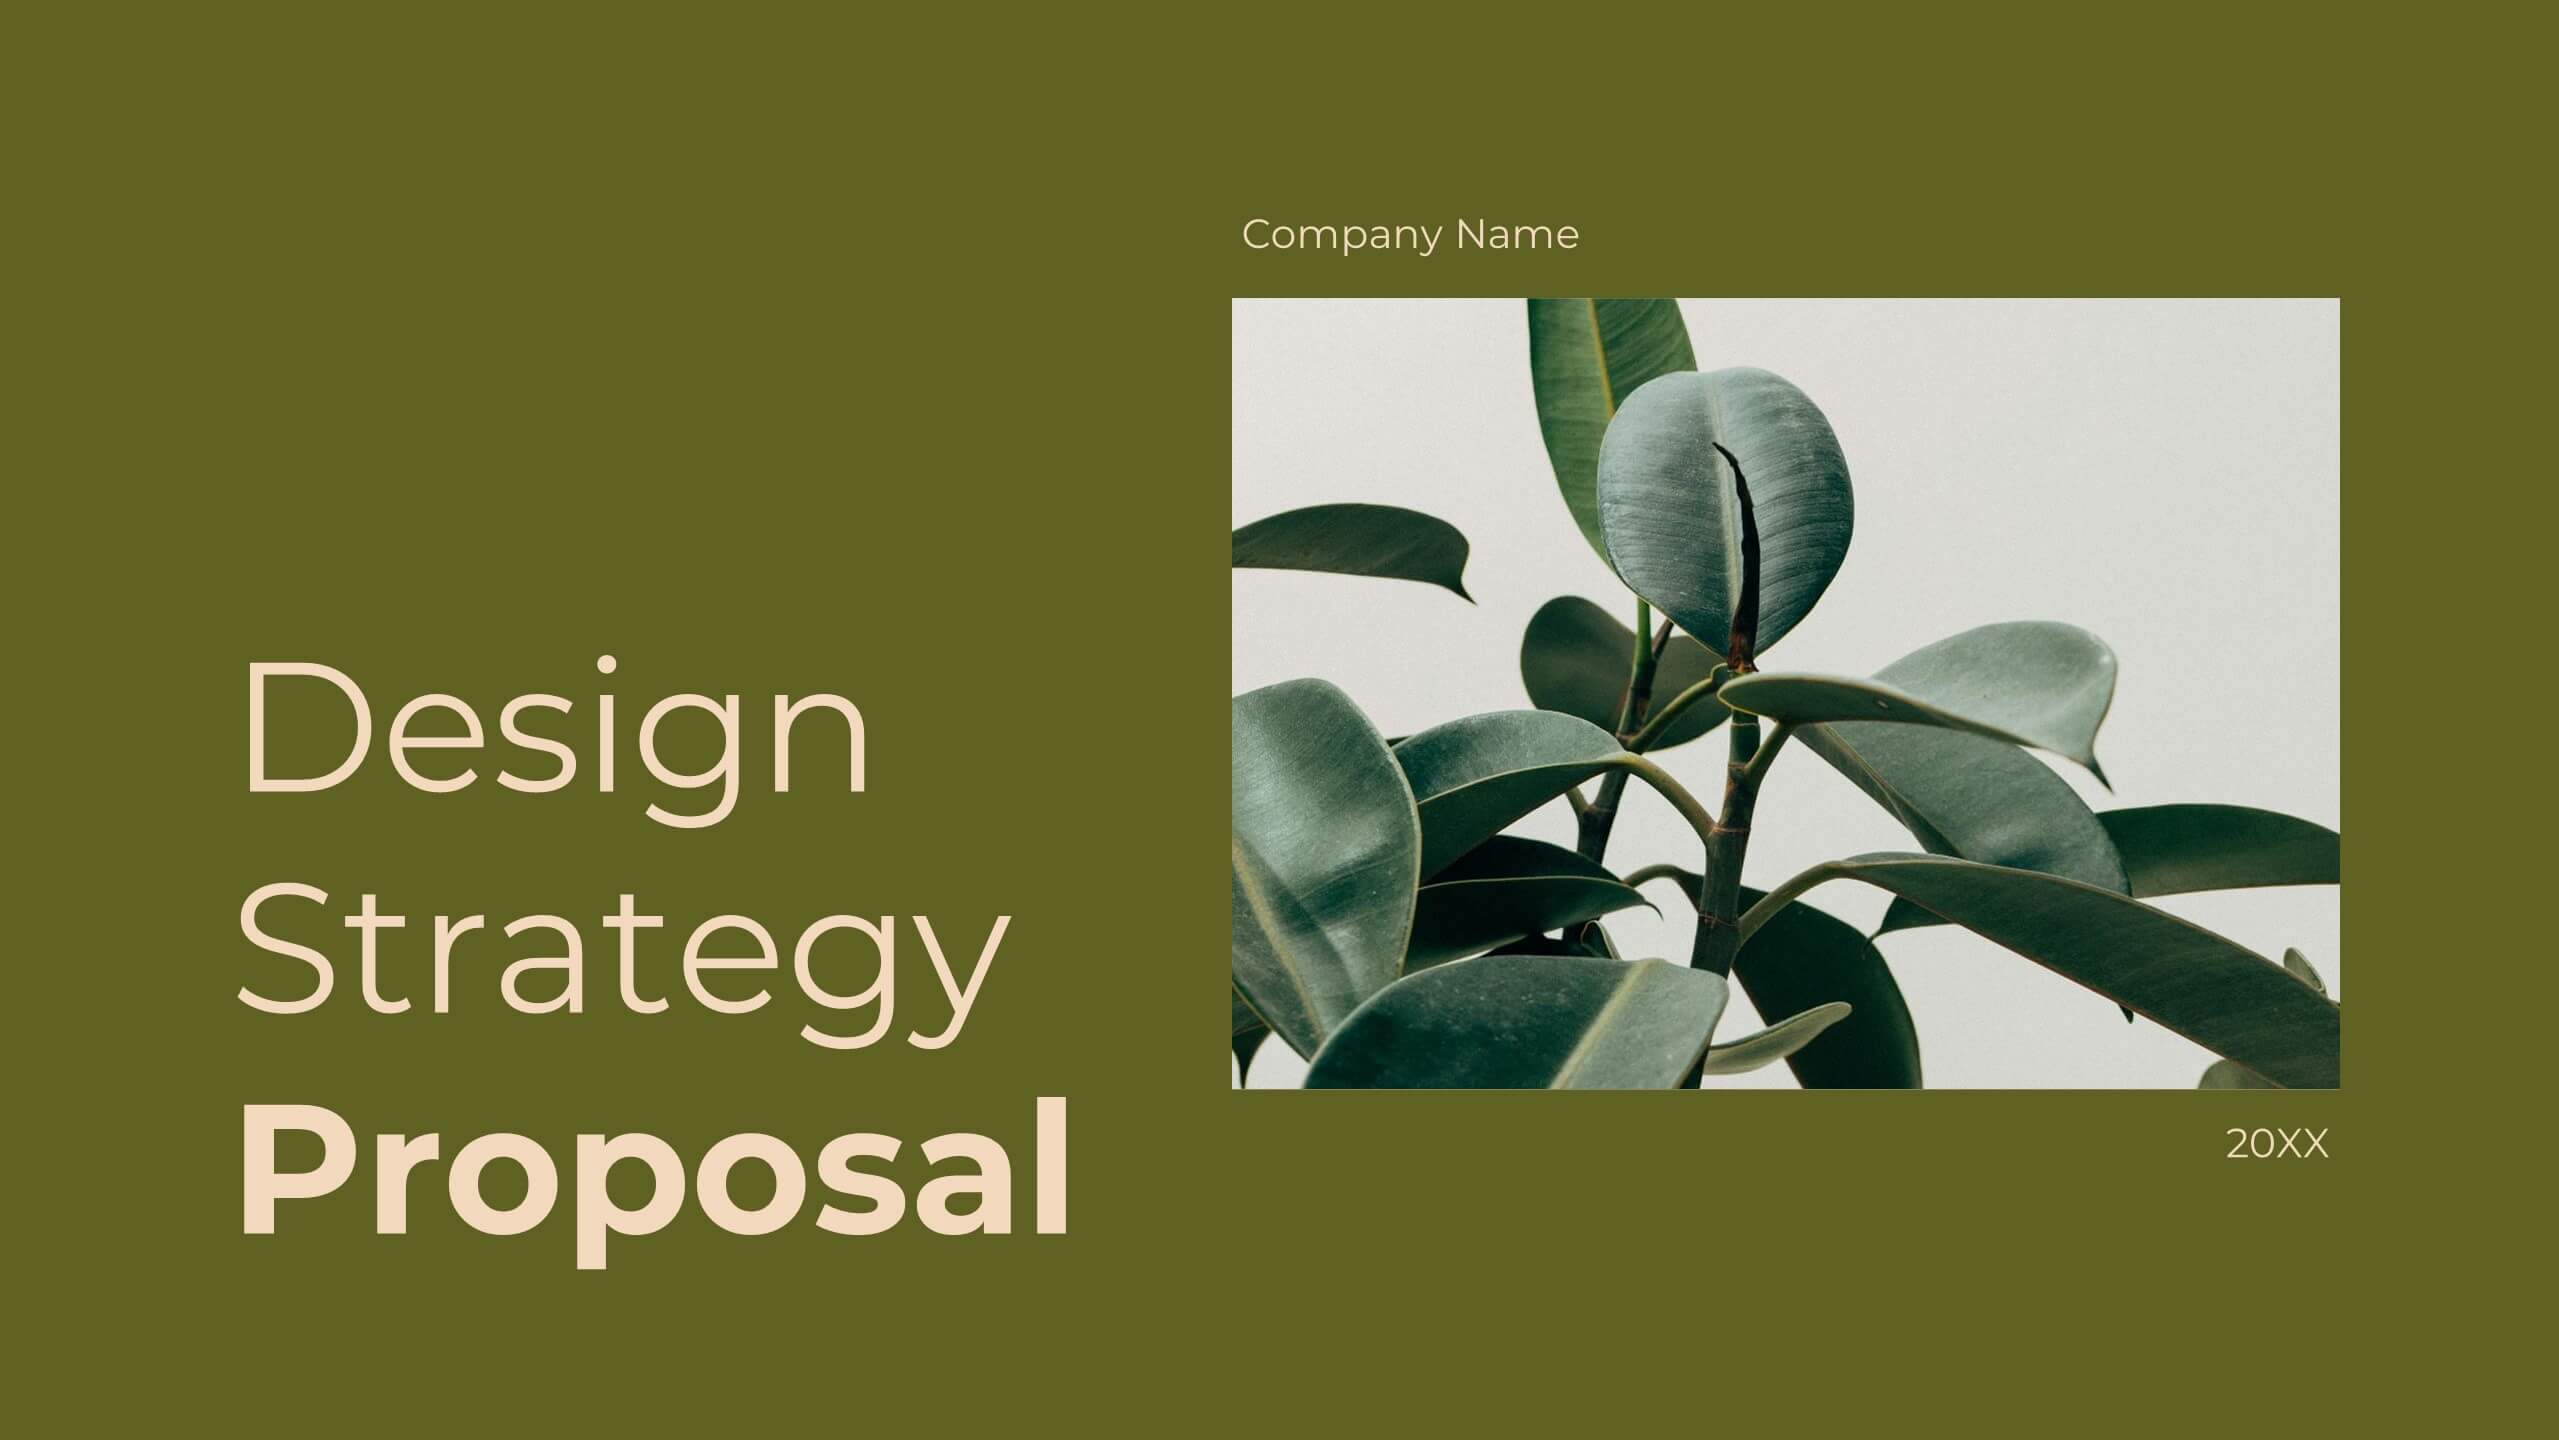
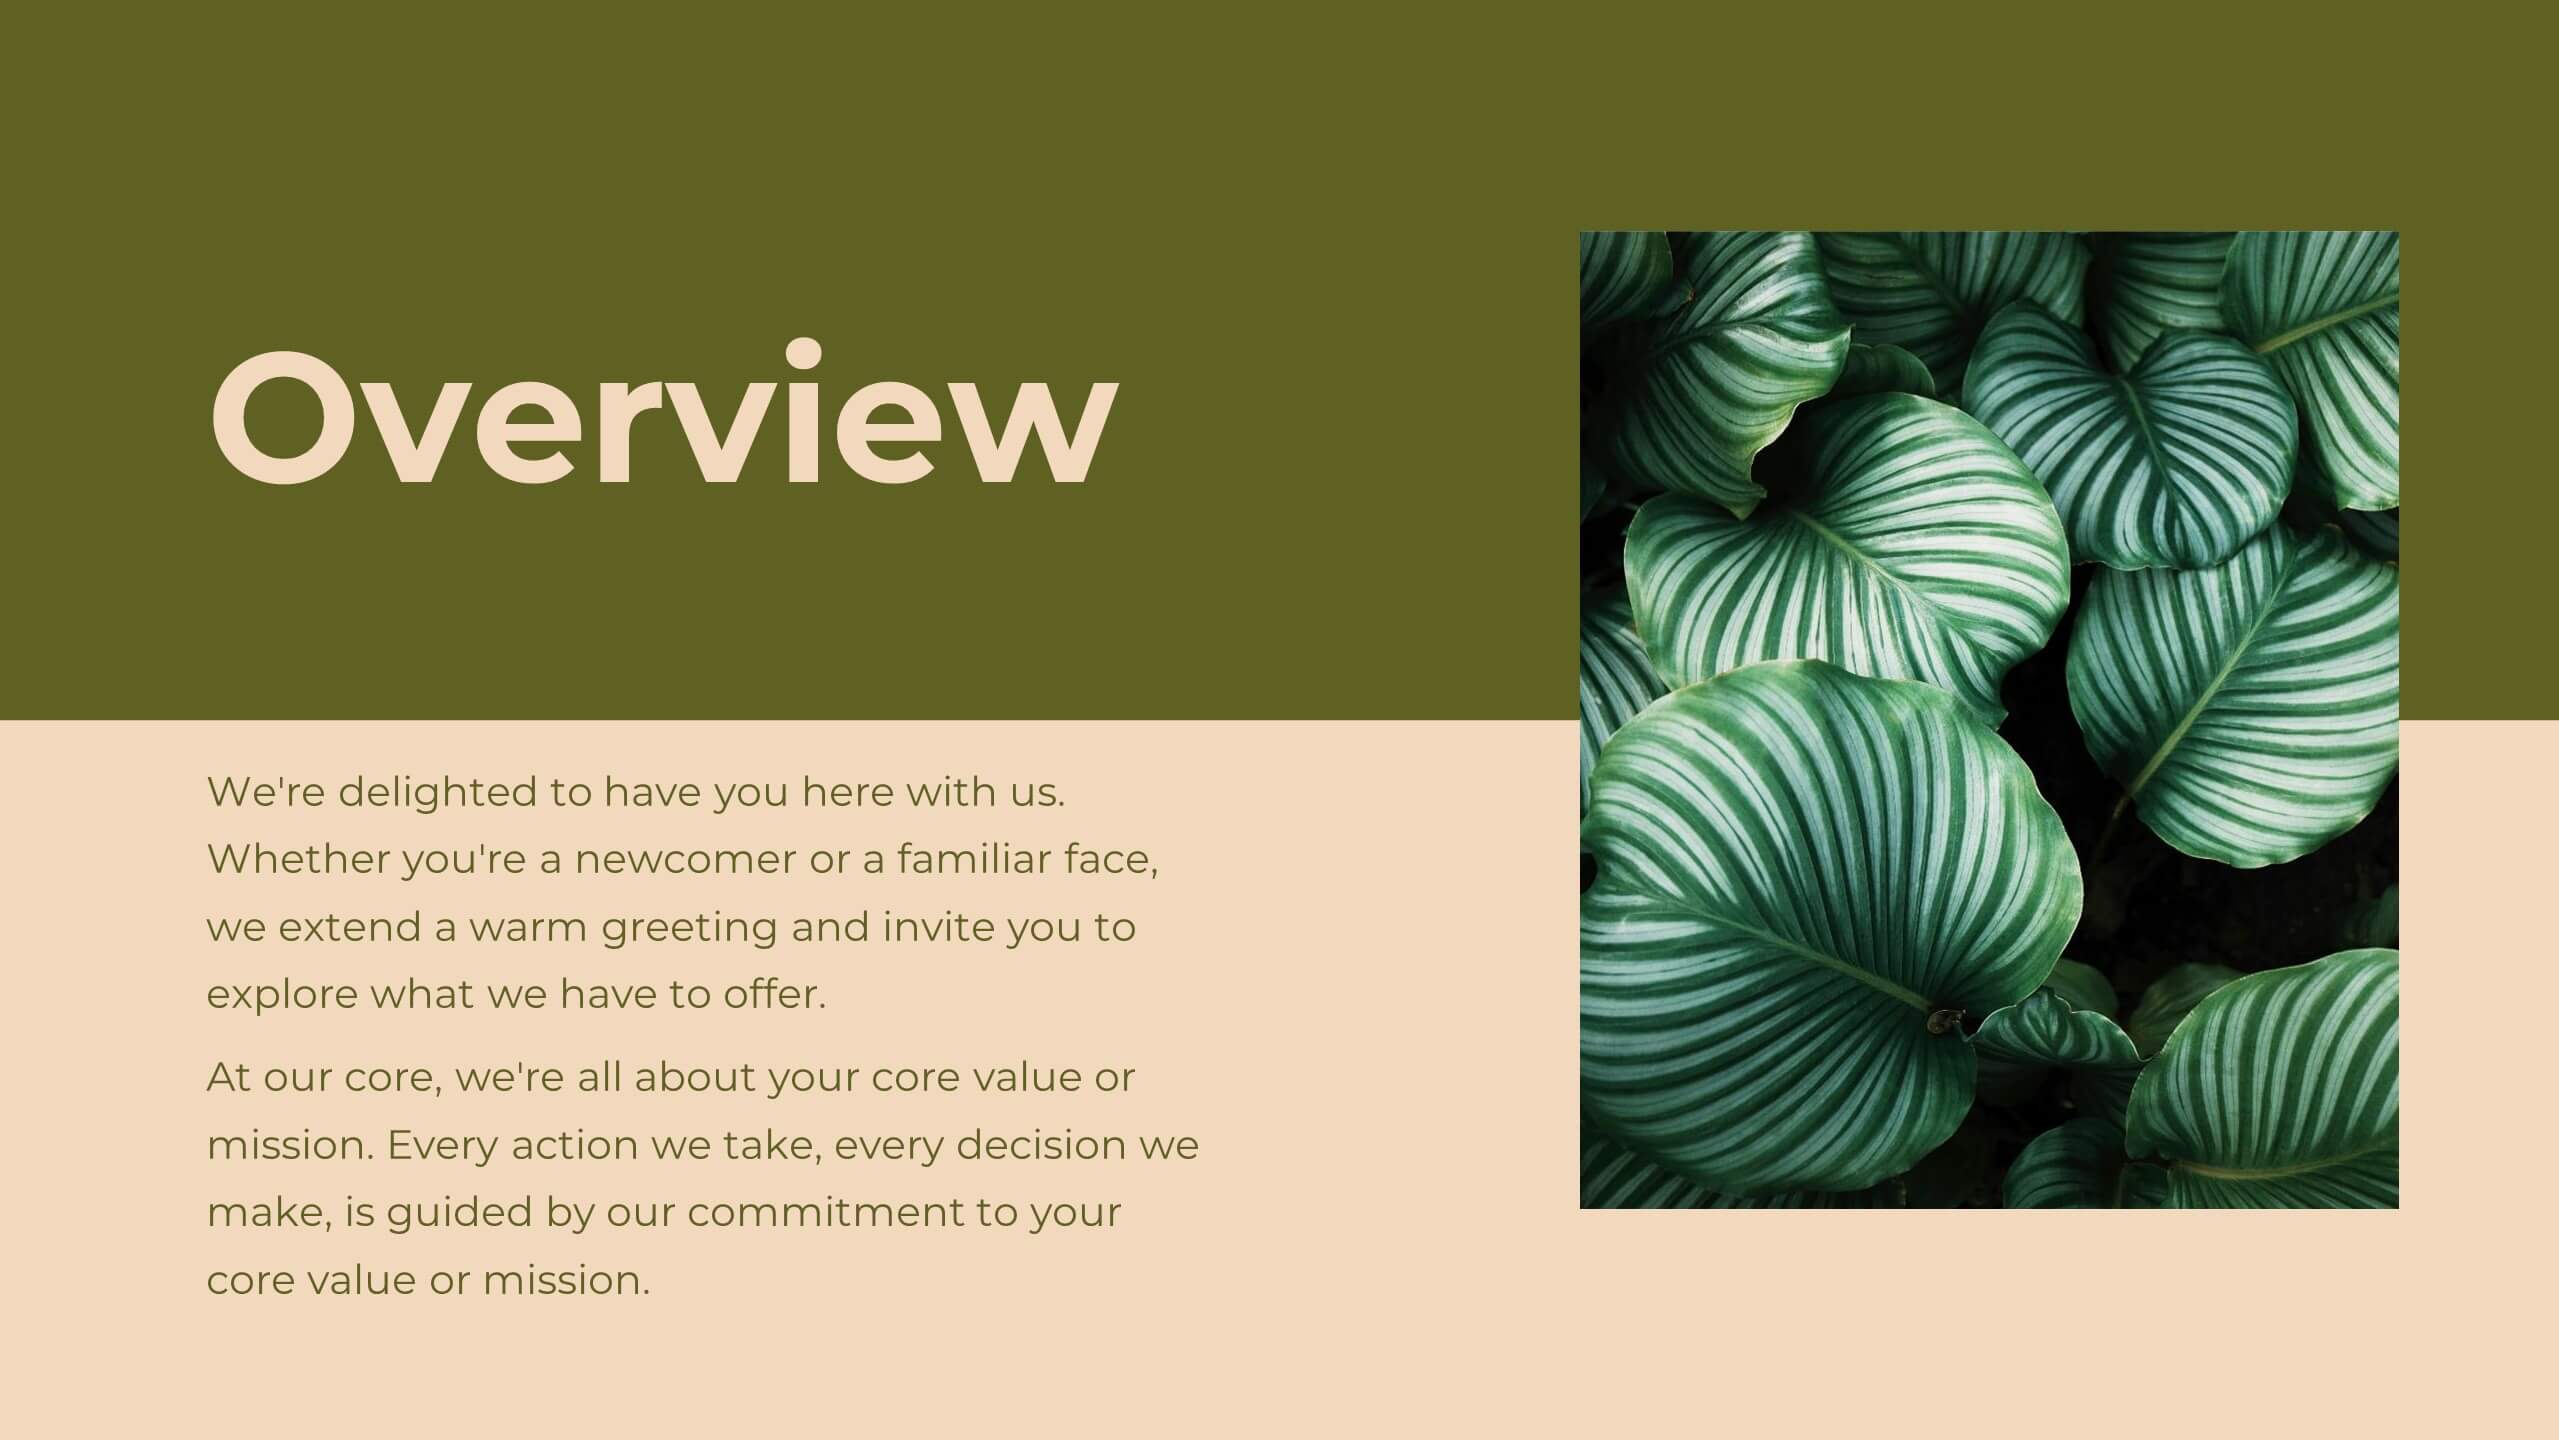
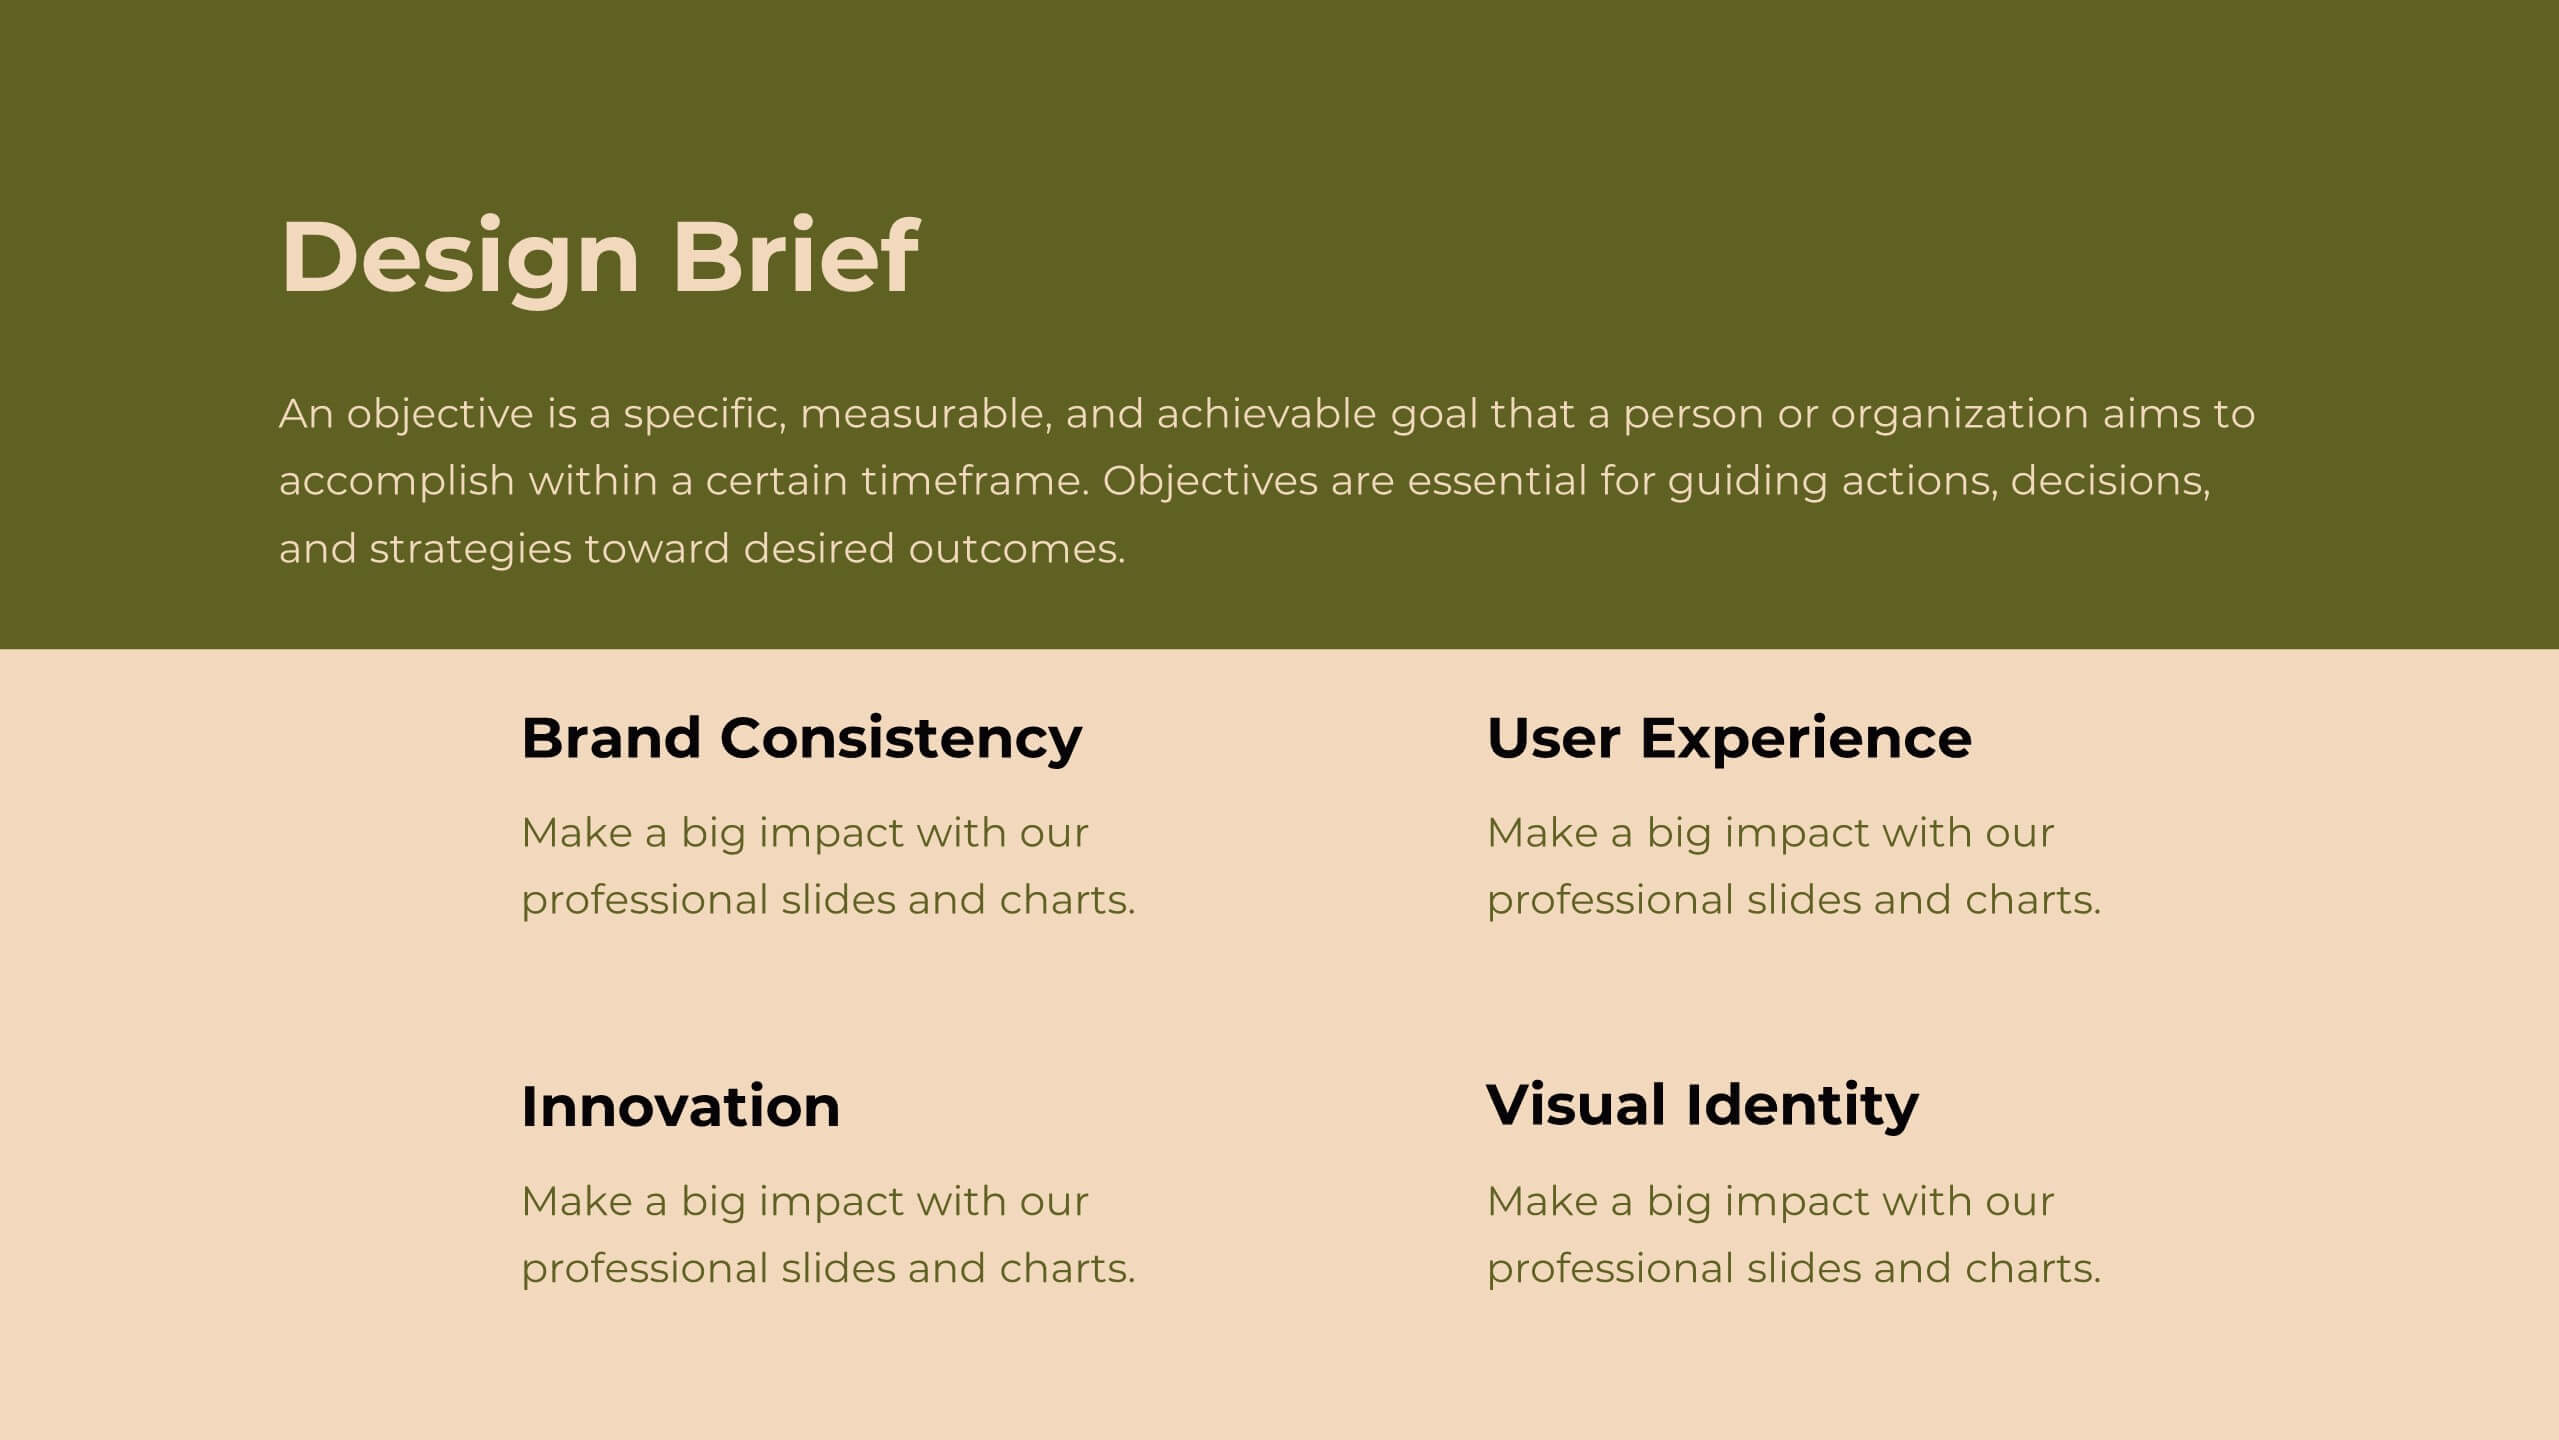
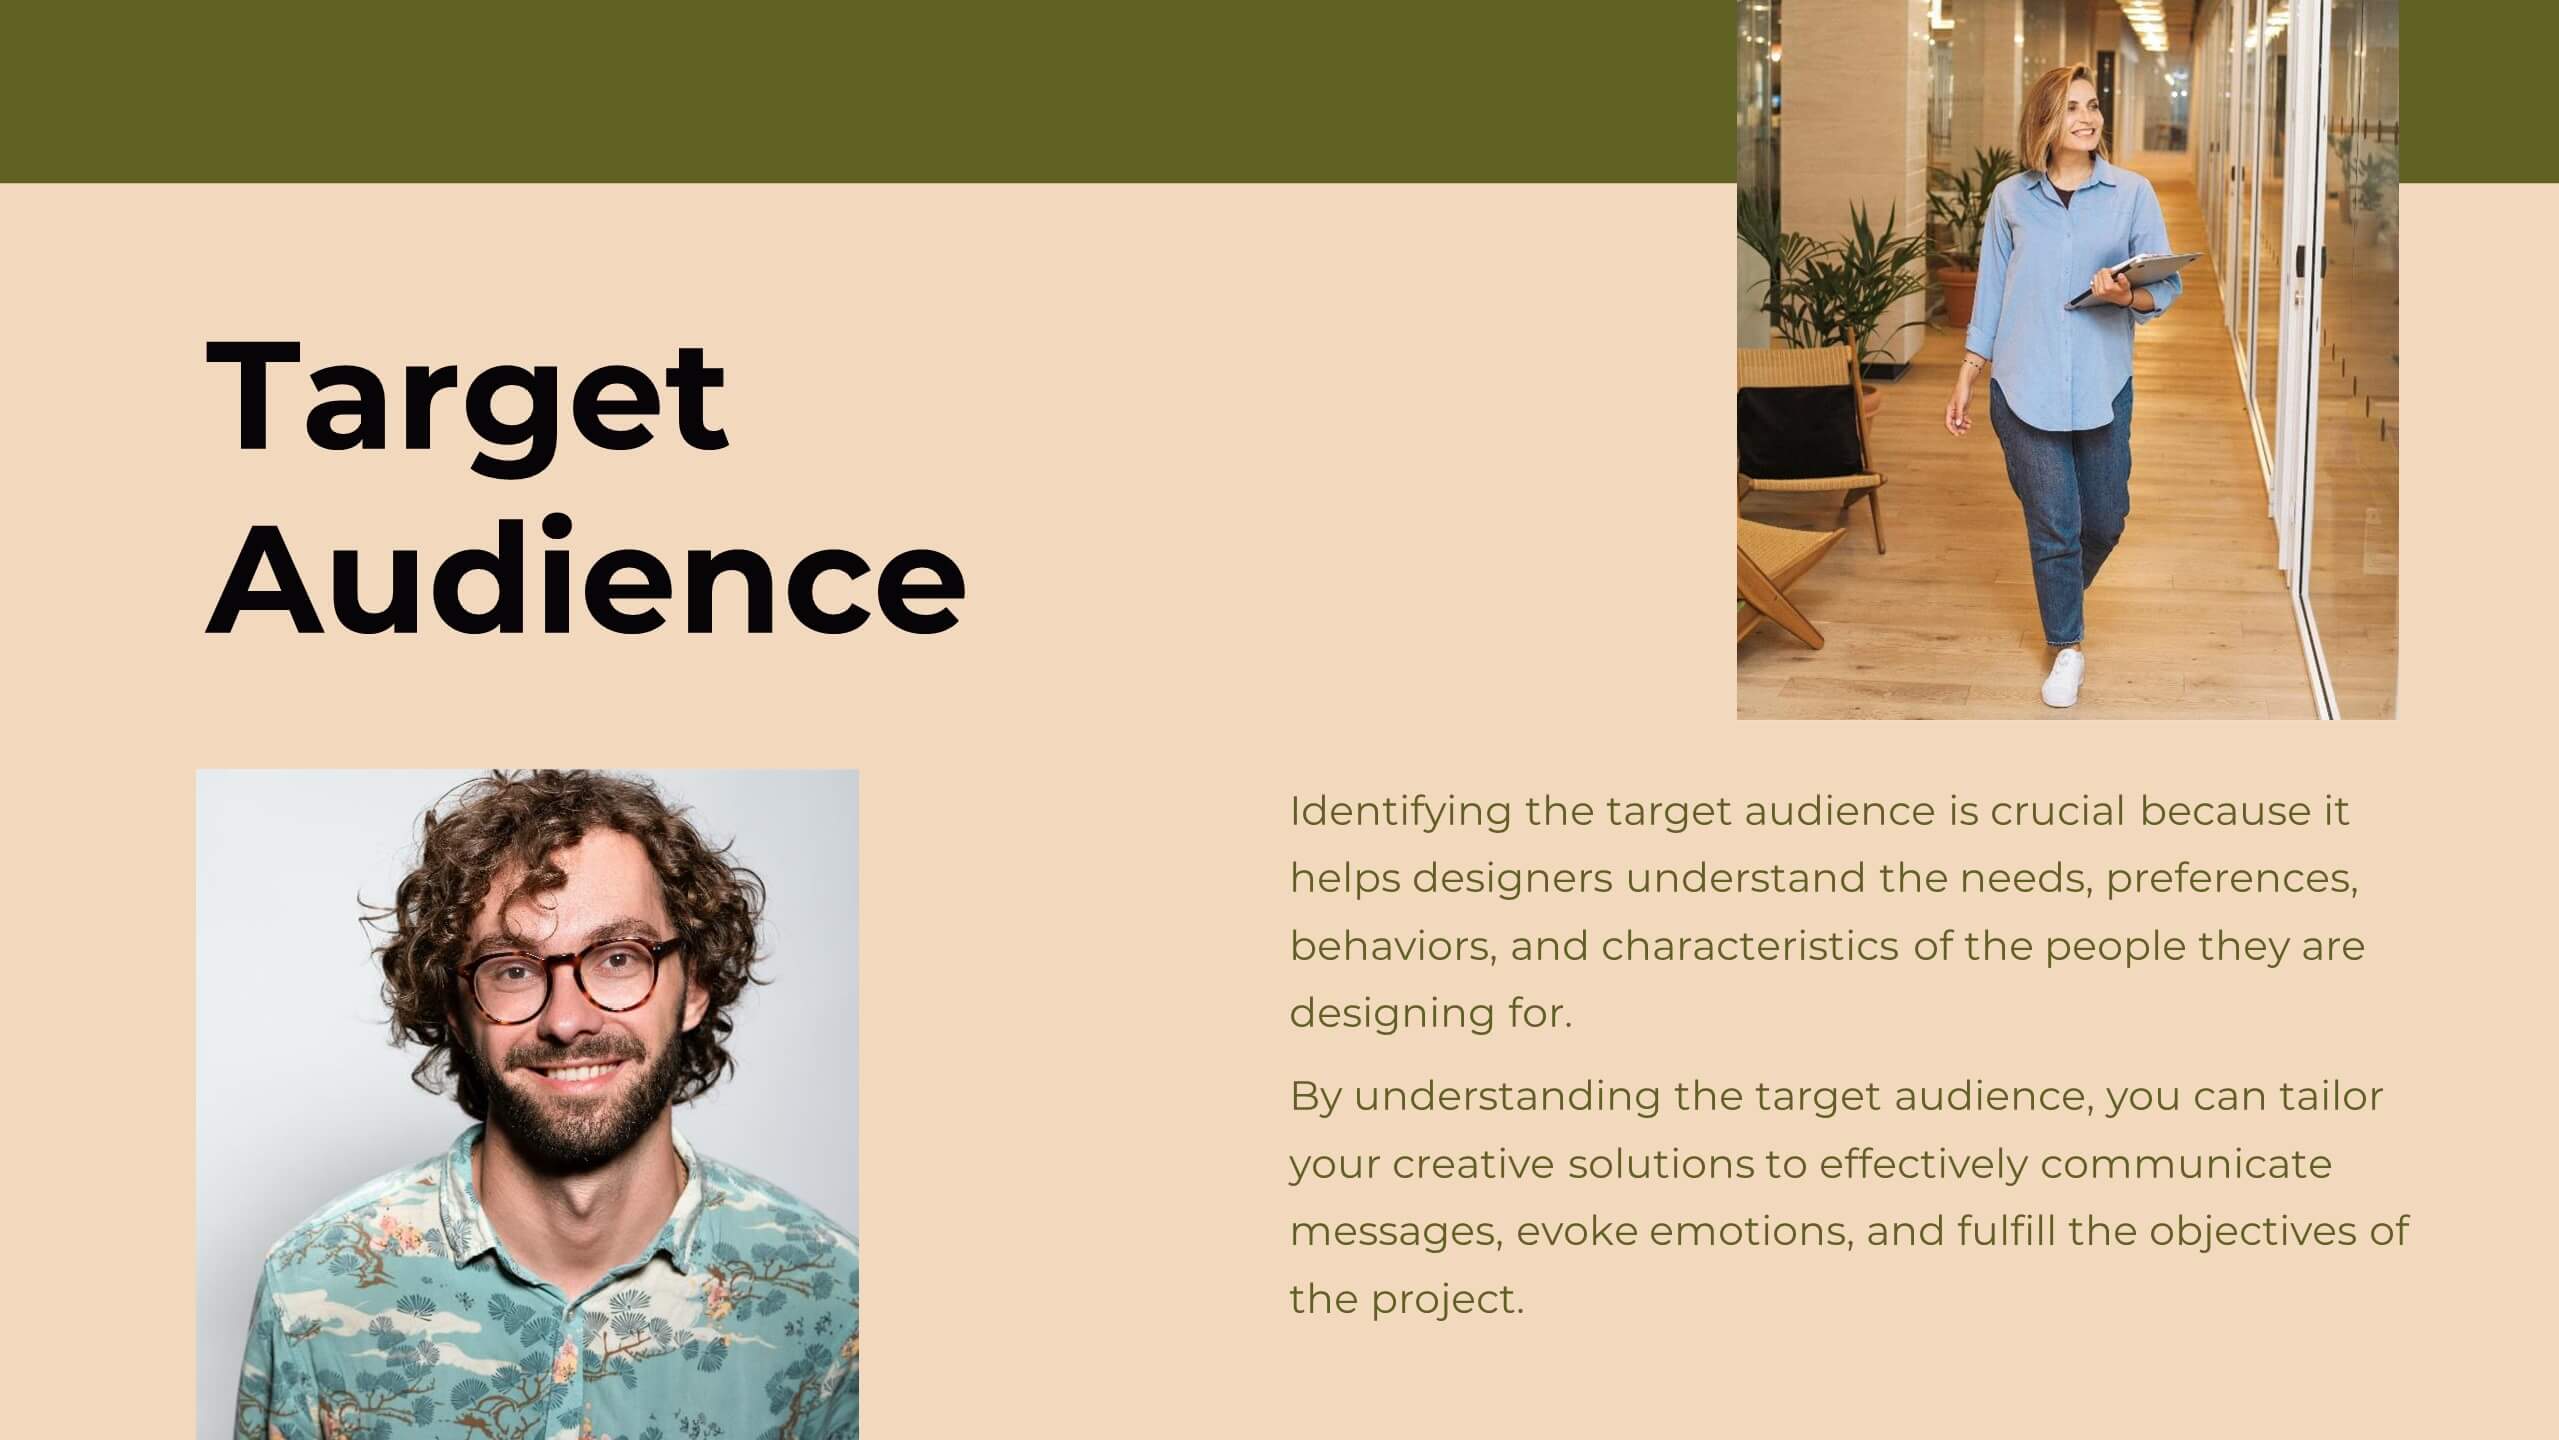
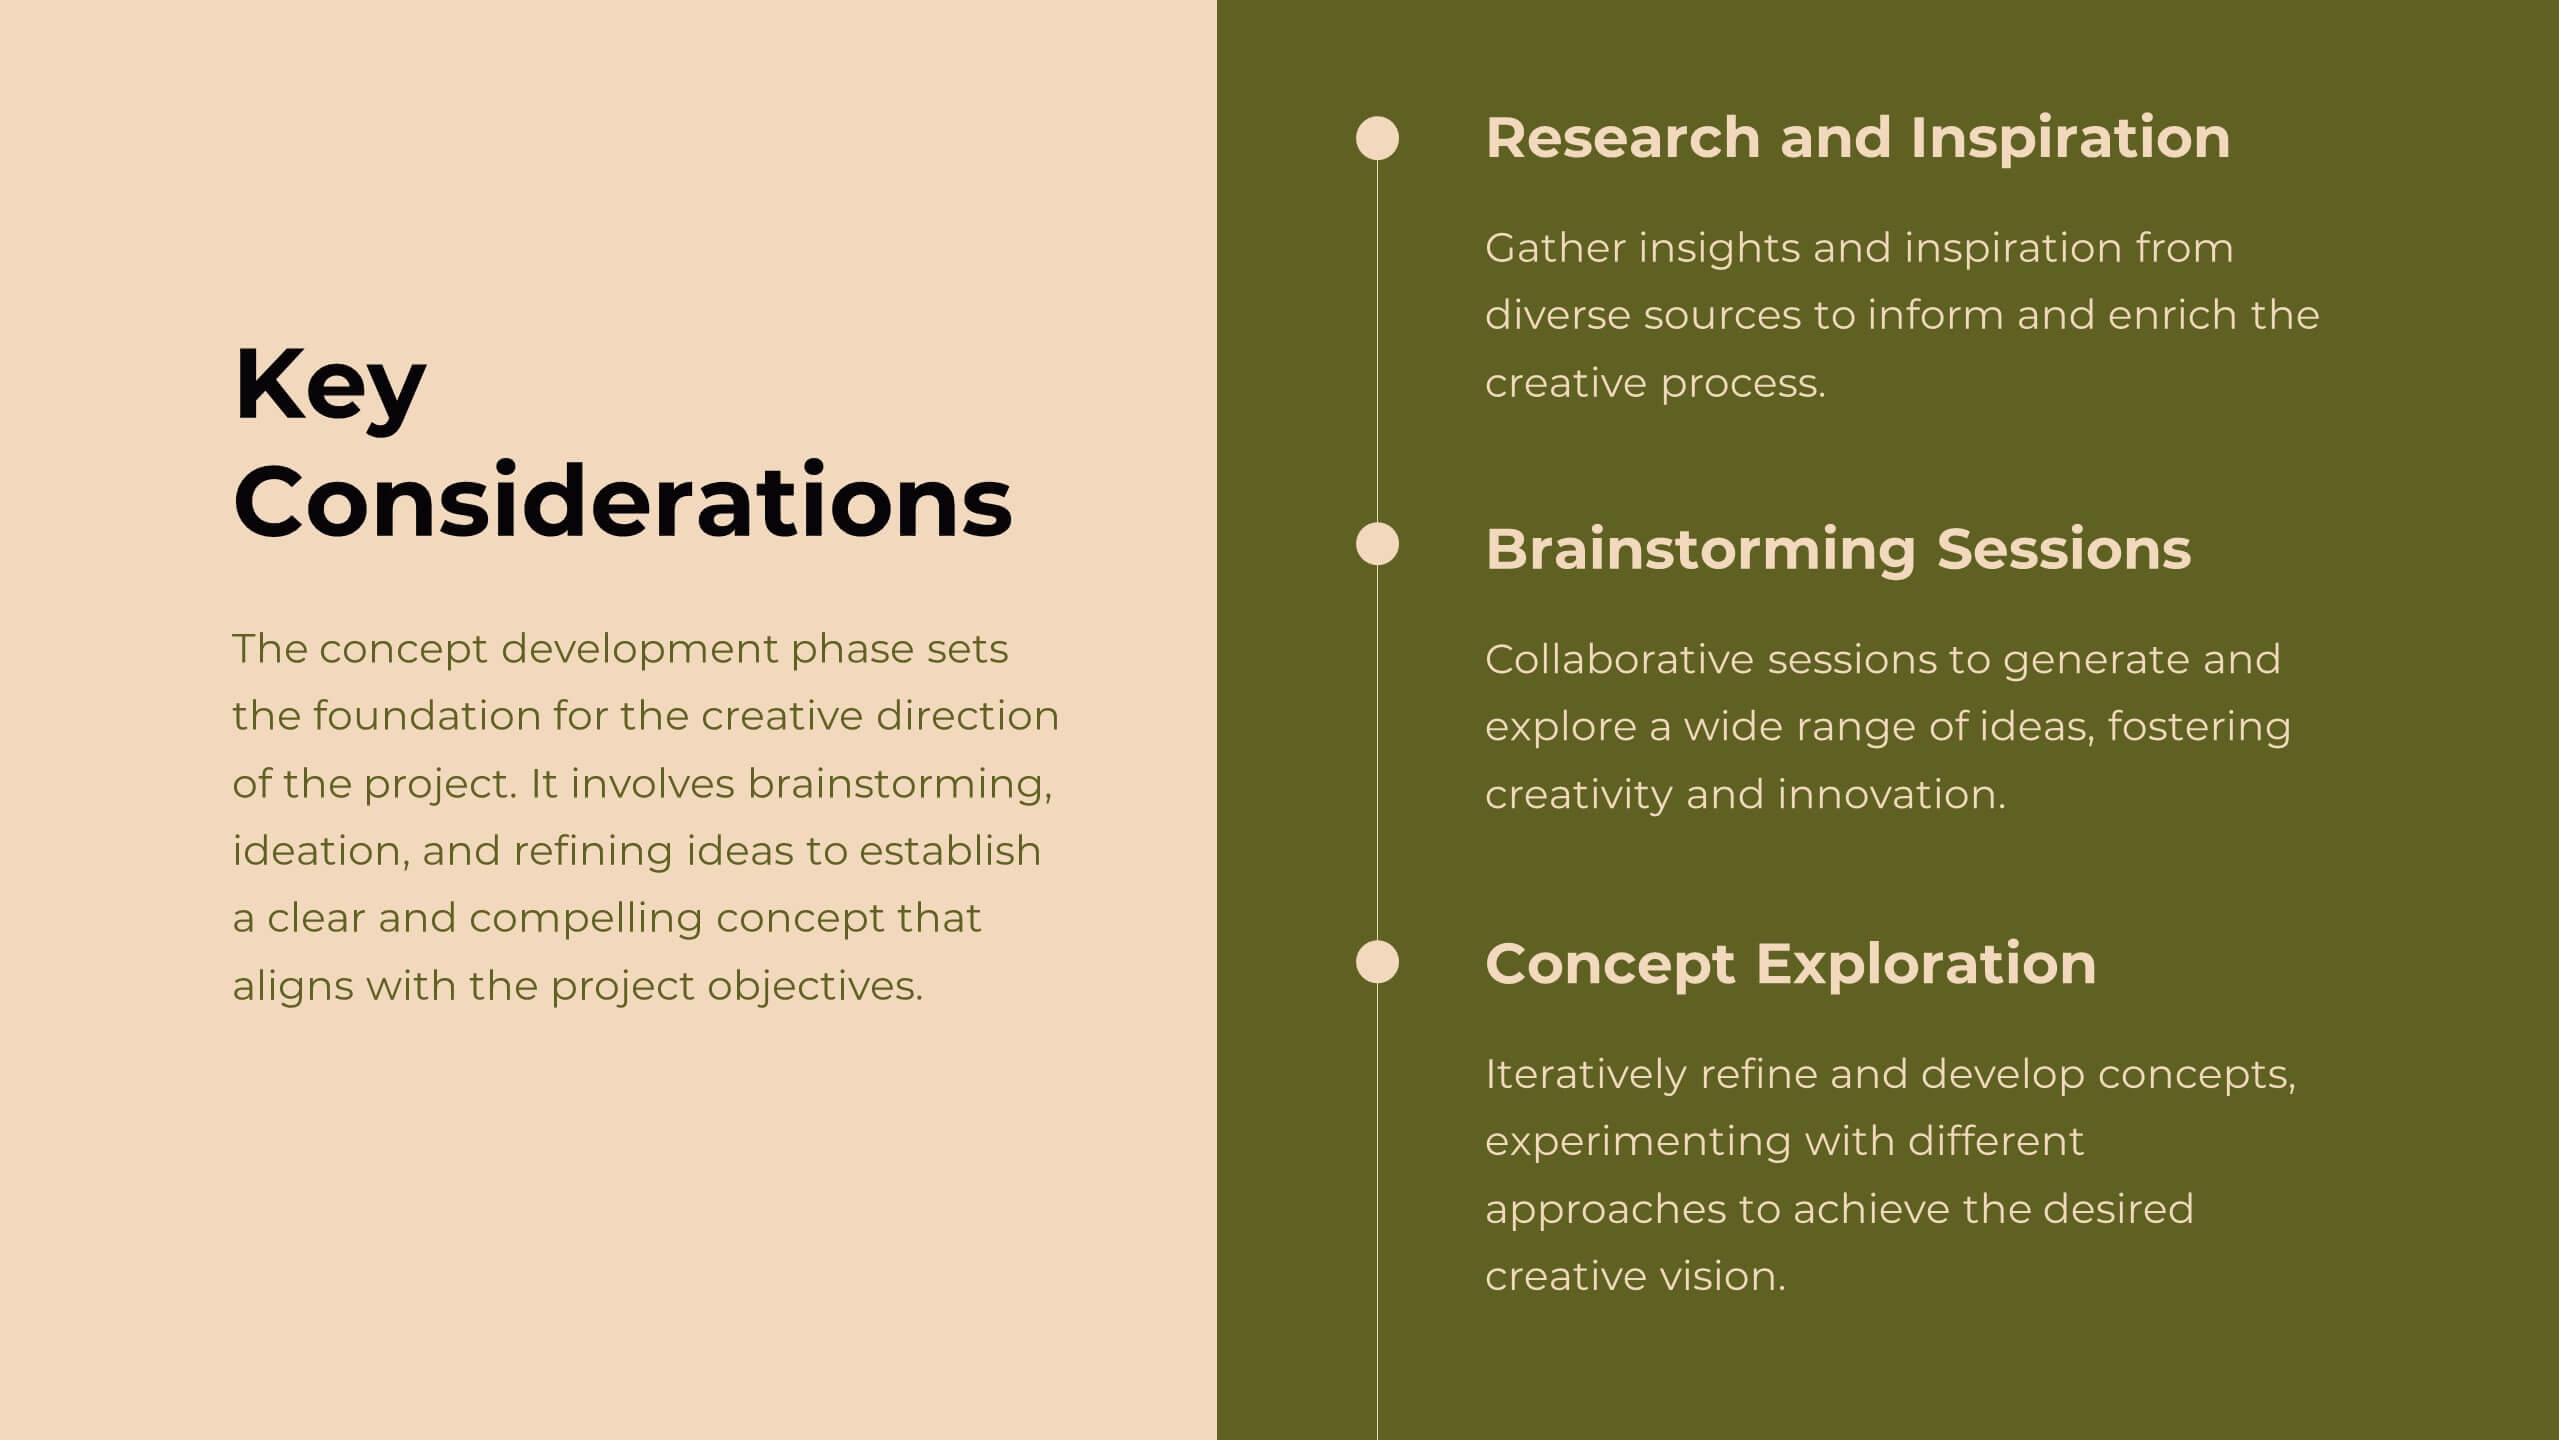
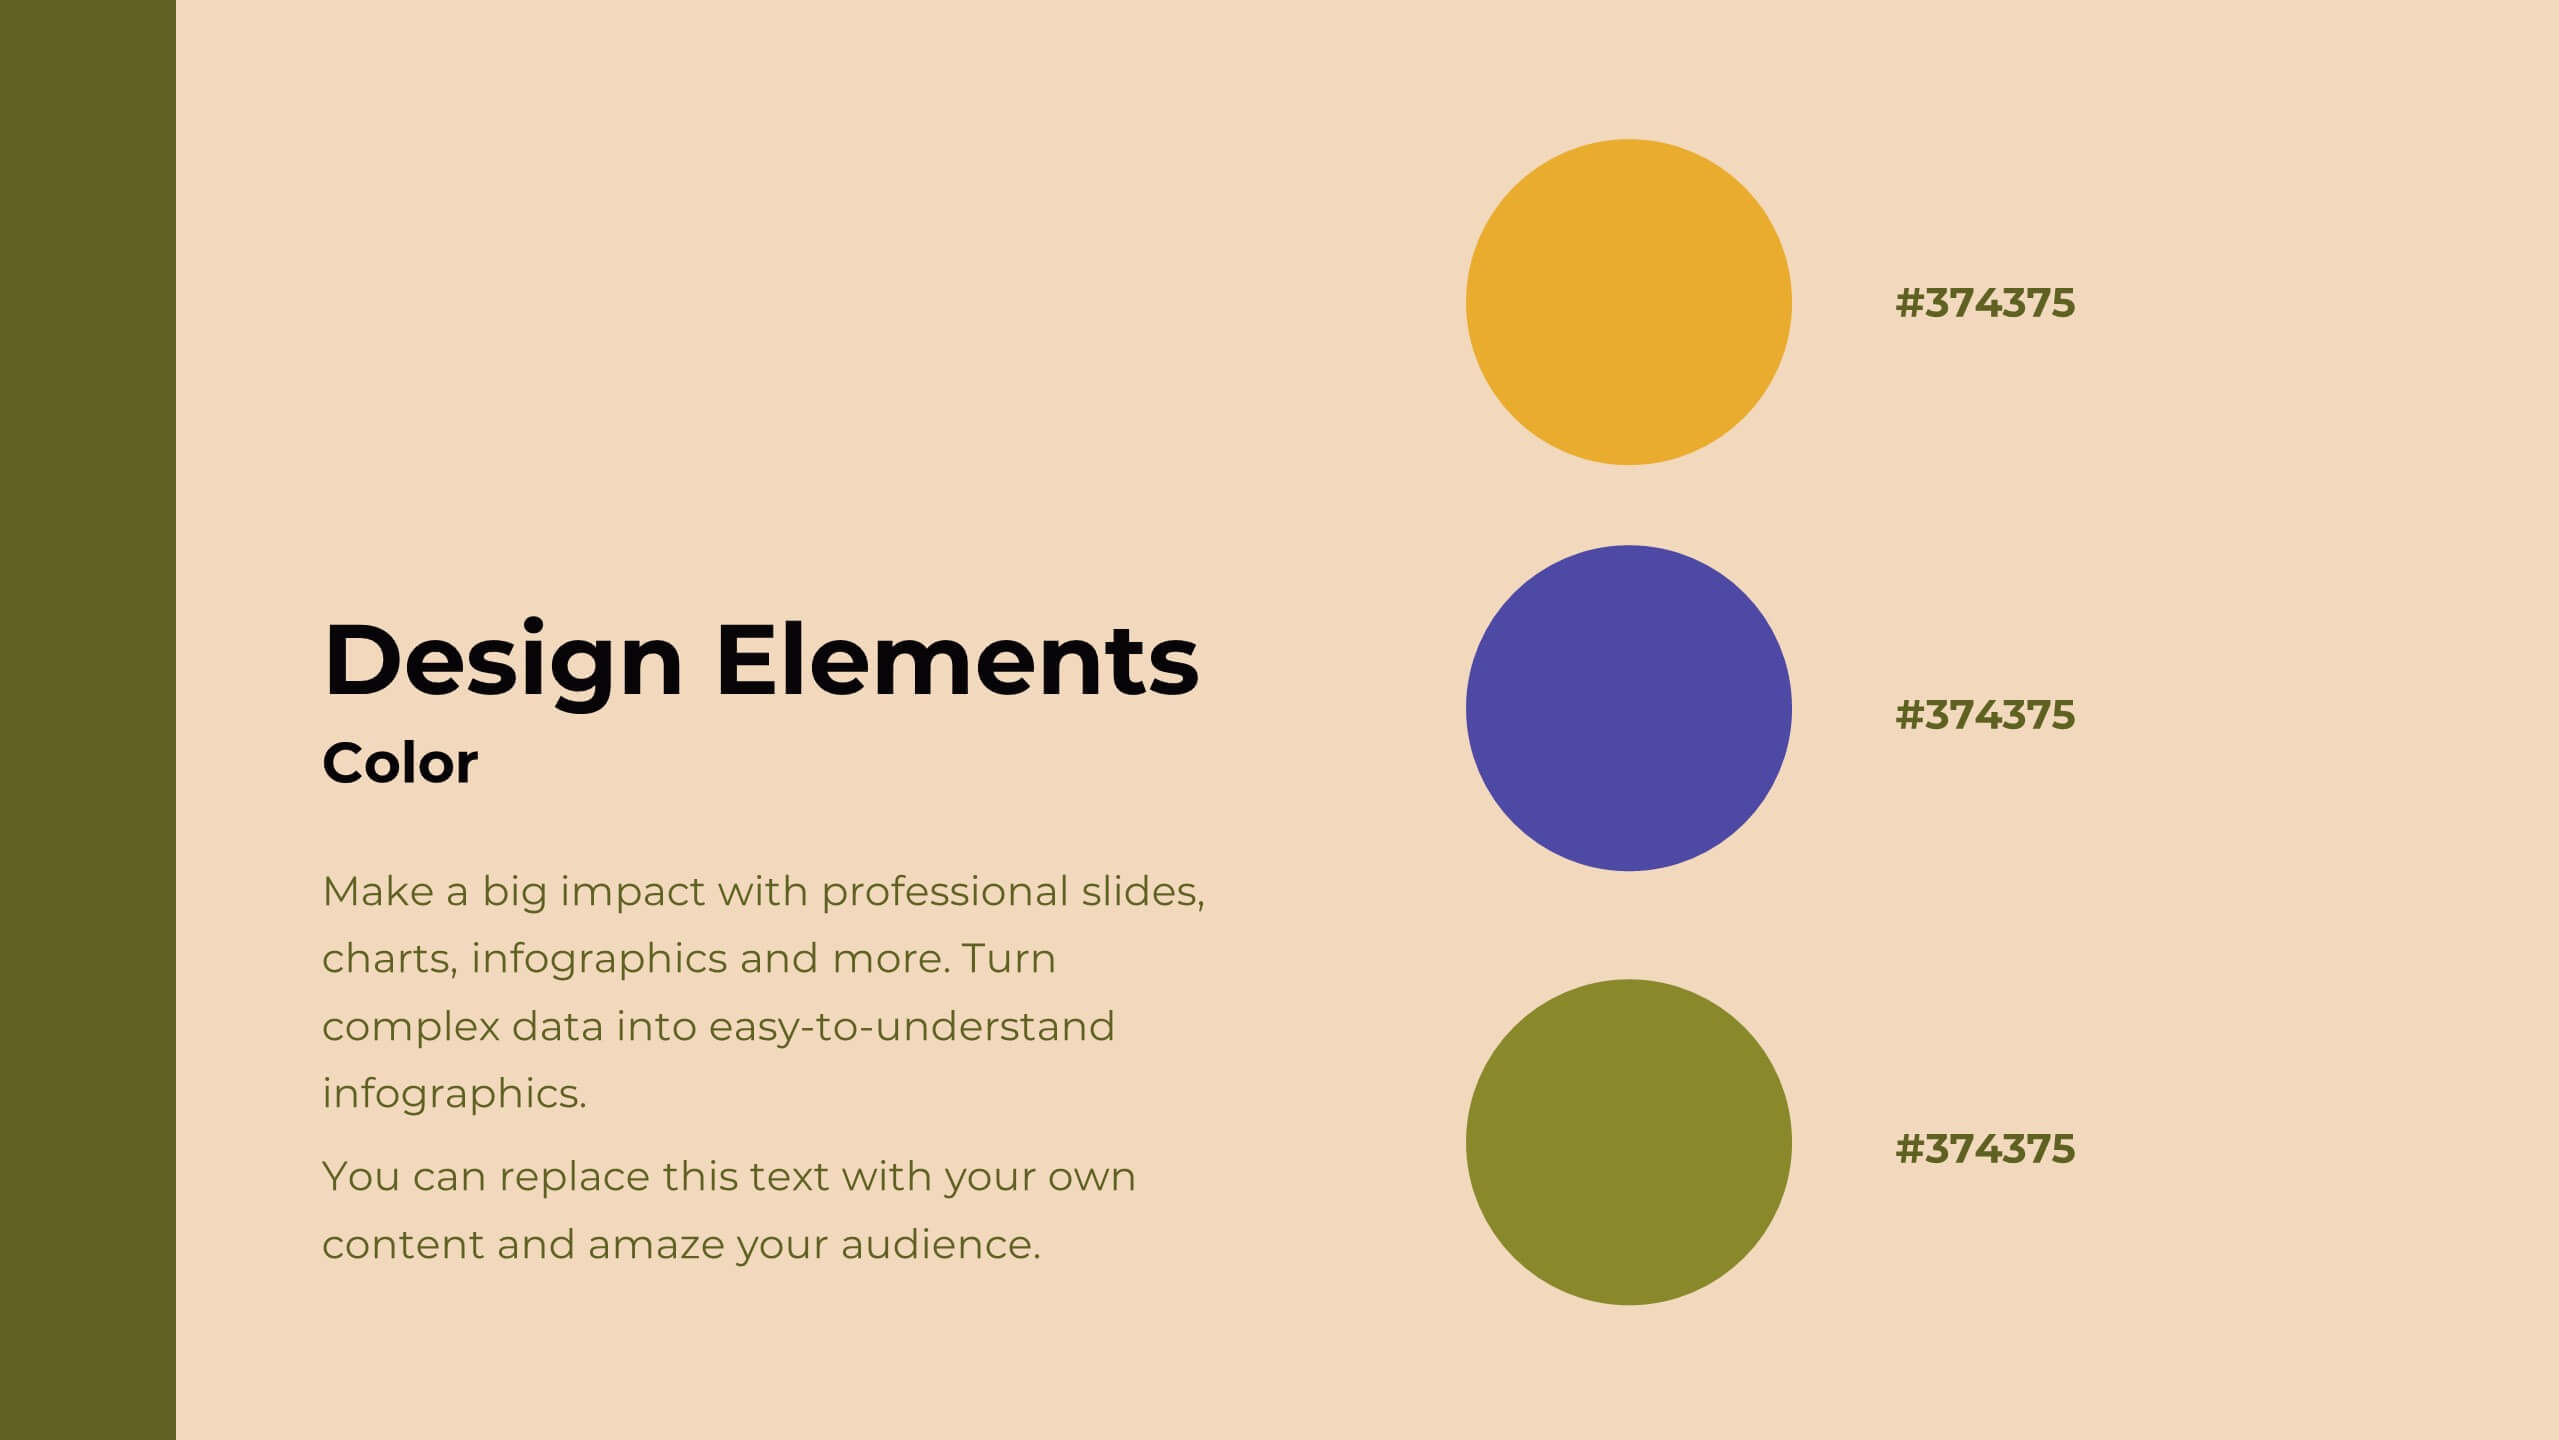
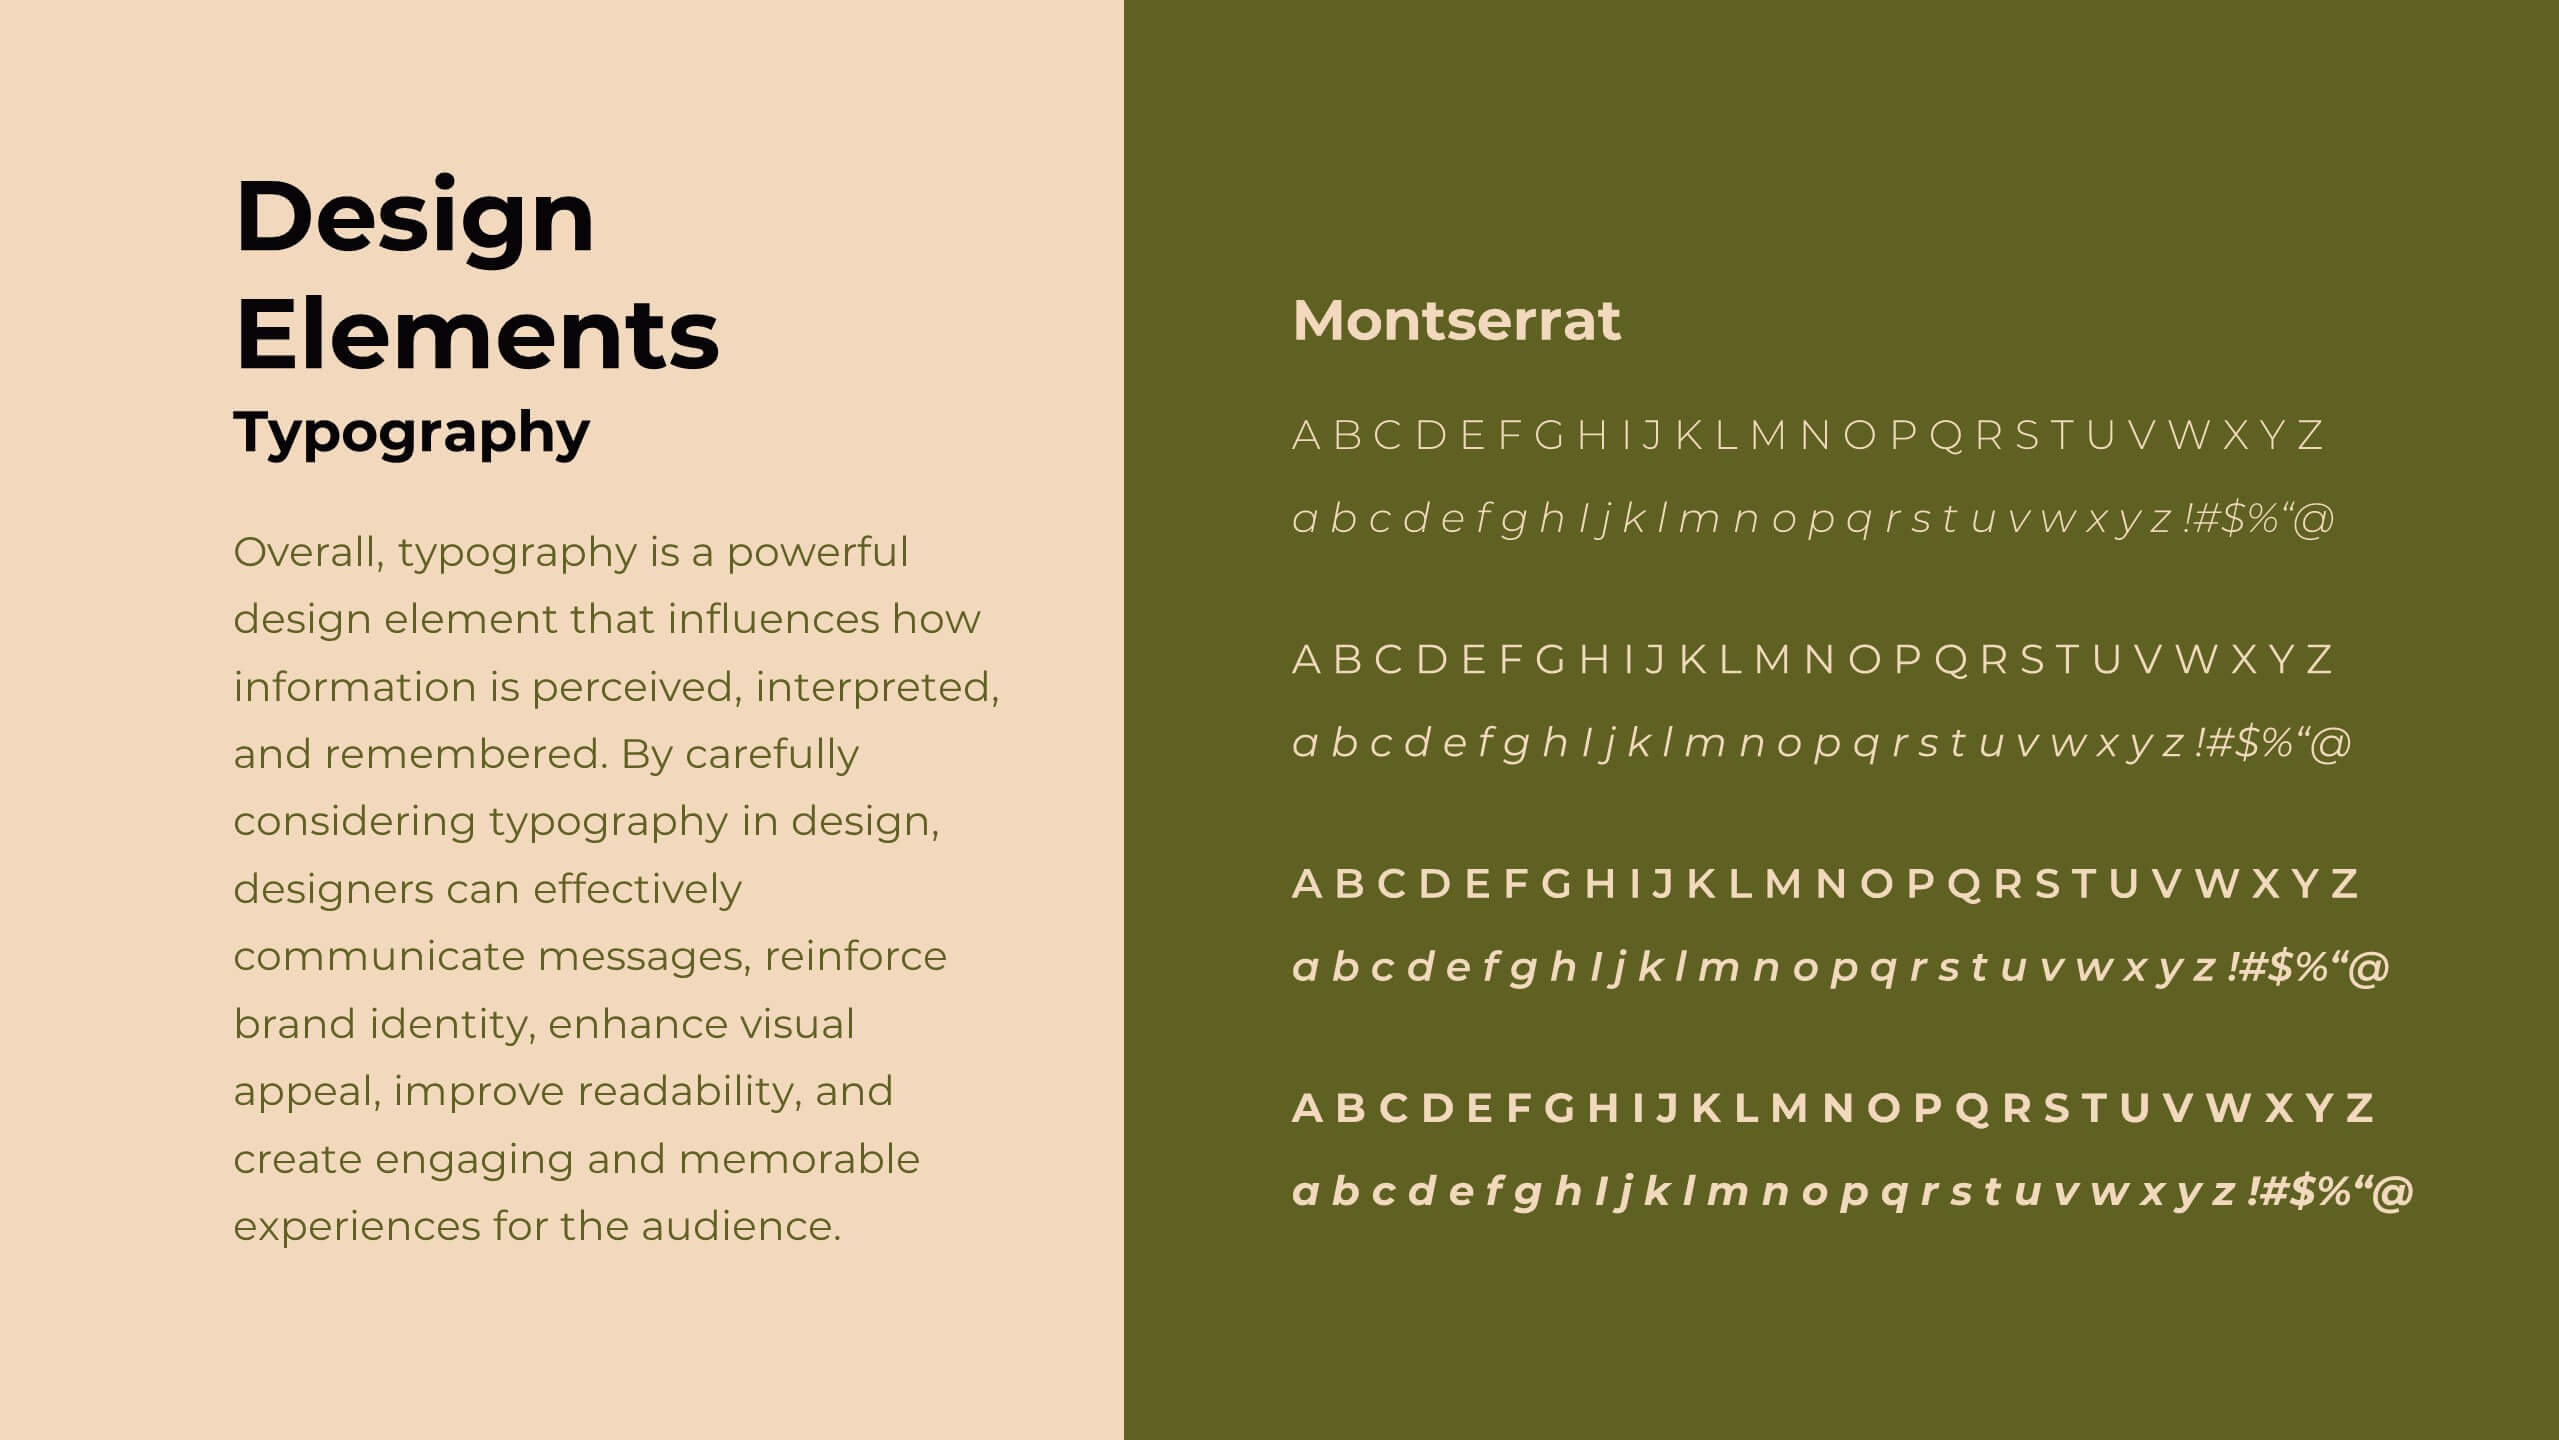
Delta Design Strategy Proposal Presentation
Transform your design strategy with this elegant proposal template! Perfect for presenting design briefs, target audience insights, and concept development. Ideal for designers and creative teams aiming to align vision and execution. Compatible with PowerPoint, Keynote, and Google Slides, this template ensures your design strategy is clear, professional, and compelling. Elevate your projects today!


21 diapositivas
Dreameon Agency Portfolio Presentation
Showcase your agency's expertise with this sleek and modern portfolio presentation template. Designed to highlight your achievements, creative processes, and client success stories, this template offers a comprehensive layout that communicates professionalism and innovation. From introducing your team and services to detailing case studies and market analysis, each slide is meticulously crafted to leave a lasting impression. Display your strategy development, social media impact, and measurement analytics effectively, ensuring a cohesive narrative that resonates with your audience. Easily customizable and compatible with PowerPoint, Google Slides, and Keynote, this template is perfect for agencies looking to pitch their capabilities, attract new clients, or present project achievements with confidence.


6 diapositivas
Thank You Letter Infographic
Showcase your appreciation with this collection, perfectly curated to express gratitude in the most heartfelt way. Each template is designed with a unique blend of style and simplicity, featuring modern layouts, elegant fonts, and a calming color scheme that adds a touch of sophistication to your message. These designs are versatile enough to be adapted for a variety of occasions, whether it's thanking a colleague, client, or friend. They provide a professional yet personal means to convey your thanks, enhancing the sincerity of your message. Customize the templates to include personal anecdotes or details specific to the recipient, making each thank you letter feel both genuine and thoughtful. Ideal for both corporate and personal use, this collection ensures that your gesture of gratitude leaves a lasting impression, enhancing professional relationships and personal bonds alike.


10 diapositivas
Financial Dashboard Report Presentation
Stay on top of your financial metrics with the Financial Dashboard Report Presentation. Featuring clean visuals like line charts and icon-labeled KPIs, this layout makes complex data easy to understand. Perfect for monthly reviews, investor updates, or business reports. Fully editable in PowerPoint, Keynote, and Google Slides.


7 diapositivas
Project Schedule Infographics
The Project Schedule Infographic offers a dynamic and clear visual representation of project timelines and tasks. Fully compatible with PowerPoint, Google Slides, and Keynote. It is designed to facilitate project managers, team leads, and members in tracking milestones and deadlines effectively. The infographic breaks down the week into individual days and assigns specific tasks and goals to each, allowing for a comprehensive overview of the project's progression. This schedule template is not only a tool for maintaining organization within a team but also acts as a communication aid to provide updates at a glance.


5 diapositivas
Global Nonprofit Help Infographics
A global nonprofit organization is a type of organization that operates on an international scale and focuses on making a positive impact on a global scale. These vertical infographics focuses on the impact and importance of nonprofit organizations worldwide. This is ideal for showcasing the achievements and goals of nonprofits in addressing various global issues, such as poverty, healthcare, and environmental conservation. The infographics include a collection of captivating icons and illustrations related to nonprofit work. These slides allow you to present compelling stories, case studies, and success stories that demonstrate the real-world impact of nonprofit work.


20 diapositivas
Dreamspire Academic Research Report Presentation
Present your research findings with impact using this bold and dynamic report template! It includes essential sections such as objectives, methodology, key findings, and future research directions, ensuring a comprehensive overview. Perfect for academic, business, or industry research presentations, this template is fully compatible with PowerPoint, Keynote, and Google Slides.


26 diapositivas
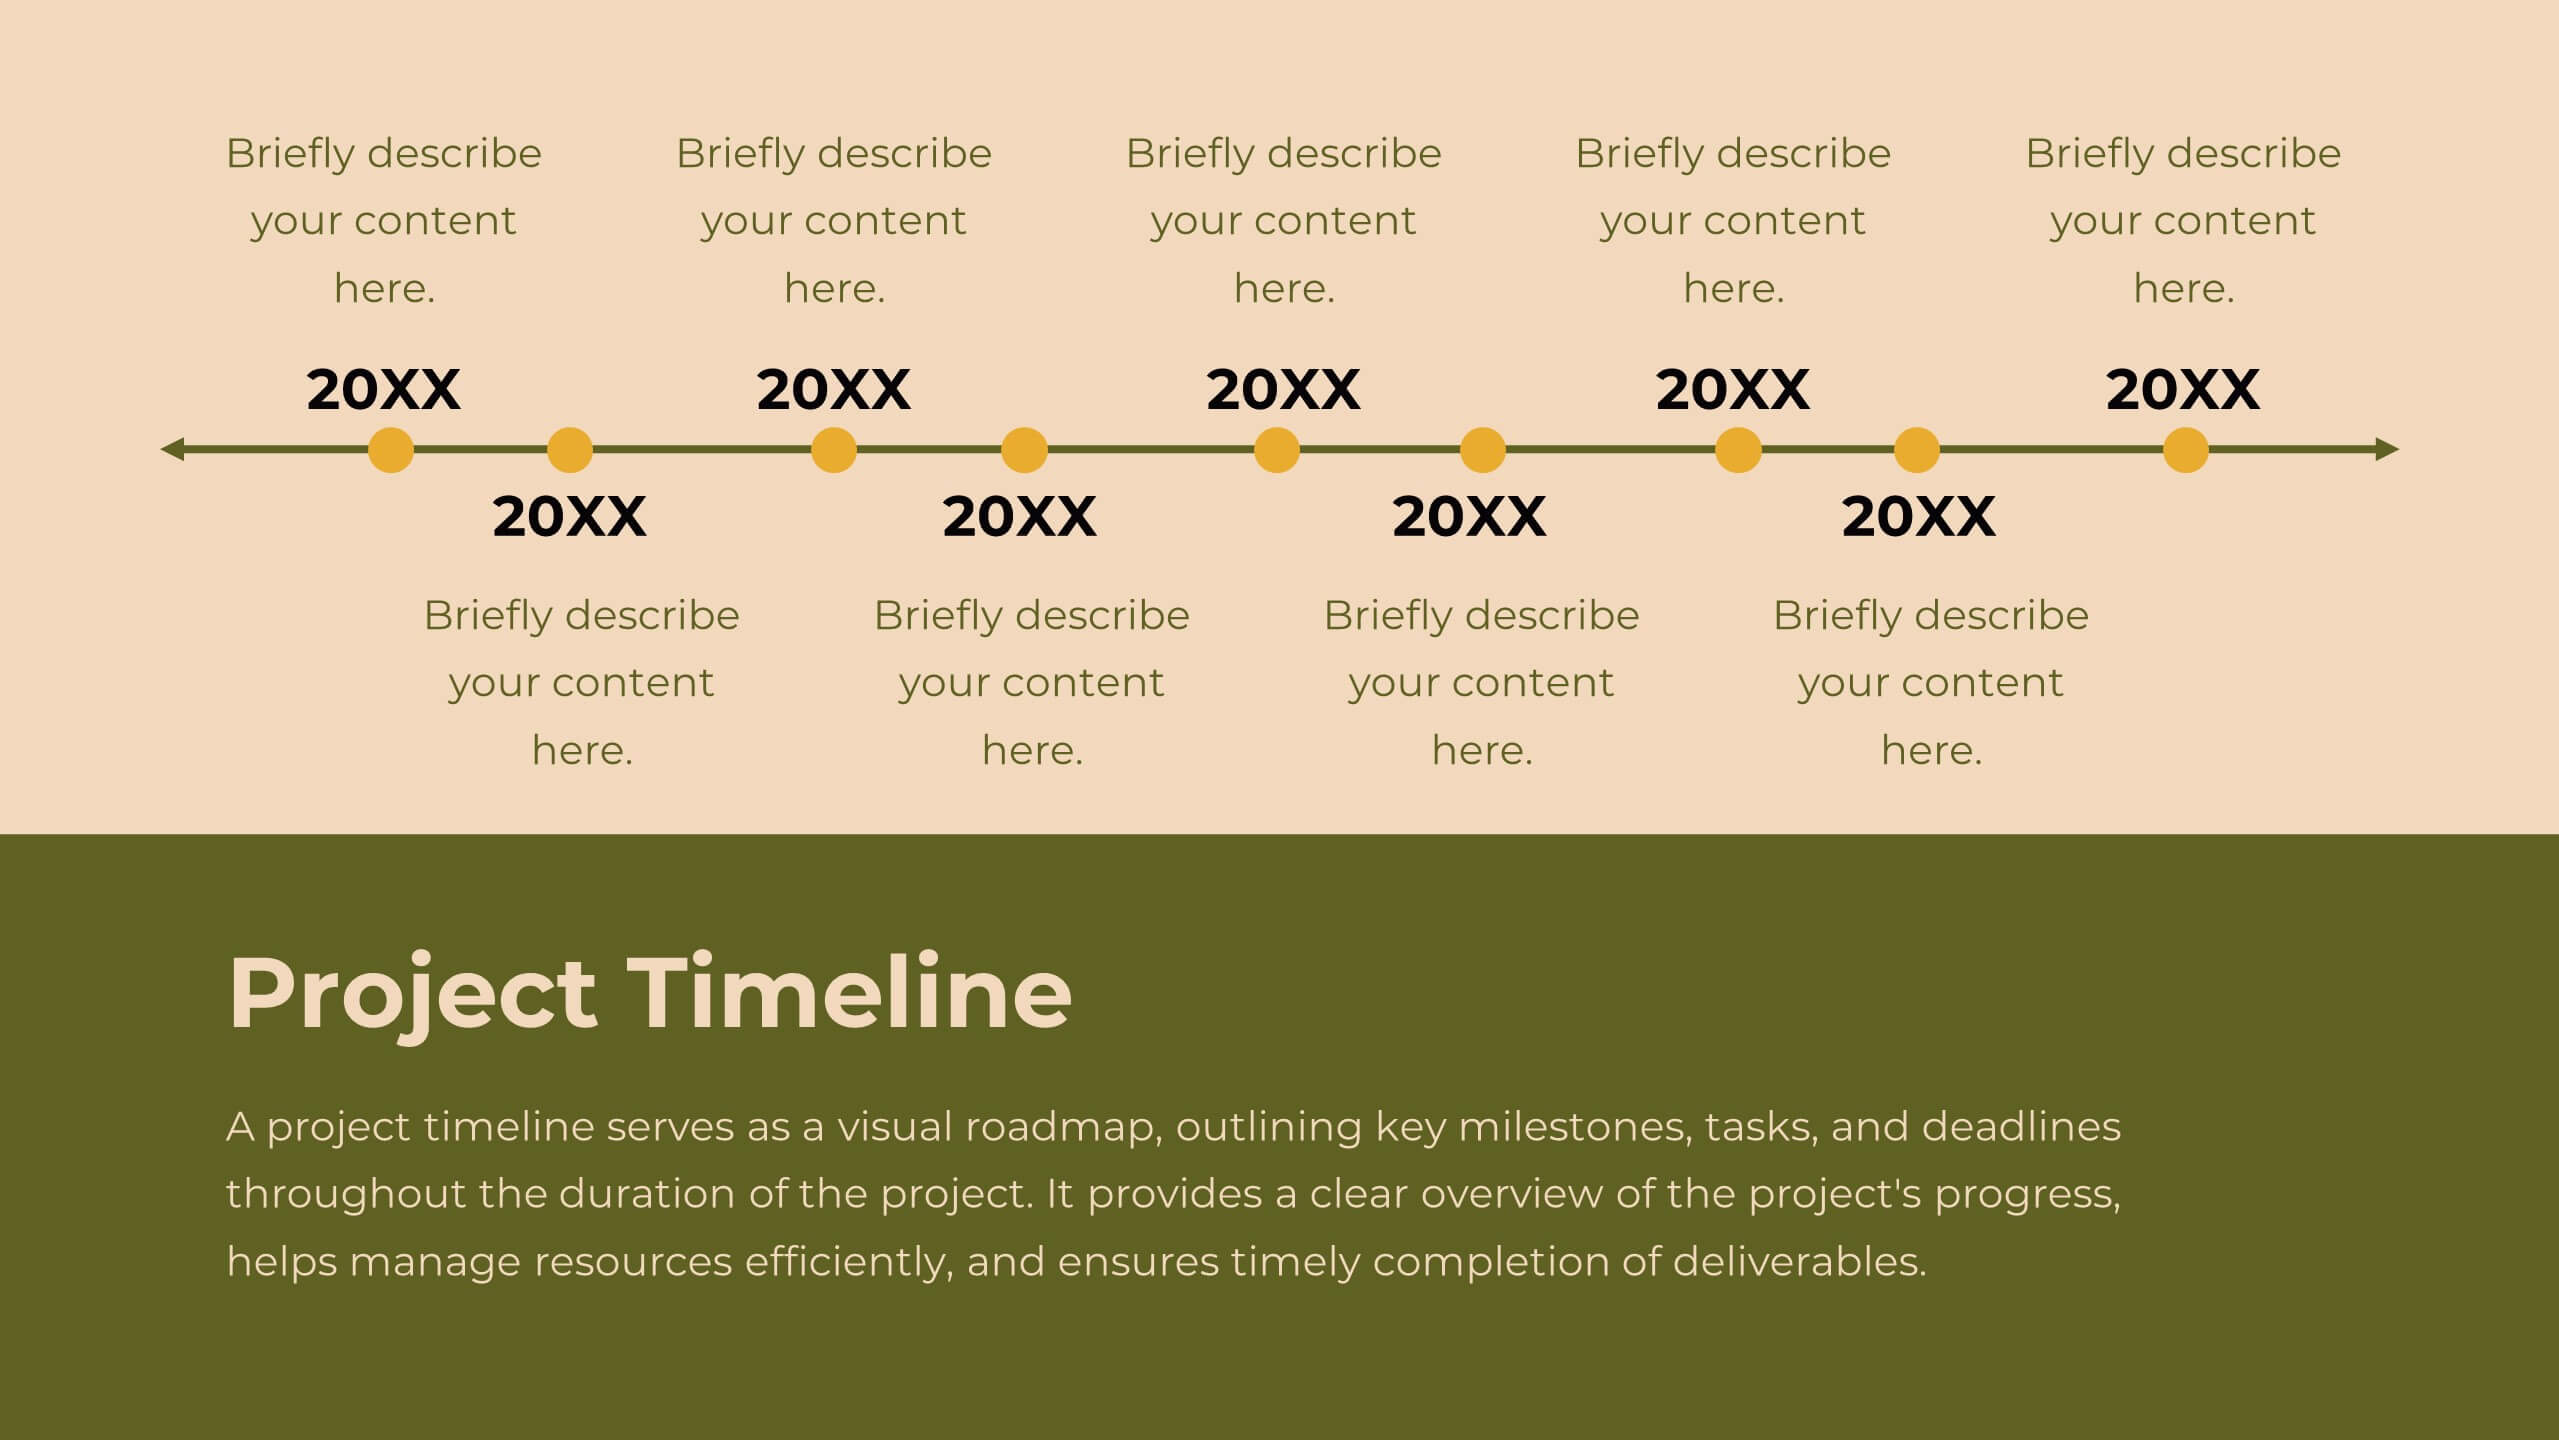
Thadd Presentation Template
Thadd presents your business in a professional light. The bold fonts and colors make for a clean, professional aesthetic that won't distract from your message. It features a strong horizontal identity that instantly communicates your brand. Charts, timelines and easy to edit text give this template an edge over the competition. It comes with easy to edit text and images, making changing content a breeze. It makes for a great business tool for companies who want to get their message across without wasting time on graphics and design. Invest in your future and download this template today.


22 diapositivas
Marketing Research Presentation
Streamline your data presentation with our Marketing Research template. It includes comprehensive slides on research objectives, methodology, data analysis, and key findings. Ideal for academic and professional settings, this template is compatible with PowerPoint, Keynote, and Google Slides, enhancing your research presentations with precision and professionalism.


28 diapositivas
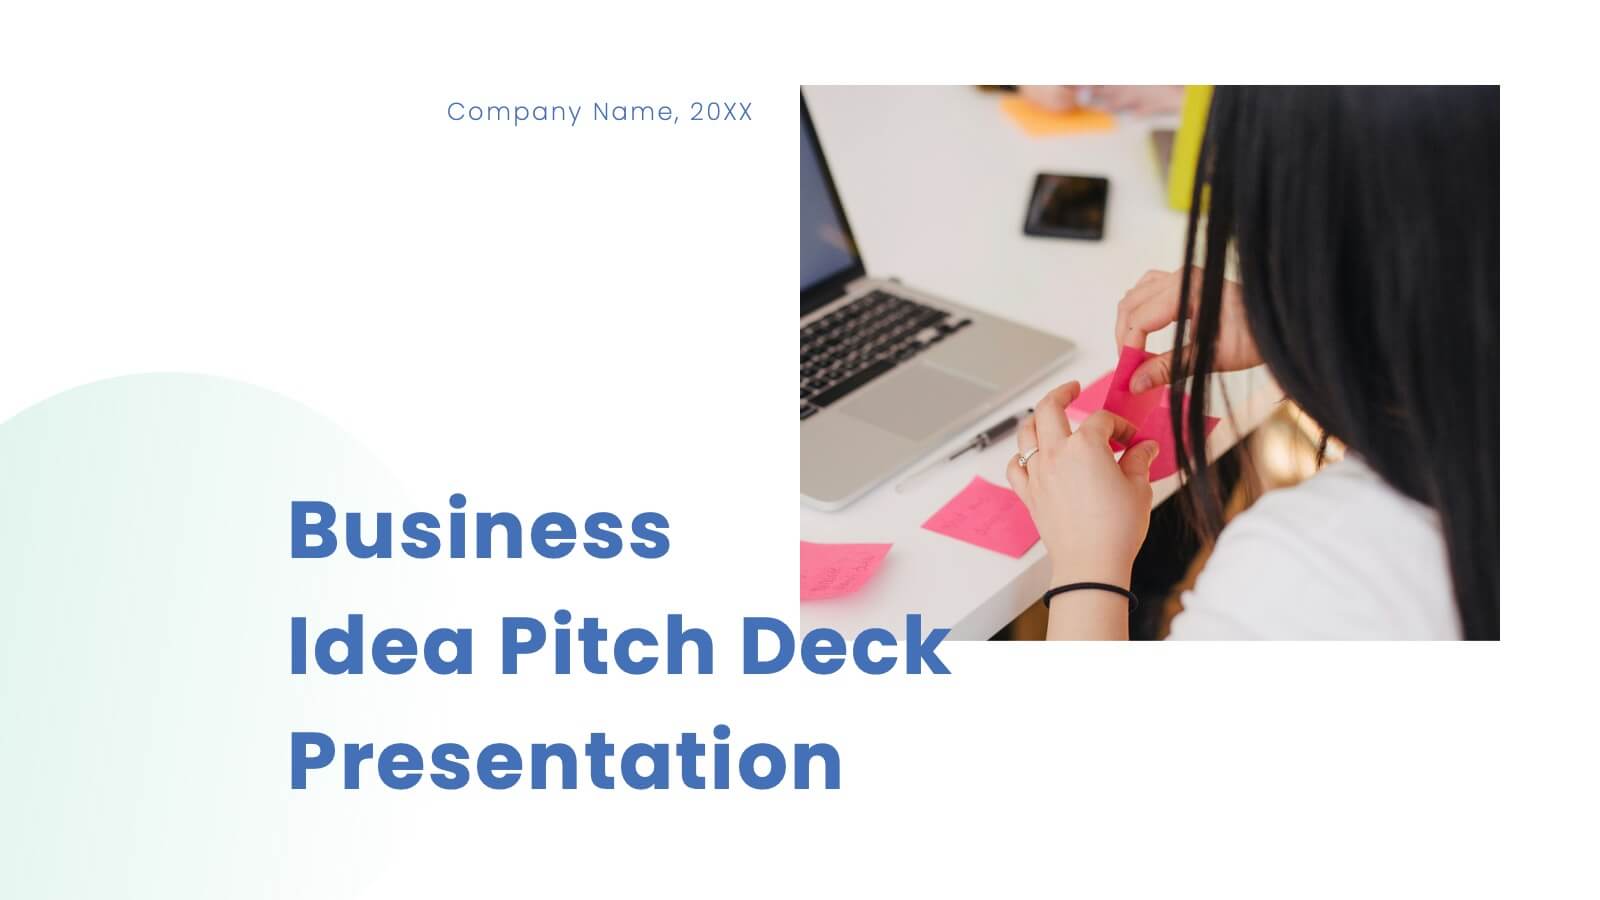
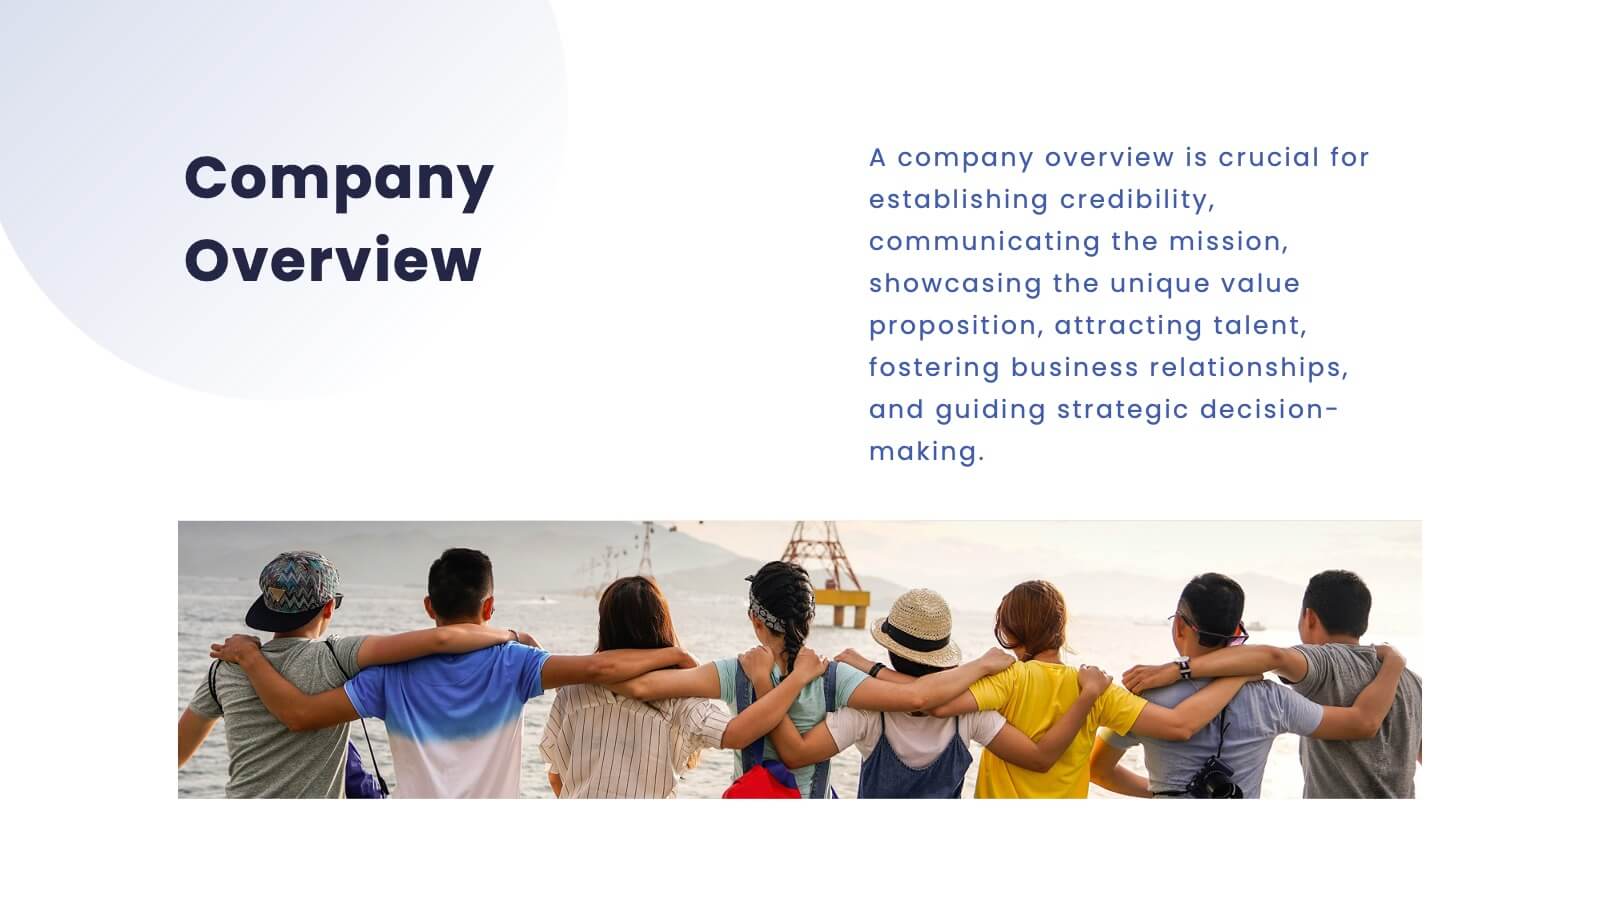
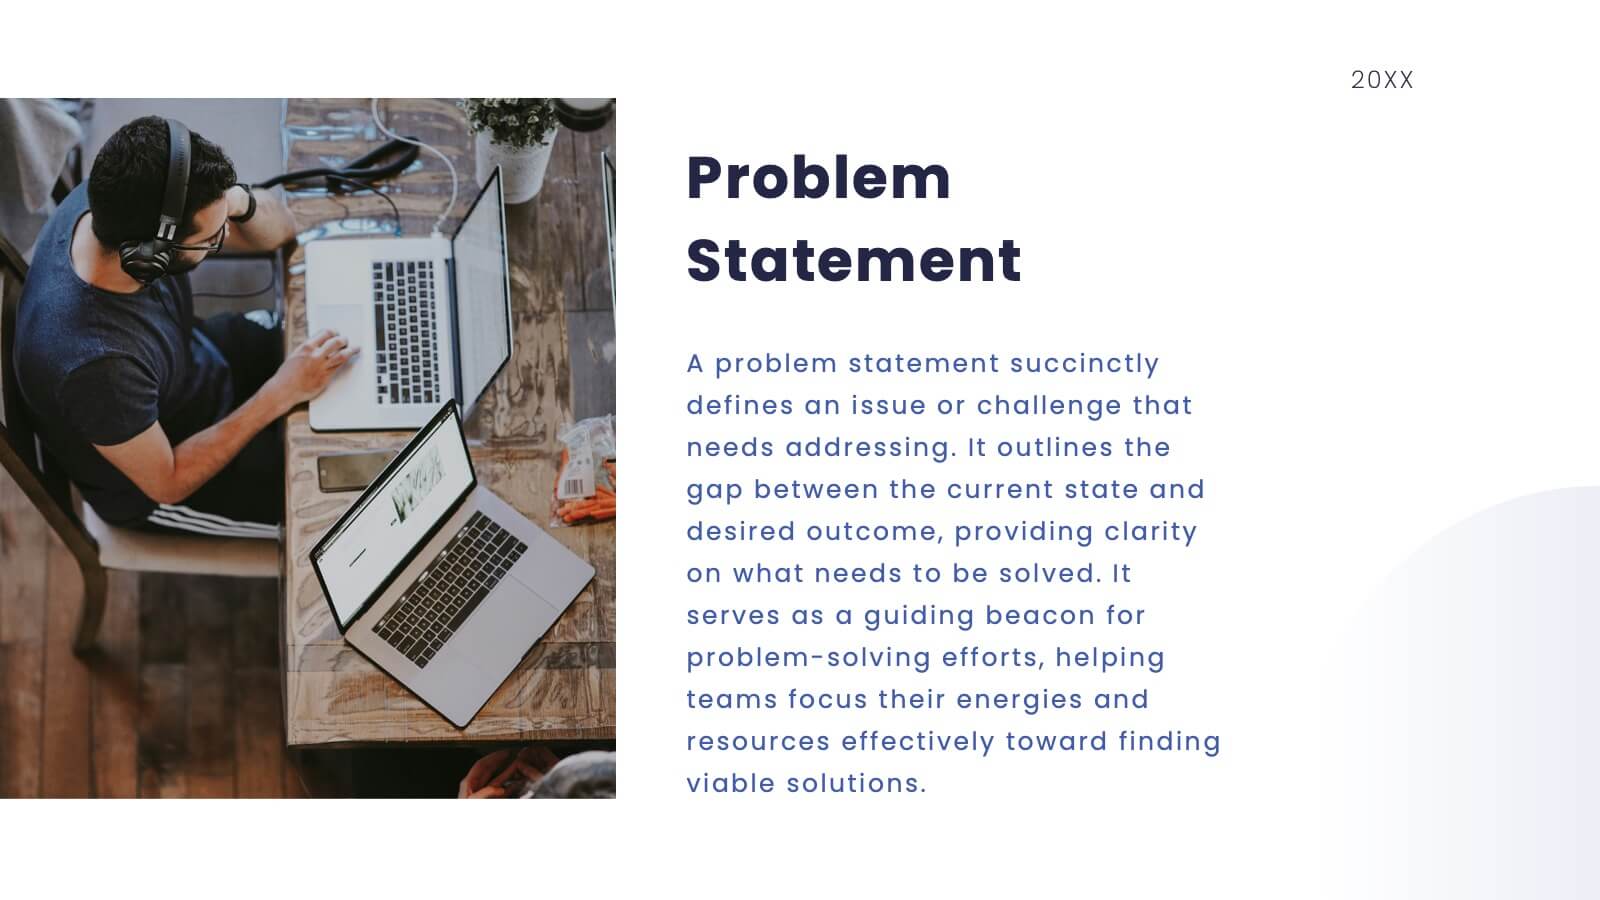
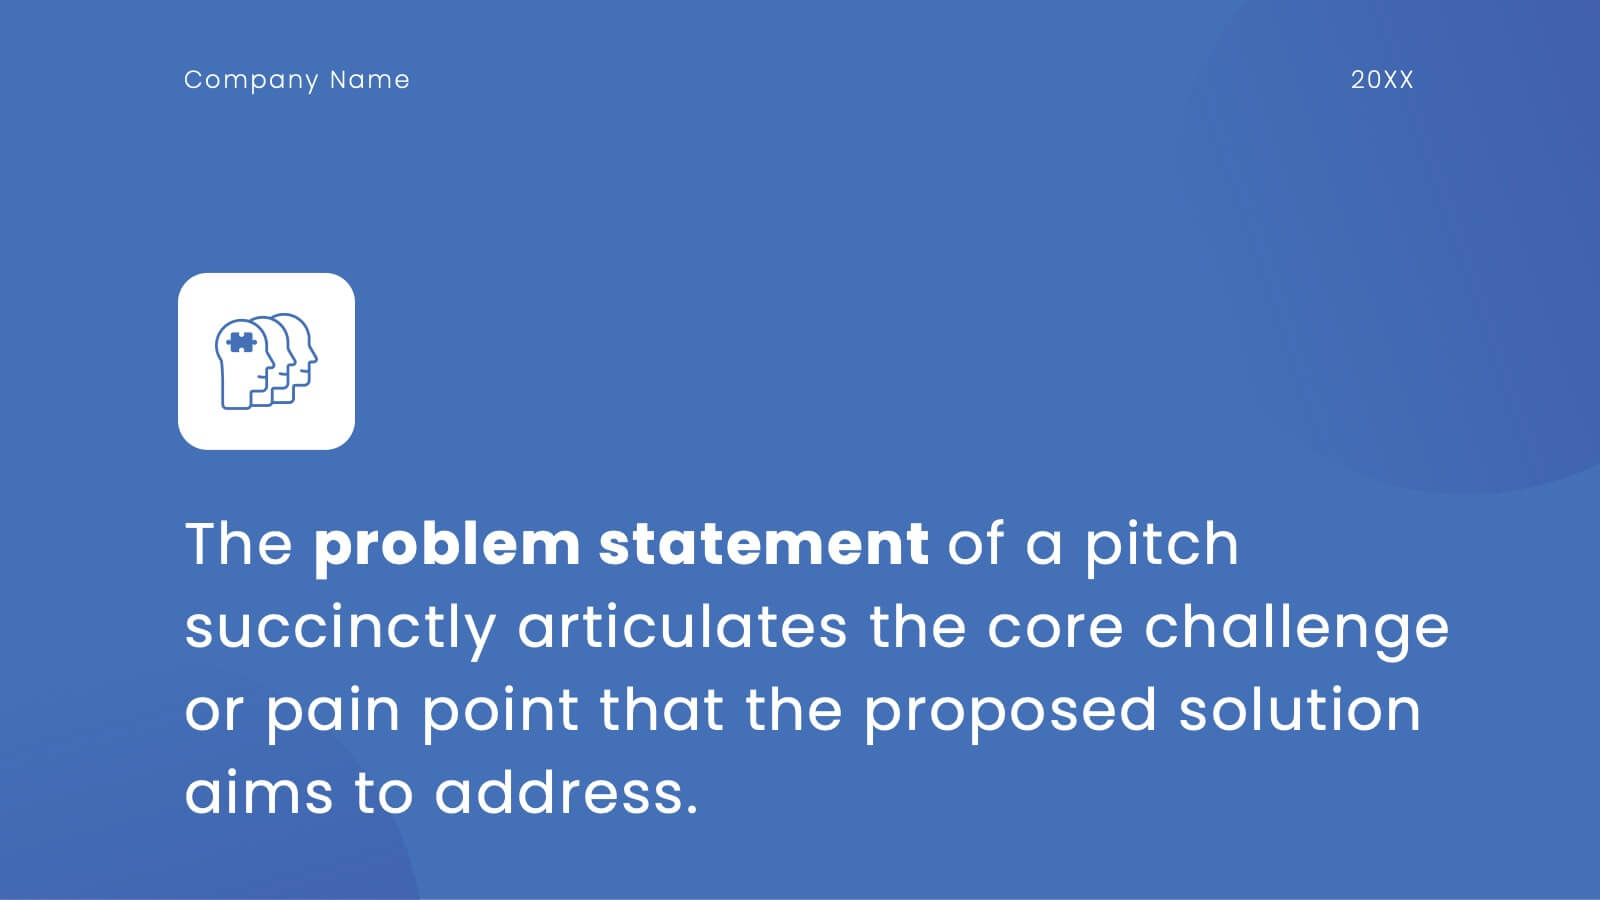
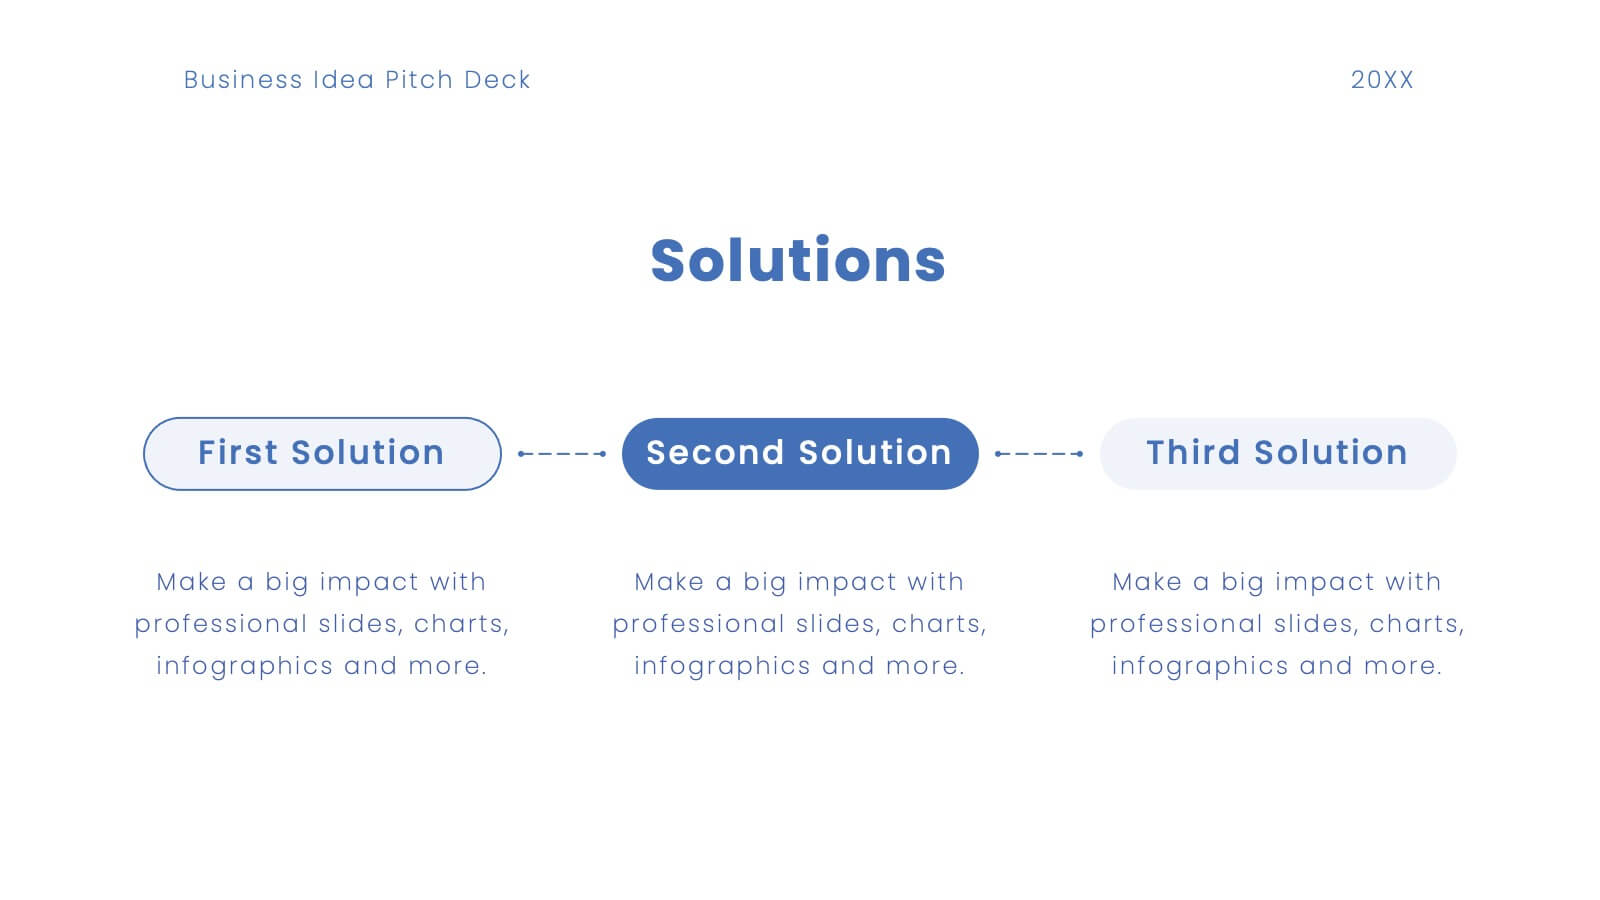
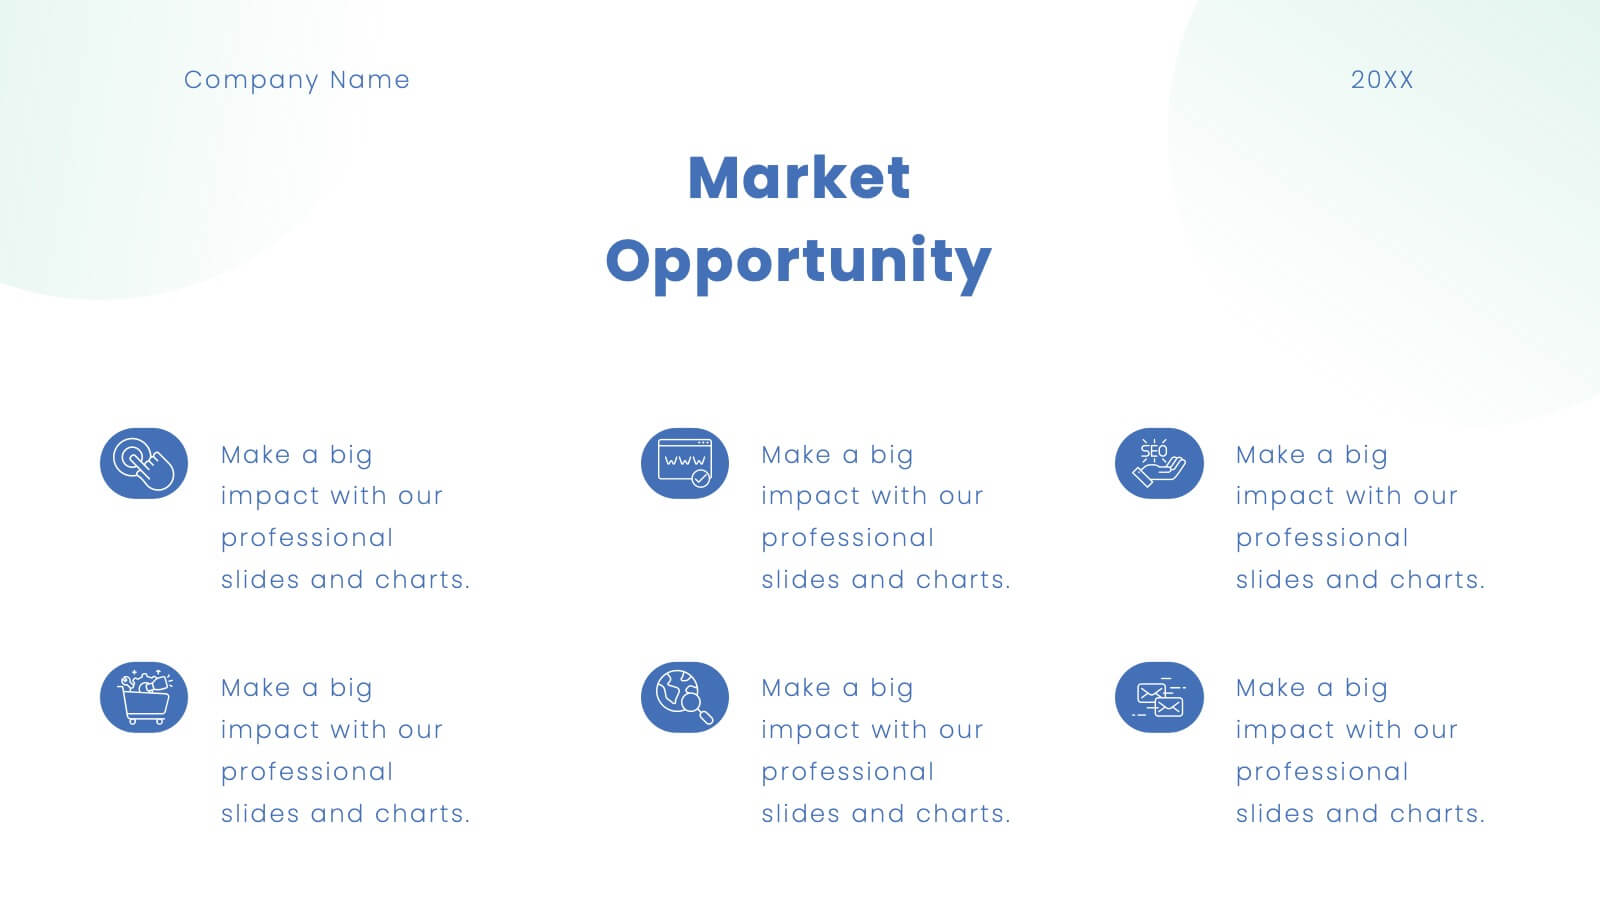
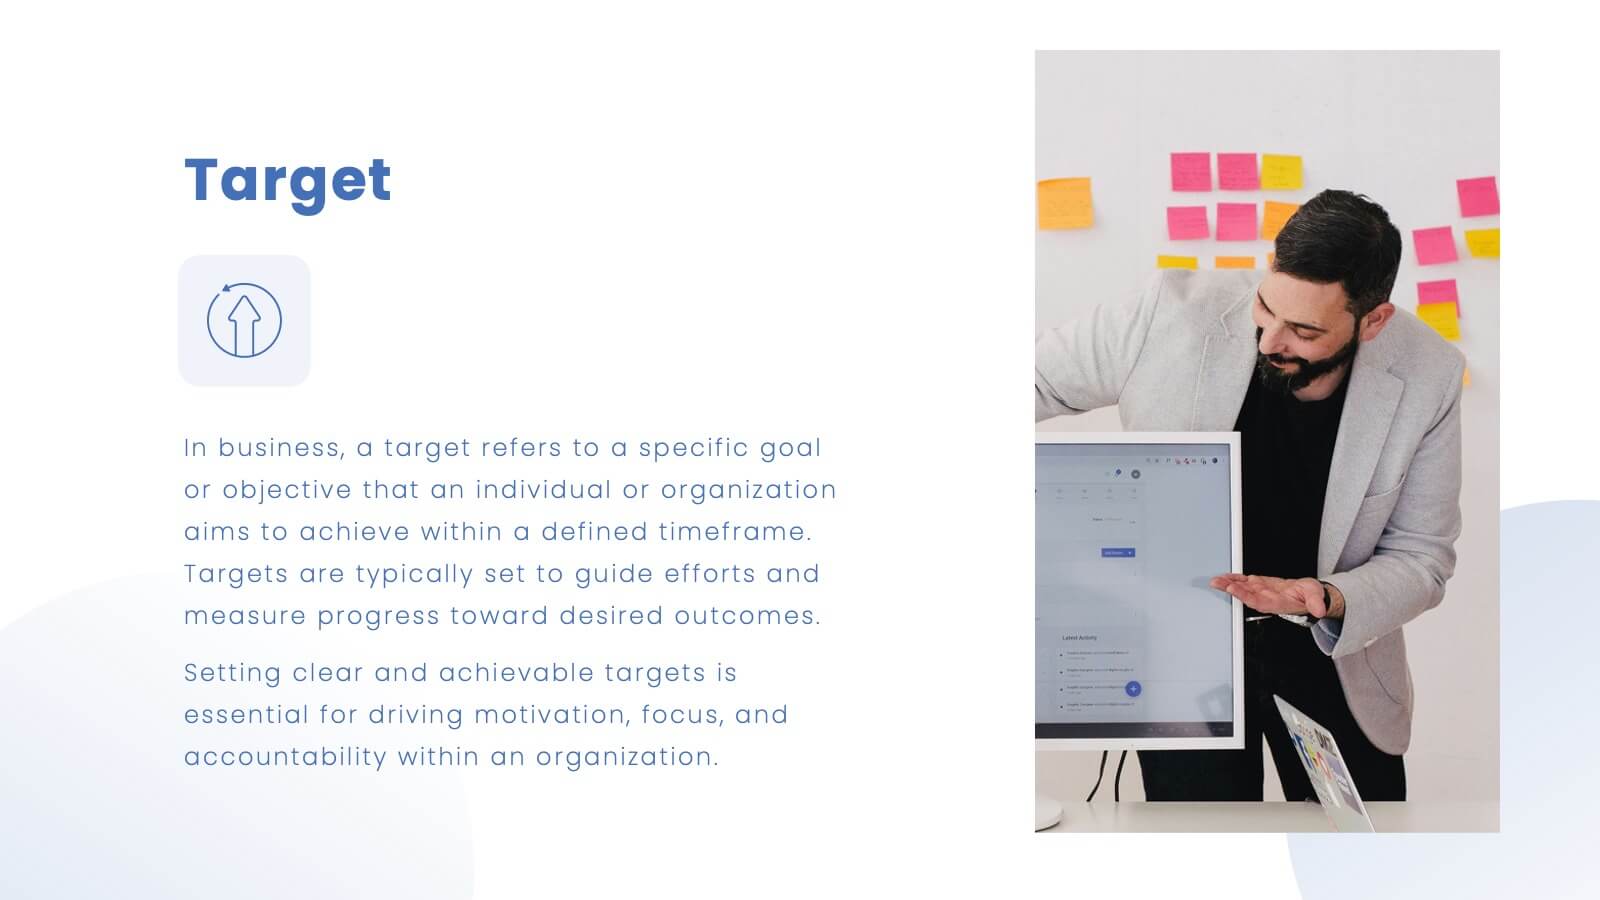
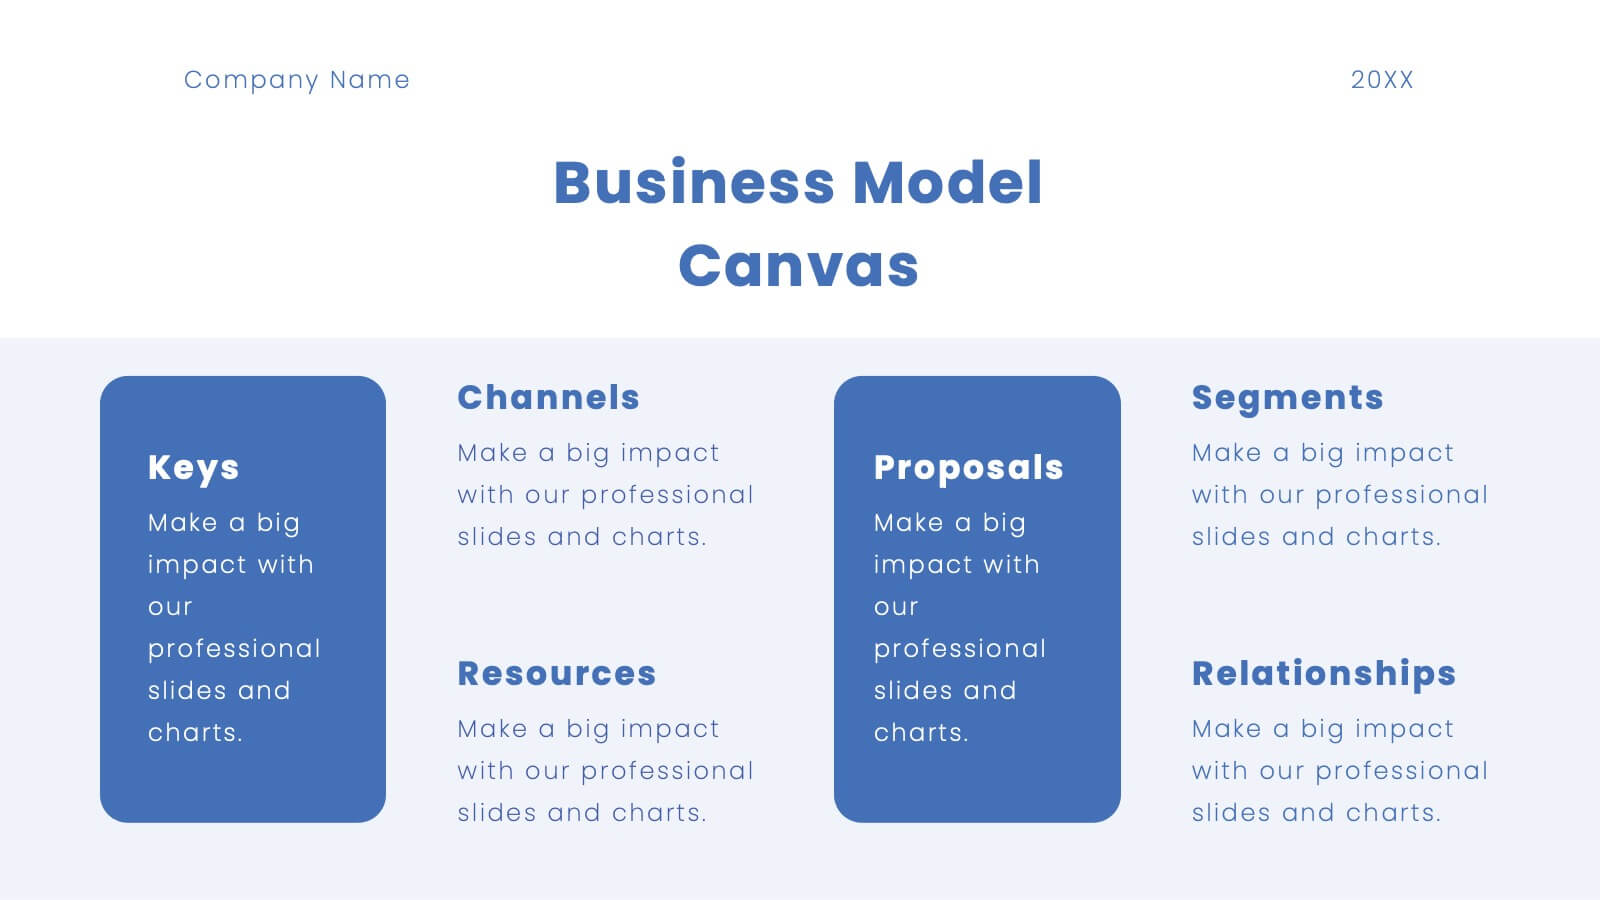
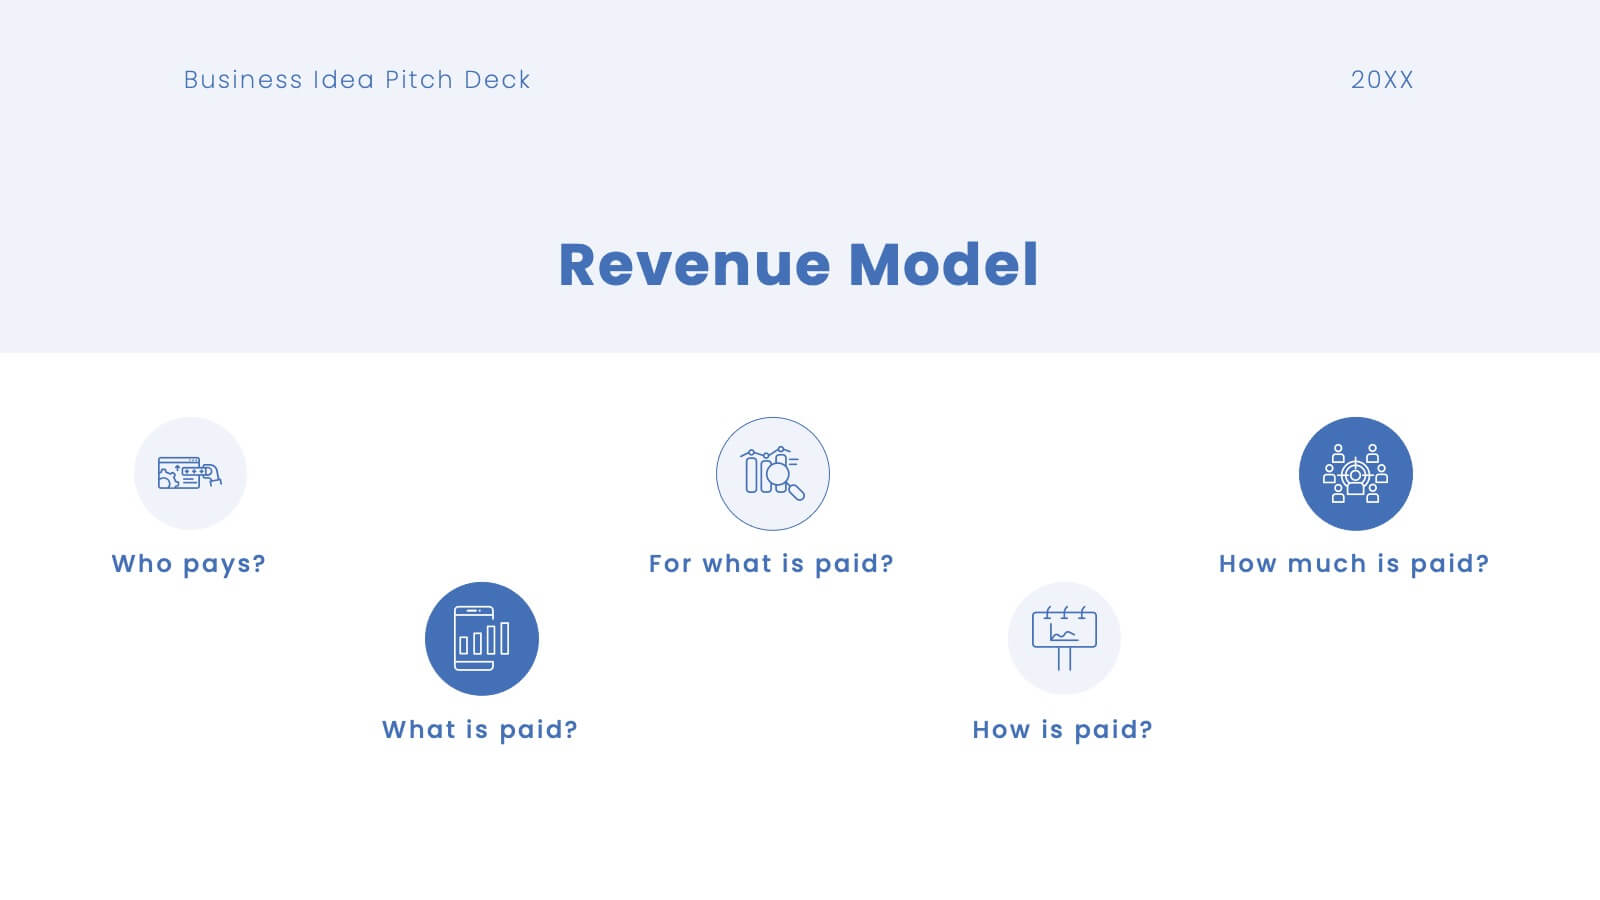
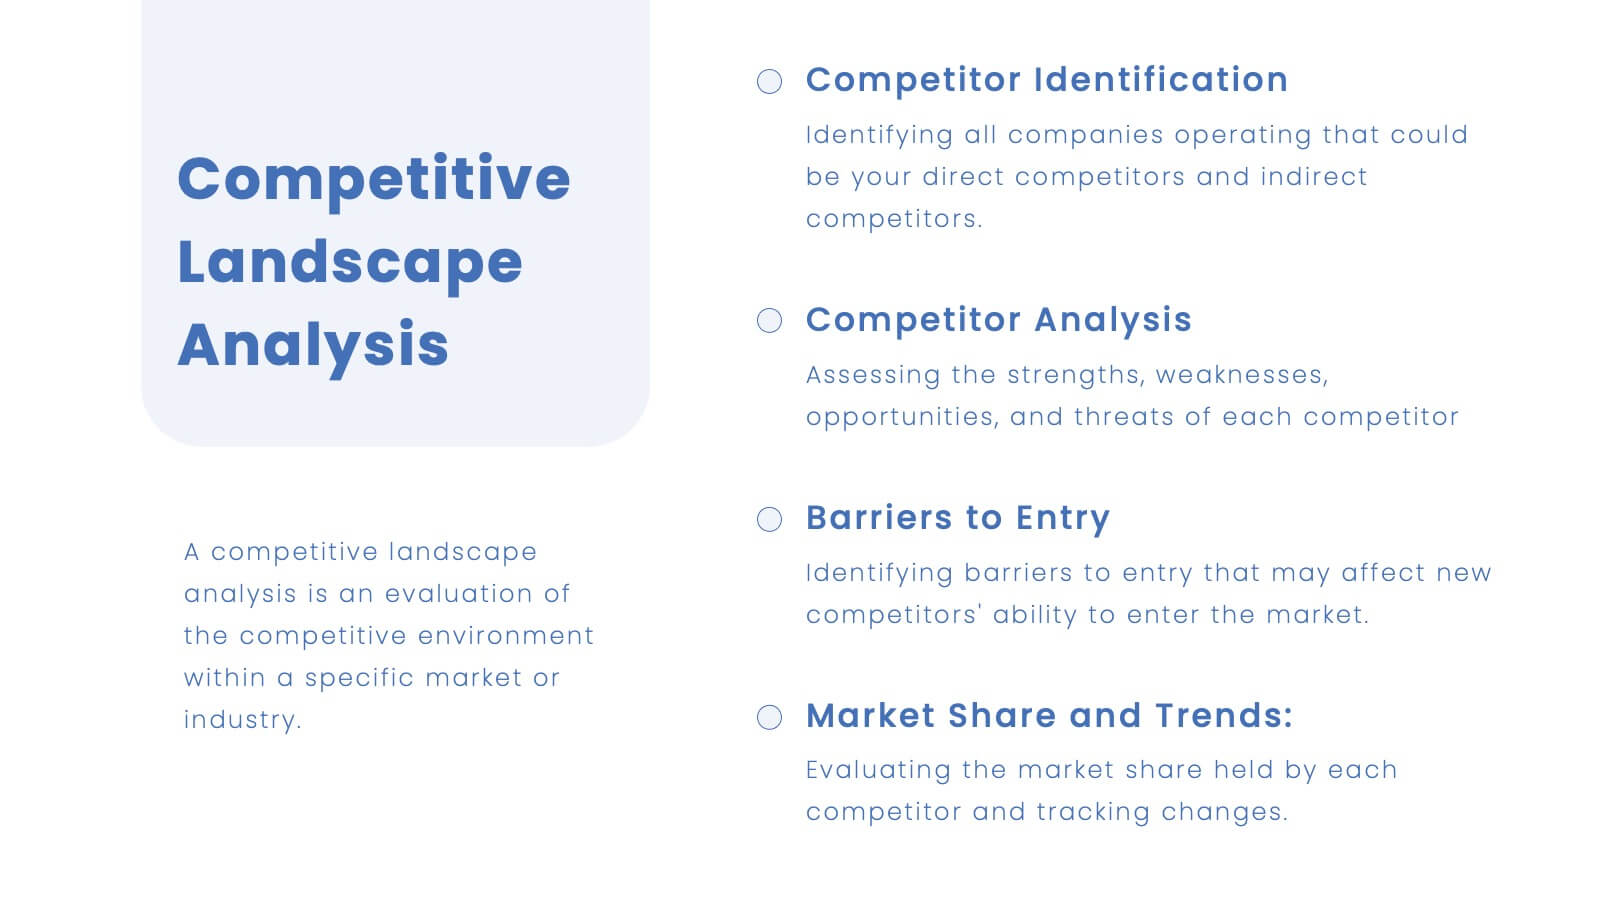
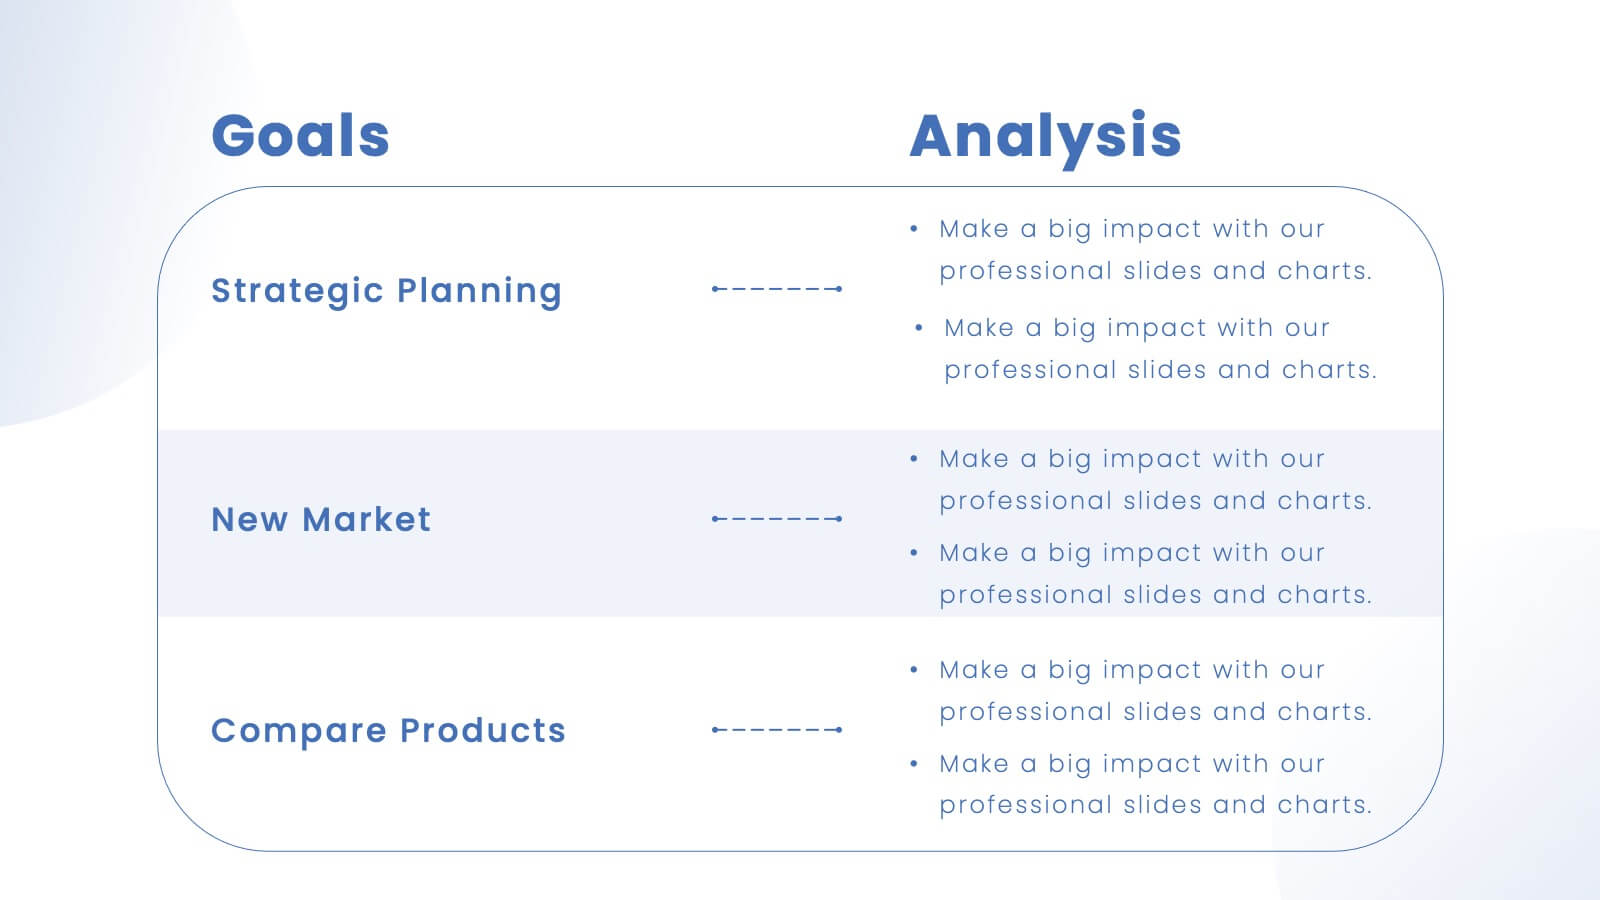
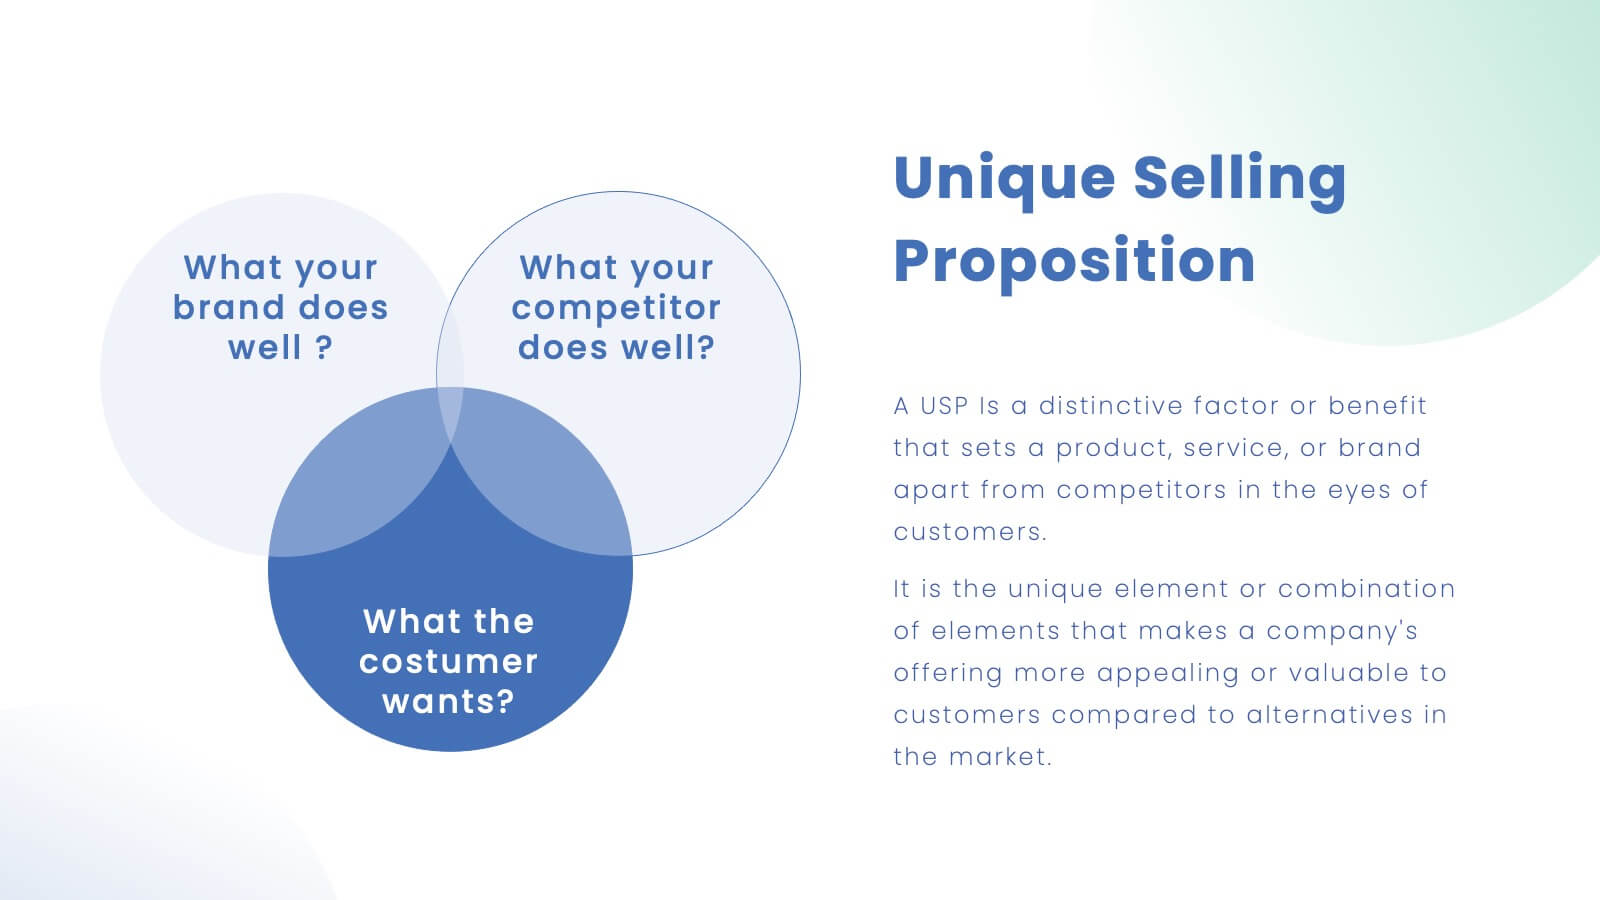
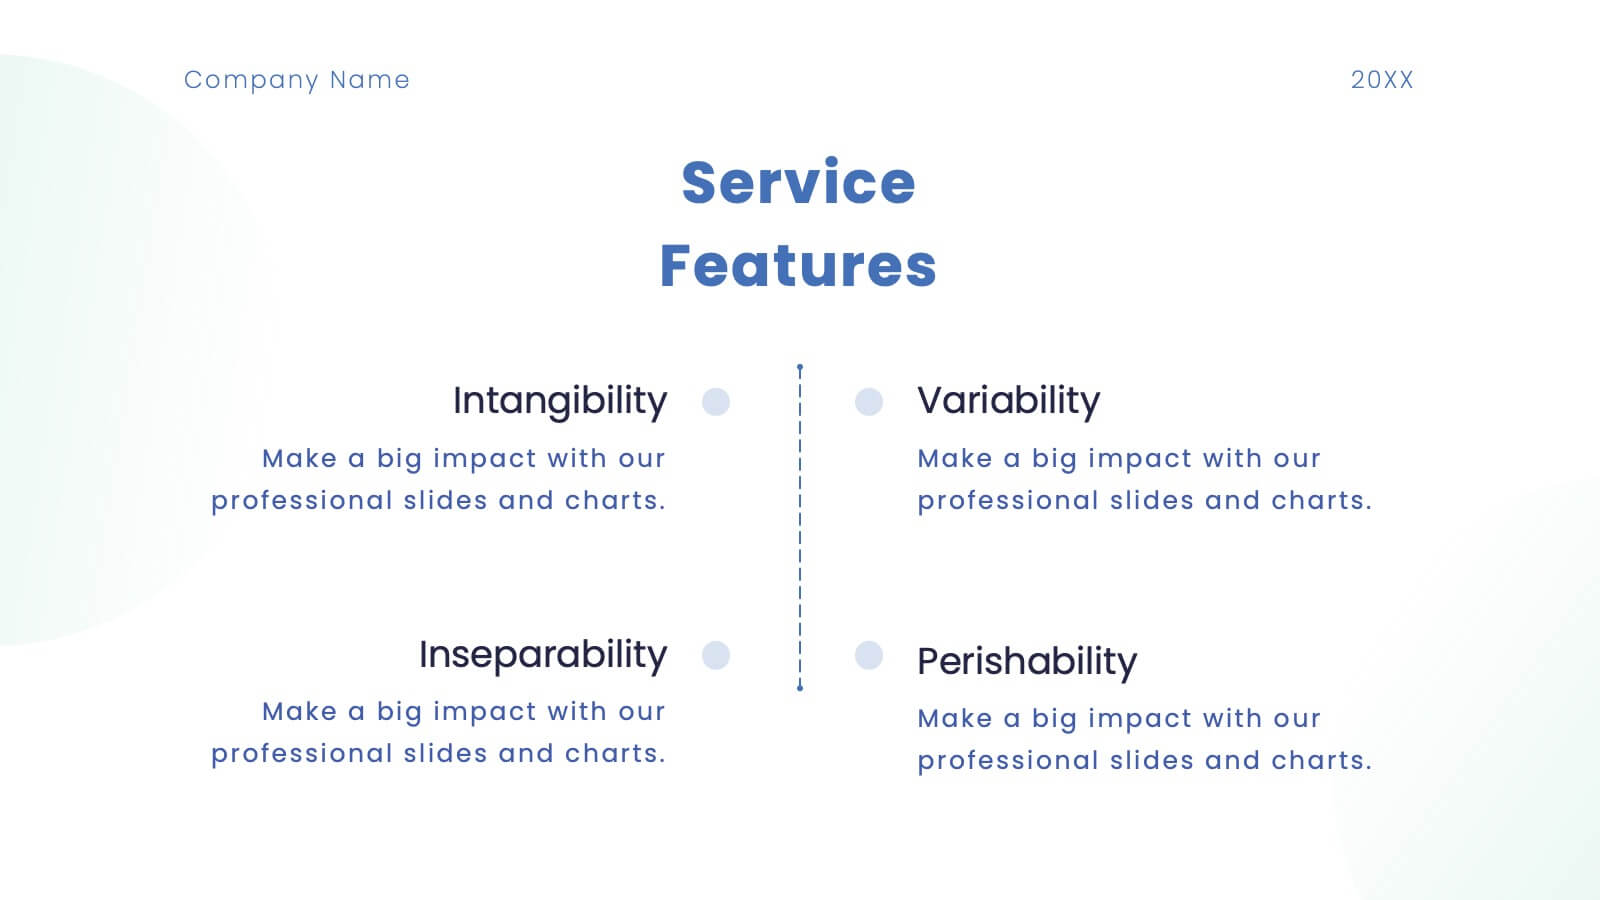
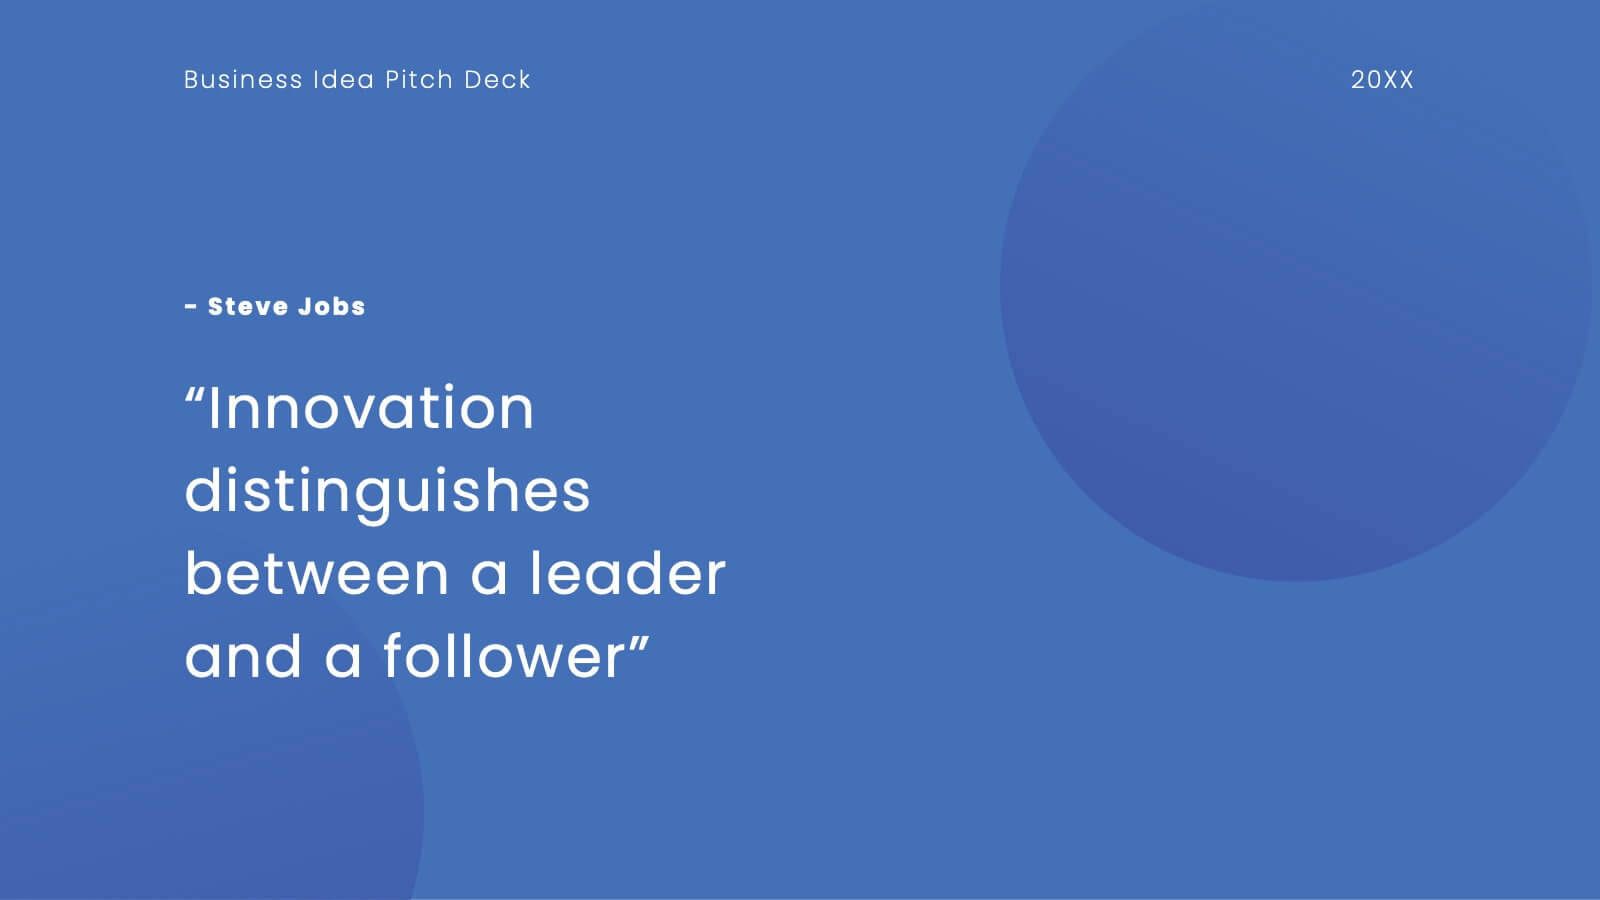
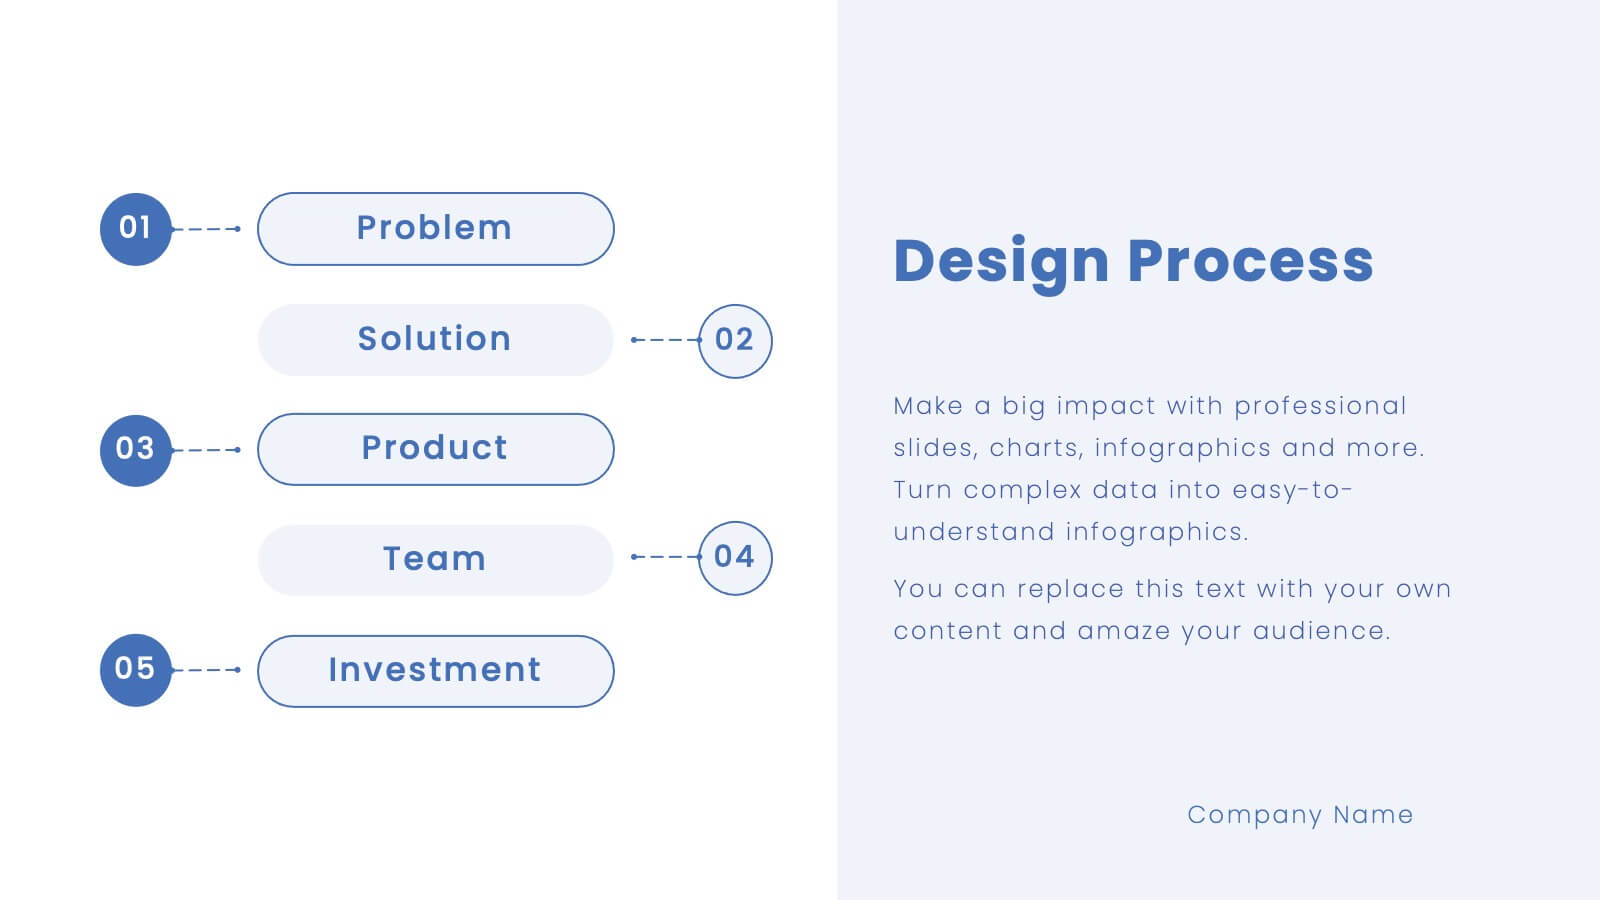
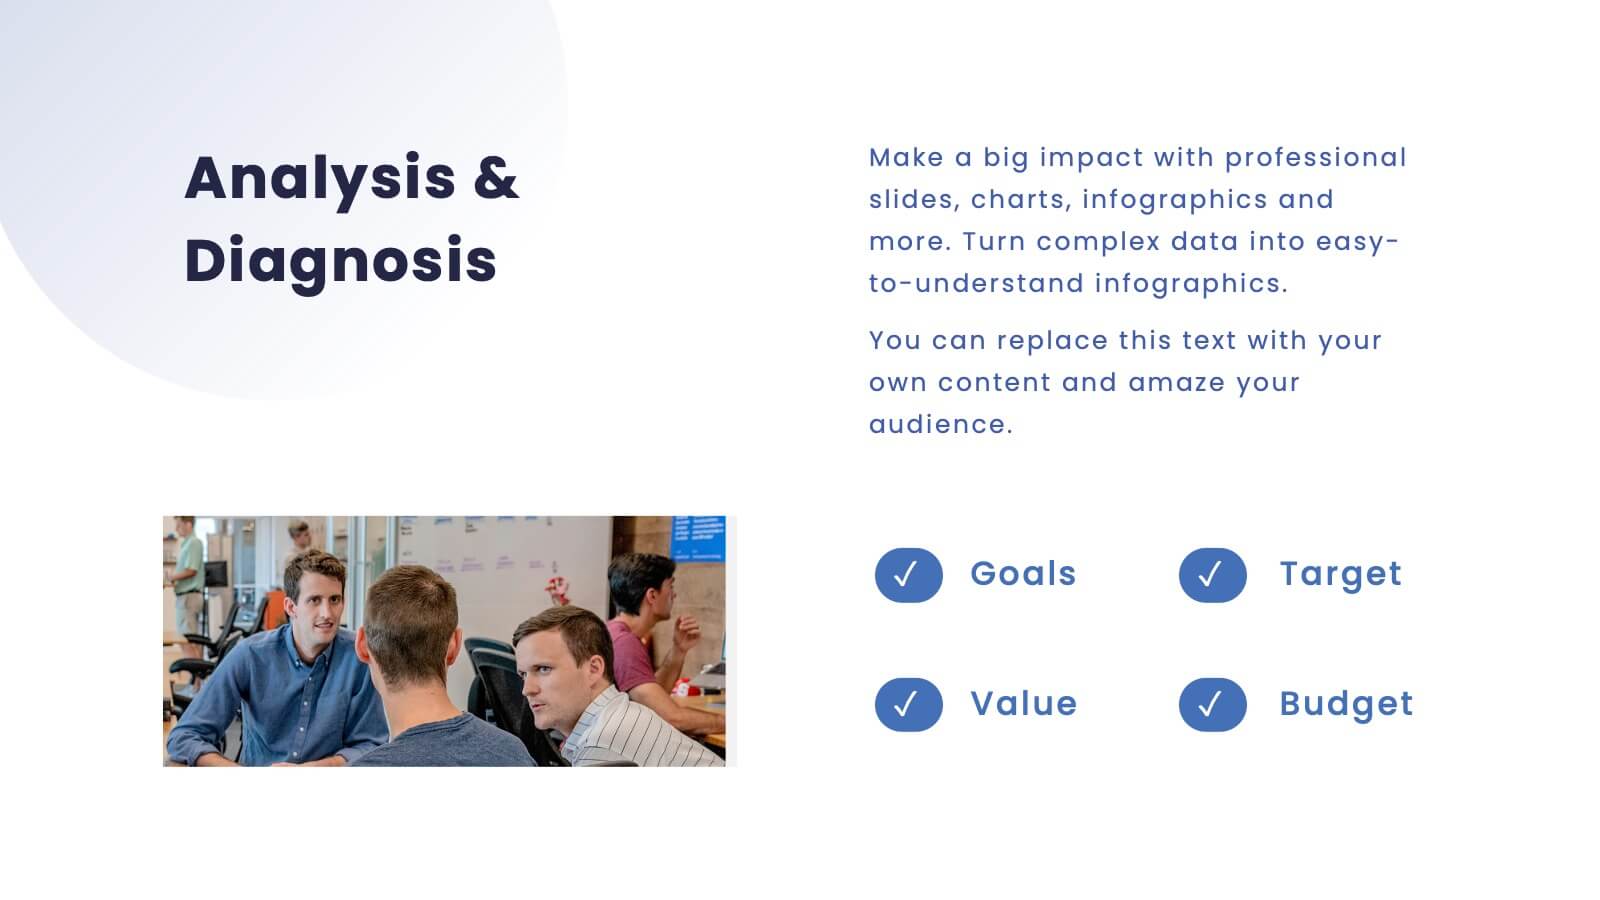
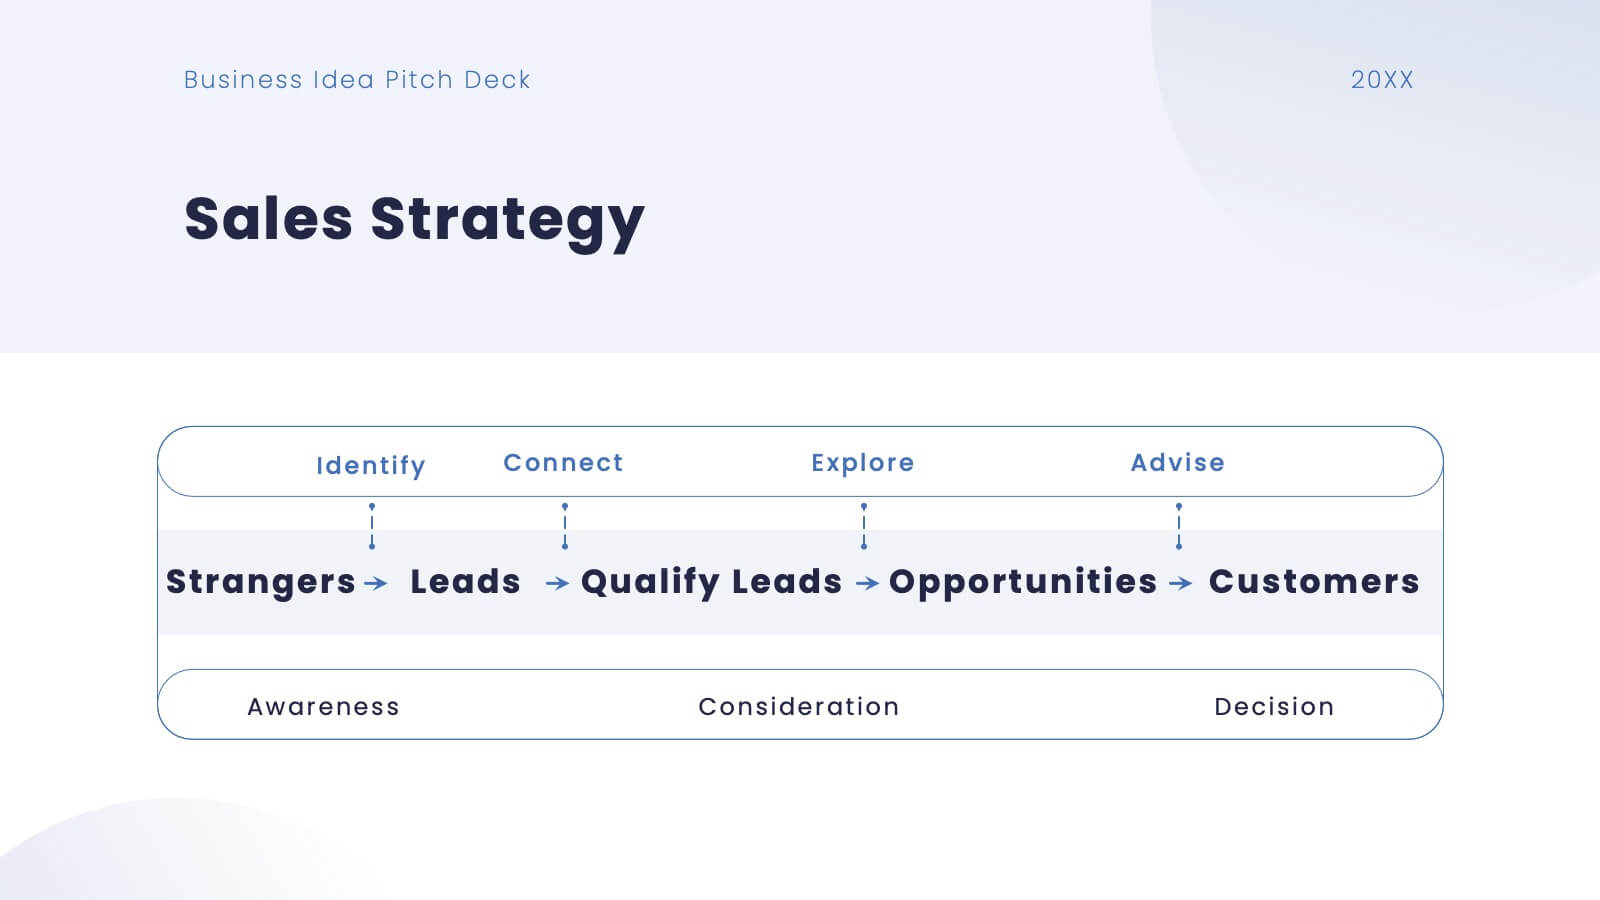
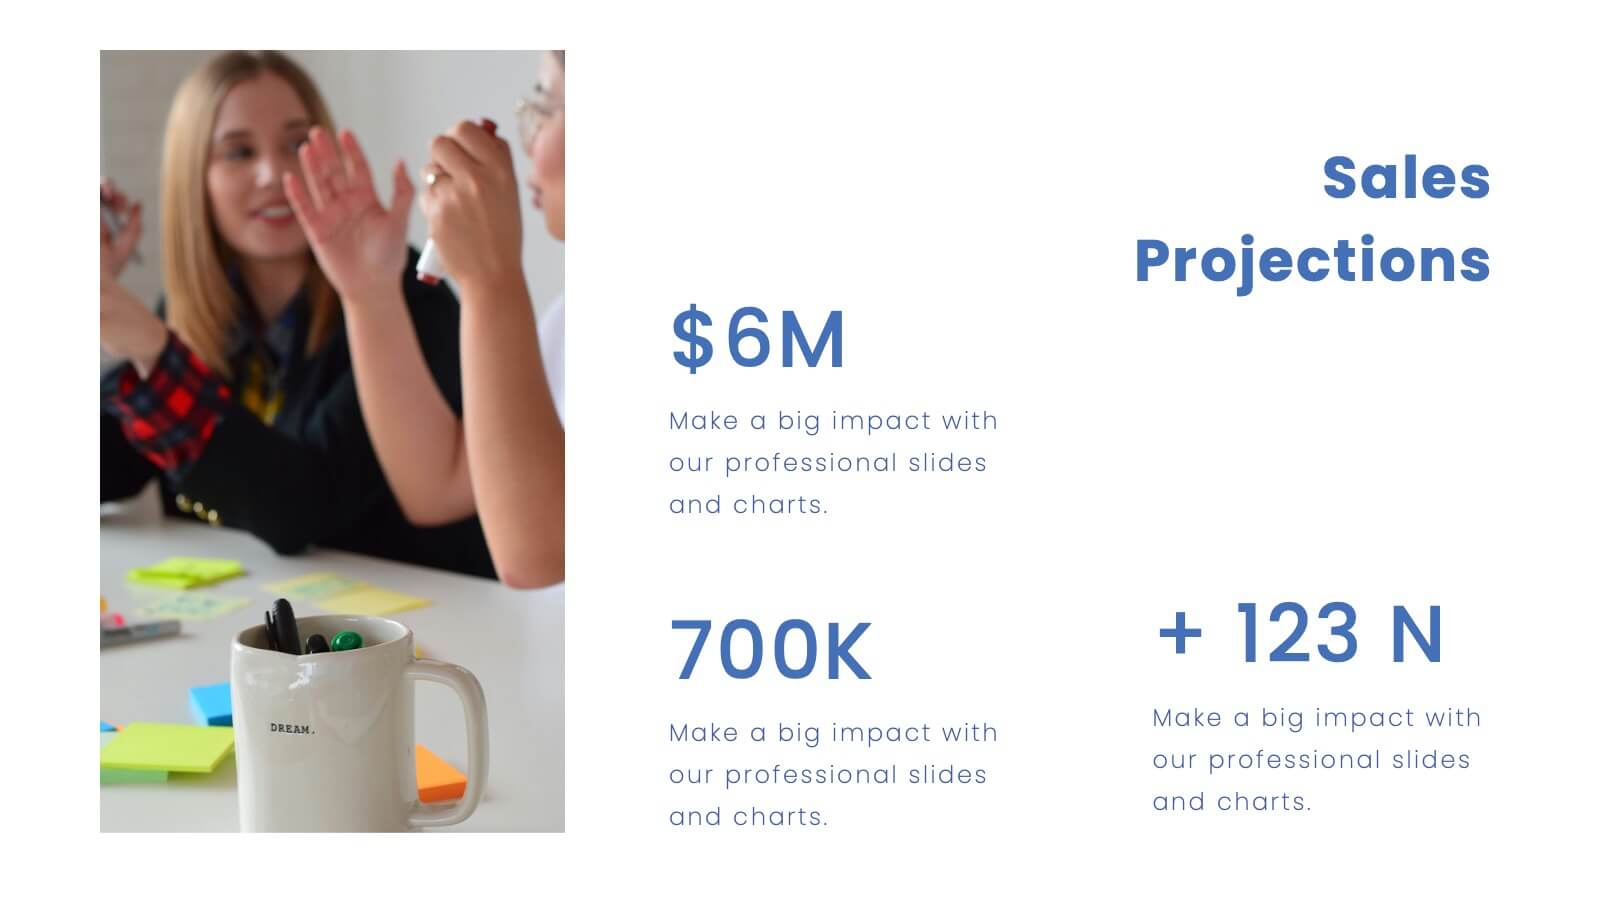
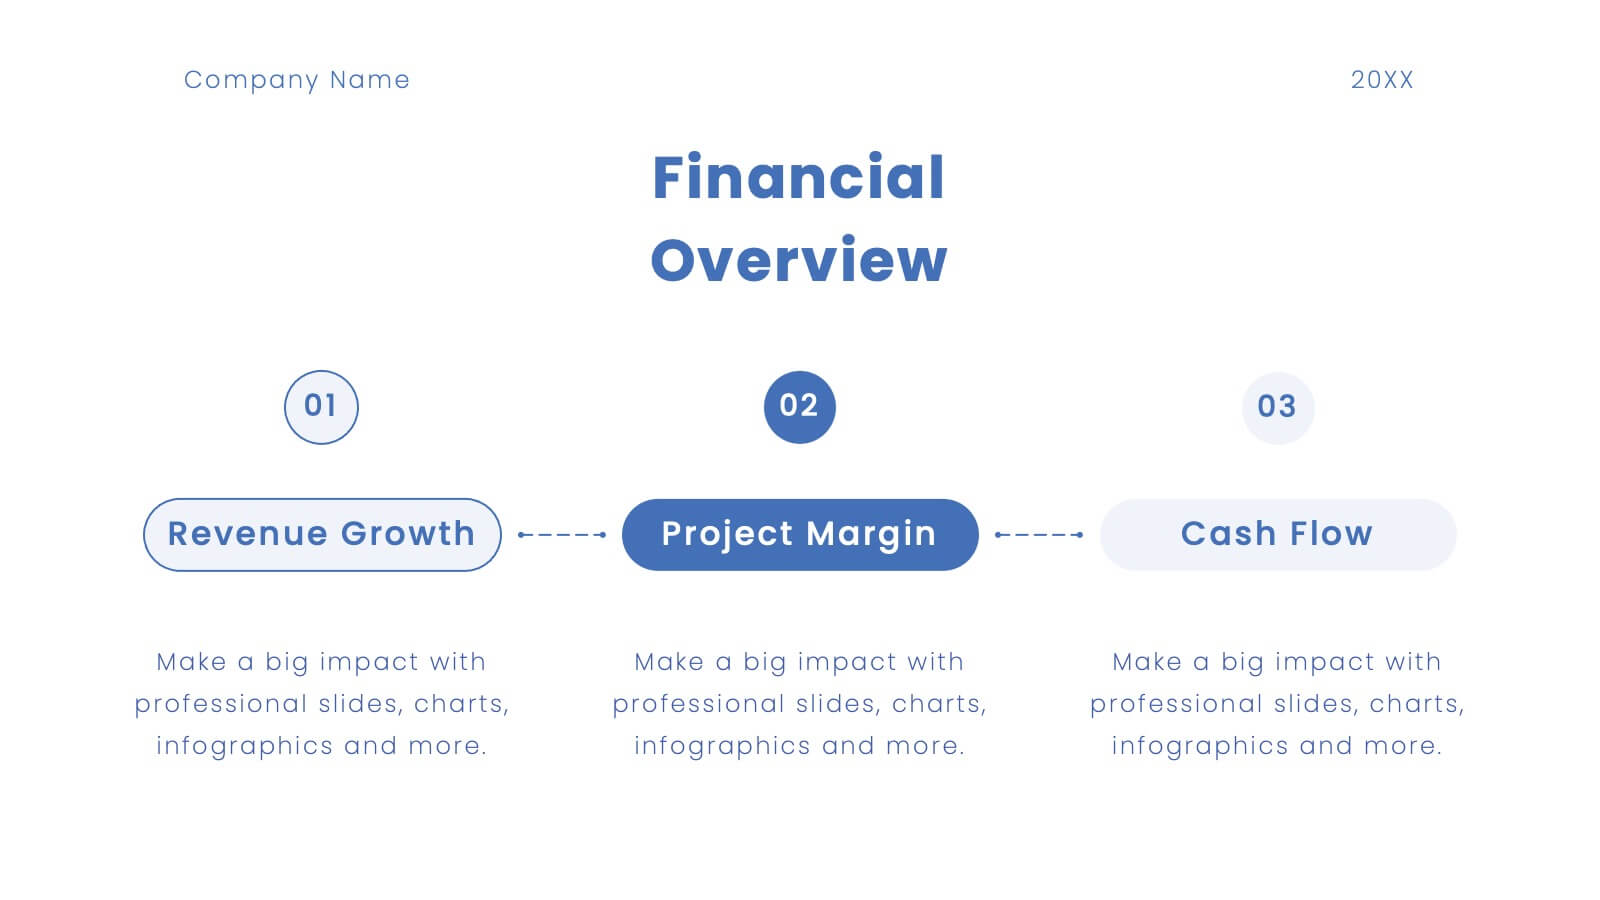
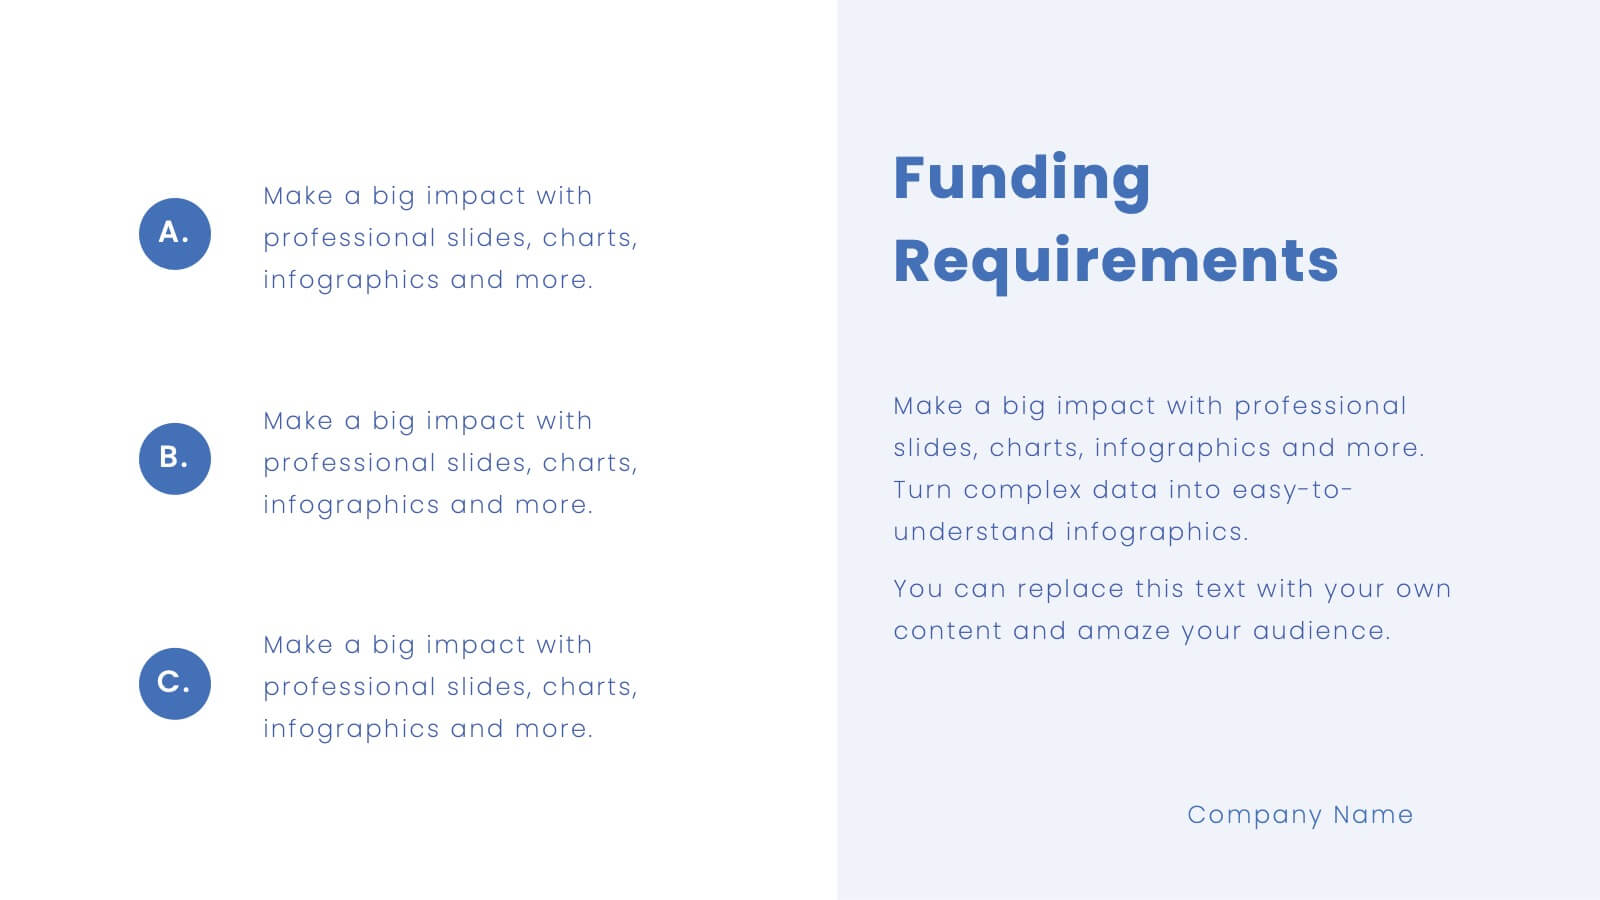
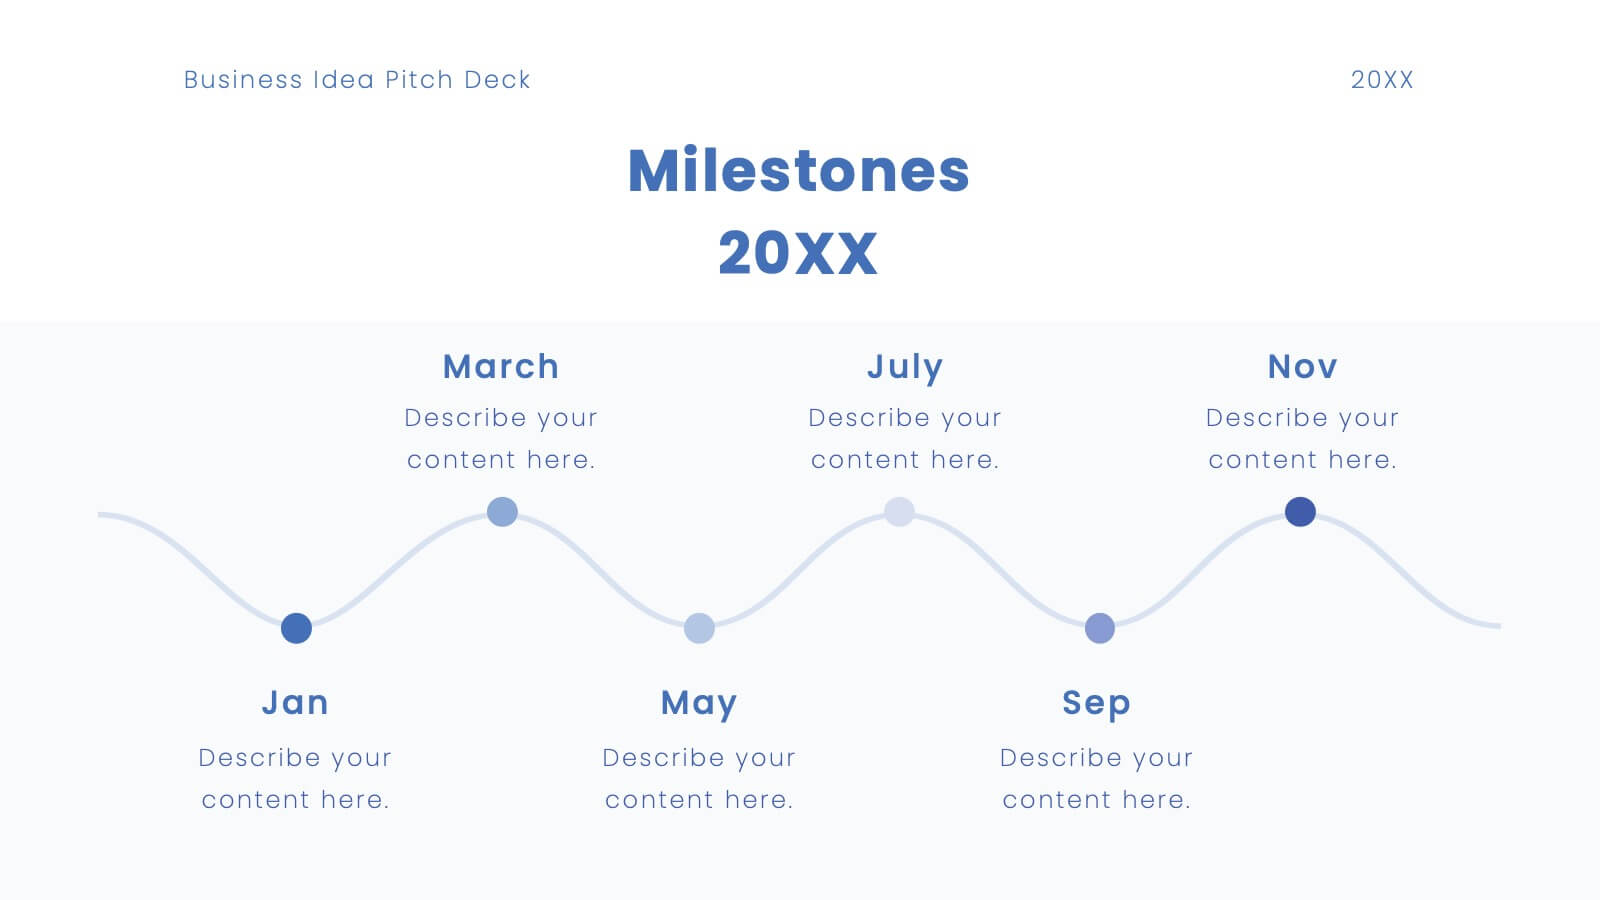
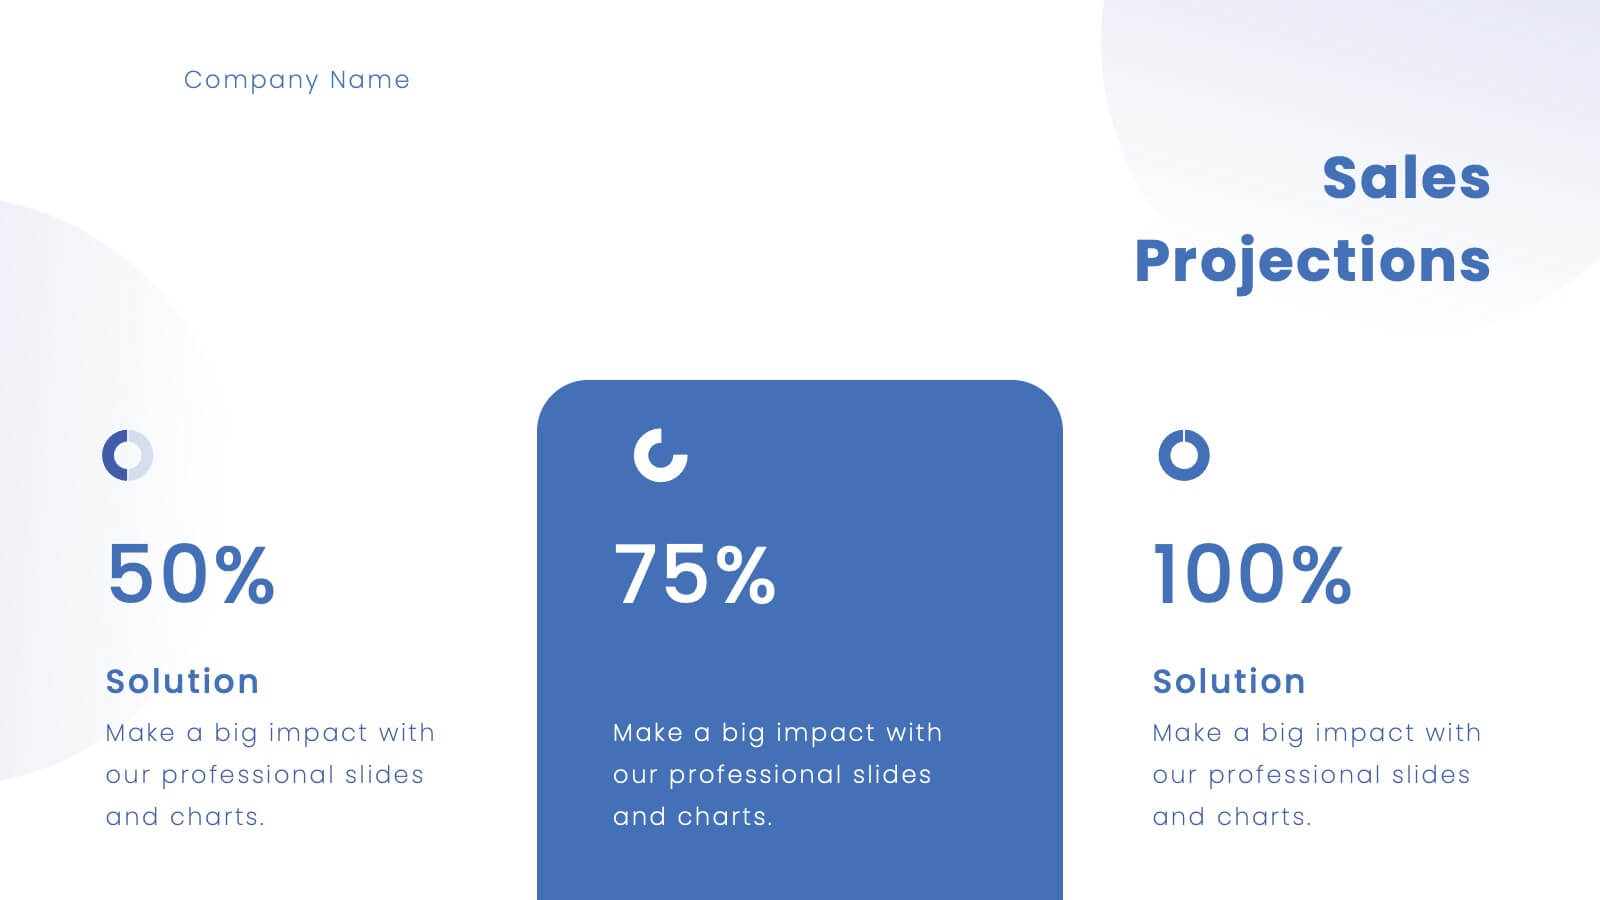
Platinum Business Idea Pitch Deck Presentation
Present your business idea with this sleek and professional pitch deck template! It includes everything from market opportunities to financial projections and sales strategies, providing a comprehensive structure for your pitch. Fully customizable and compatible with PowerPoint, Keynote, and Google Slides, this template is ideal for impressing investors and stakeholders.