


Características


¿Tienes alguna pregunta?
Recomendar


6 diapositivas
Mental Health Infographics
The "Mental Health" infographic template, suitable for PowerPoint, Keynote, and Google Slides, is an essential resource for healthcare professionals, educators, and mental health advocates. This sensitive and informative template is designed to communicate important aspects of mental health in a compassionate and accessible manner. This template covers critical topics such as mental health awareness, coping strategies, and support resources. It is structured to facilitate discussions on mental well-being, making it an invaluable tool for educational presentations, awareness campaigns, and support group discussions. Featuring a calming and empathetic design, the template uses a soothing color scheme with pastel shades of light blue, green, and lavender. This creates a serene and understanding atmosphere that is supportive of mental health topics. Whether used in a clinical setting, classroom, or community workshop, this template ensures that information about mental health is presented in a sensitive, informative, and visually appealing way.


5 diapositivas
Construction Budgeting and Resource Allocation Presentation
Visualize your construction budget layer by layer with the Construction Budgeting and Resource Allocation Presentation. This pyramid-style infographic breaks down costs and resources—from materials and labor to safety infrastructure—making it easy to communicate project allocations. Fully editable in PowerPoint, Keynote, and Google Slides.


10 diapositivas
Sustainable Farming Practices
Present eco-friendly agricultural strategies with this visually structured layout. Featuring a linear process flow and eco-themed icons, this slide is ideal for outlining key sustainability practices, steps, or phases. Use it for presentations on regenerative agriculture, organic farming, or environmental policy. Fully editable in PowerPoint, Keynote, and Google Slides.


5 diapositivas
Operational Process Mapping Presentation
Visualize complex workflows with this operational process mapping template, designed with four vertical sections for step-by-step clarity. Ideal for business operations, SOPs, and project management, it features clean flowchart elements for structured planning. Fully editable in Canva, PowerPoint, or Google Slides, ensuring easy customization for any industry or organizational process.


4 diapositivas
Scrum & Agile Sprint Presentation
Bring movement and clarity to your workflow with a dynamic loop-and-sprint visual that makes progress feel intuitive and easy to track. This presentation helps you outline iterations, refine tasks, and communicate team priorities with confidence. Fully editable and compatible with PowerPoint, Keynote, and Google Slides.


7 diapositivas
Team Work Infographic Presentation Template
Teamwork is a method of working collaboratively in order to achieve a goal. Members of a team can accomplish more than they could individually through their combined talents, knowledge and experience. This template can be used to help explain what teamwork is, what it looks like, why it’s important, and how you can cultivate it within your organization. This teamwork template is designed to encourage communication. Use this template to help evaluate what areas your team can improve on and how they can do so. Point out exactly how vital teamwork is to the success of your business.


7 diapositivas
Target Audience Demographics Slide Presentation
Capture attention with a clean, data-driven layout that makes understanding your audience quick and intuitive. This presentation helps you showcase key demographic insights, highlight behavioral patterns, and communicate strategic findings with clarity. Designed for easy editing and smooth workflow, it’s fully compatible with PowerPoint, Keynote, and Google Slides.


5 diapositivas
SaaS Pricing Model
Present your pricing plans with confidence using this clear and structured SaaS pricing model template. Perfect for showcasing tiered options like Free, Basic, Medium, and Premium, this design makes feature comparisons easy for your audience to grasp. Fully compatible with PowerPoint, Keynote, and Google Slides for effortless editing and presentation.


7 diapositivas
Creative Tree Diagram Infographic
Unveil hierarchical structures or processes with our evocative tree diagram infographic. Set against a pristine white canvas and enriched with shades of trusty blue and organic green, this creative template epitomizes growth, interconnections, and systematic understanding. Embellished with crisp infographics, intuitive icons, and illustrative image placeholders, it effortlessly visualizes layered information. Perfectly tailored for Powerpoint, Keynote, or Google Slides. An indispensable resource for project managers, educators, business analysts, or any organization aiming to display branching information or decisions. Grow with clarity; let each slide branch out into a wealth of understanding.


20 diapositivas
Oscillation Project Proposal Presentation
This project proposal template is designed to captivate your audience with a bold purple and yellow color scheme, adding a modern flair to your presentation. It includes comprehensive sections like company overview, objectives and goals, methodology, deliverables, and budget breakdown. Perfect for clearly communicating your project vision and strategy, this template streamlines your content while highlighting your professional approach. Compatible with PowerPoint, Keynote, and Google Slides, it provides versatility for seamless delivery across platforms.


5 diapositivas
Beer Drinking Infographics
The art of beer encompasses the brewing process, the craftsmanship of creating unique flavors and styles, and the enjoyment of this ancient beverage. These infographics are perfect for showcasing key facts, statistics, and interesting information related to the world of beer. This template is ideal for breweries, beer enthusiasts, bartenders, or anyone interested in sharing knowledge about different beer types, brewing processes, or beer culture. The template offers a variety of slide layouts to cover different aspects of beer drinking. The template provides sections for discussing different beer styles, brewing processes, and beer tasting.


23 diapositivas
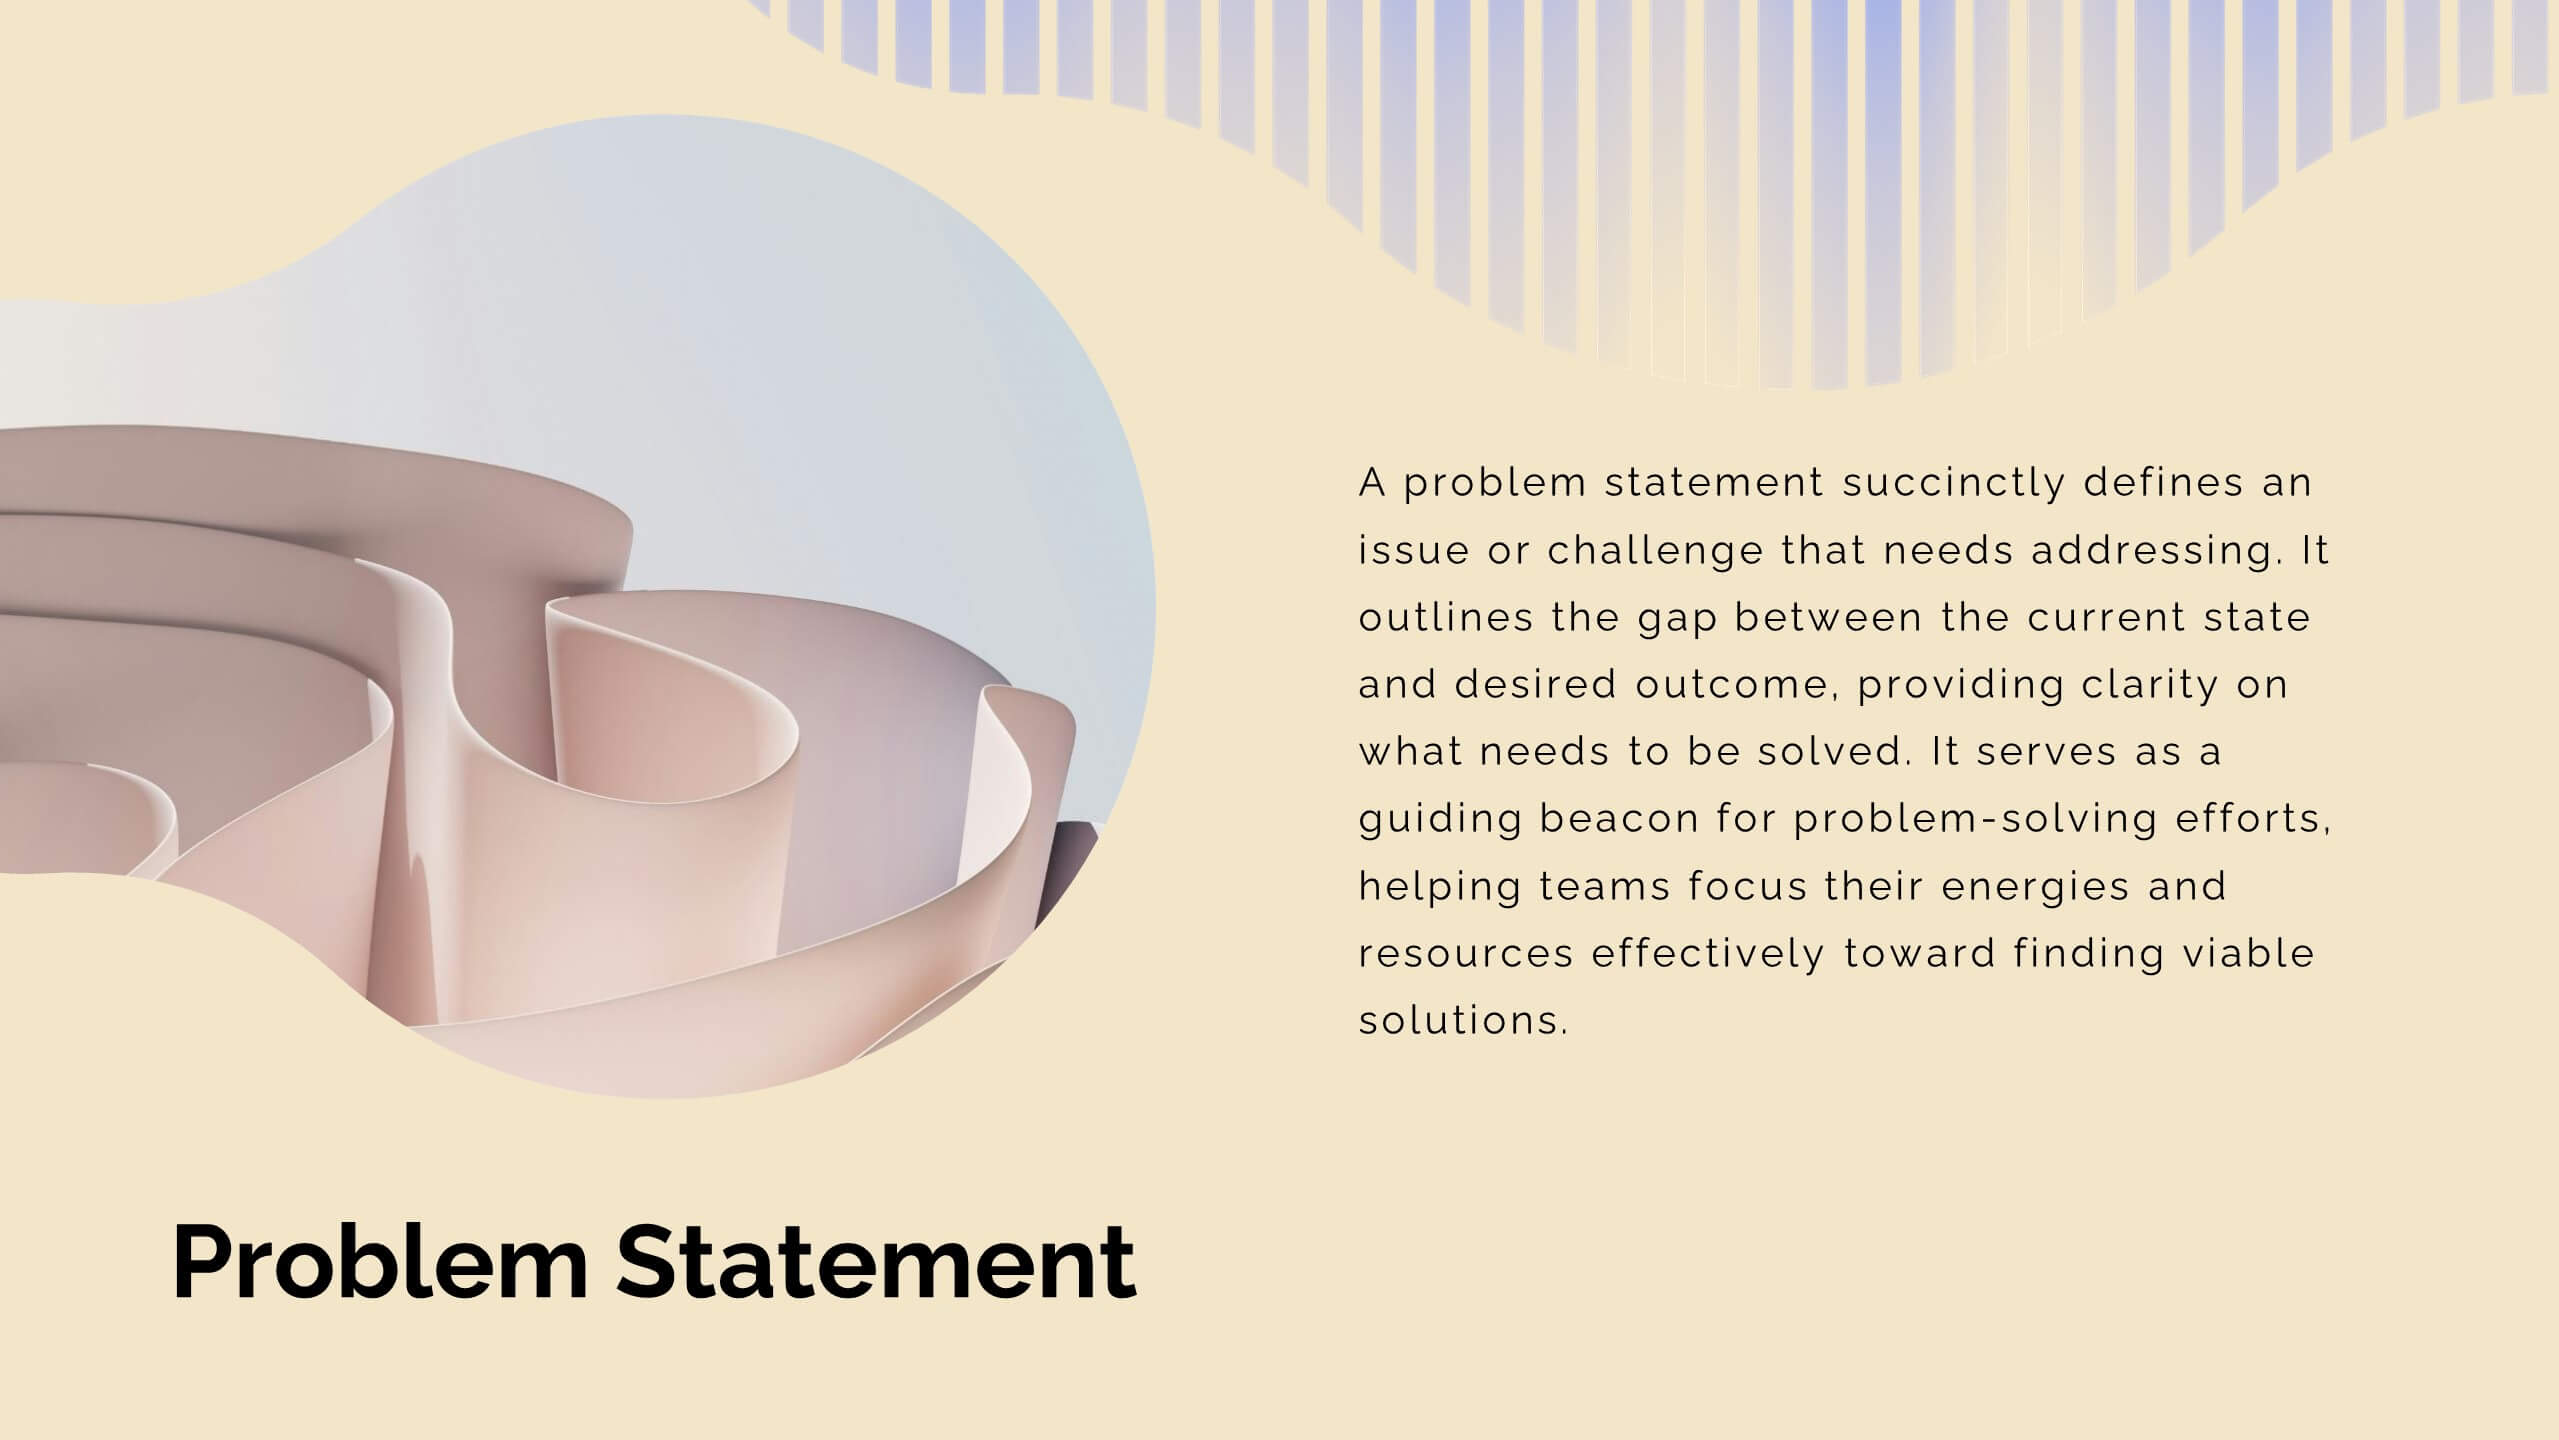
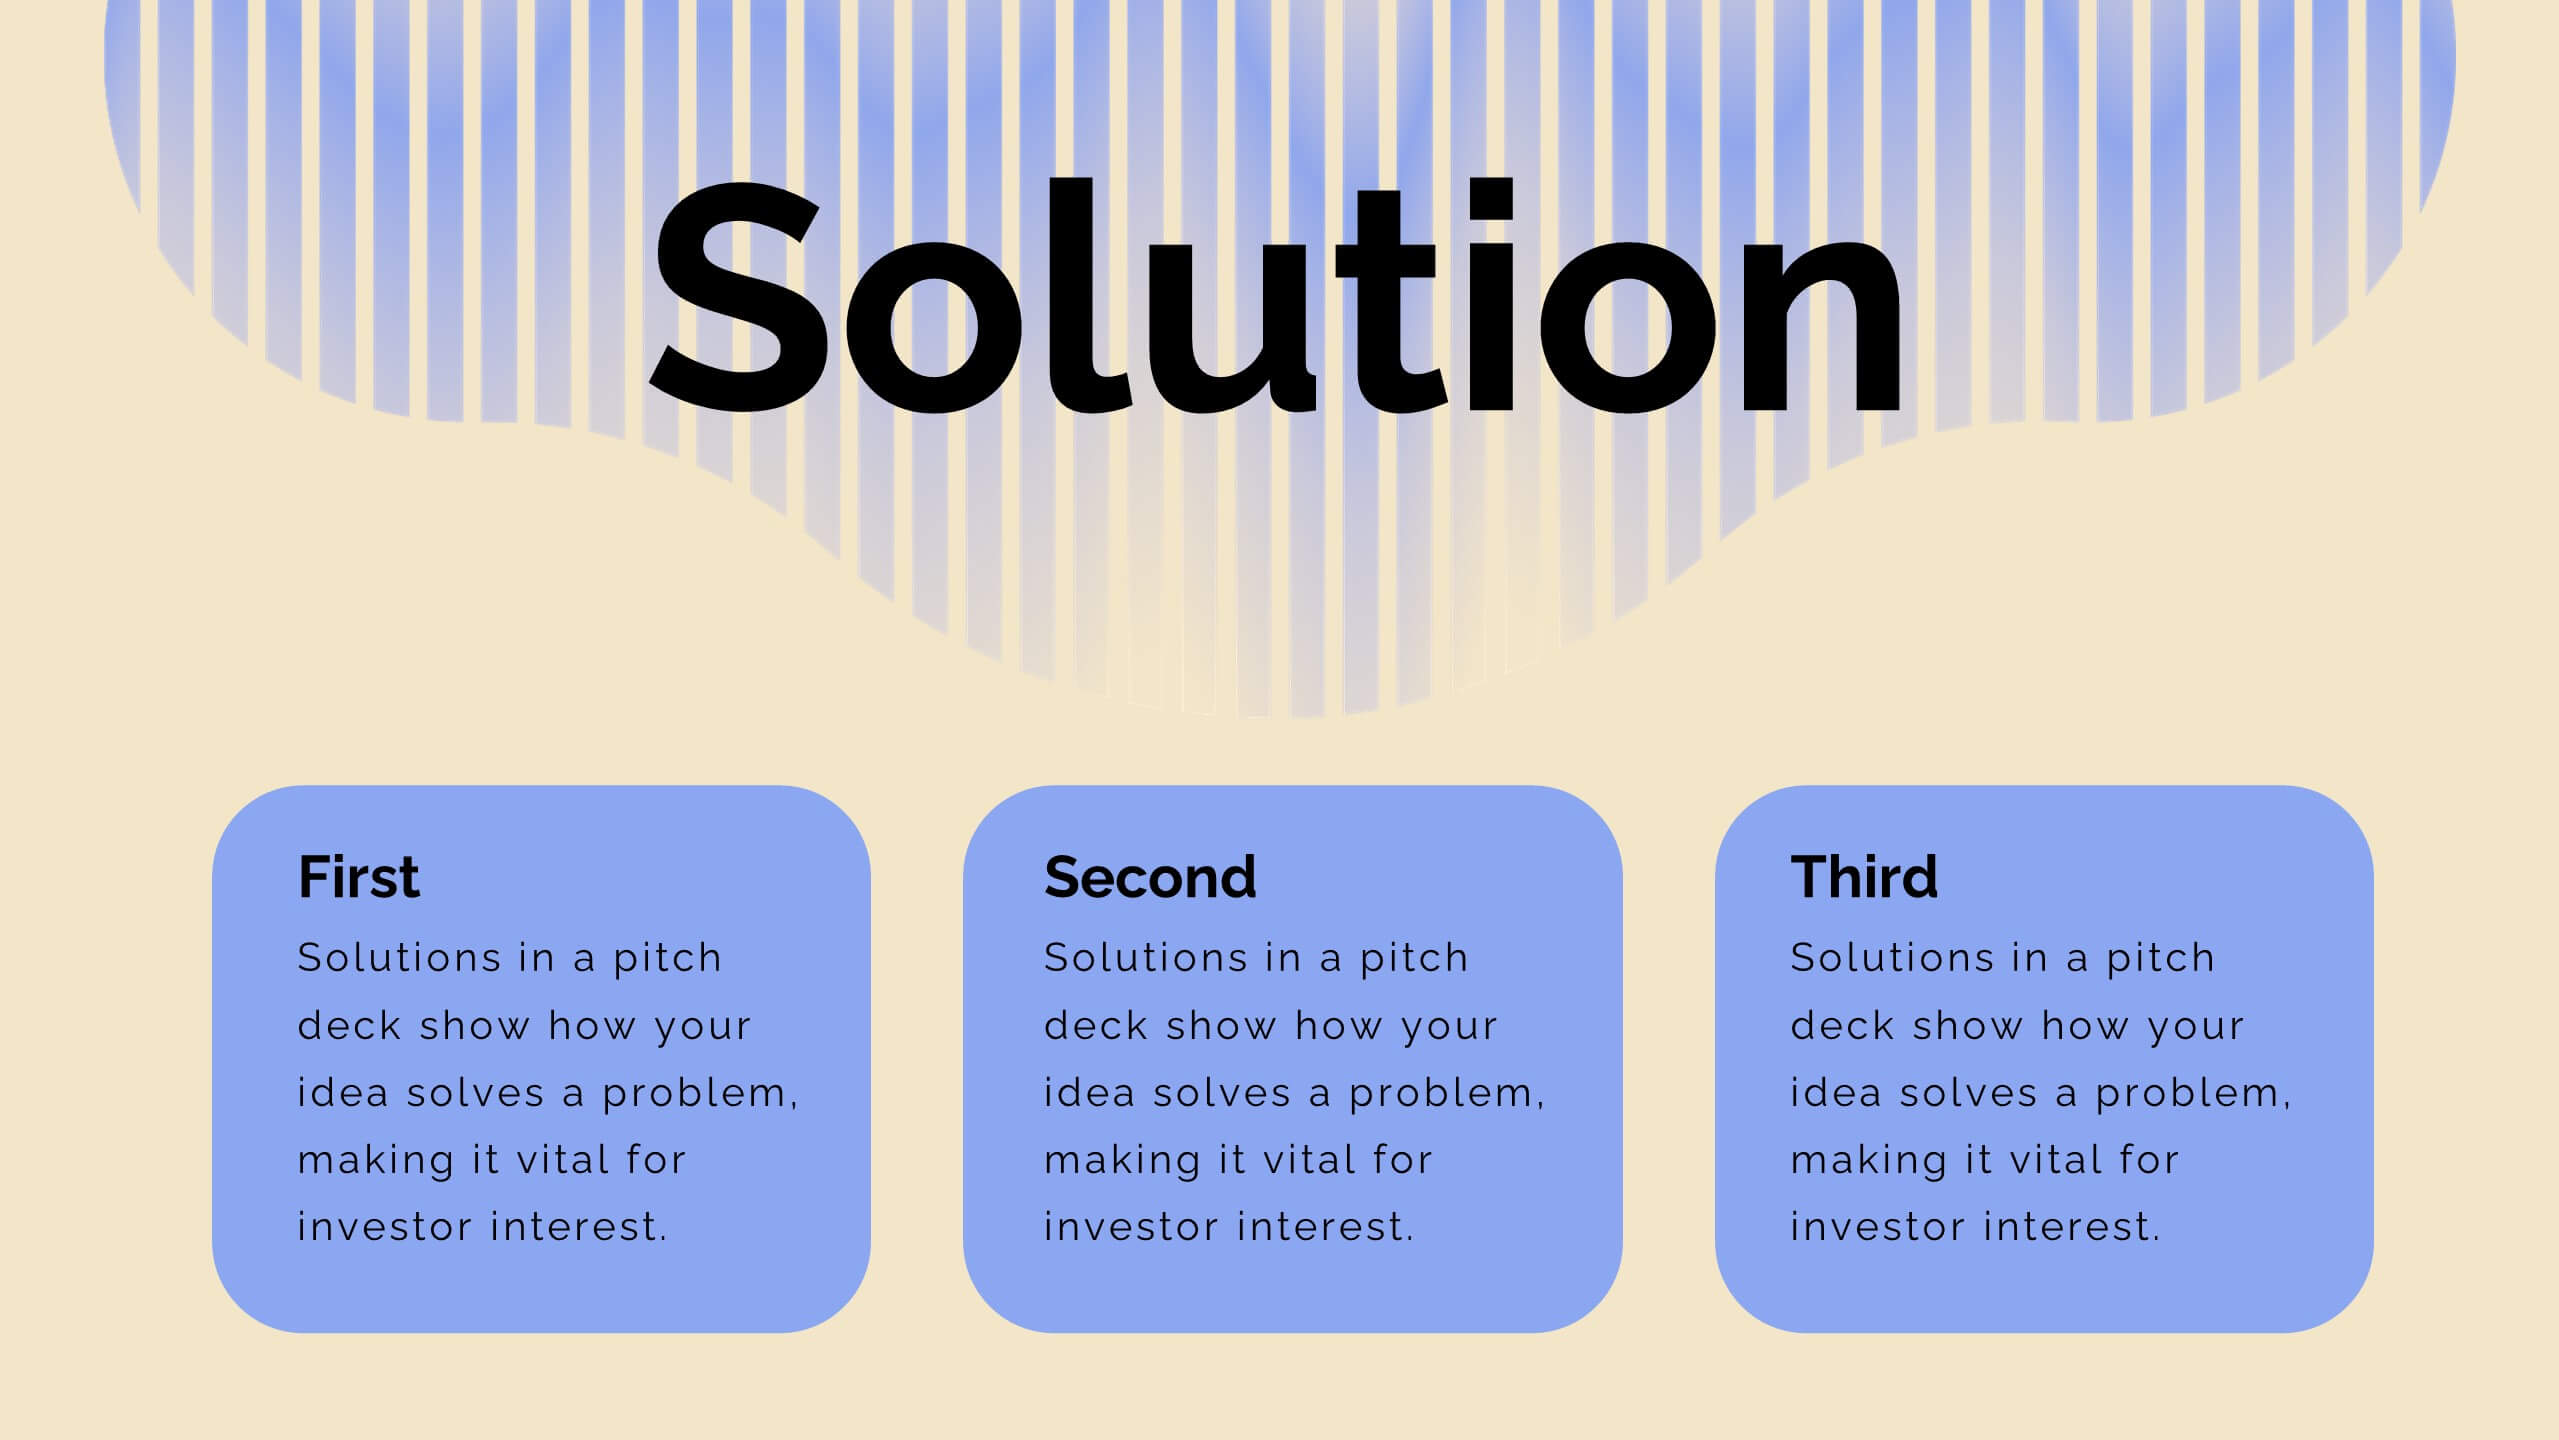
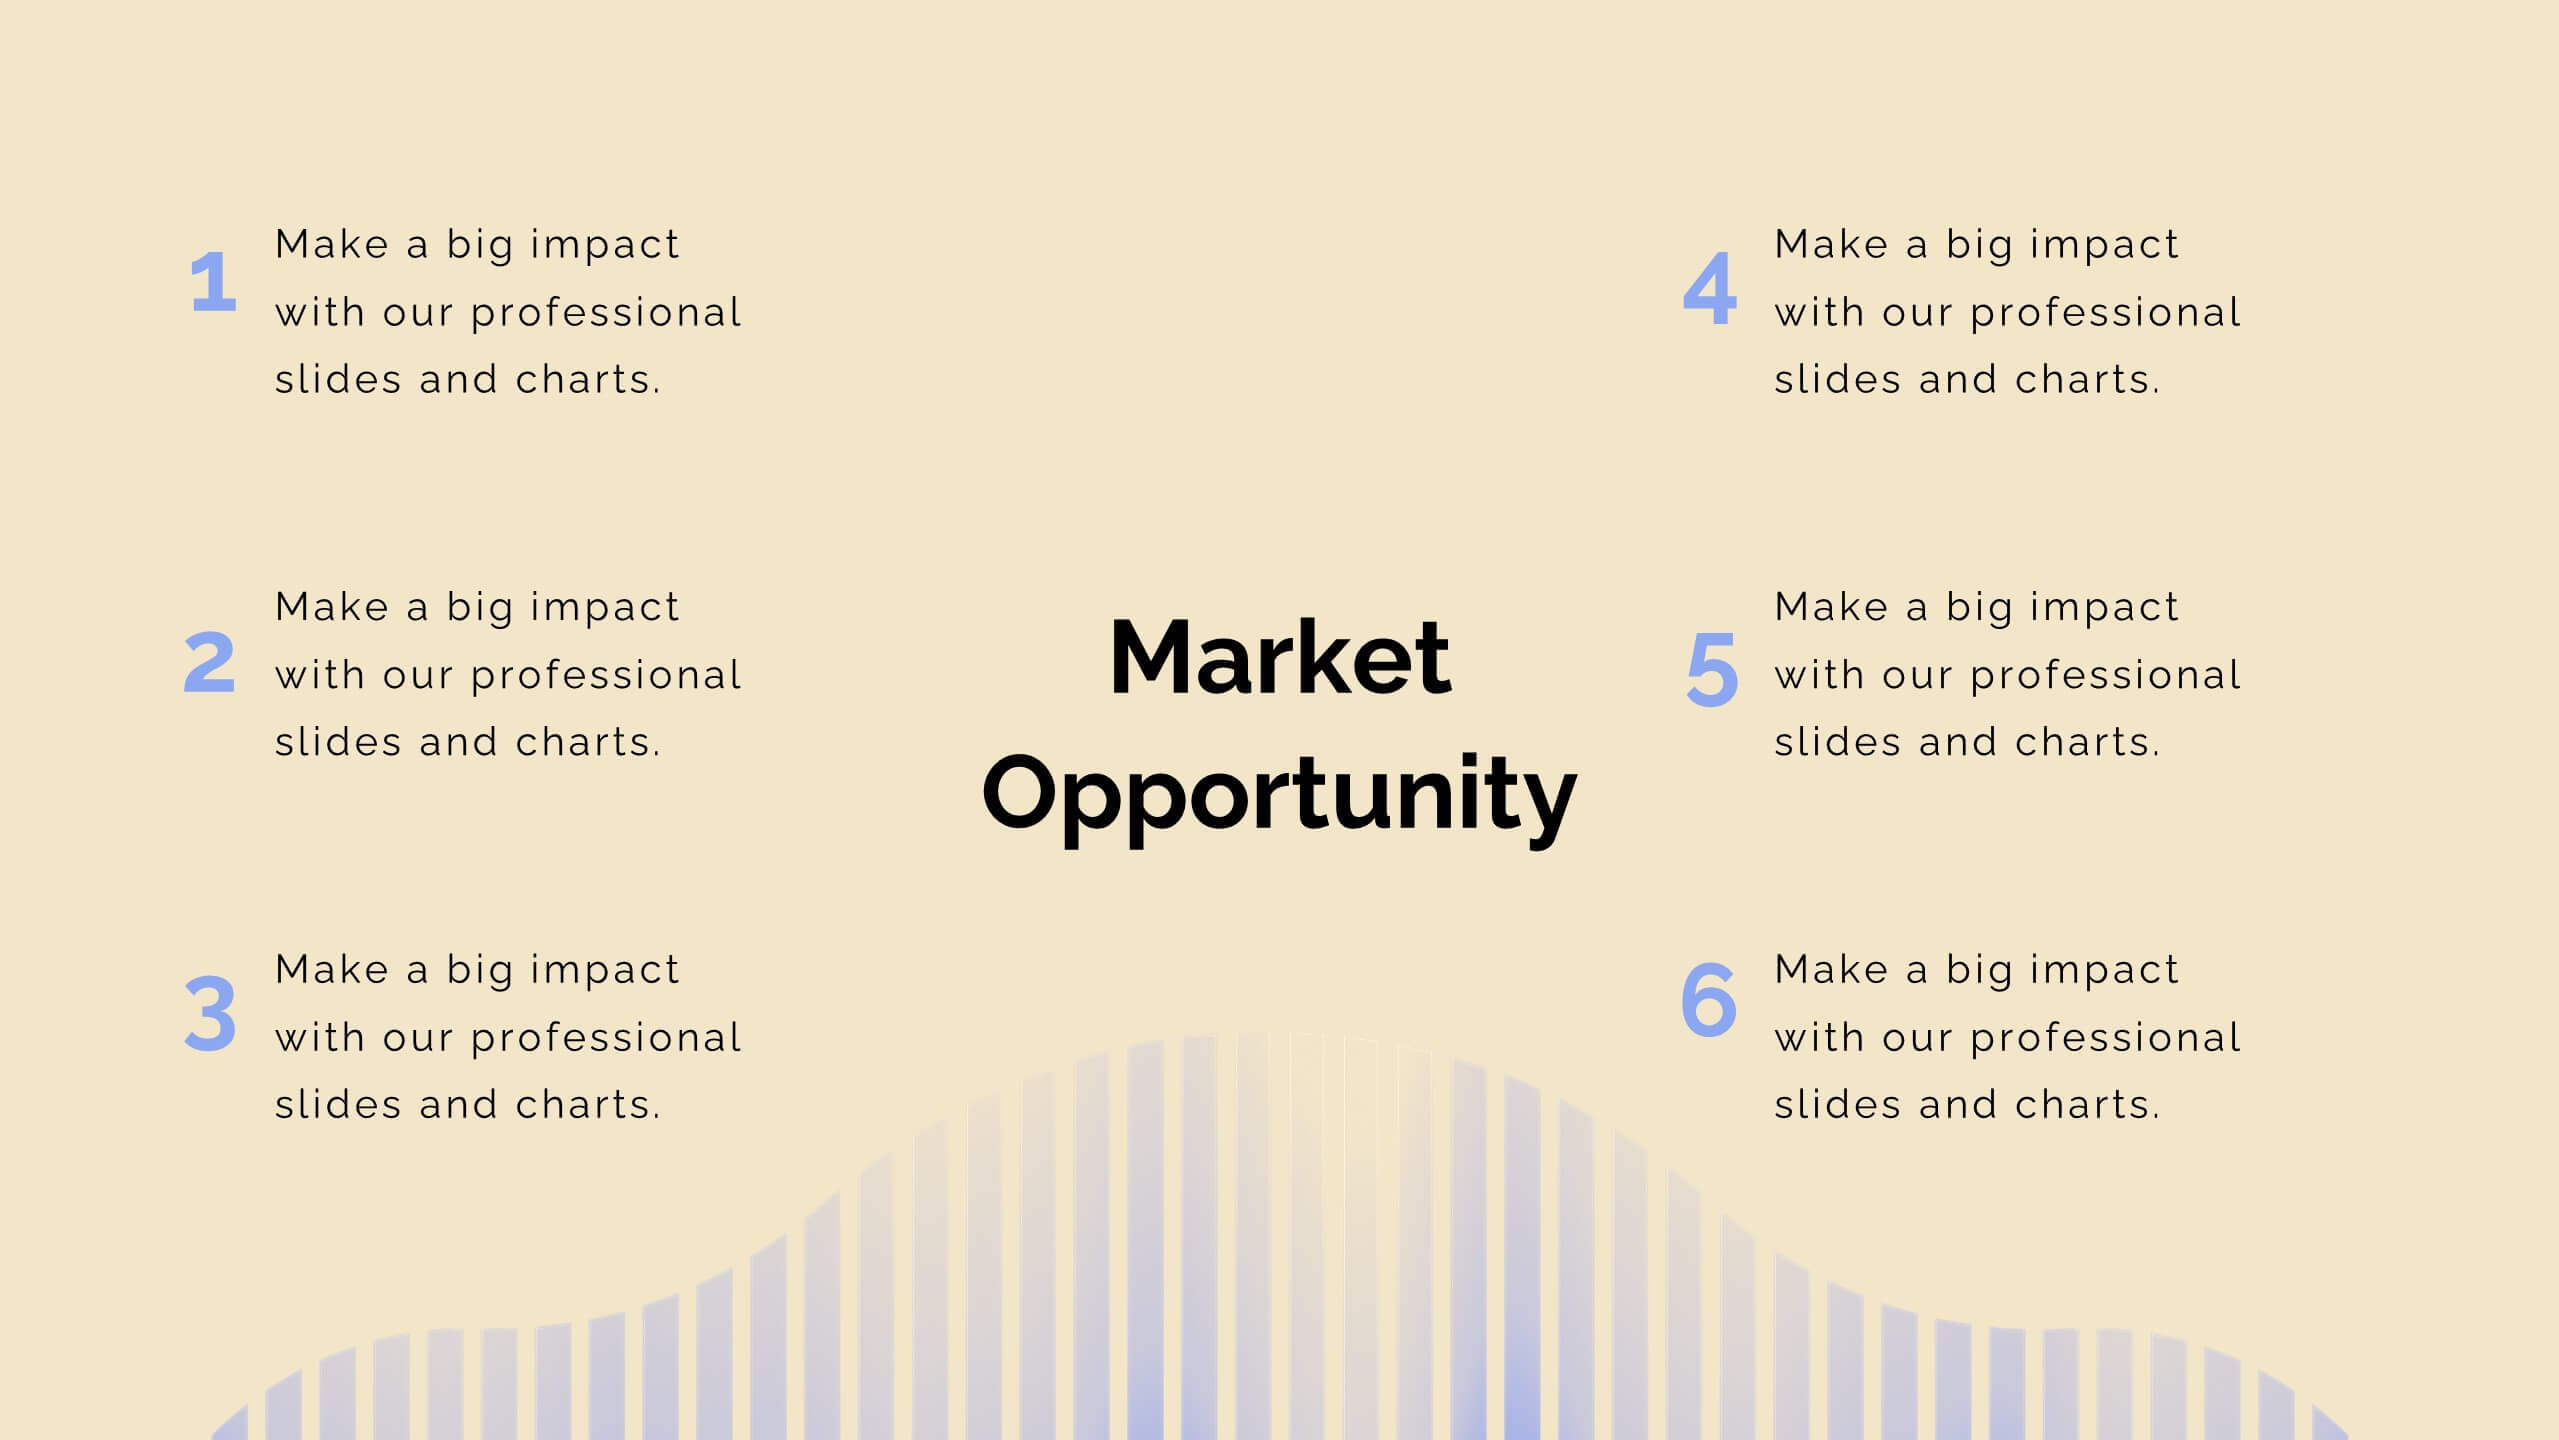
Journey Product Roadmap Presentation
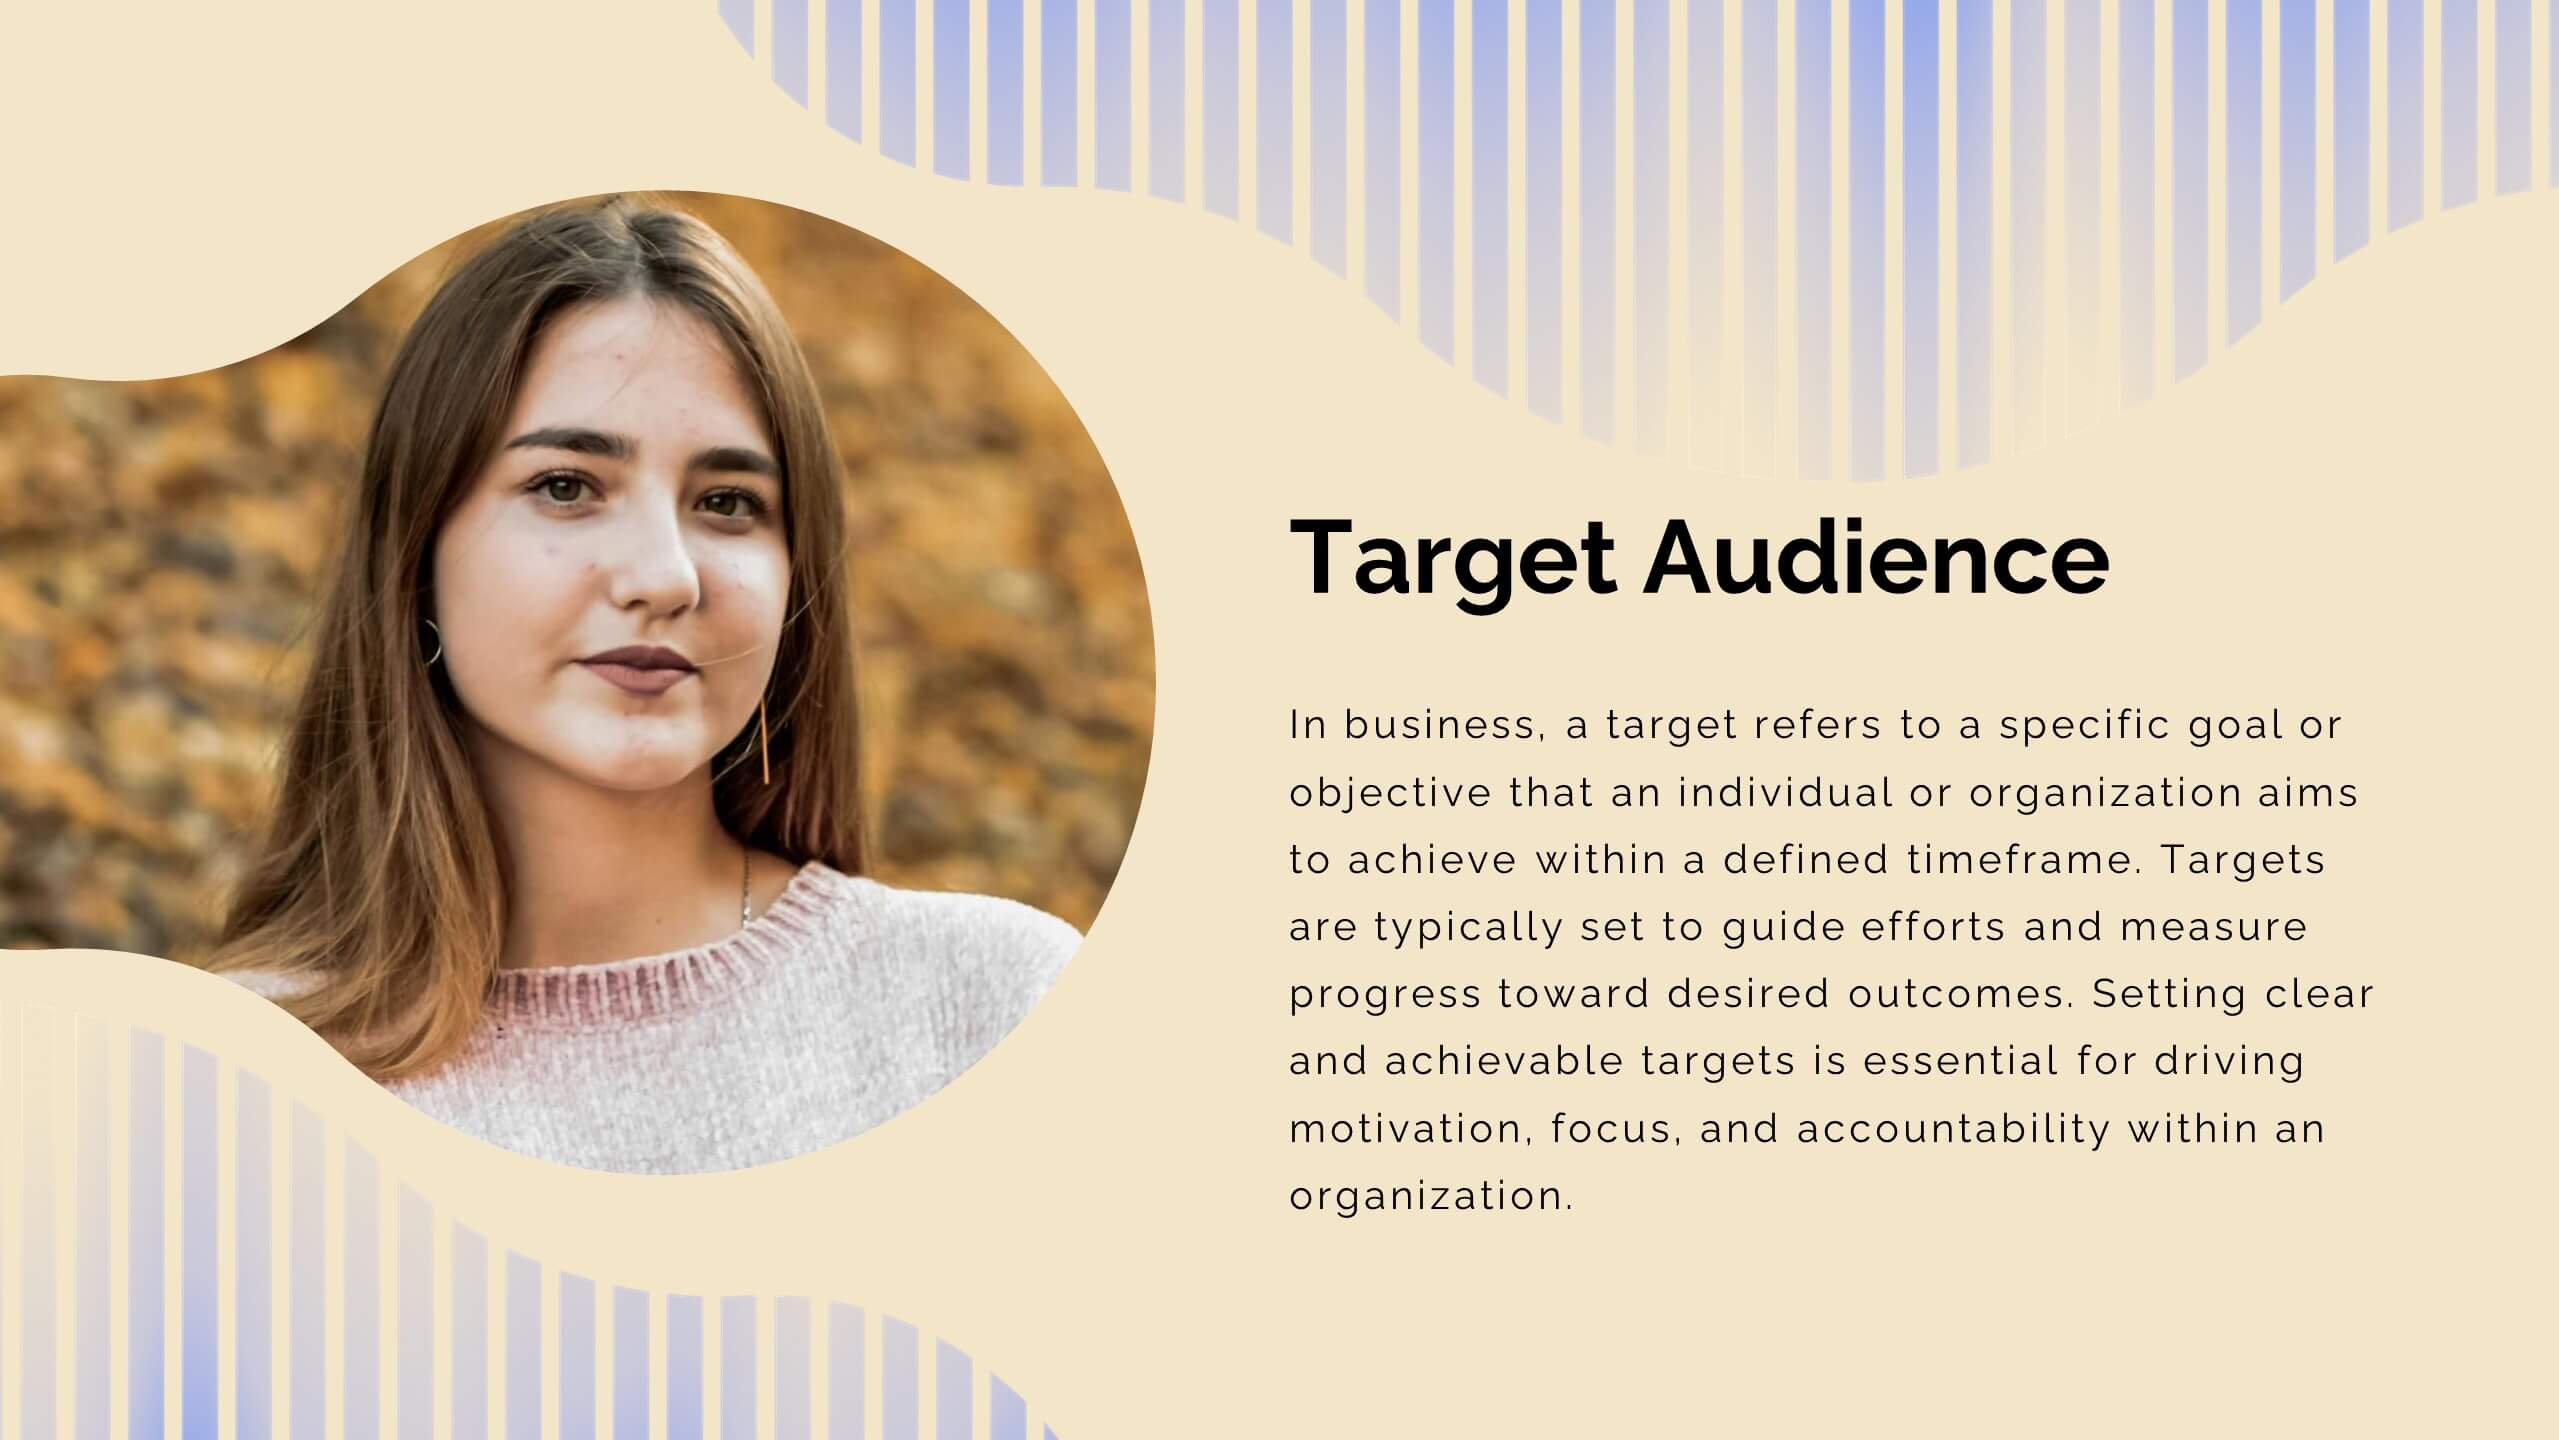
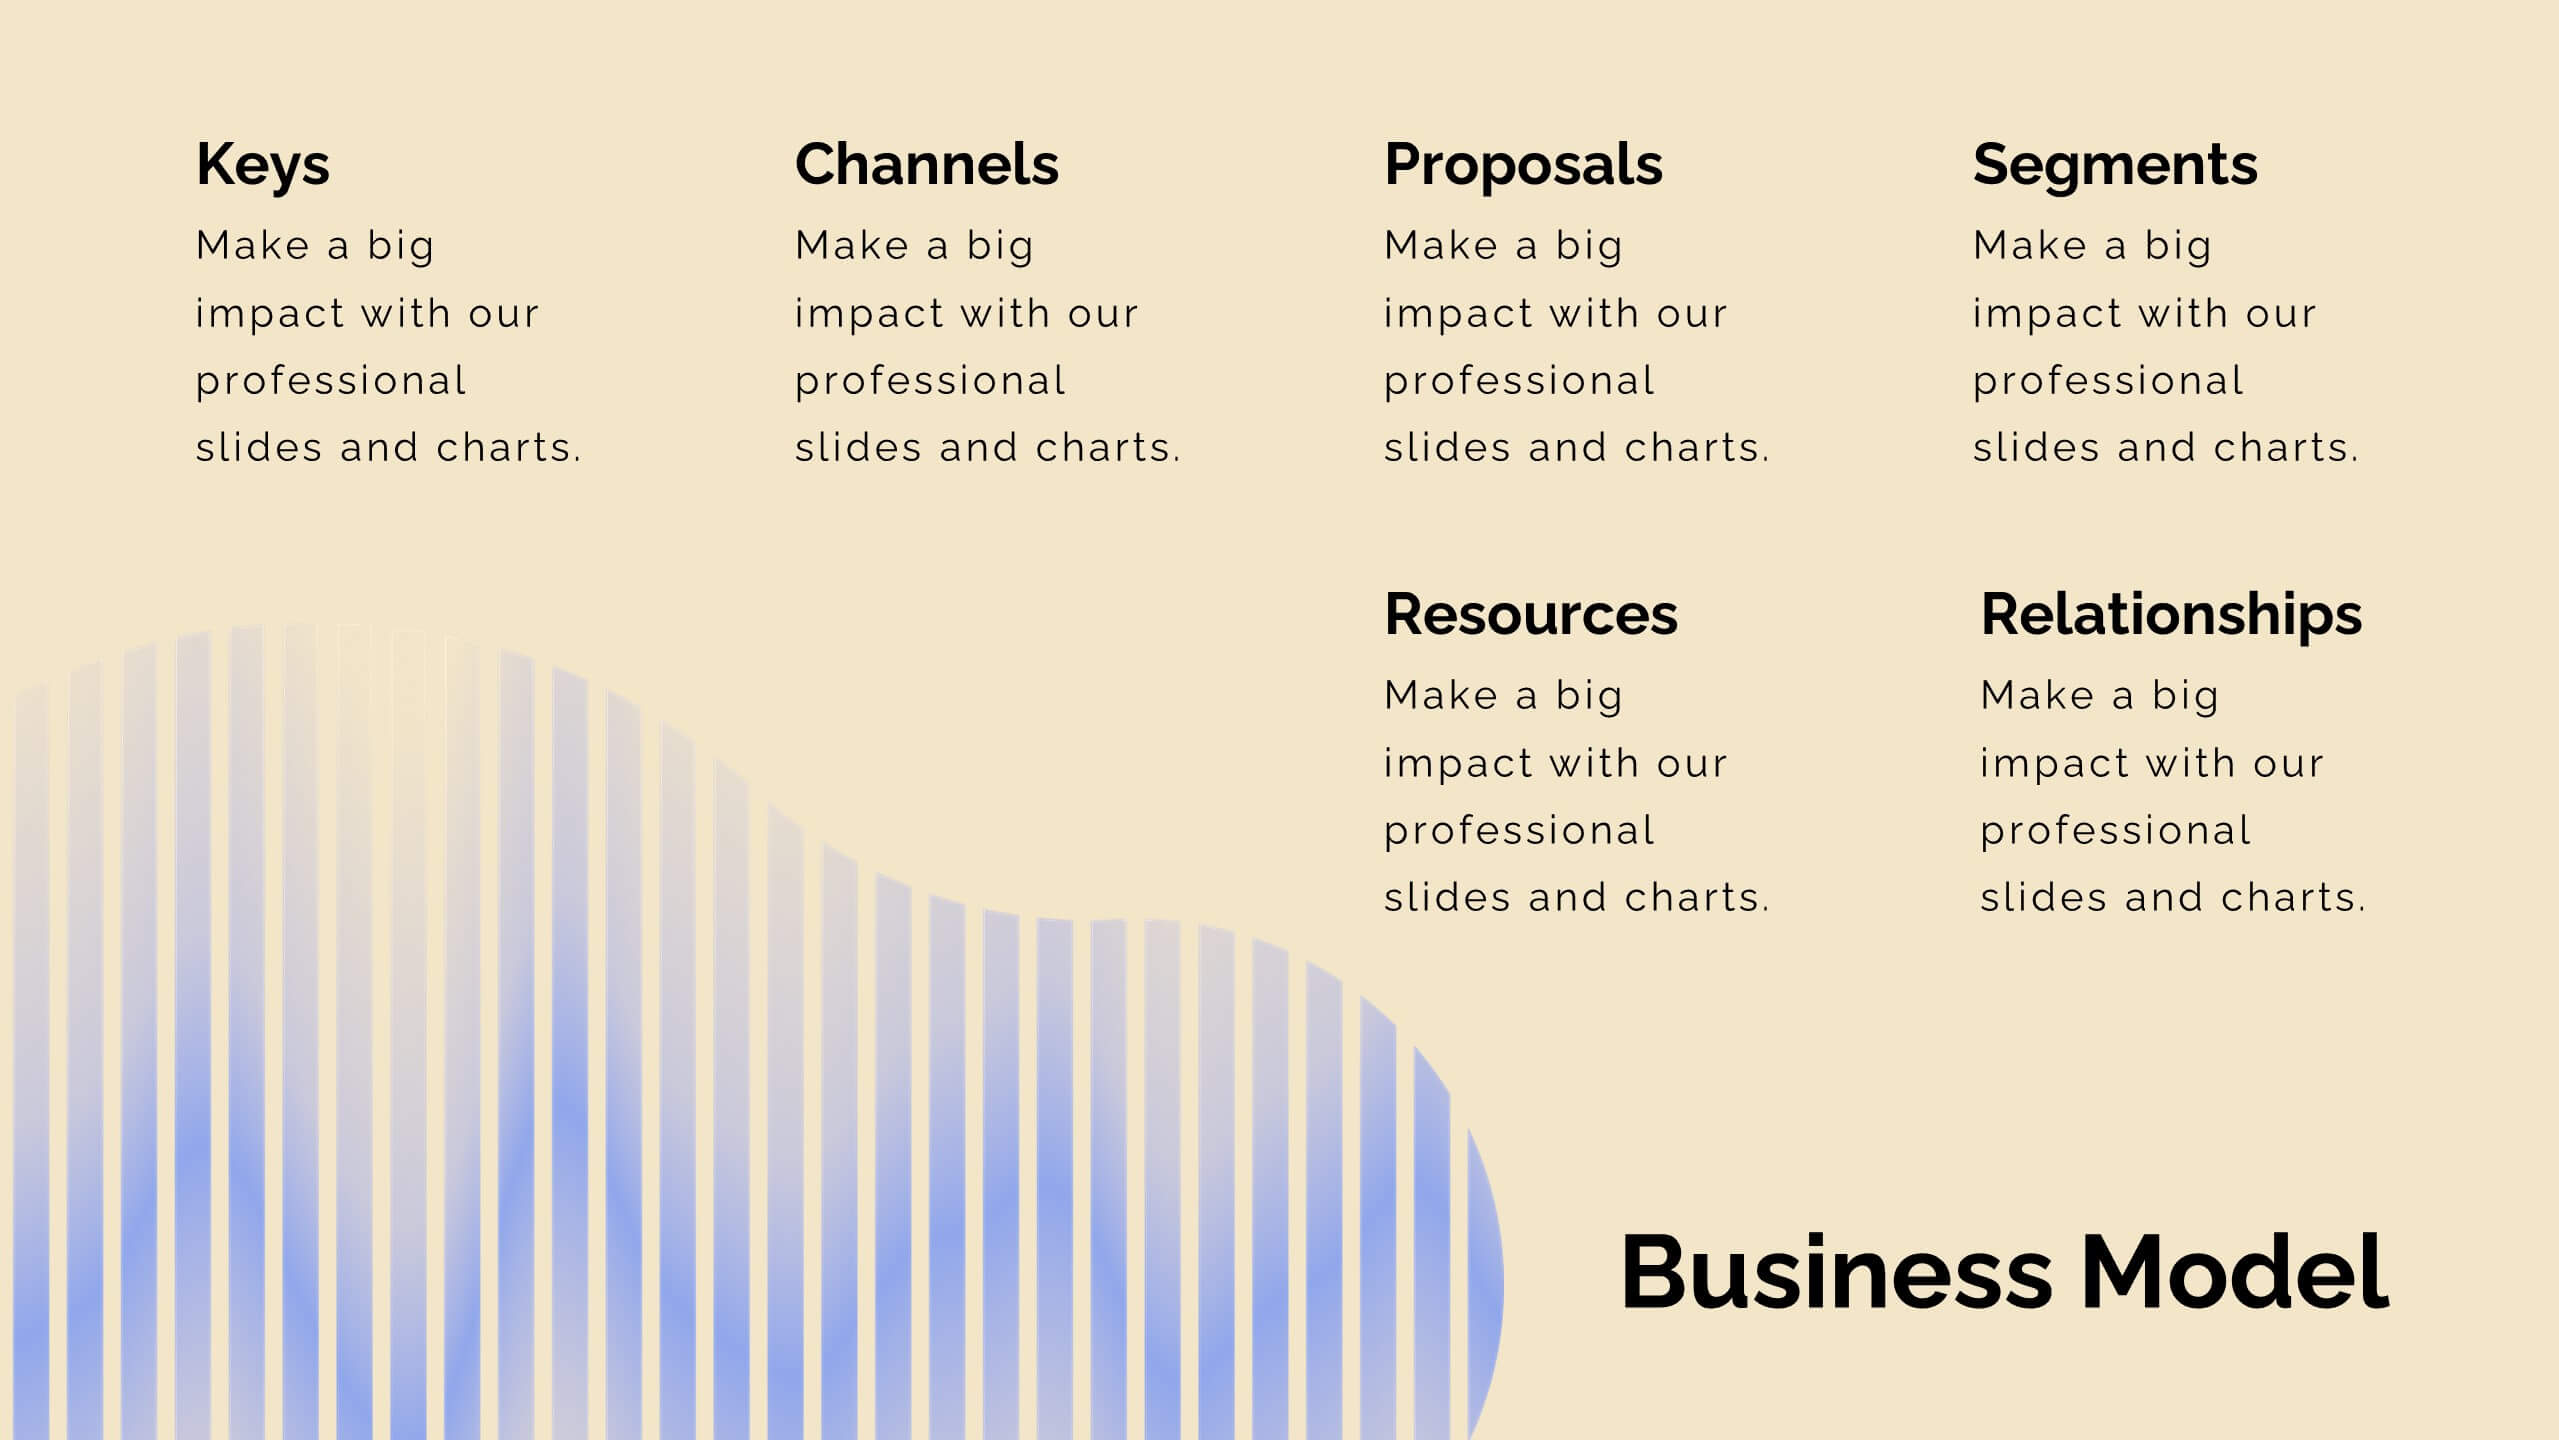
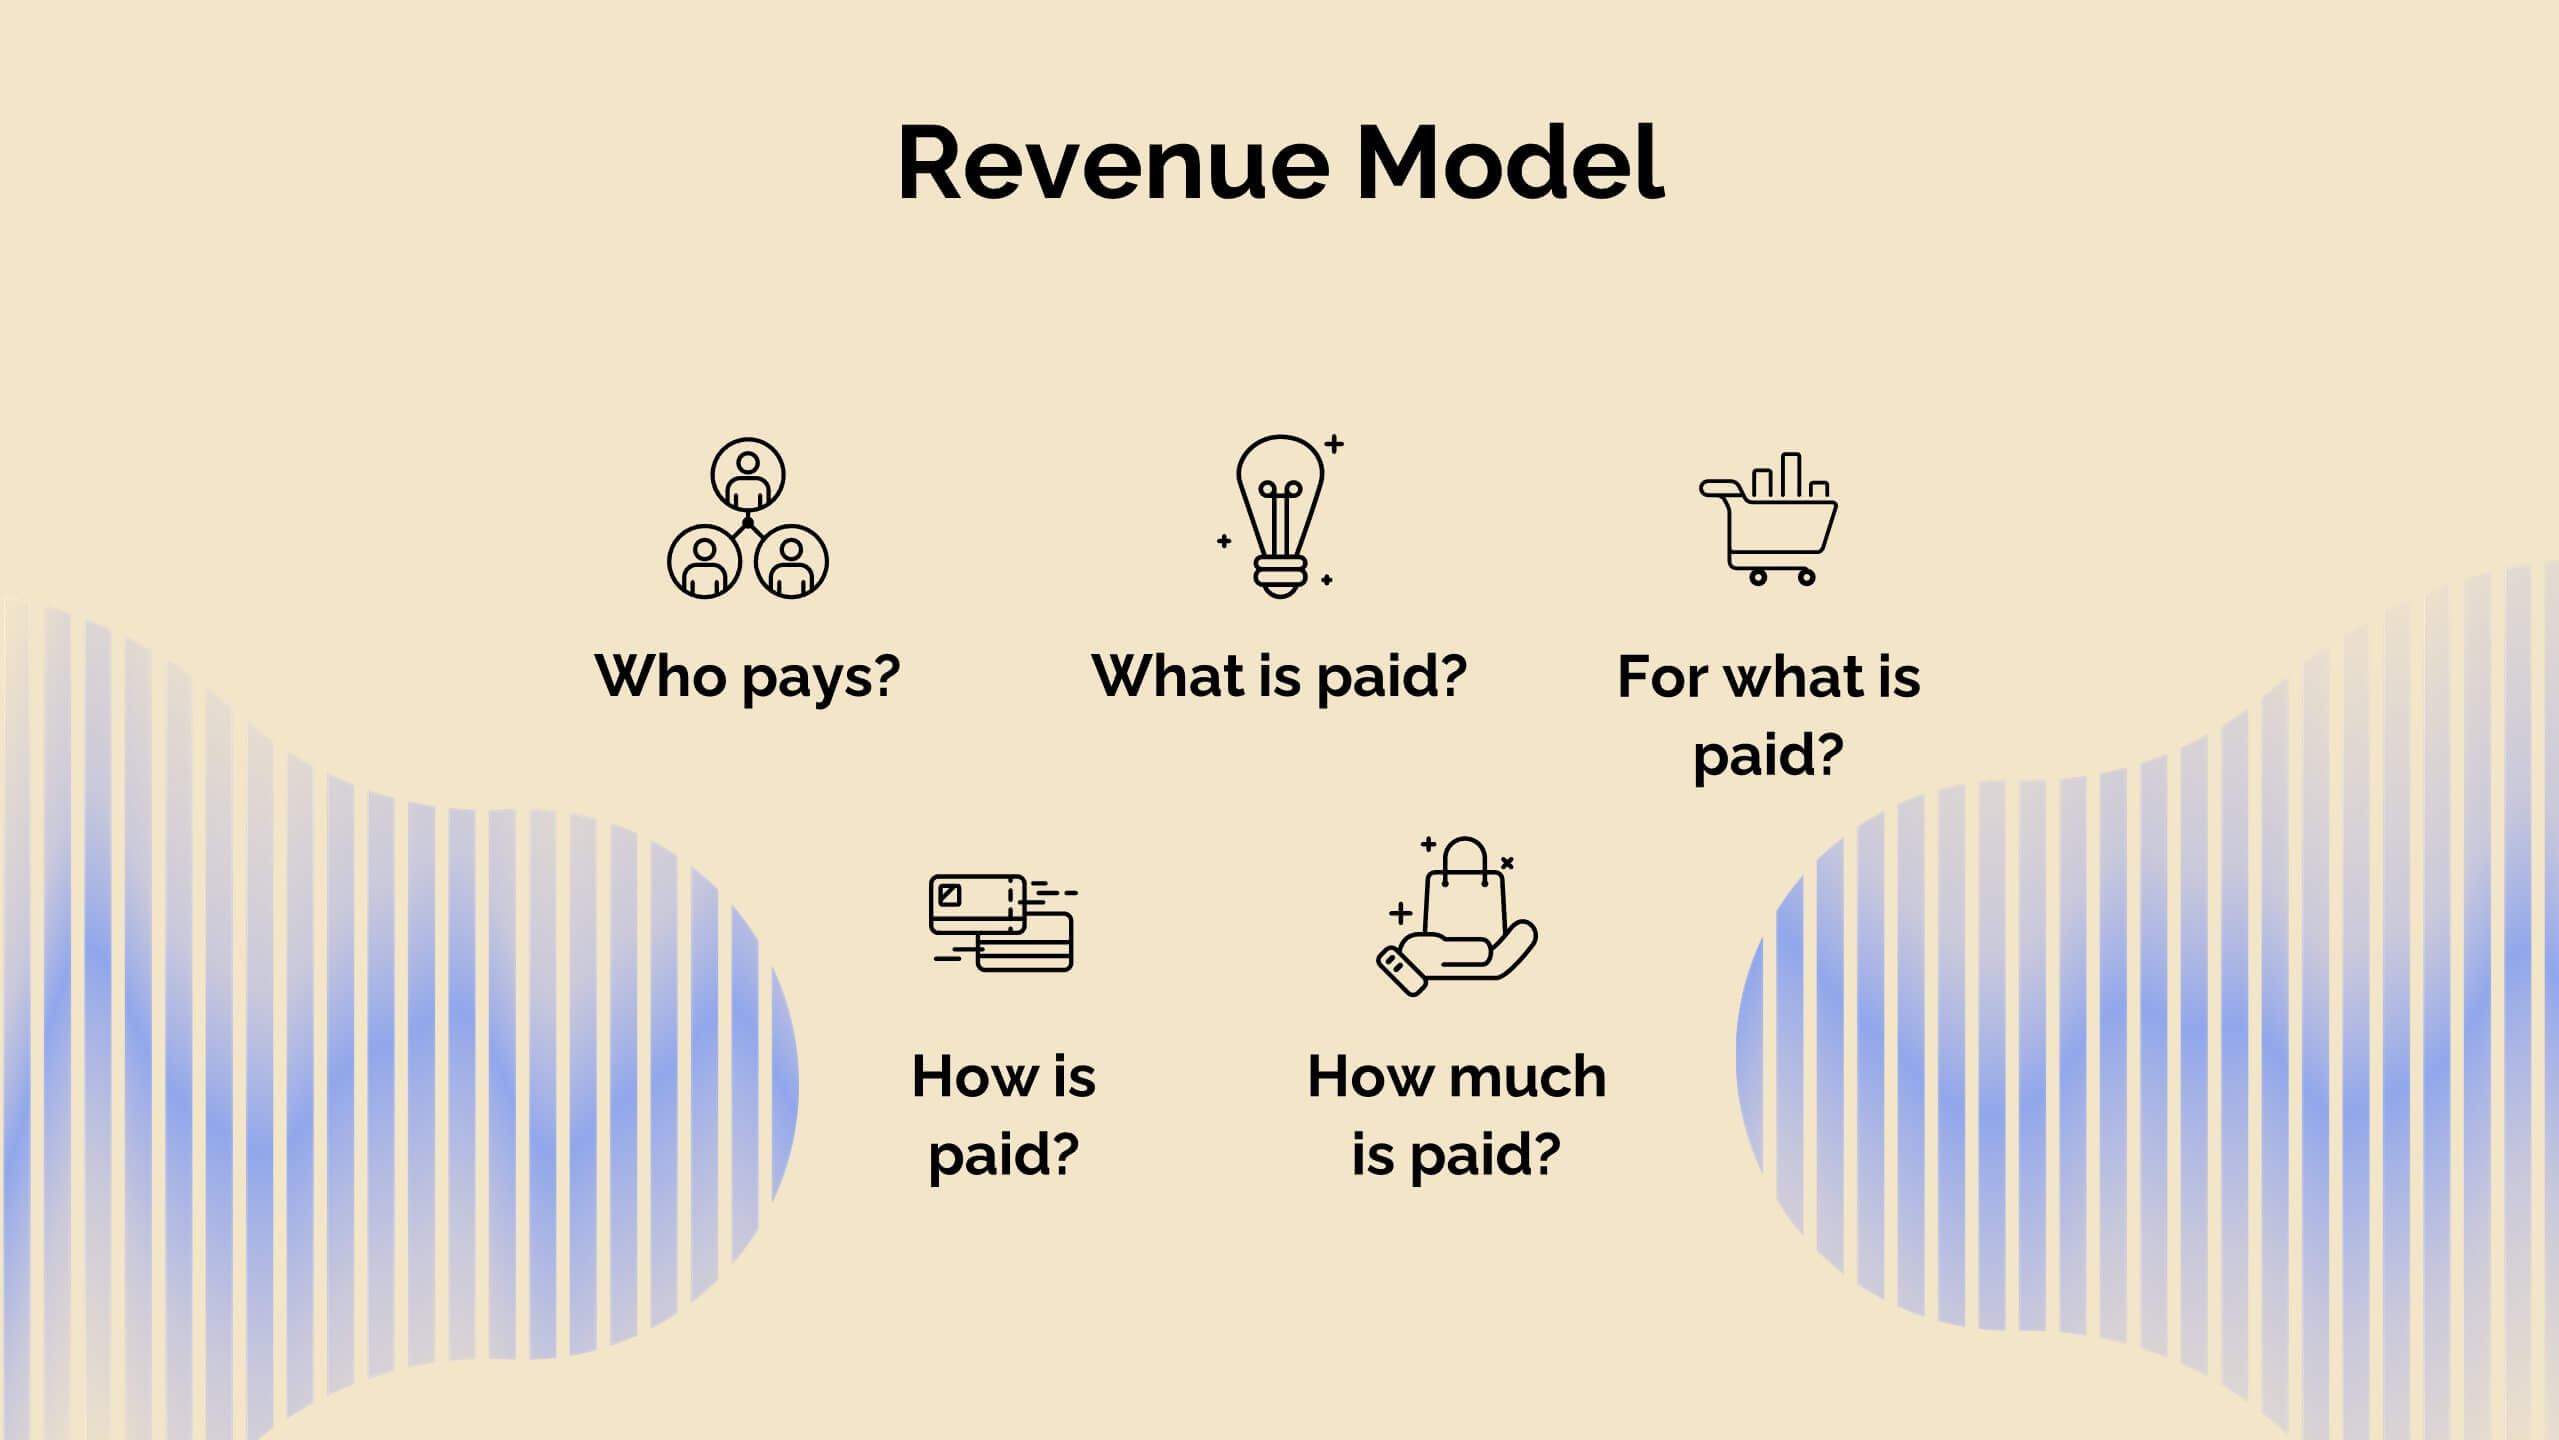
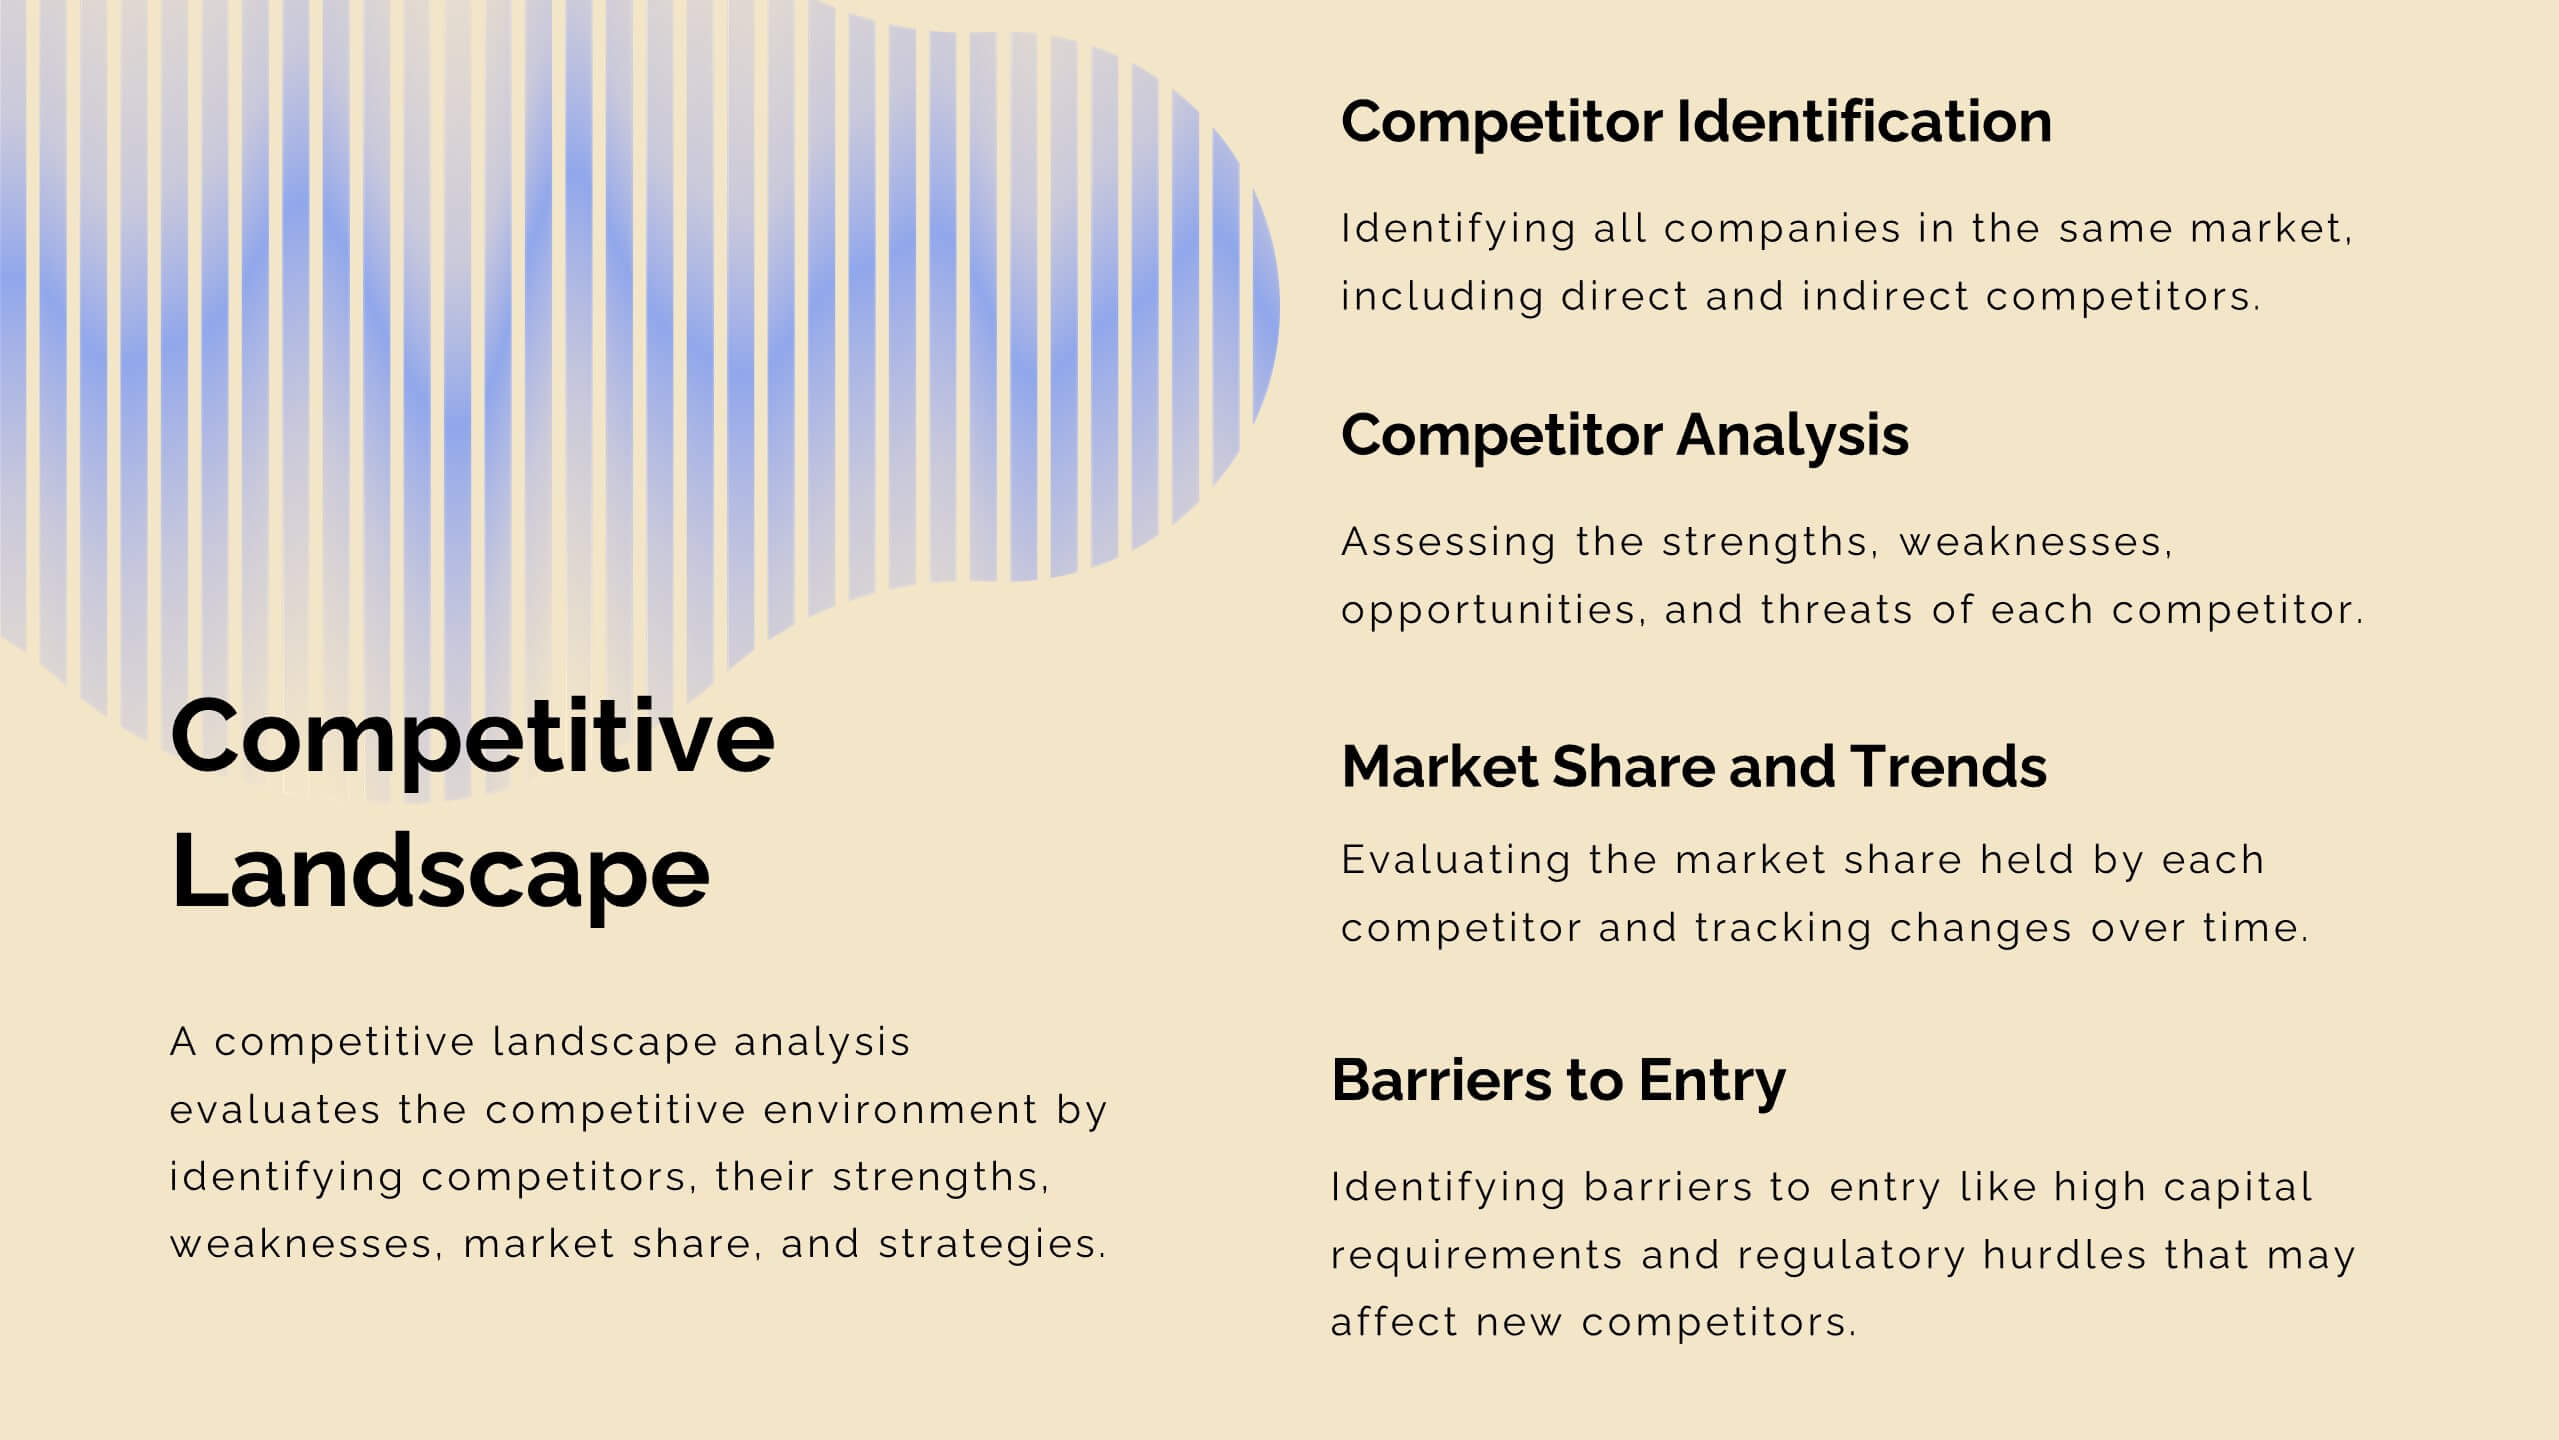
Embark on a seamless journey through your product’s lifecycle with this comprehensive roadmap template! Perfect for illustrating key milestones, business models, and market opportunities, it’s your go-to for clear and engaging presentations. Dive into competitive analysis, showcase your unique selling proposition, and outline your growth projections with style. Compatible with PowerPoint, Keynote, and Google Slides.


22 diapositivas
Vivid Market Research Presentation
Unveil the insights that drive decisions with the Vivid Market Research Presentation template! This sleek and professional template is crafted to help you present complex data in an engaging and easy-to-understand format. Whether you're analyzing market trends, exploring customer behavior, or evaluating competitive landscapes, this template provides a clear structure to convey your findings. It includes sections for research objectives, methodologies, key findings, and recommendations, ensuring you cover every aspect of your market research comprehensively. With a clean design that emphasizes clarity and visual appeal, your audience will stay focused and intrigued throughout the presentation. Perfect for business analysts, marketers, and researchers, the Vivid template is fully customizable and works seamlessly with PowerPoint, Keynote, and Google Slides. Elevate your market research presentations and make your data come to life with Vivid!


5 diapositivas
Easy Dinner Recipes Infographics
Easy Dinner Recipes offer a practical solution for busy individuals or those who are new to cooking. These infographic templates offer a practical resource for meal planning and preparation. Its visually appealing design, clear instructions, and organized layout make it easy to follow and implement. Whether for personal use or as a presentation tool in cooking classes this template simplifies the process of discovering and trying out delicious dinner recipes. Use these to provide a collection of quick and delicious dinner recipes. This is designed to make meal planning easier, providing step-by-step instructions, ingredient lists, and visuals.


20 diapositivas
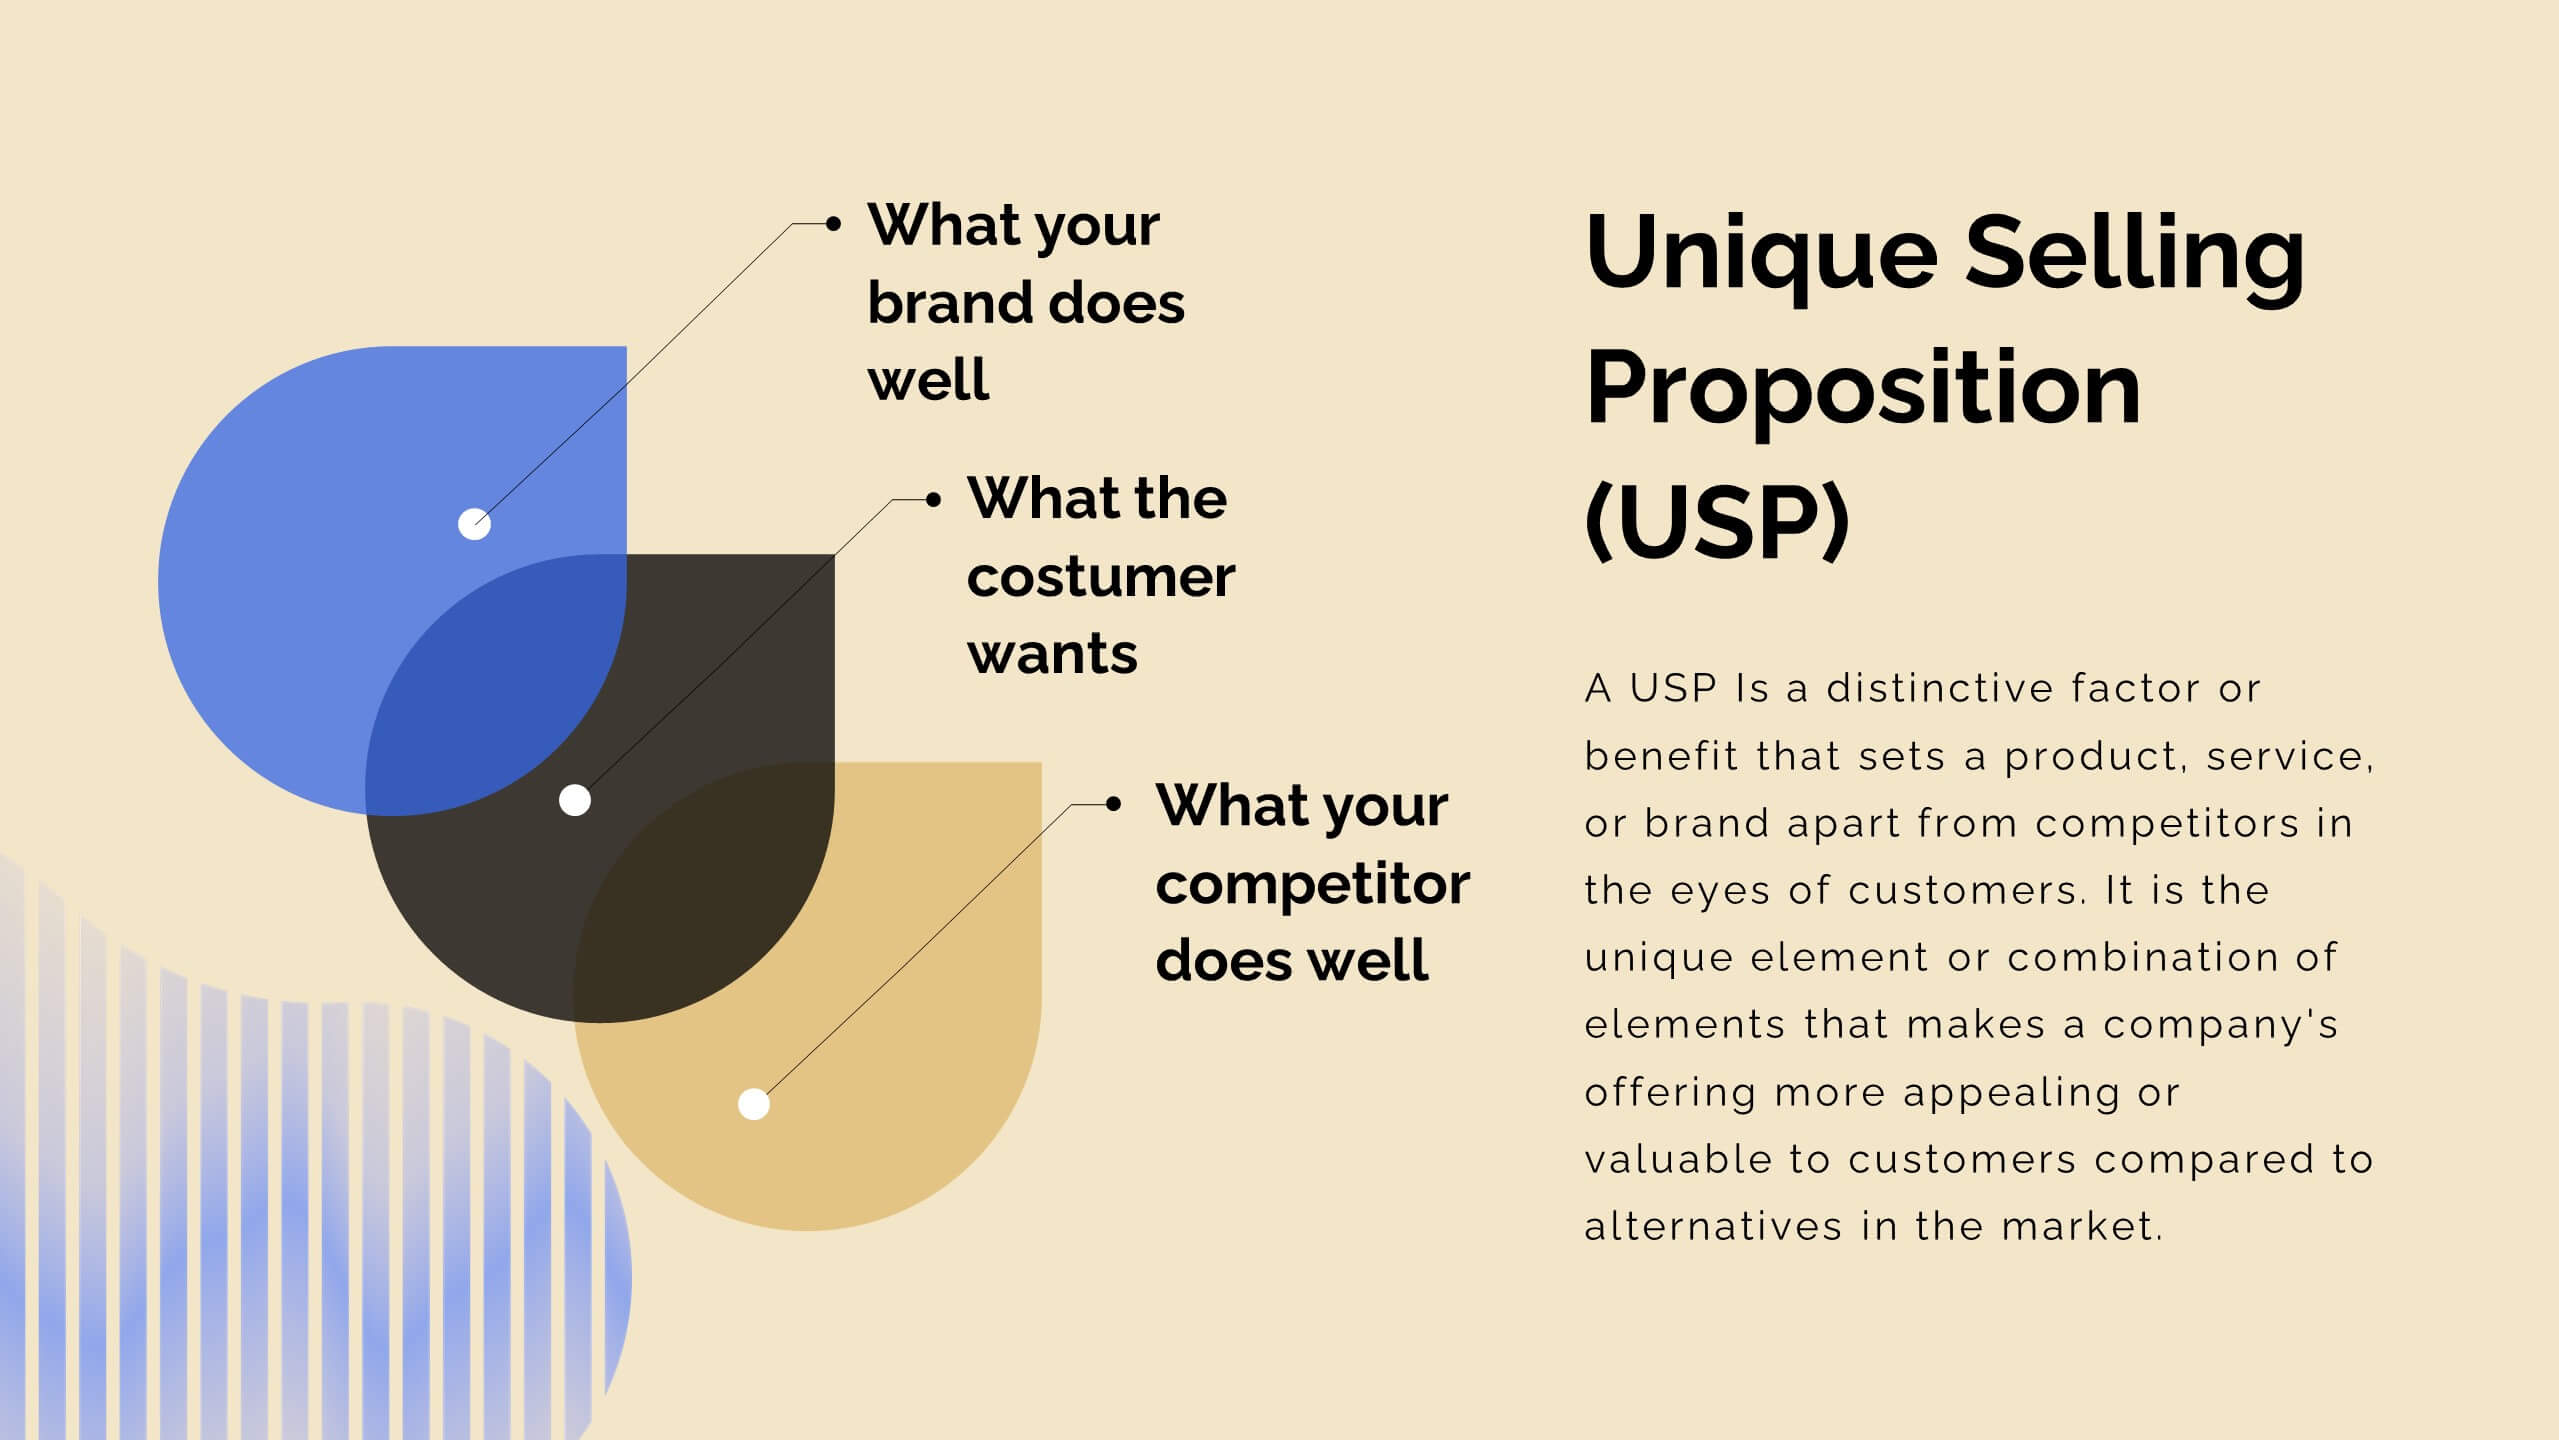
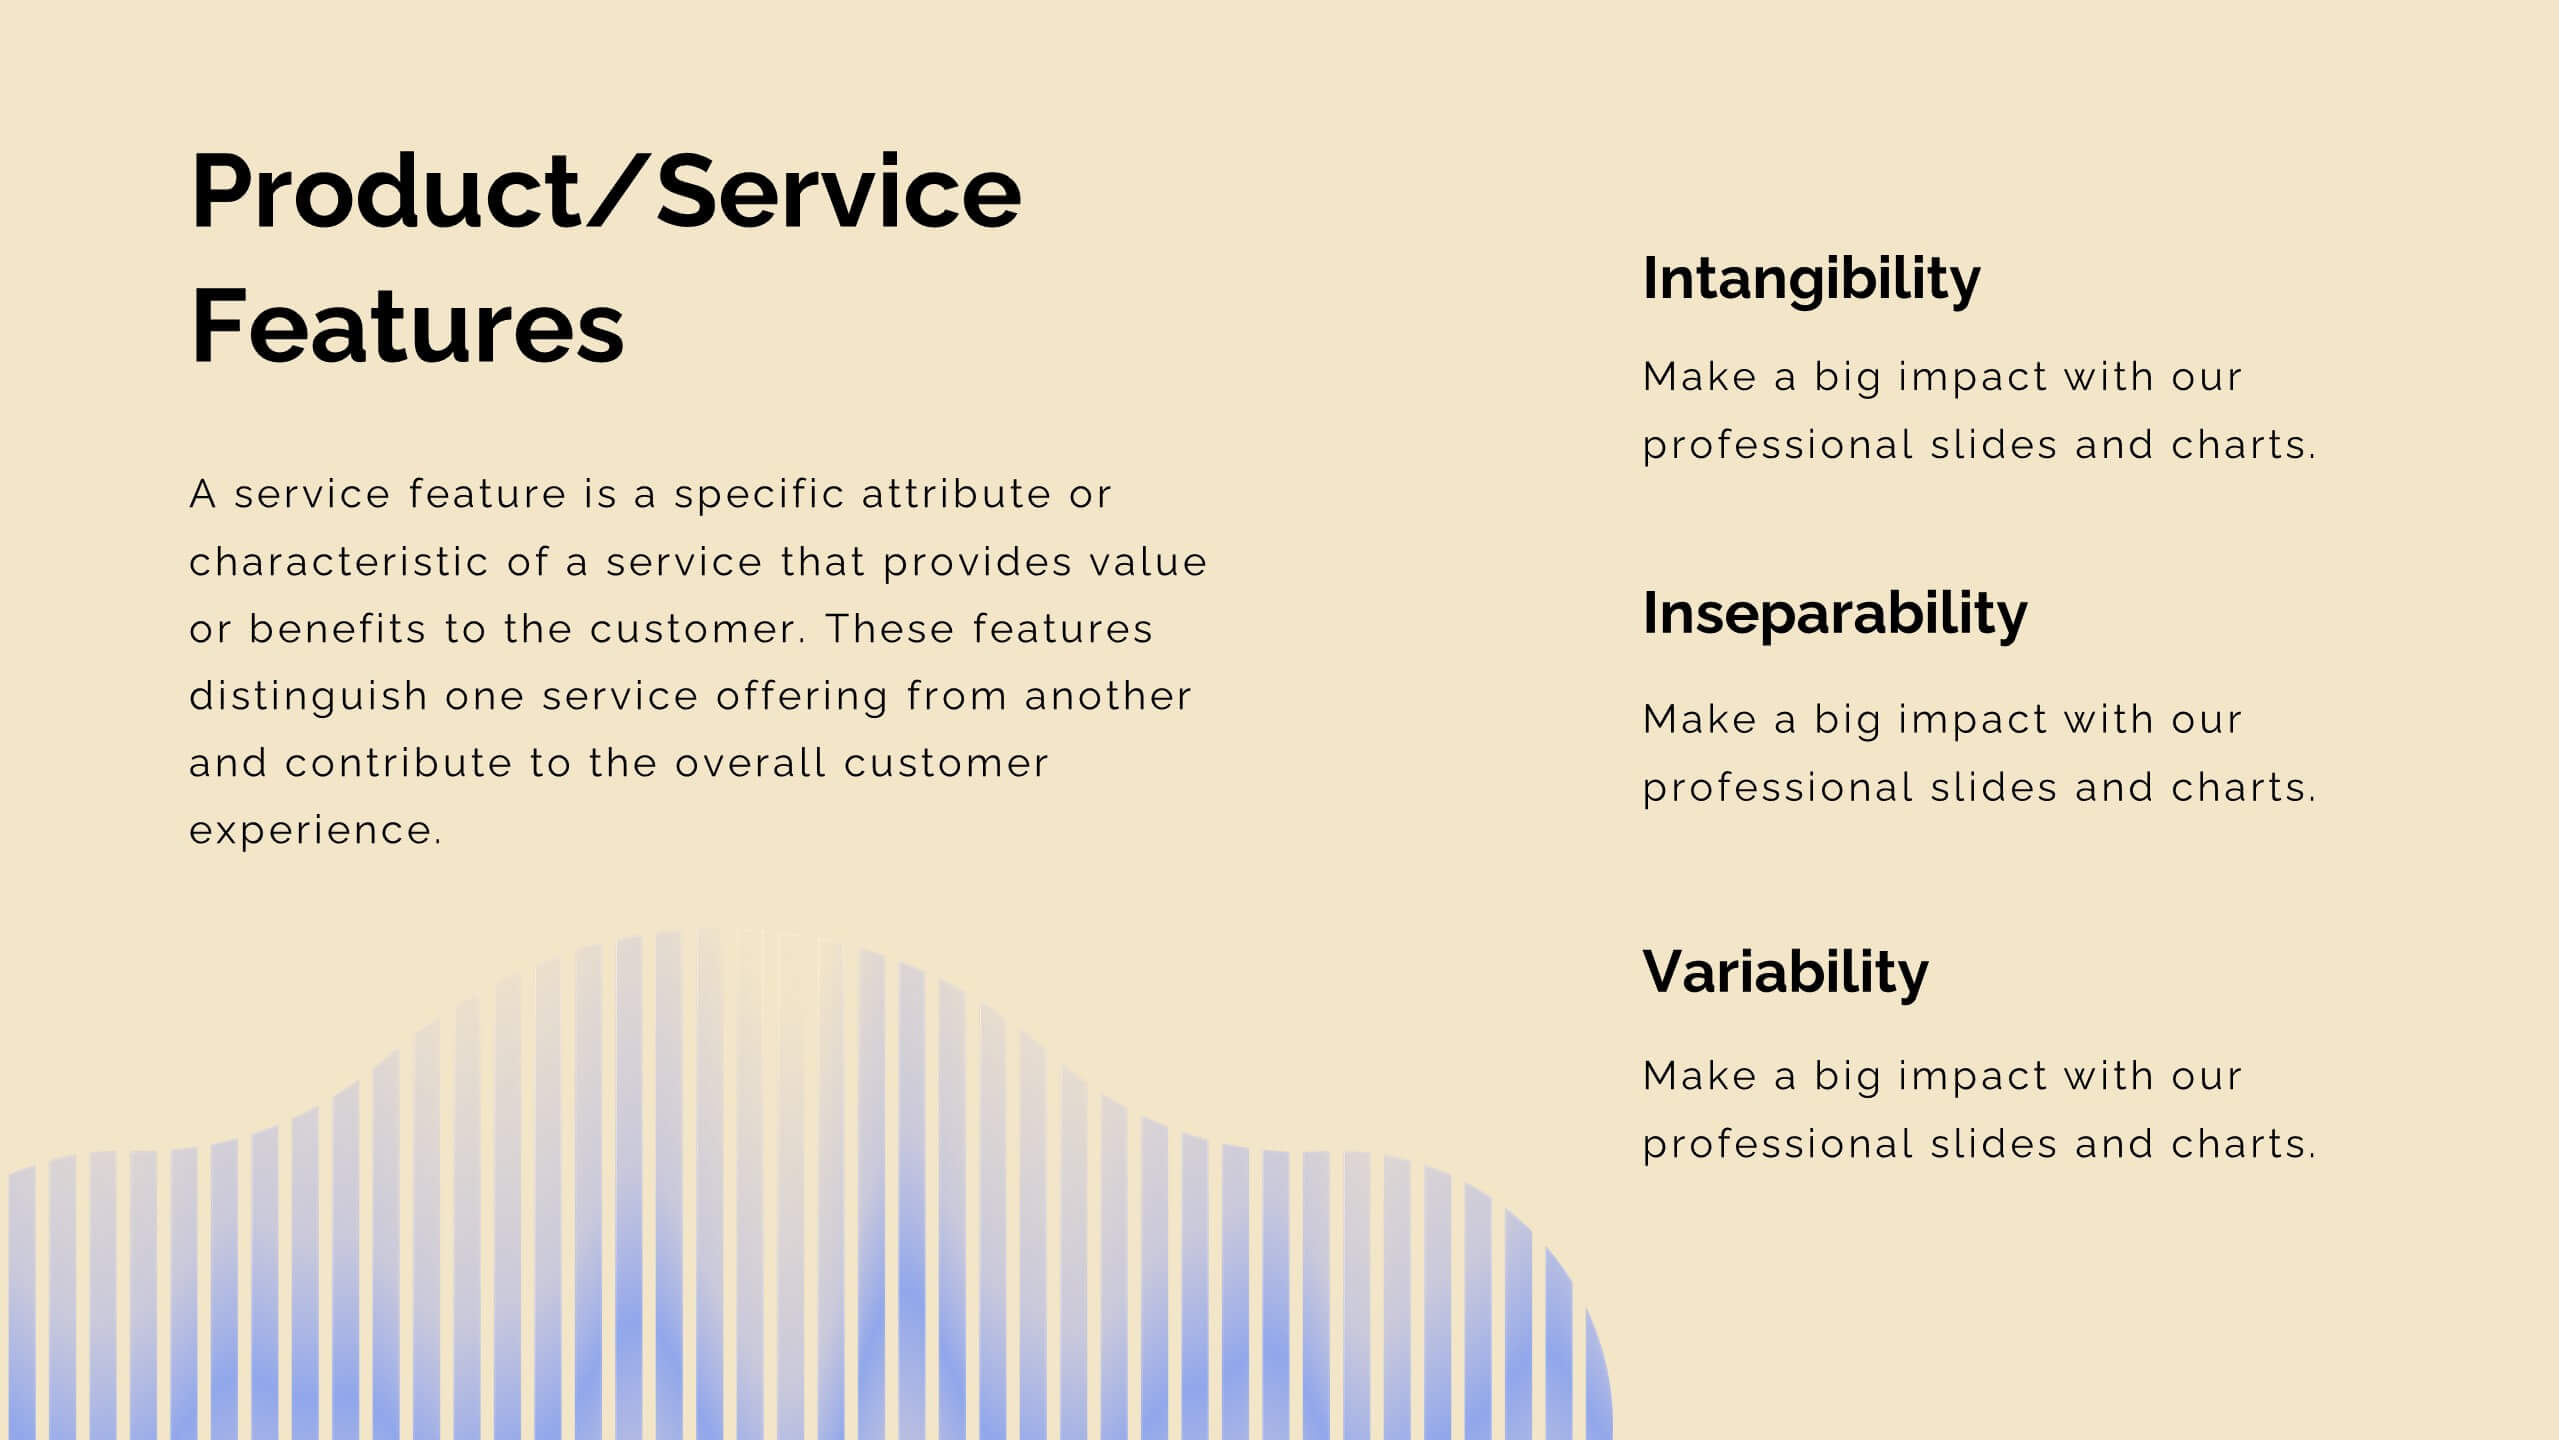
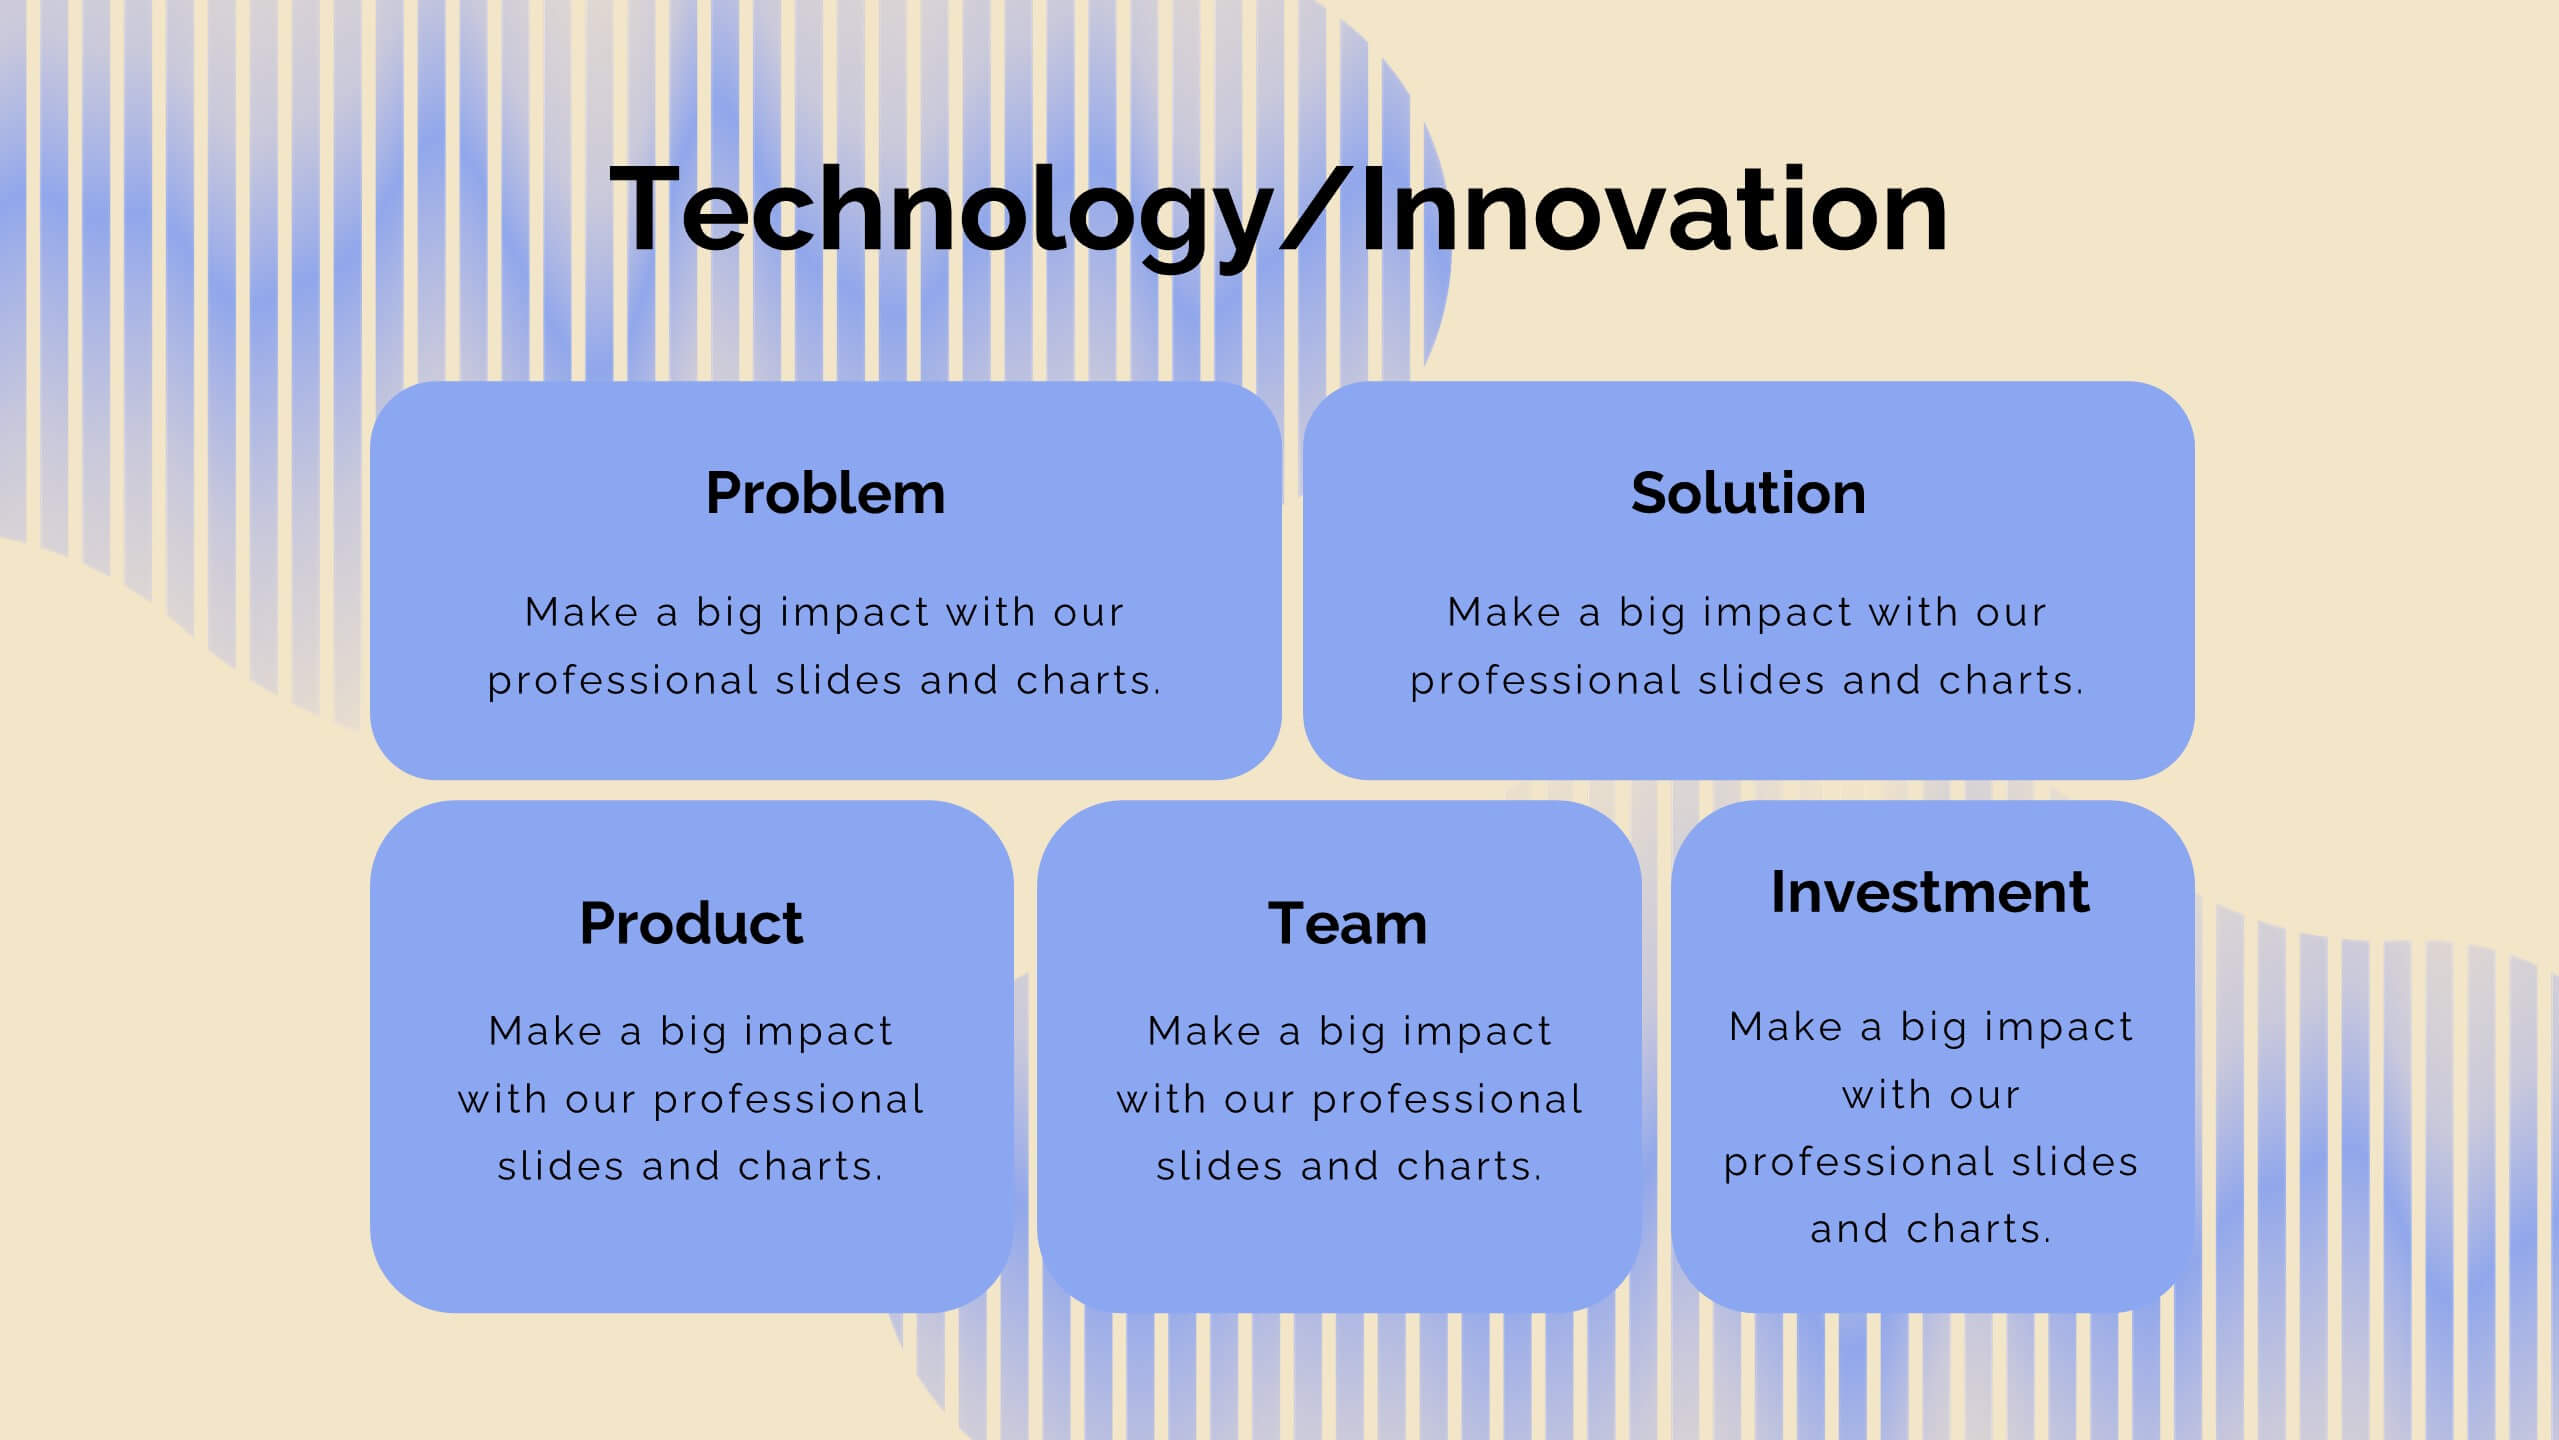
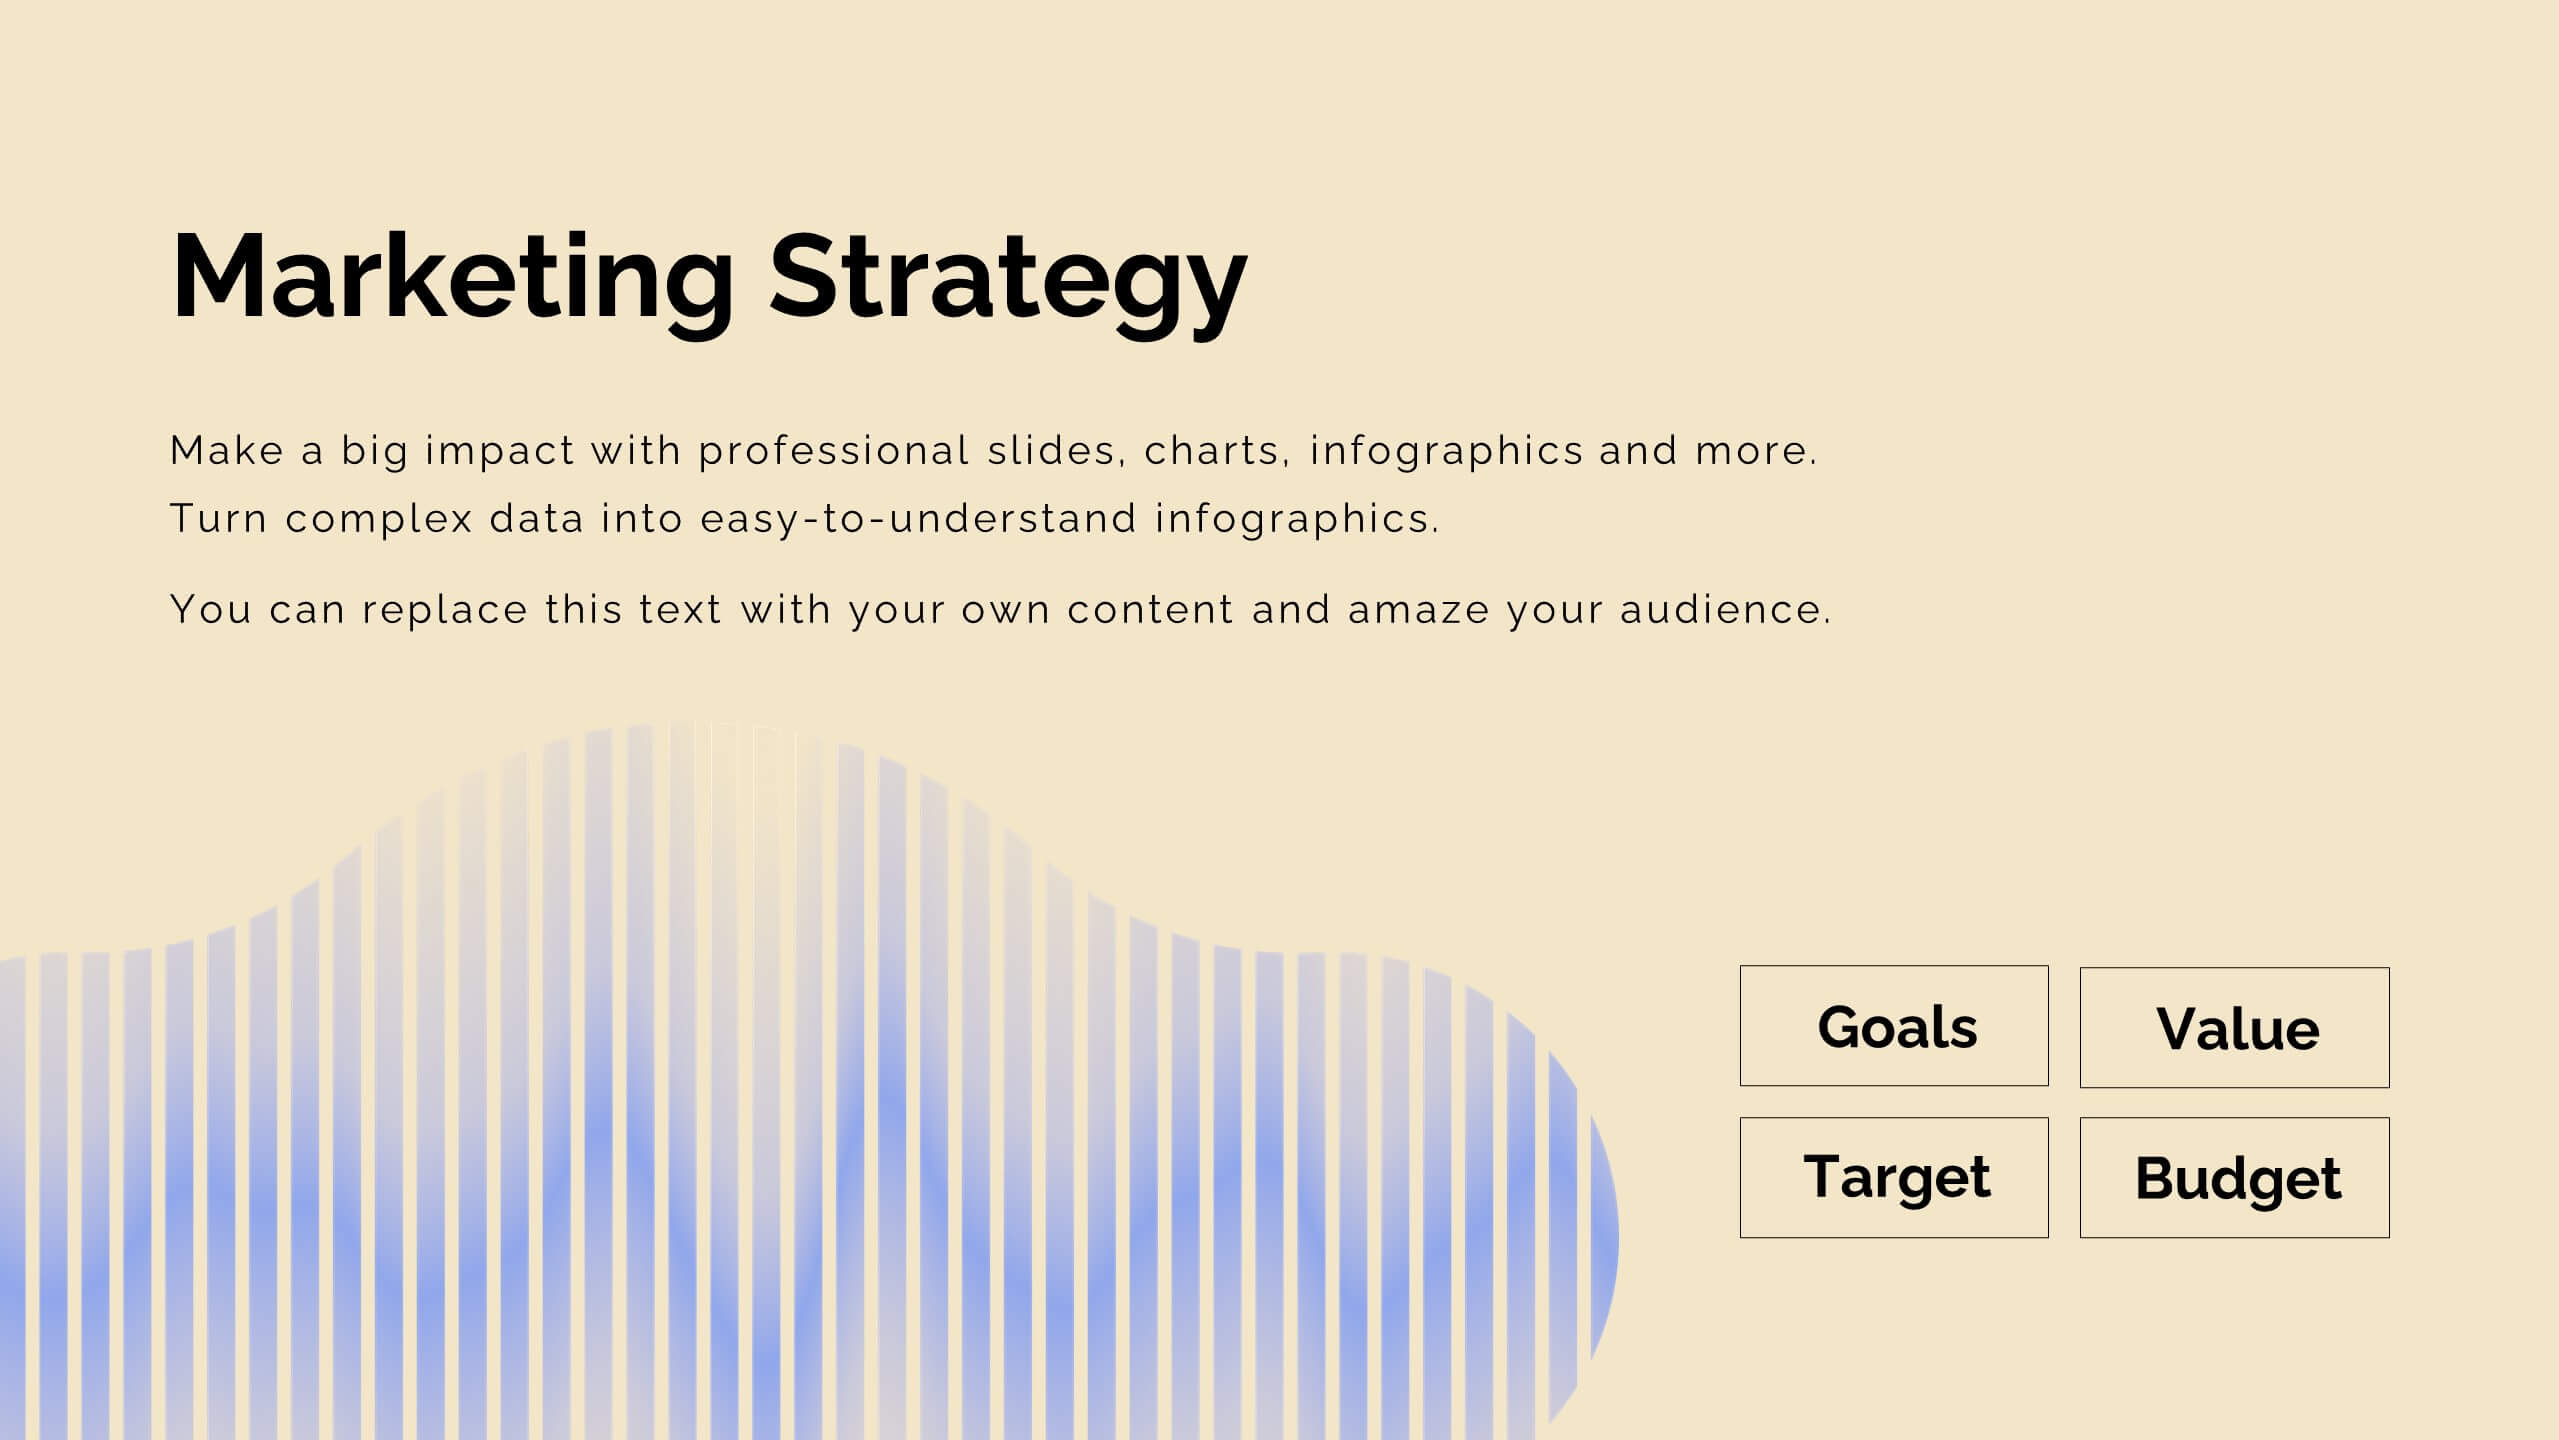
Solstice Product Launch Presentation
Introducing our product launch template! Highlight your product’s features, target audience, and unique selling proposition with a sleek, modern design. Showcase marketing strategies, distribution channels, and competitive landscape effortlessly. Ideal for sales teams and marketers. Compatible with PowerPoint, Keynote, and Google Slides.


6 diapositivas
Population Pyramid Infographic
A population pyramid, also known as an age-gender pyramid, is a graphical representation of the distribution of a population by age and gender. This infographic is a visually captivating presentation designed to illustrate the age and gender distribution of a population. It provides an easy-to-understand representation of the population structure, allowing viewers to grasp demographic patterns at a glance. Present your population data and demographic trends with this template. This enables viewers to grasp demographic patterns quickly and facilitates the key insights about a population's composition and changes over time.


2 diapositivas
Final Gratitude Page in Deck Presentation
The Final Gratitude Page in Deck Presentation is a bold and engaging closing slide, ideal for ending your presentation with personality and professionalism. With its bright orange theme, modern photo frame, and "THANK YOU!" message in clear typography, it leaves a lasting impression on your audience. Perfect for webinars, educational talks, or business presentations. Fully customizable in PowerPoint, Keynote, and Google Slides.