


Características


¿Tienes alguna pregunta?
Recomendar


6 diapositivas
Strategy to Overcome Challenges Presentation
Get ready to chart a winning path with this dynamic visual roadmap! These slides help simplify complex strategies into clear steps to tackle business challenges head-on. Perfect for team alignment, leadership planning, and problem-solving workflows. Fully compatible with PowerPoint, Keynote, and Google Slides for flexible, professional presentations.


16 diapositivas
SEO Research Analysis Presentation
Designed with meticulous attention to detail, this presentation template offers an extensive overview of SEO Analysis Research, perfect for specialists eager to explore the depths of search engine optimization. The initial slide establishes a solid foundation for comprehensive analysis. Following, the 'About' segment delivers a brief yet informative look at the organization's prowess and experience in the realm of SEO. The 'Our Teamwork' slide introduces the team behind the SEO success, showcasing the individuals and their roles. Moving on to 'Strategy,' the template allows for a detailed exposition of the approach and methodologies applied to enhance online visibility. Key metrics are brought to the forefront in a monthly overview, providing insights into traffic sources, content performance, and keyword rankings. The 'SEO Report' highlights significant analytics, such as searches and sign-up rates, emphasizing the impact of the SEO efforts. Complete the presentation with a cordial 'Thank You' to the audience and a 'Credits' slide for resource attribution, ensuring transparency and professionalism. This template is ideal for delivering powerful insights into SEO practices and outcomes.


22 diapositivas
Garnet Qualitative Research Findings Presentation
This qualitative research findings presentation template provides a structured layout for sharing in-depth insights from your study. It includes sections for objectives, methodology, data analysis, key findings, and future directions, offering a clear flow for presenting research in a professional format. Perfect for researchers, it’s fully customizable in PowerPoint, Keynote, and Google Slides.


5 diapositivas
Space Science Infographics
Space science, also known as astronomy, is the scientific study of celestial objects, phenomena, and the physical universe beyond Earth. These infographic templates explore various aspects of space science and astronomy. They are designed to present complex concepts and data in a visually engaging format, making it accessible to a wide range of audiences. These infographics incorporate stunning cosmic illustrations and visuals to represent celestial bodies, space phenomena, and scientific concepts related to space science. They covers a range of key topics in space science, such as black holes, the solar system, space exploration, and more.


7 diapositivas
Smile Rating Importance Infographic Presentation
Smile Rating is a metric used in customer service to measure the level of customer satisfaction or happiness with a particular experience, interaction or service. This template will help you make a vibrant, friendly and original presentation. This smile rating infographic is easy to use and customize. It is fully editable and the layout allows you to personalize it. This template can be edited in PowerPoint, Keynote, and Google Slides. This is perfect for business presentations, strategic planning, idea-sharing sessions or just a fun way to share your thoughts on this design topic.


20 diapositivas
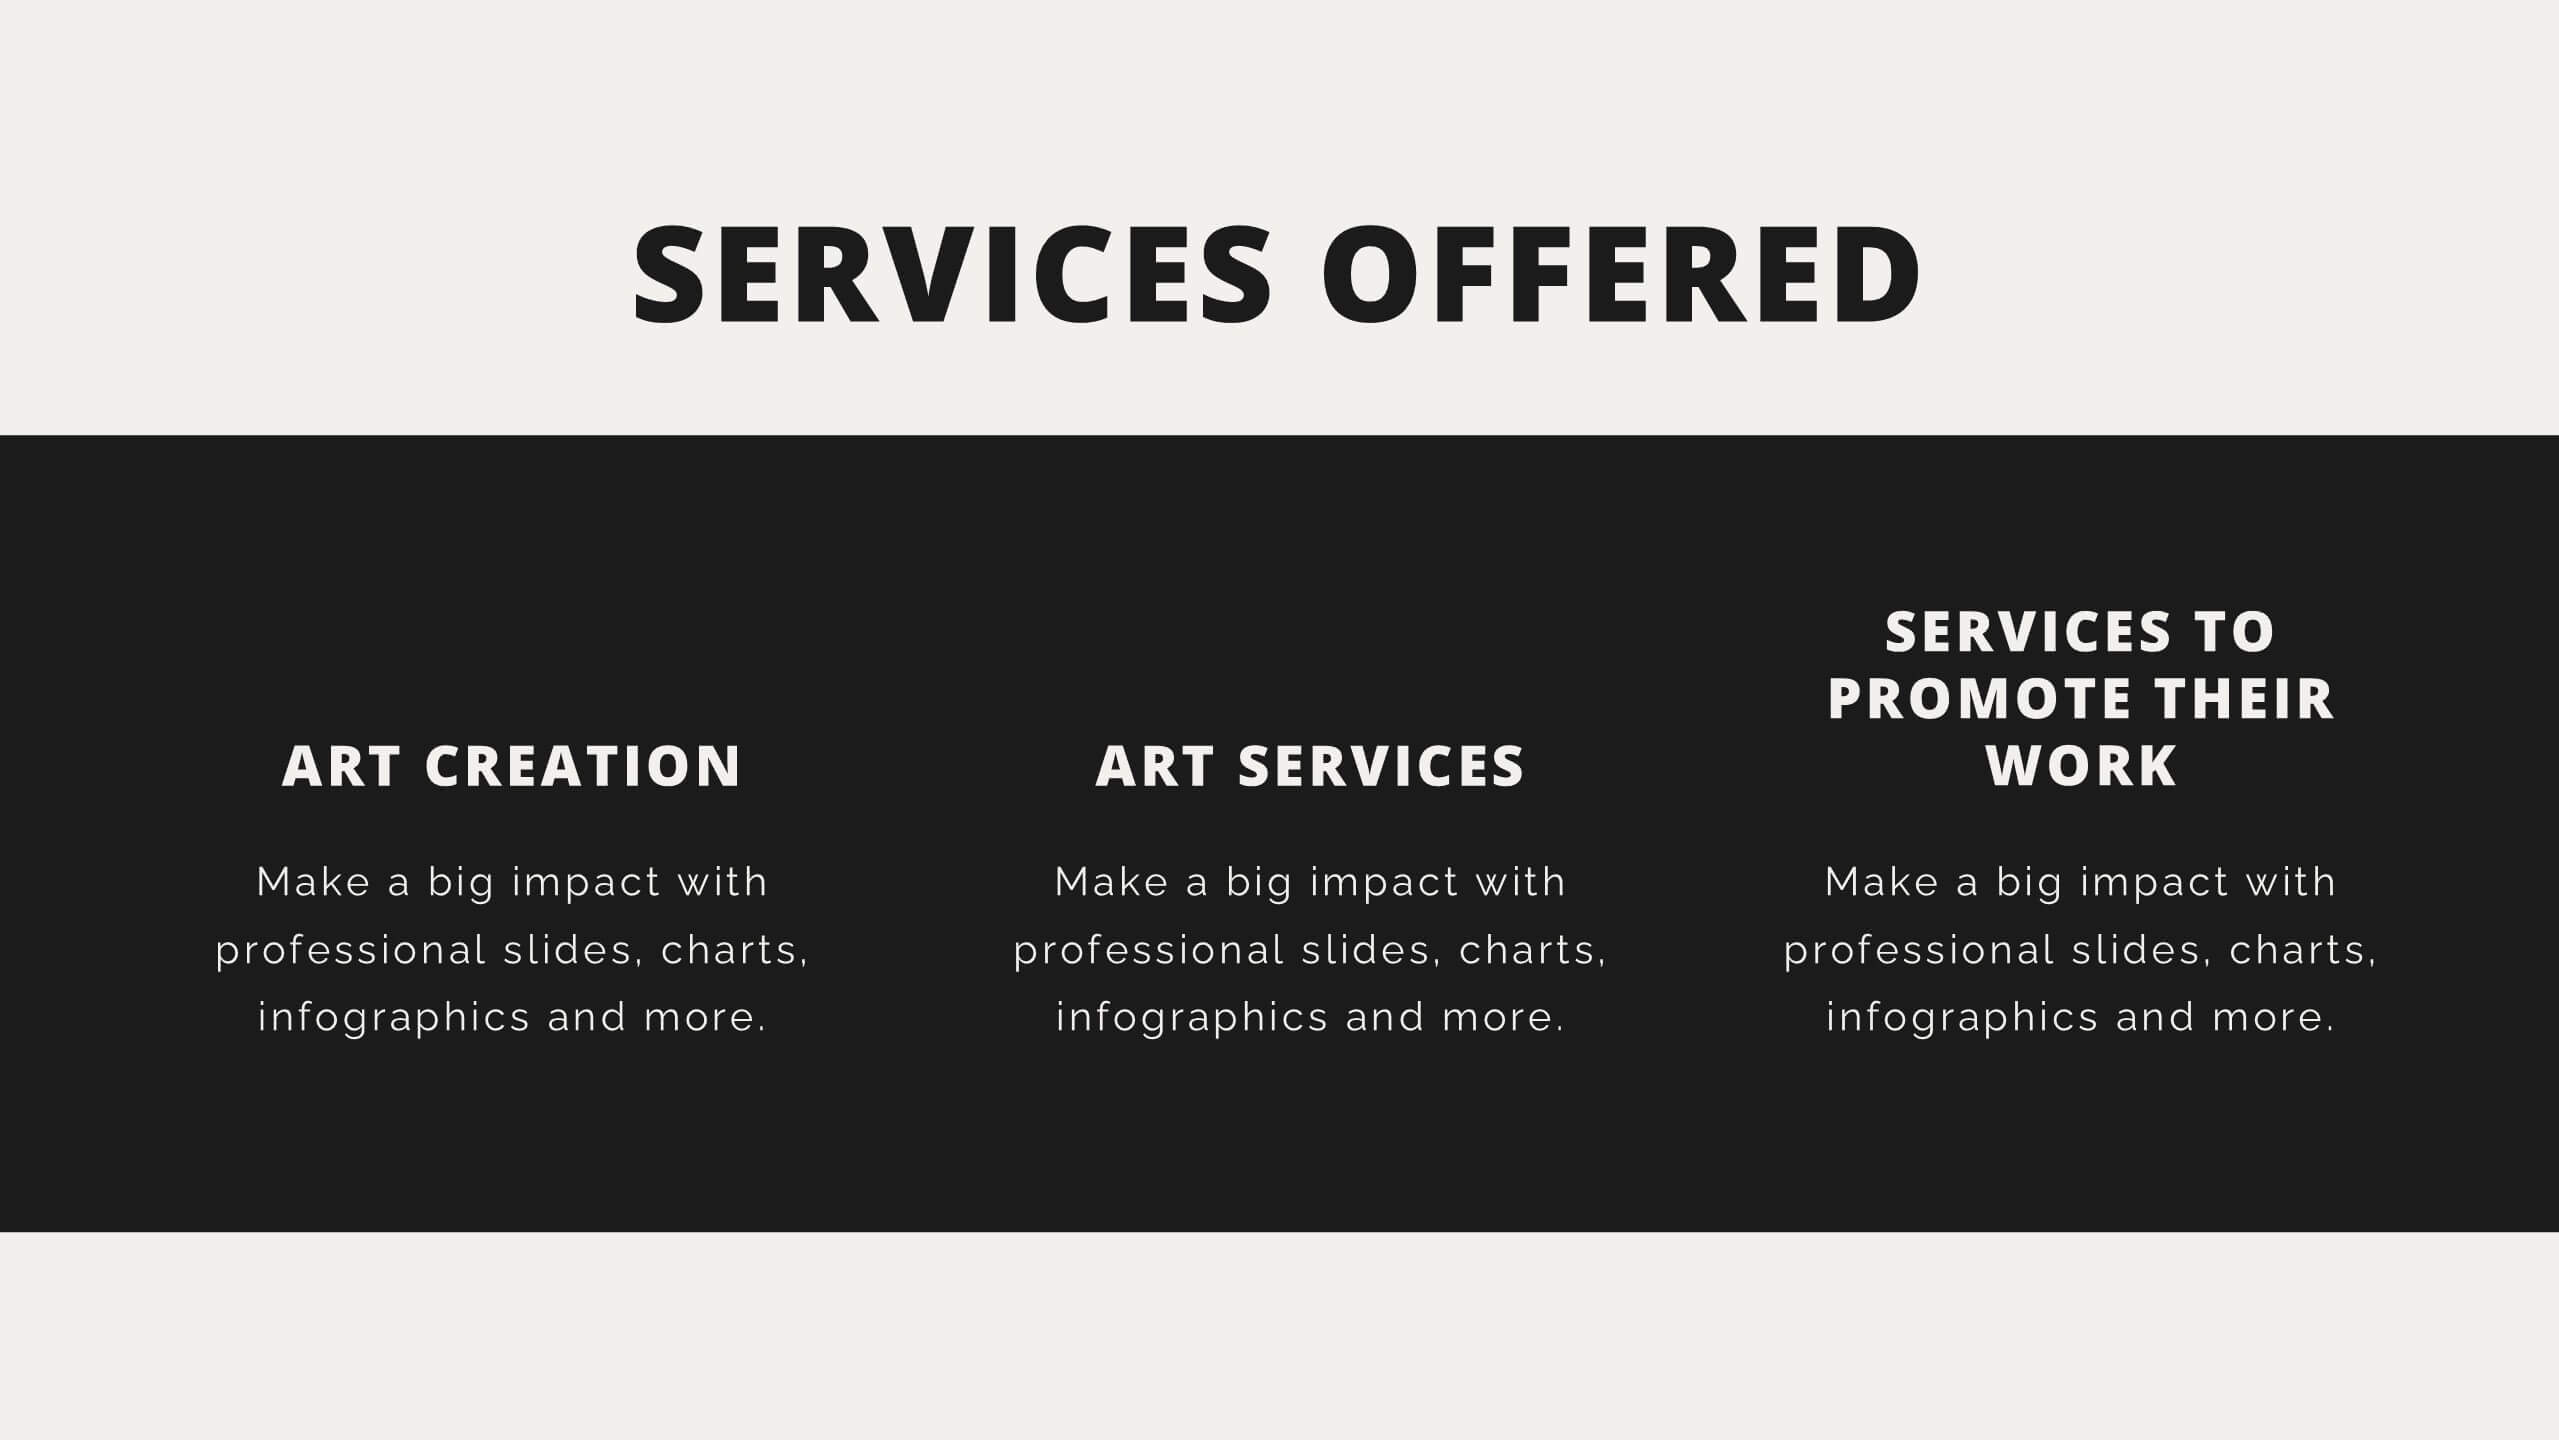
Vesta Photography Portfolio Presentation
Showcase your photography skills with this elegant portfolio template, designed to highlight featured projects, creative process, client testimonials, and services offered. With sections for awards, pricing, and social media links, this template captures your unique style and professionalism. Compatible with PowerPoint, Keynote, and Google Slides for easy customization.


5 diapositivas
Market Positioning and SWOT of Rivals Presentation
Clearly define your competitive edge with the Market Positioning and SWOT of Rivals Presentation. This layout helps you showcase strengths, weaknesses, opportunities, and threats across key market players using a unique interlinked format. Easy to edit in Canva, PowerPoint, Keynote, and Google Slides—perfect for strategic business overviews.


4 diapositivas
Medical Overview and Clinical Solutions Presentation
Present medical insights with clarity using the Medical Overview and Clinical Solutions Presentation. This slide features a segmented pill bottle graphic paired with three labeled sections (A, B, C), ideal for explaining treatments, protocols, or phased approaches. Fully editable in Canva, PowerPoint, Keynote, and Google Slides for seamless customization.
8 diapositivas
Performance Tracking Using OKRs Presentation
Track success effectively with the Performance Tracking Using OKRs presentation. This sleek infinity loop design showcases key metrics across People, Products, and Processes, making it ideal for business performance reviews, goal alignment, and strategic planning. Fully editable and compatible with PowerPoint, Keynote, and Google Slides for seamless customization.


21 diapositivas
Veridia Academic Research Report Presentation
Present your academic research findings with confidence using this sleek and modern presentation template. Covering essential sections such as research objectives, data analysis, key findings, and recommendations, it provides a structured approach to showcasing your study. Perfect for students and professionals. Compatible with PowerPoint, Keynote, and Google Slides for seamless customization.


4 diapositivas
Infrastructure and Construction Industry Presentation
Showcase key developments in the Infrastructure and Construction Industry with this visually structured template. Ideal for project managers, urban planners, and engineers, it highlights construction phases, investment data, and industry insights. Fully customizable and compatible with PowerPoint, Keynote, and Google Slides for seamless integration into your professional presentations.


6 diapositivas
Agile Delivery Framework for Projects Presentation
Visualize agile project phases with this spiral delivery framework slide. Ideal for project managers and scrum teams to outline each step in a continuous delivery process. Features six clearly labeled stages, icons, and bold colors. Fully editable in PowerPoint, Keynote, and Google Slides for clear, structured agile workflow presentations.


5 diapositivas
Team and Client Feedback Collection Strategy
Gather actionable insights with the Team and Client Feedback Collection Strategy Presentation. This slide layout uses a balanced circular and rating-star design to showcase four core feedback sources—ideal for presenting survey outcomes, satisfaction metrics, and review strategies. Fully editable in PowerPoint, Keynote, and Google Slides.


8 diapositivas
Project Execution Next Steps
Break down your implementation plan with this visually engaging 3D layered funnel infographic. Ideal for showcasing four key stages in project delivery, each step is color-coded and paired with icons and descriptive text. Great for status updates, strategy meetings, or team briefings. Fully customizable in PowerPoint, Keynote, and Google Slides.


5 diapositivas
Strengths, Weaknesses, Opportunities & Threats Presentation
Visualize your SWOT analysis with clarity using the Strengths, Weaknesses, Opportunities & Threats Presentation. This editable puzzle-style slide makes it easy to present key insights and strategic positioning in a visually engaging format. Compatible with PowerPoint, Canva, and Google Slides for seamless customization and professional business planning.


19 diapositivas
Kinetic Sales Forecast Presentation
Forecast your sales with style using this vibrant template! Perfect for detailing company overview, sales process, team, and strategy. Includes sections for case studies, pricing, and future opportunities. Ideal for sales teams to impress stakeholders. Compatible with PowerPoint, Keynote, and Google Slides.


6 diapositivas
Business Plan Steps Infographic
A business plan is a written document that outlines the goals, strategies, and financial projections of a business. This infographic template is designed to serves as a roadmap for the organization, providing a comprehensive overview of how the business will operate and achieve its objectives. This infographic outlines the key steps involved in creating a comprehensive business plan. The template provides tips on presenting the business plan in a professional and visually appealing manner. It incorporates visuals to support key points, and organizing the document with headings, subheadings, and bullet points for readability.