


Características


¿Tienes alguna pregunta?
Recomendar
23 diapositivas
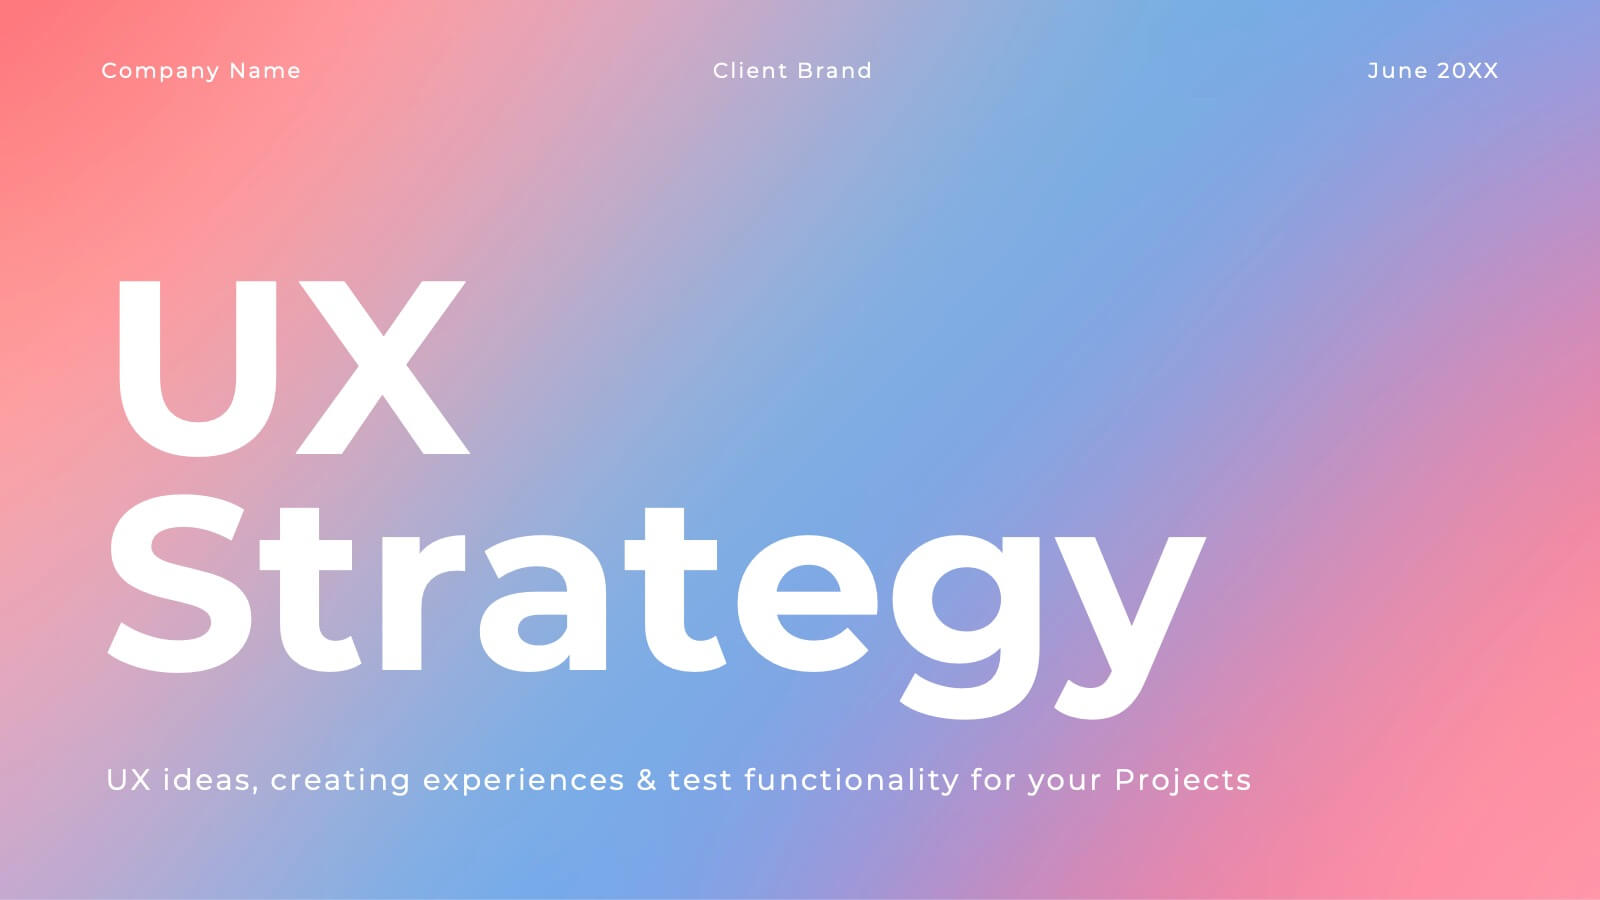
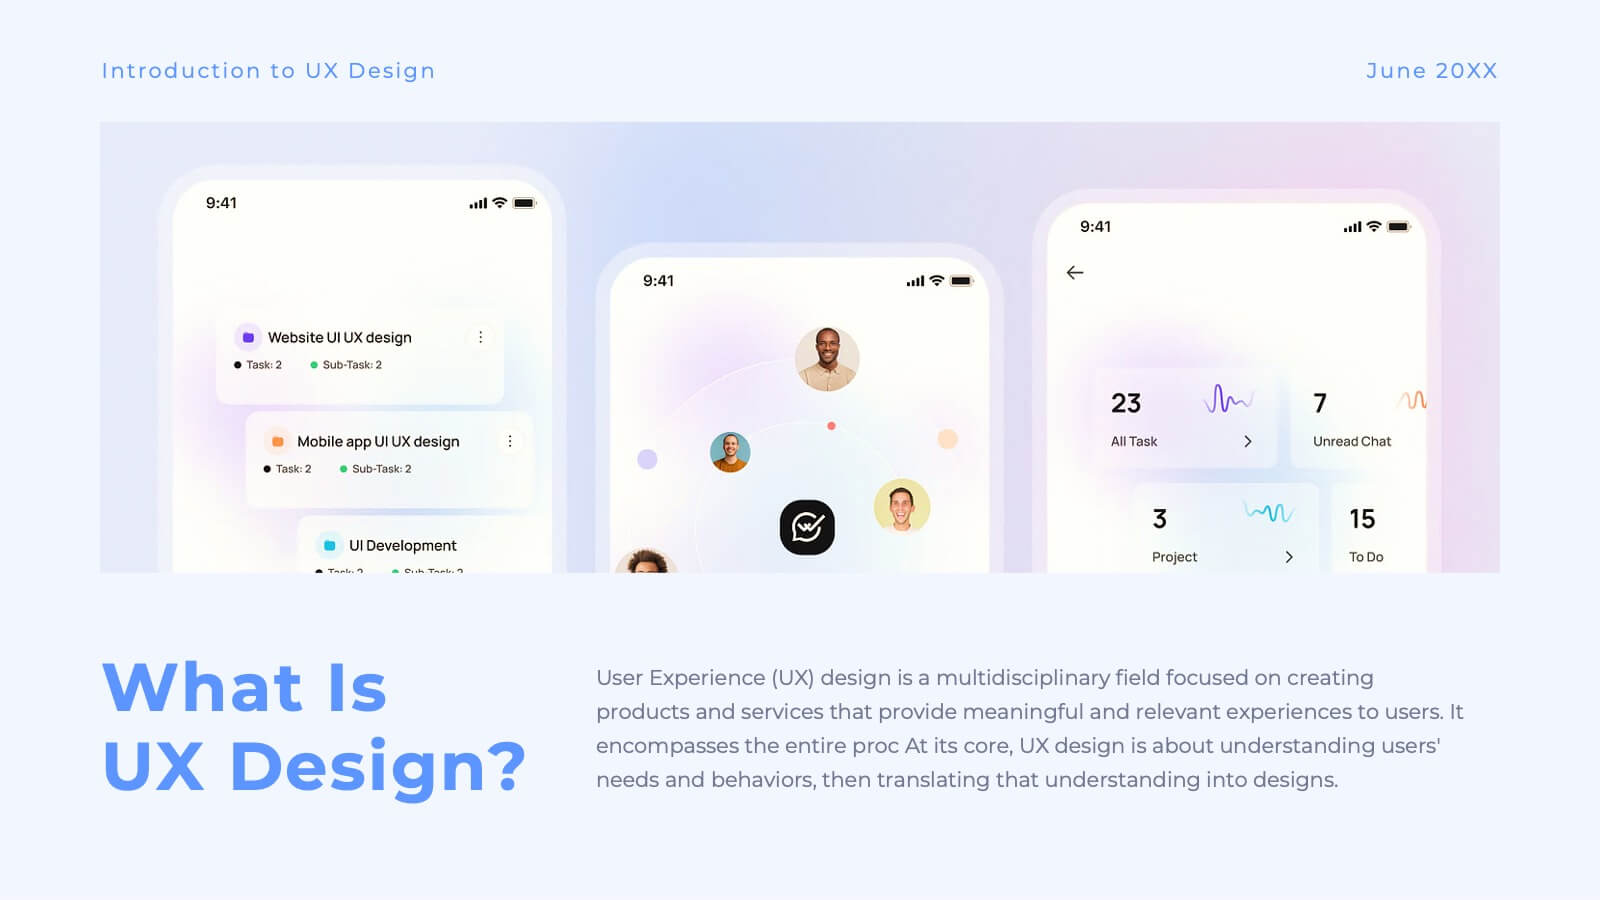
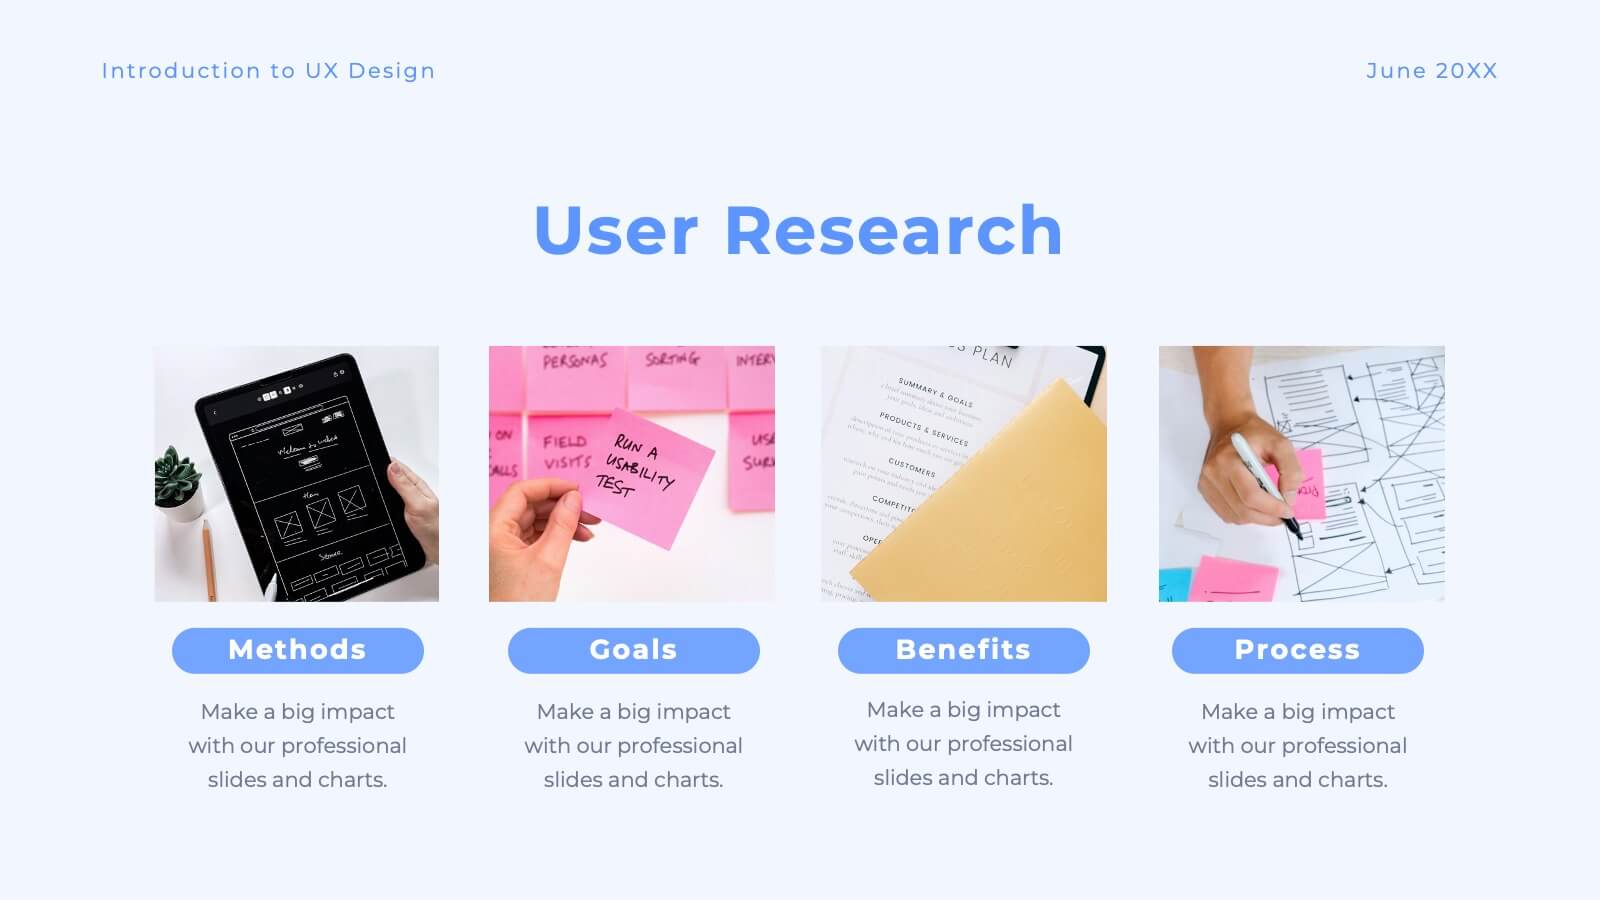
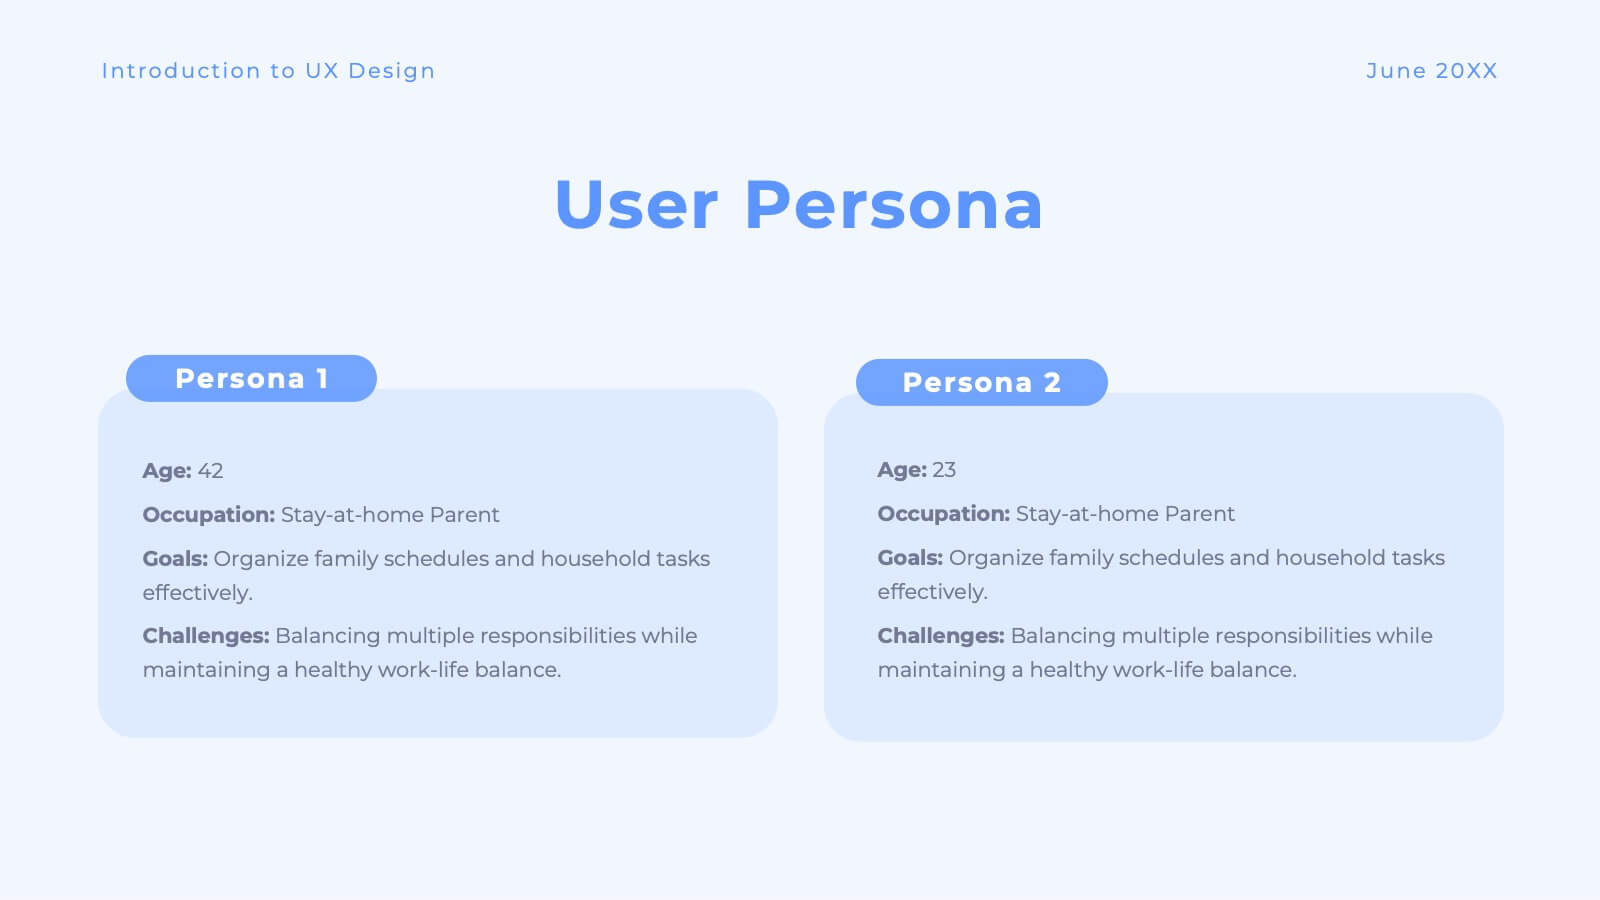
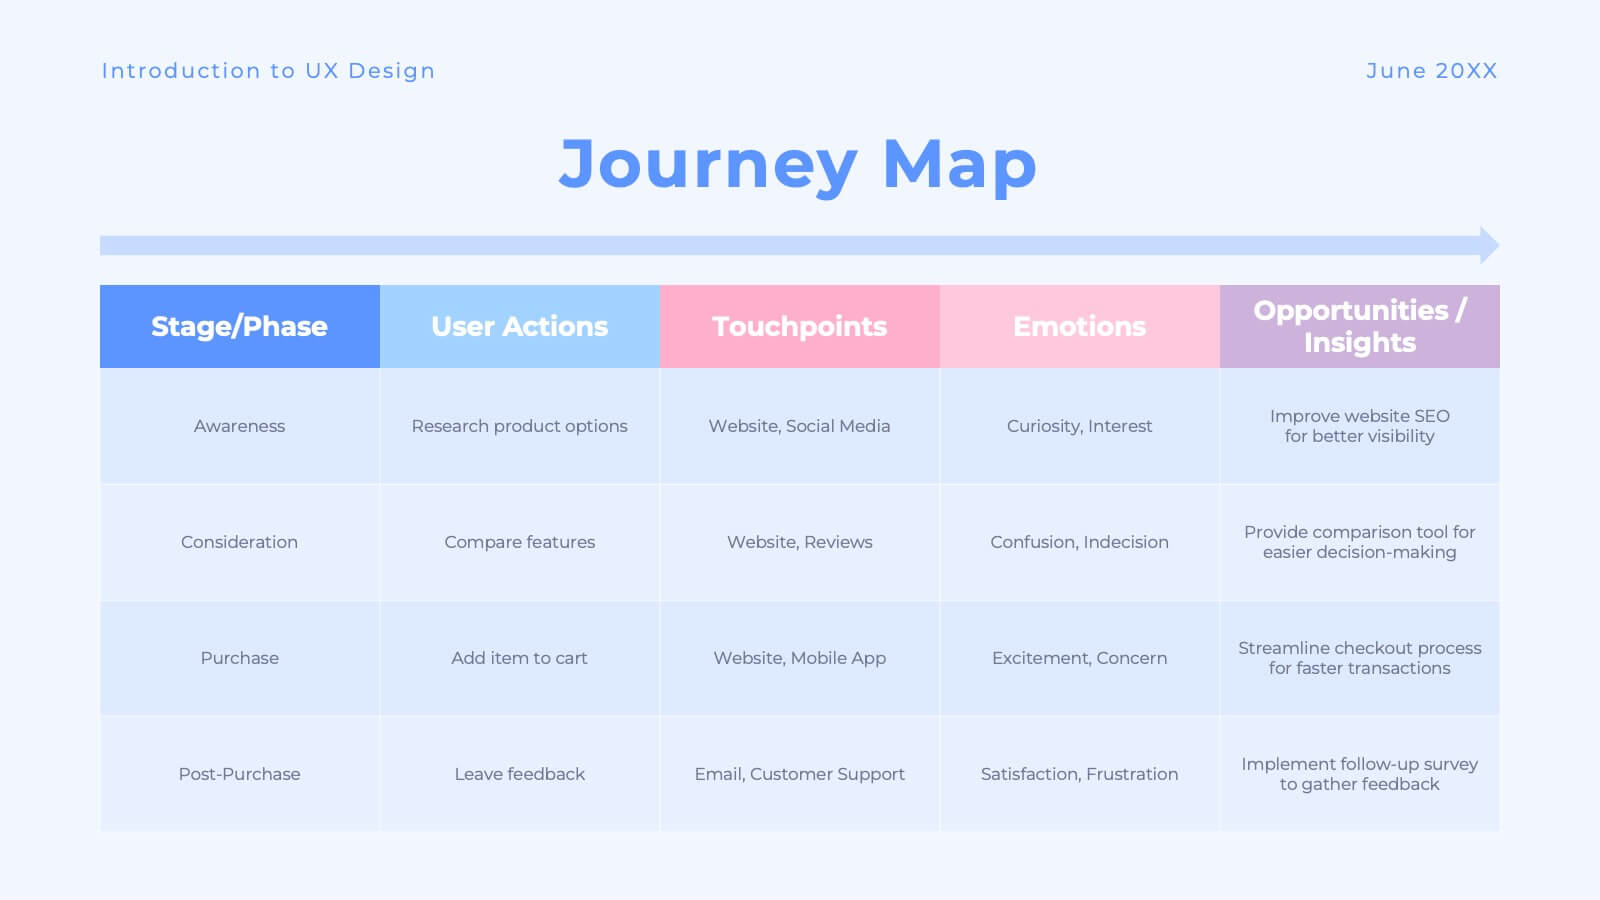
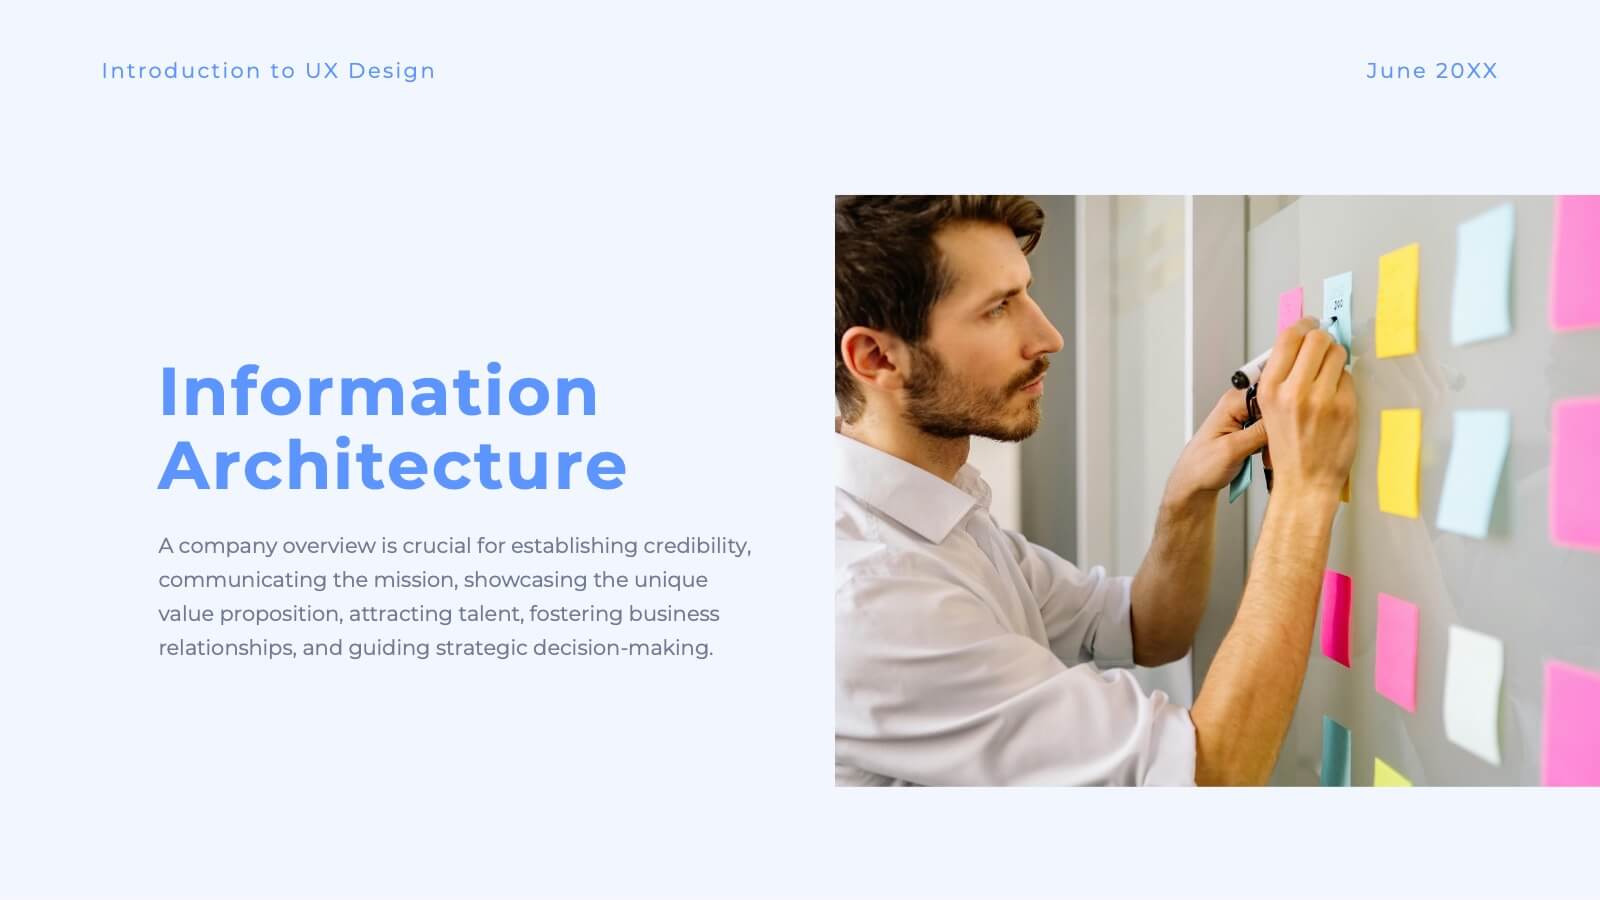
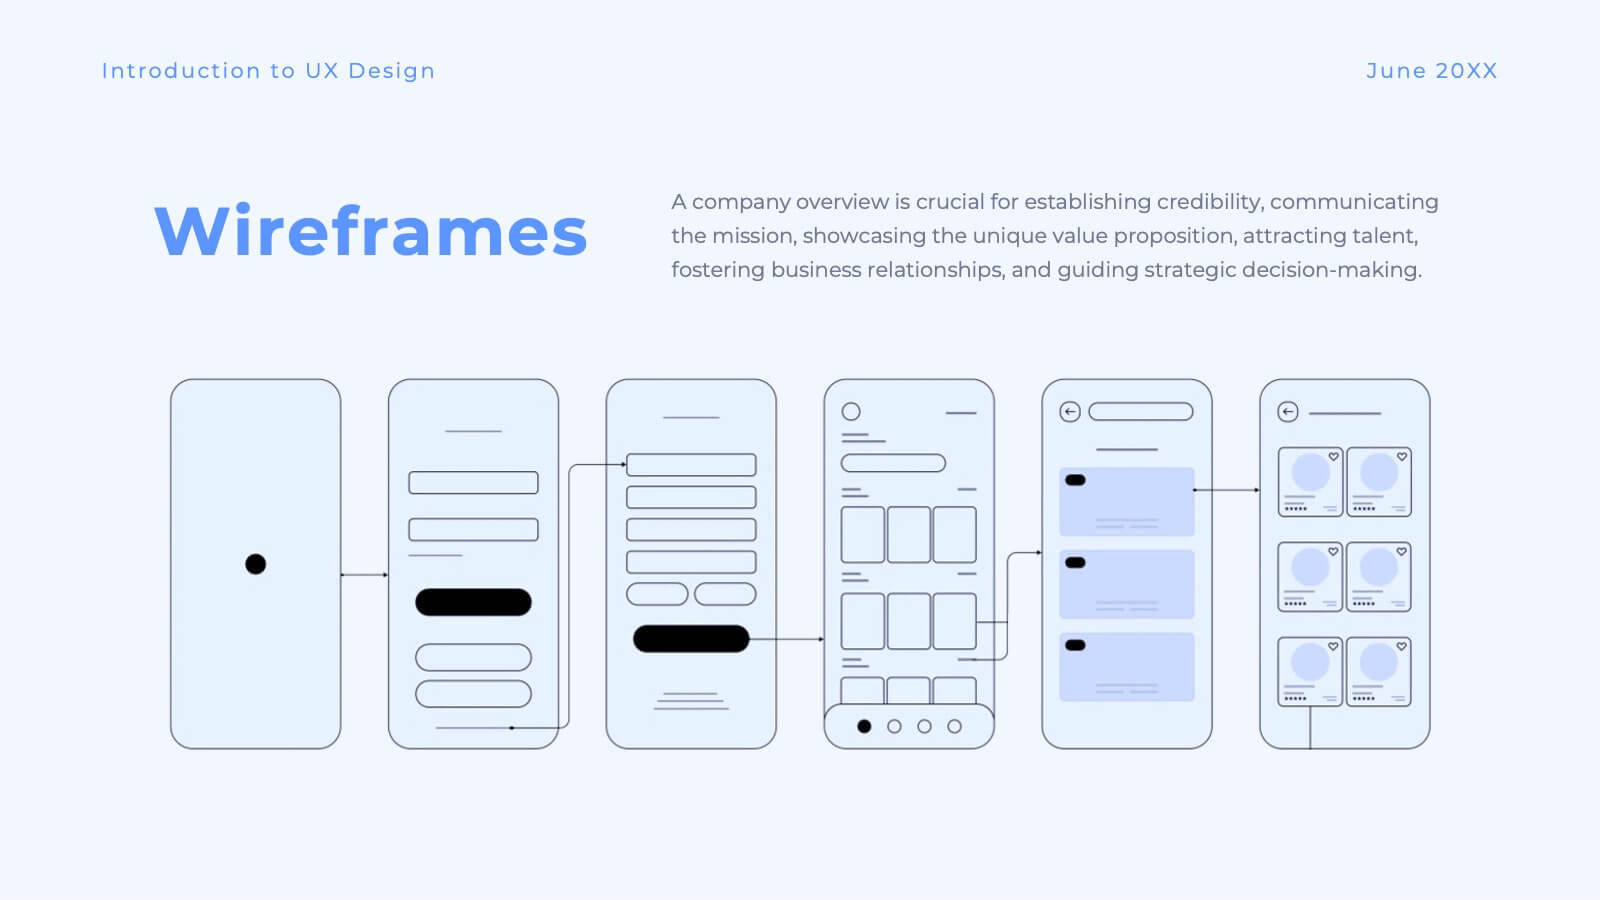
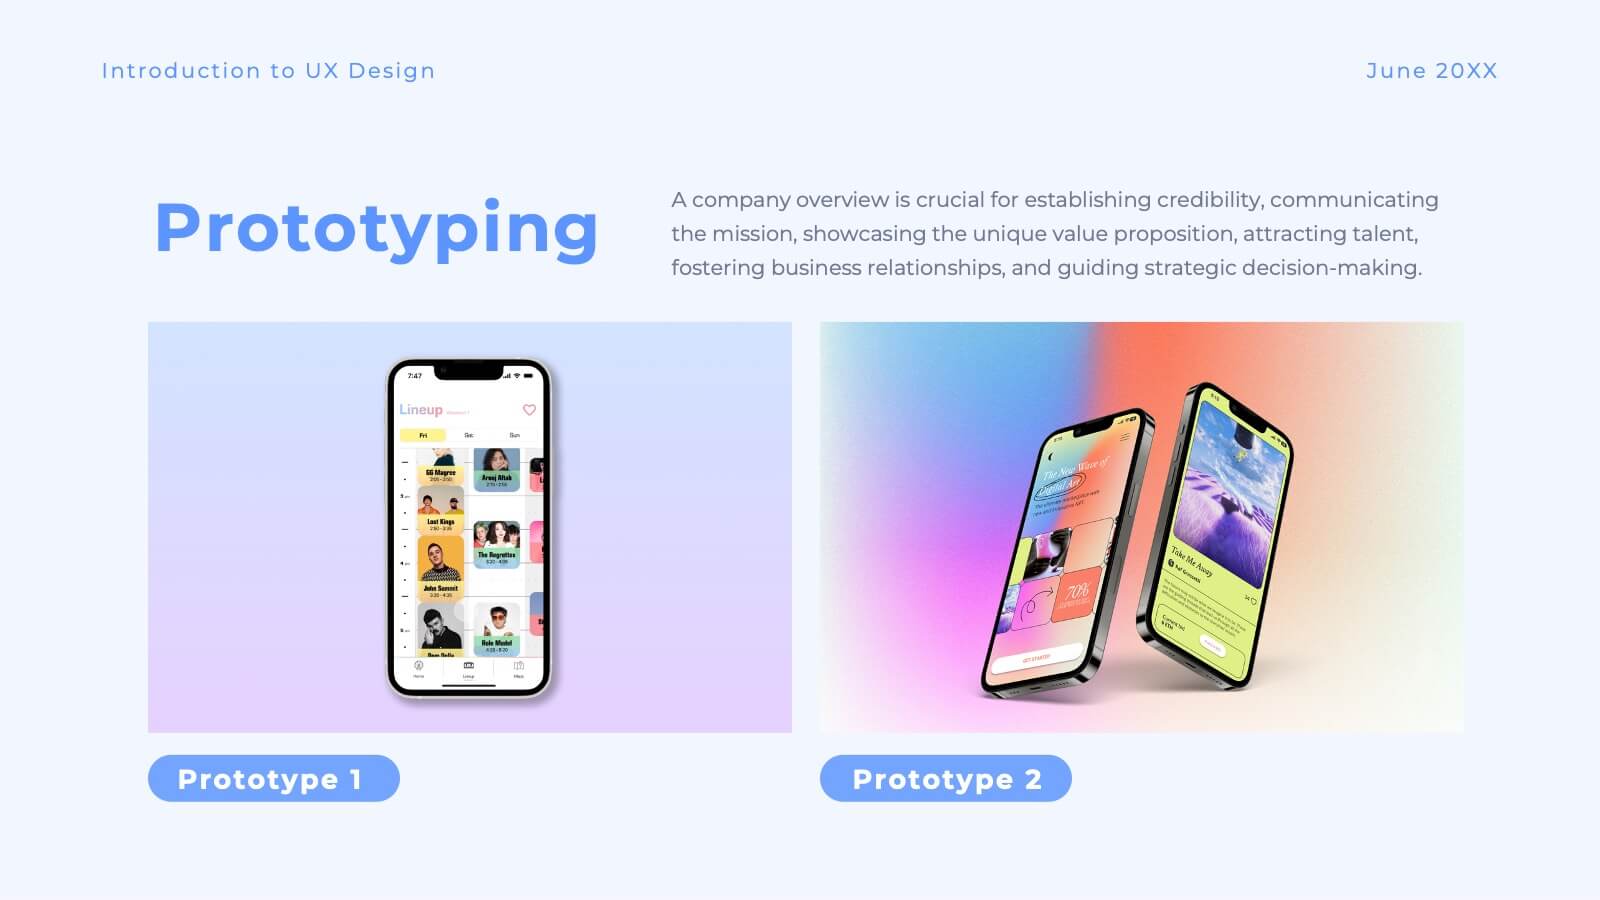
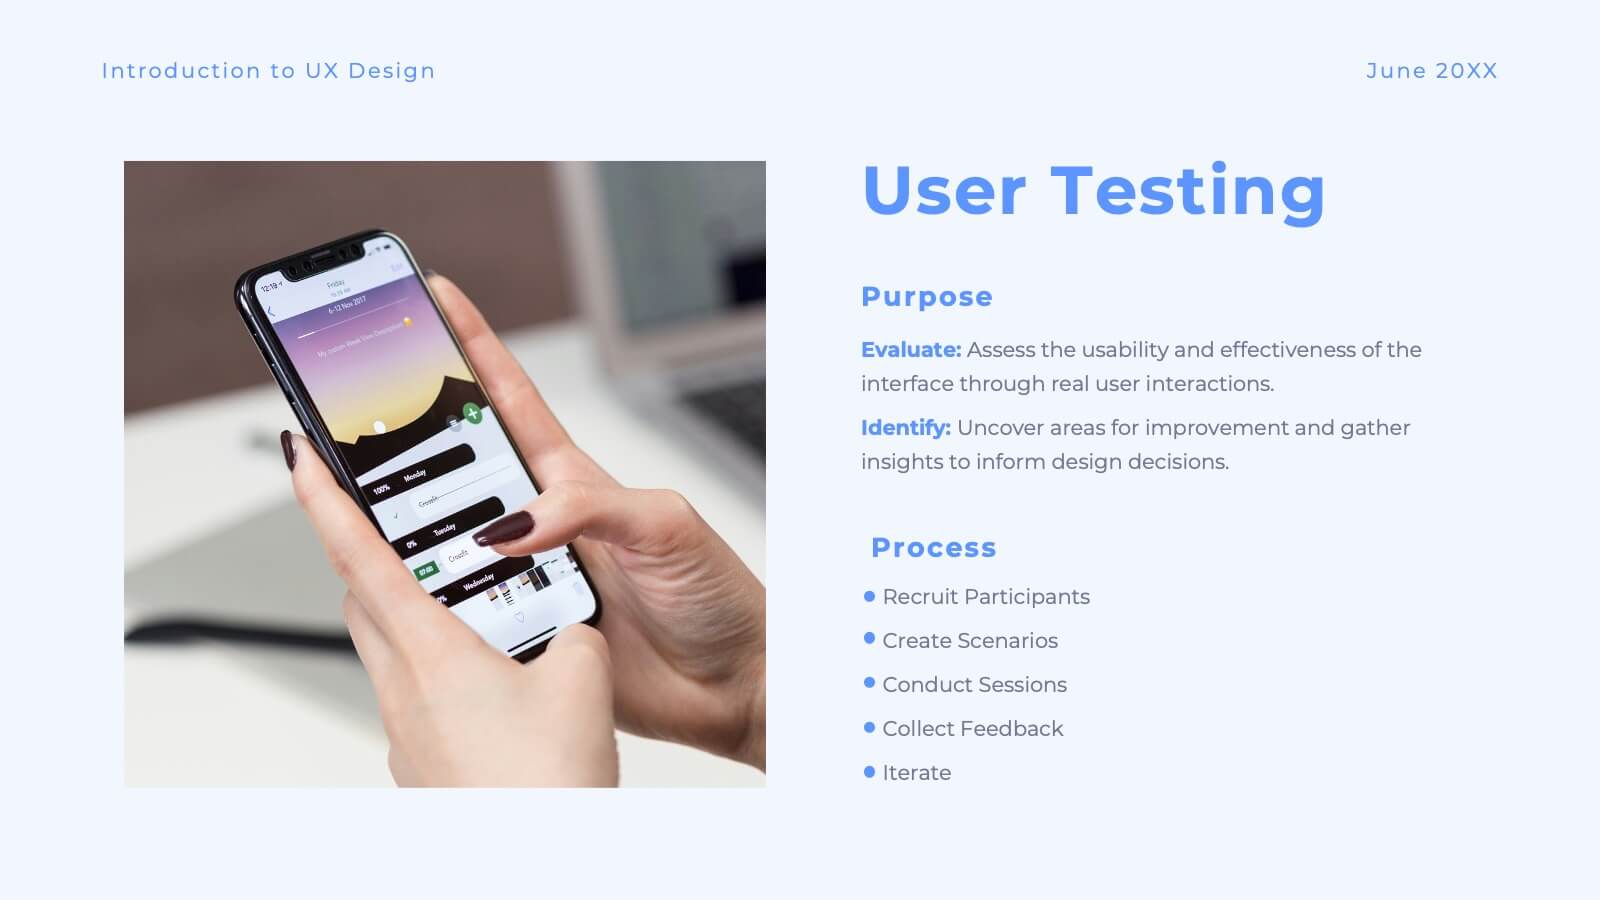
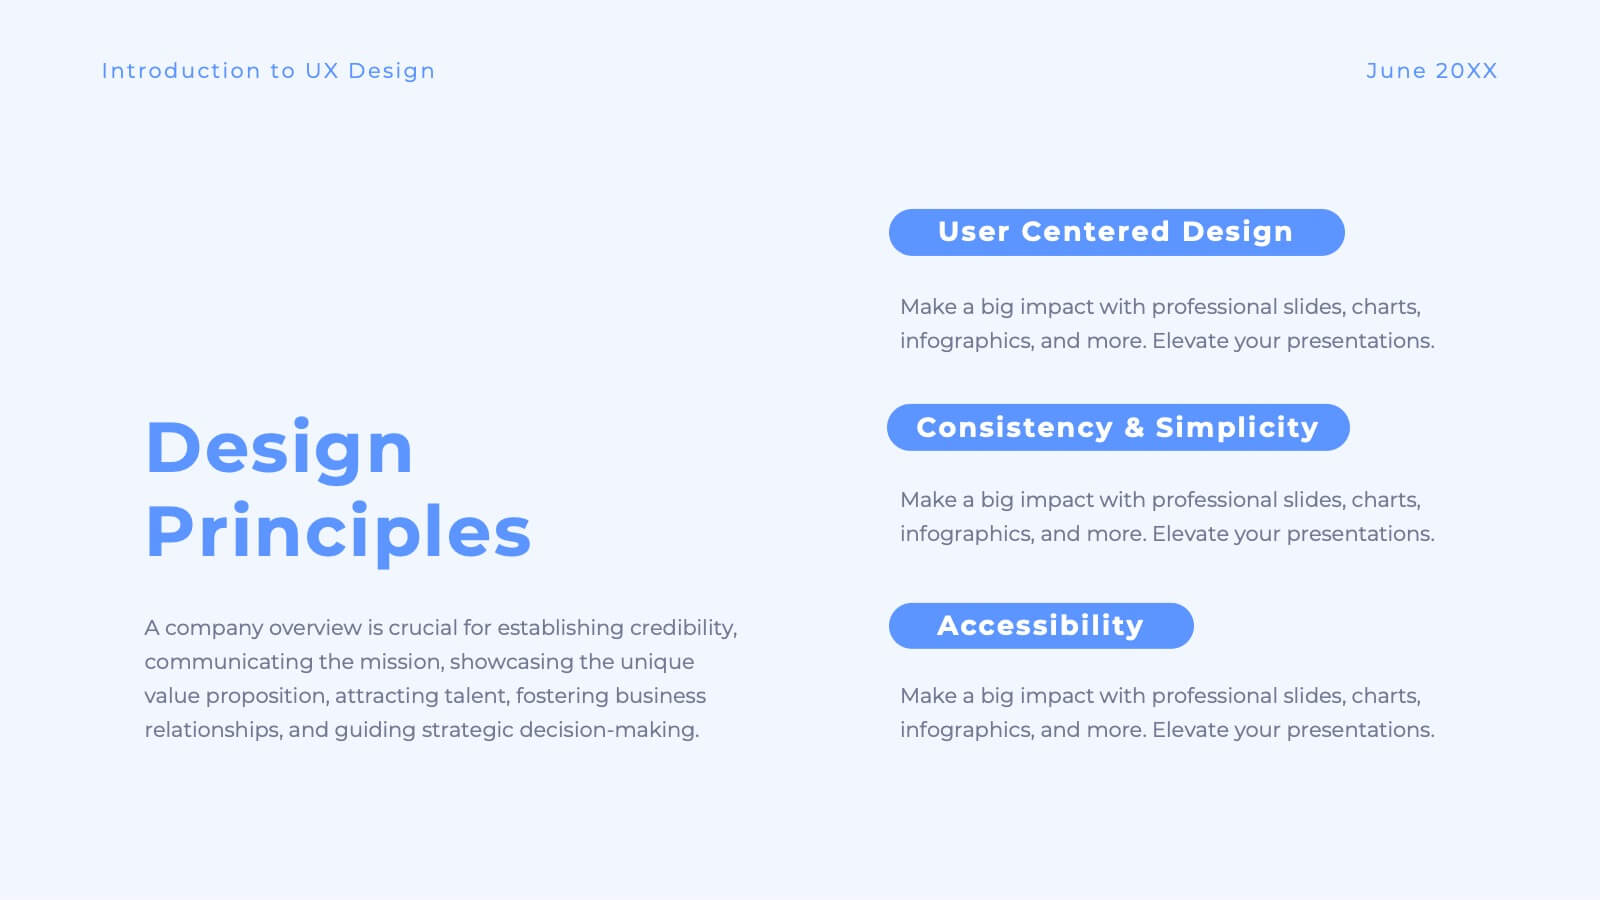
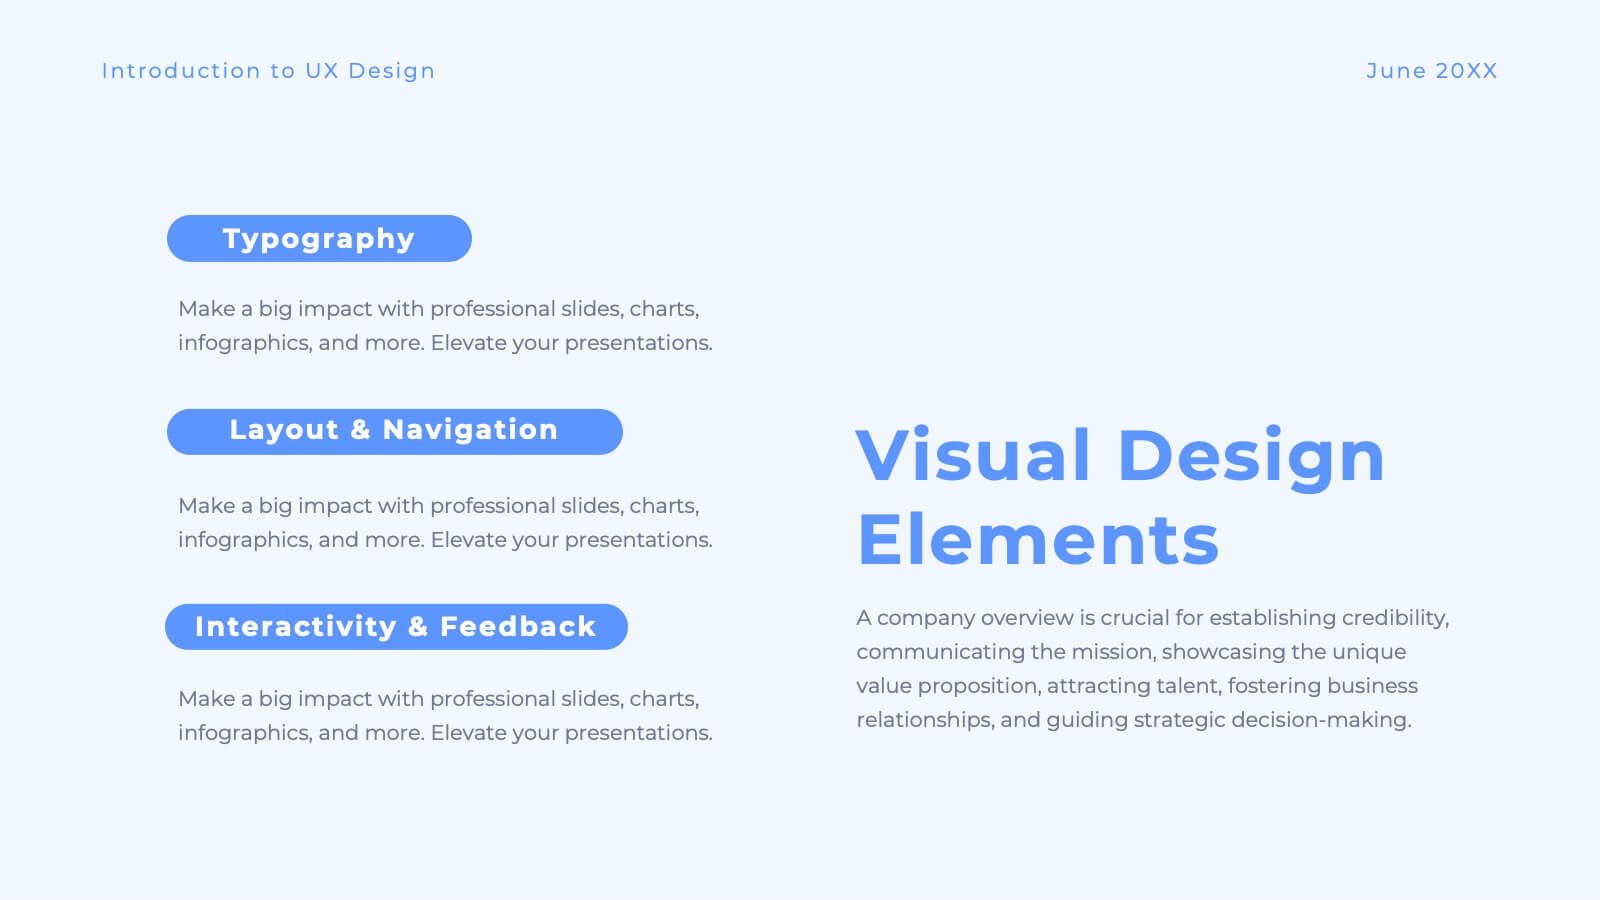
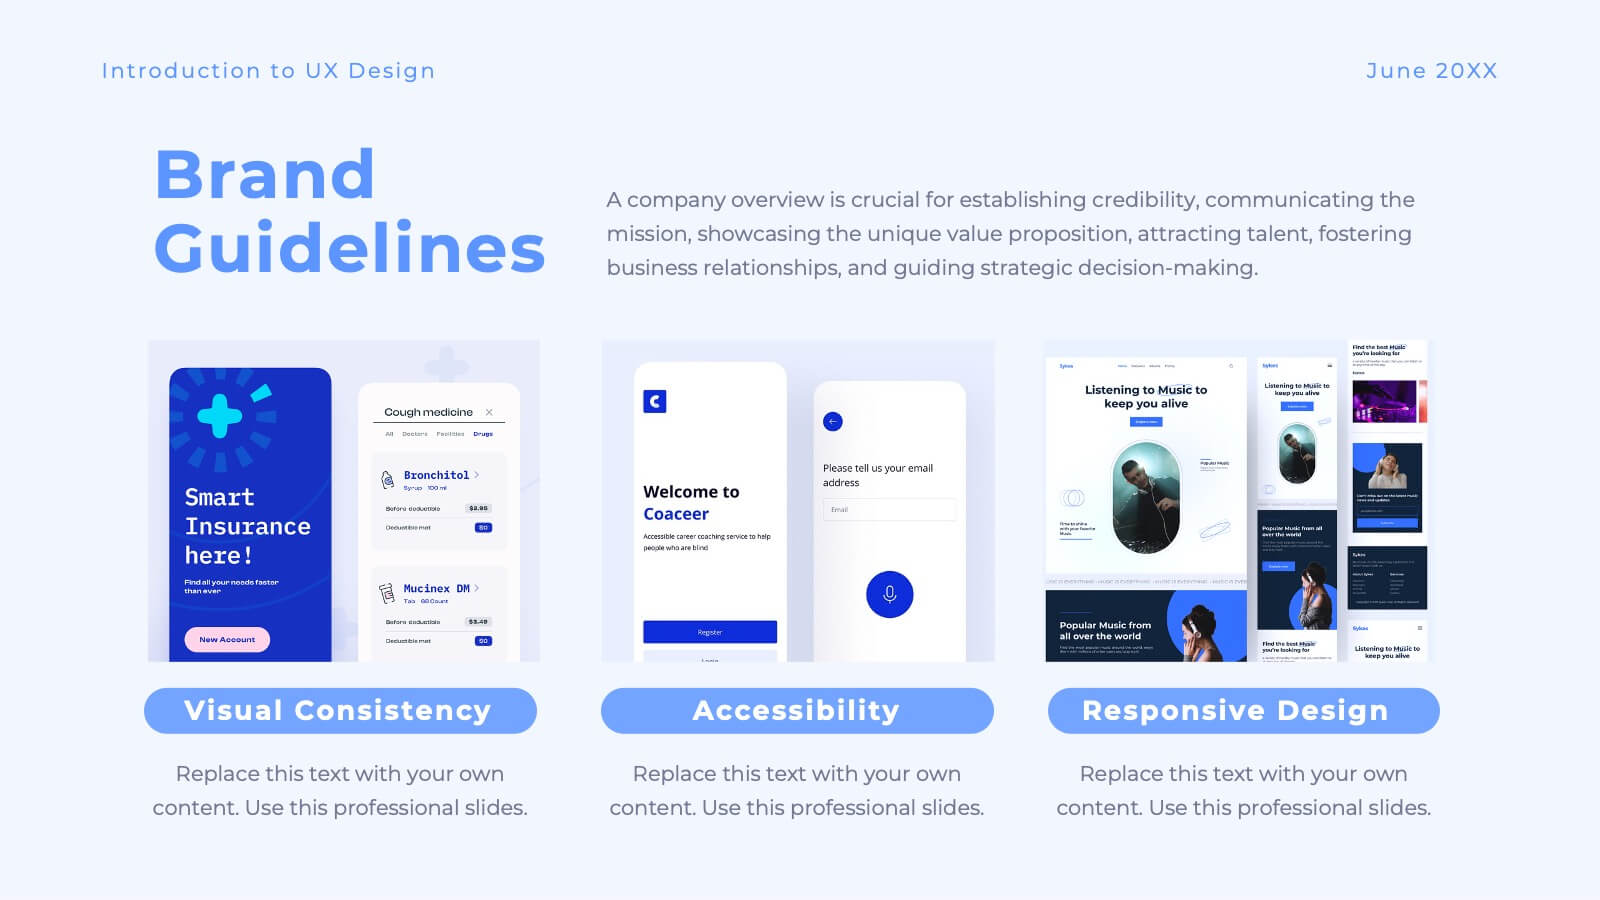
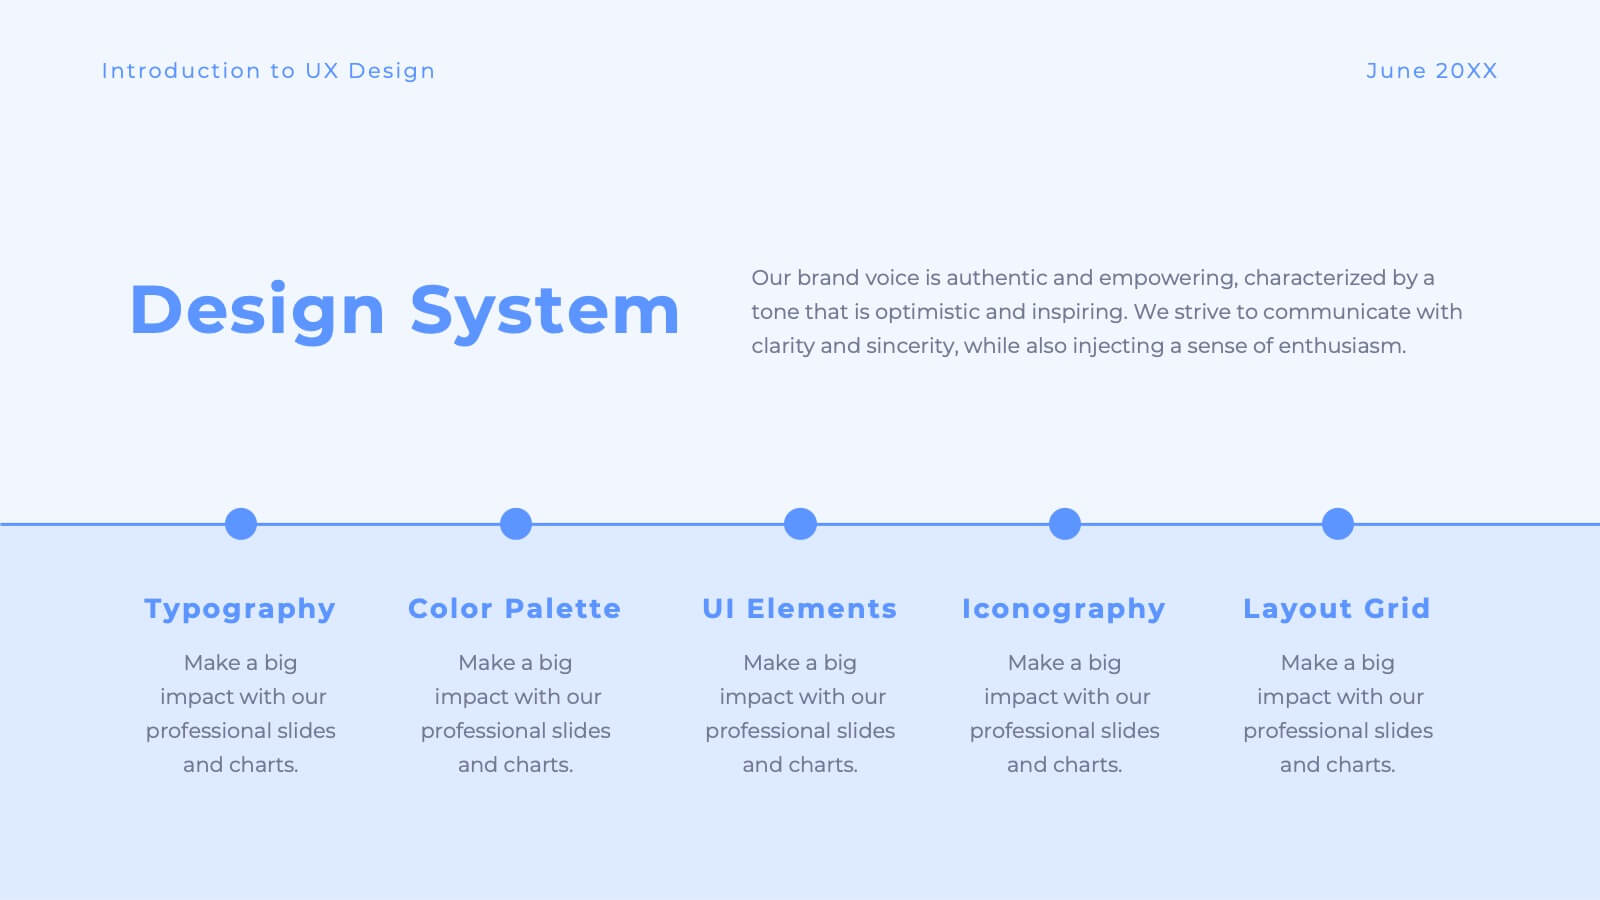
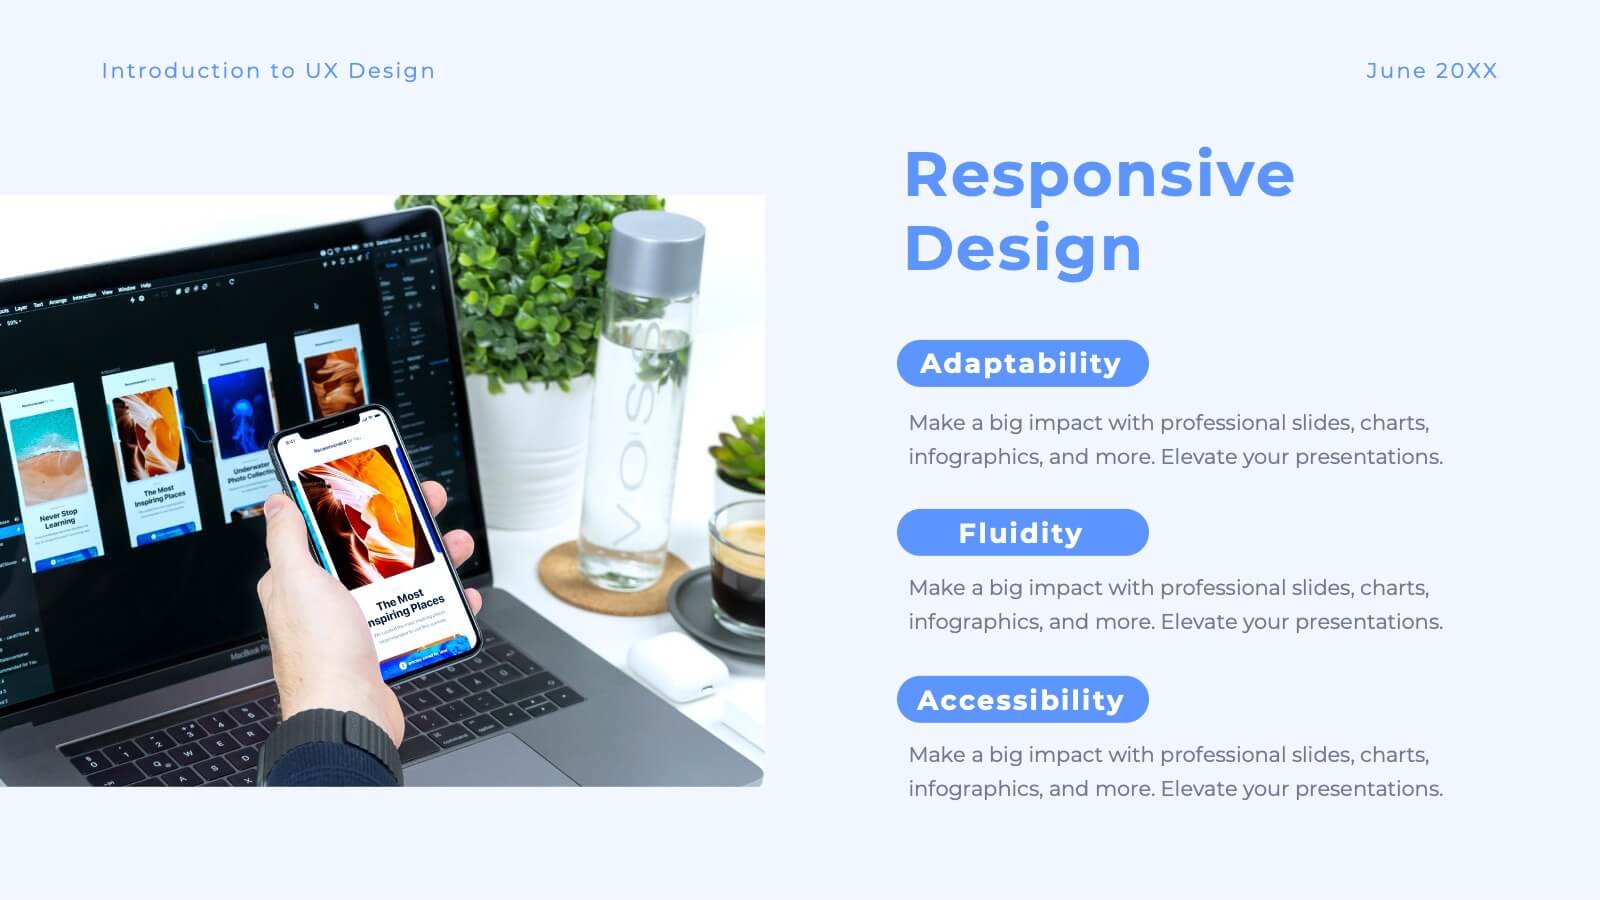
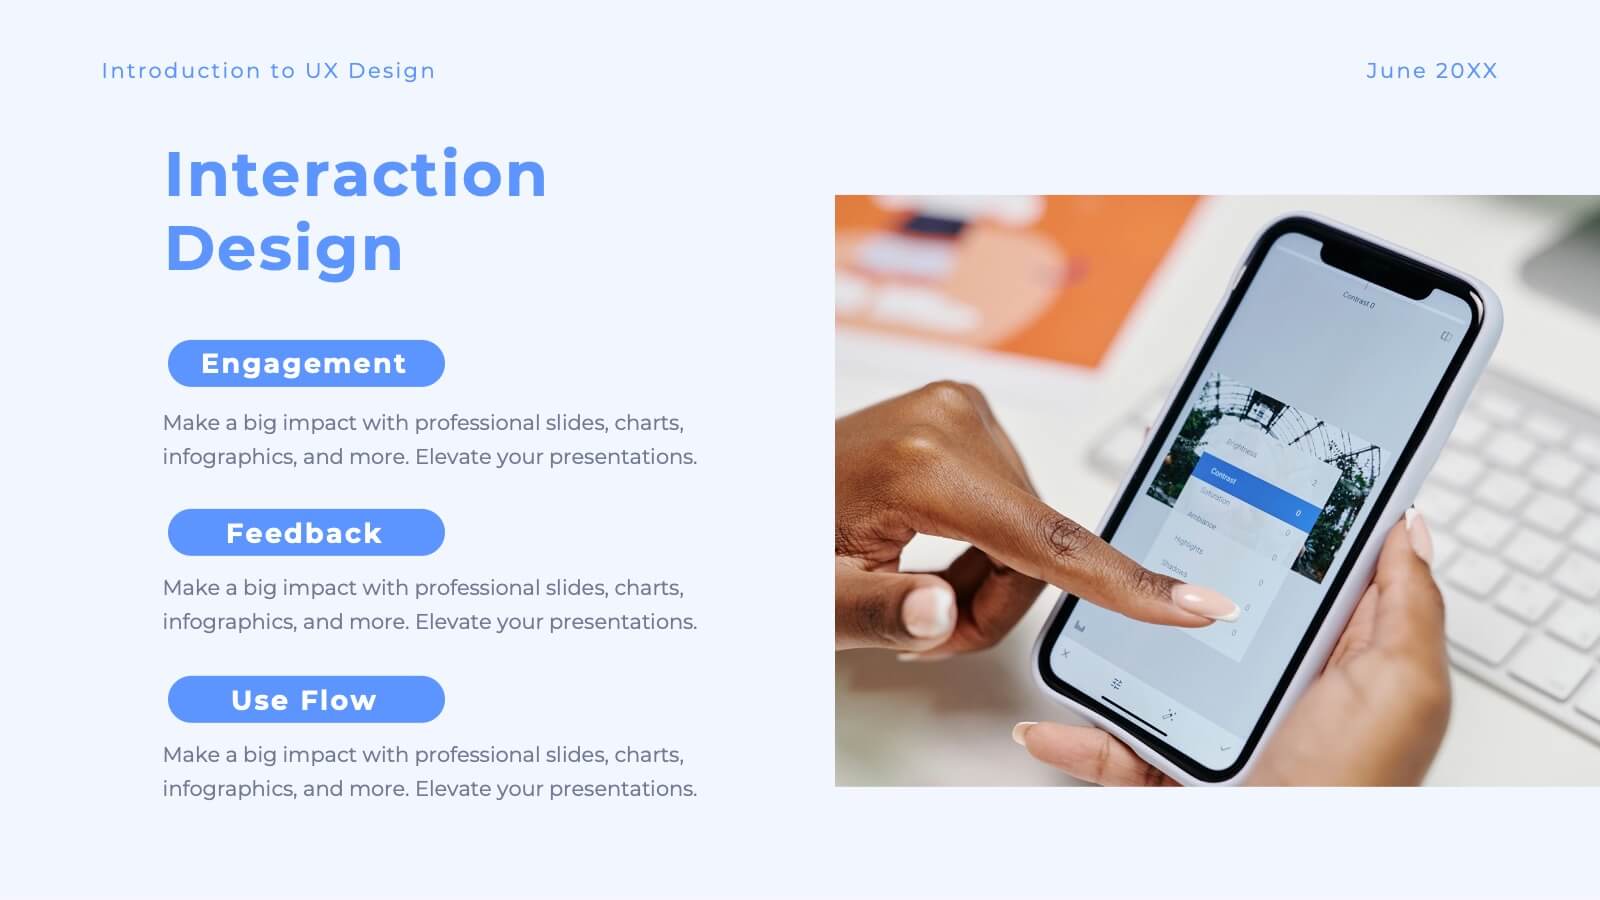
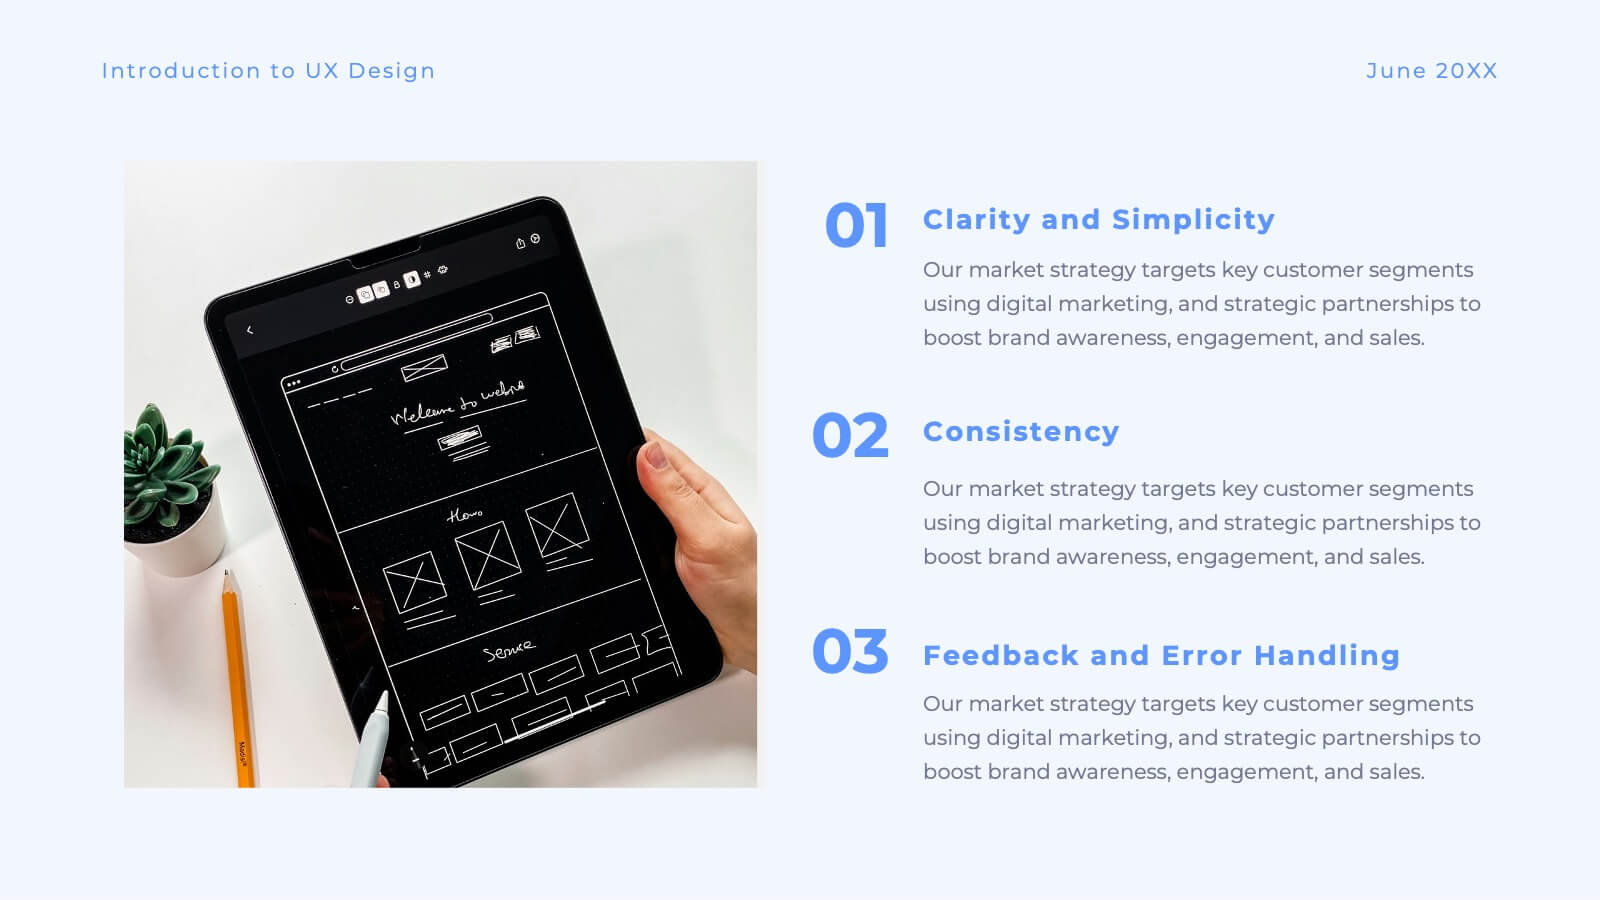
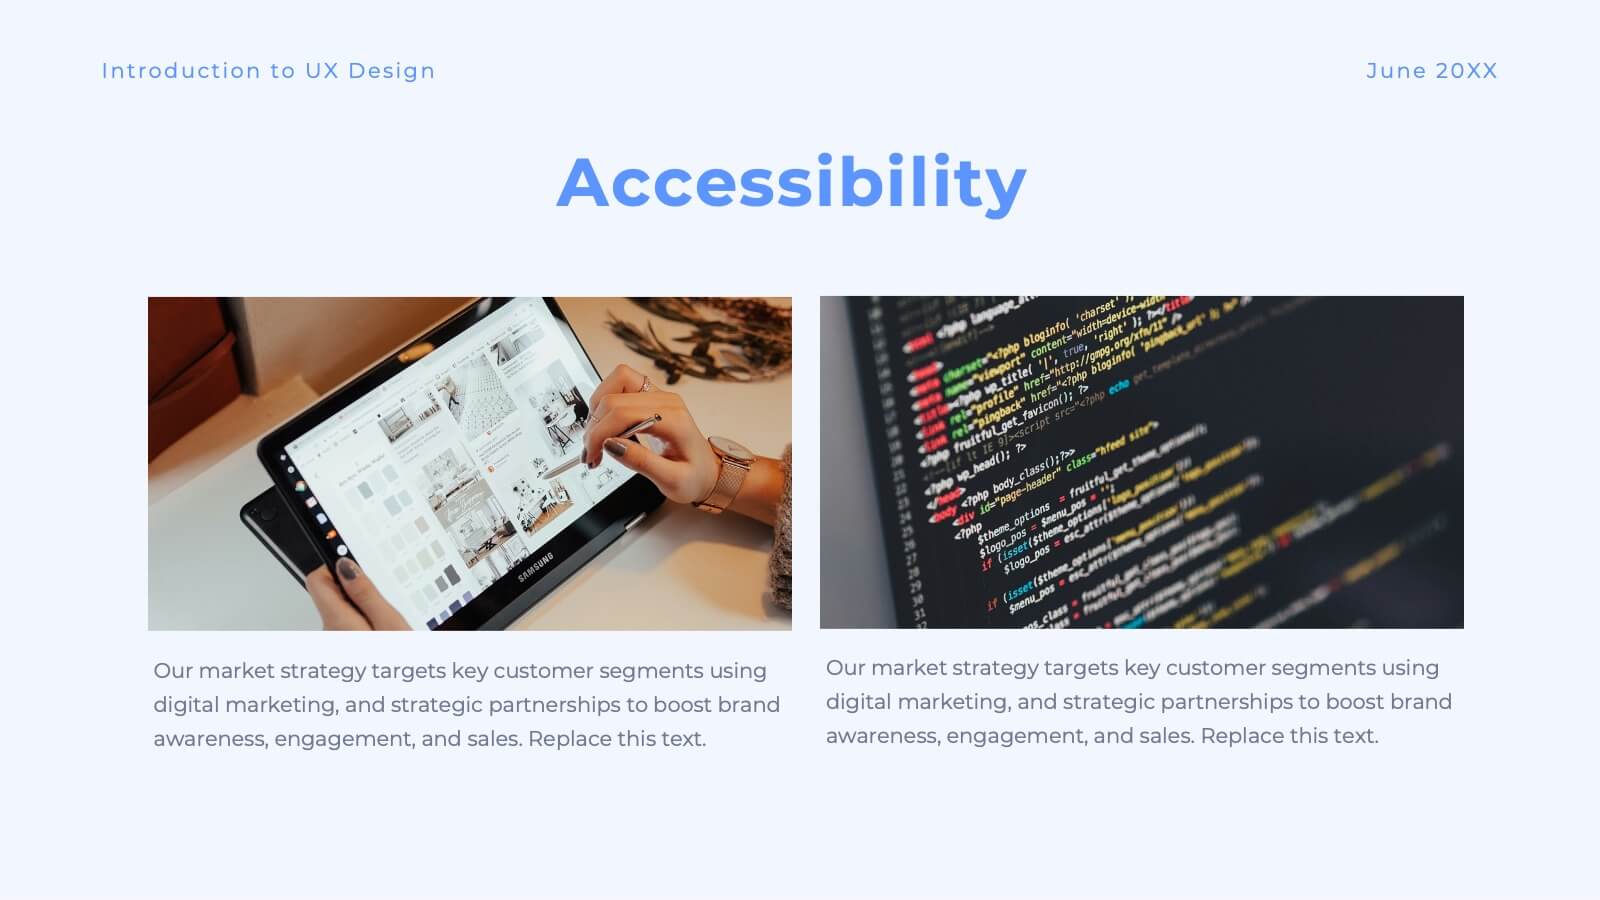
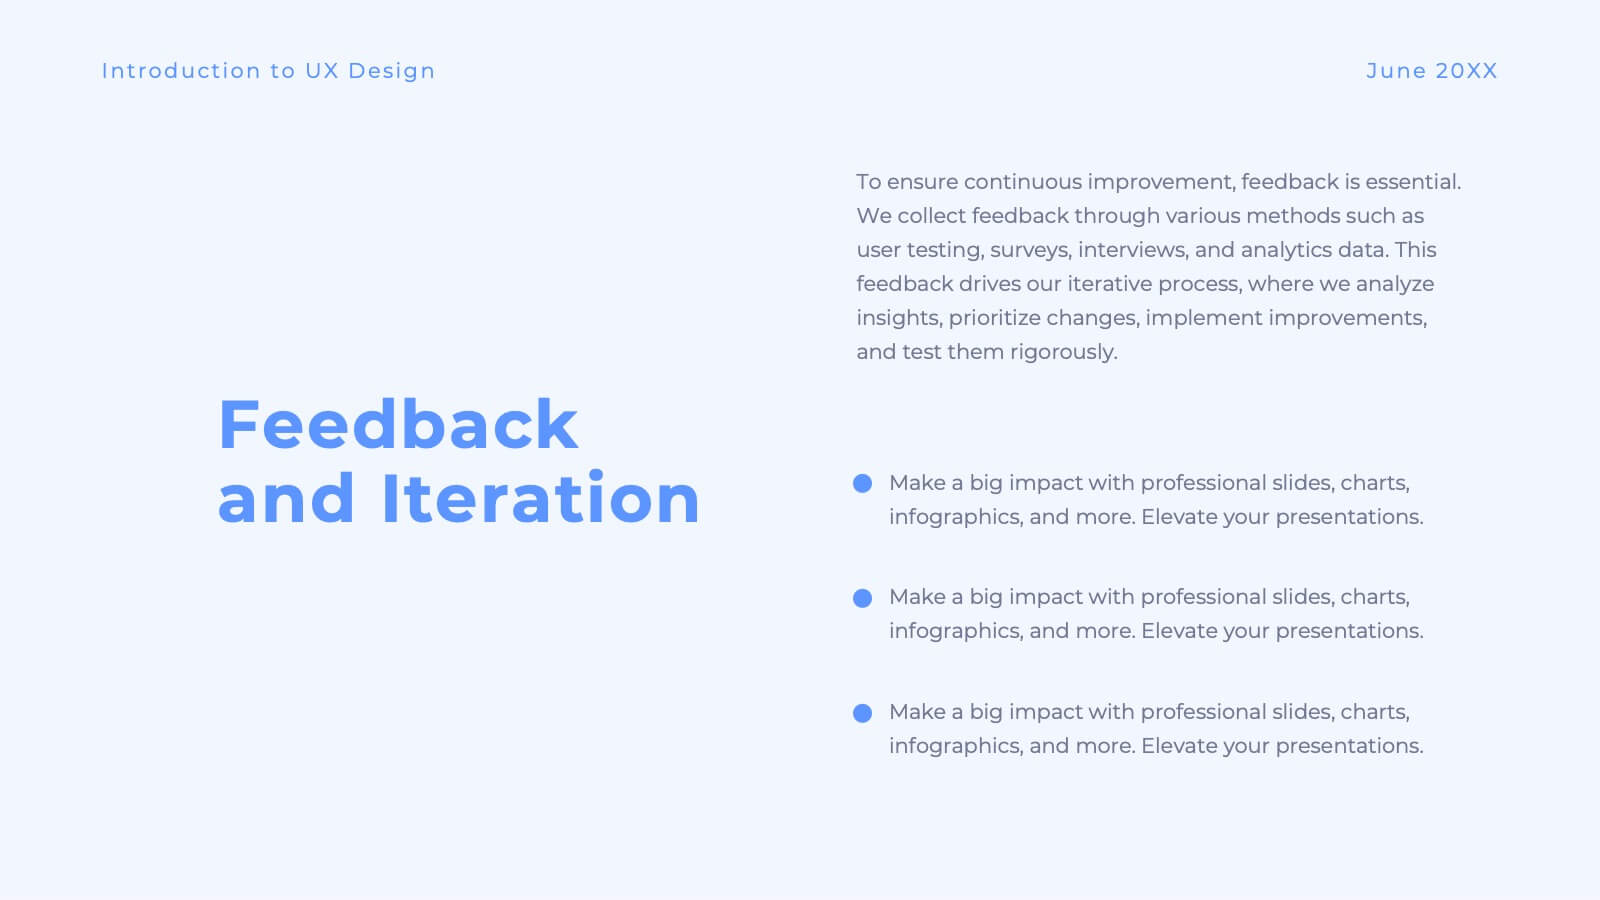
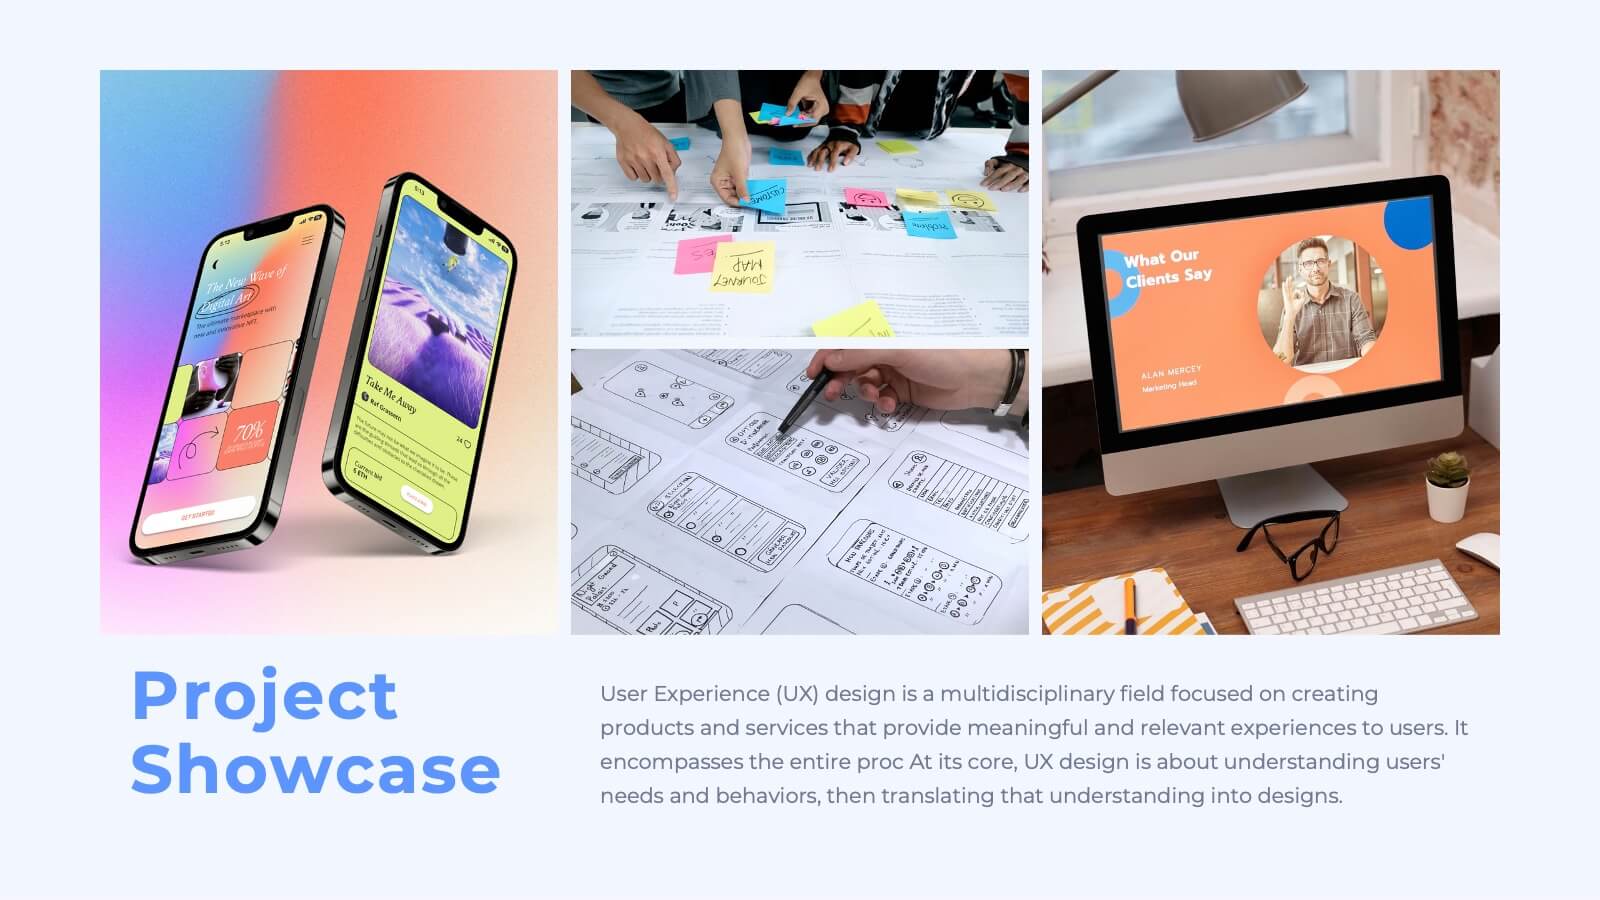
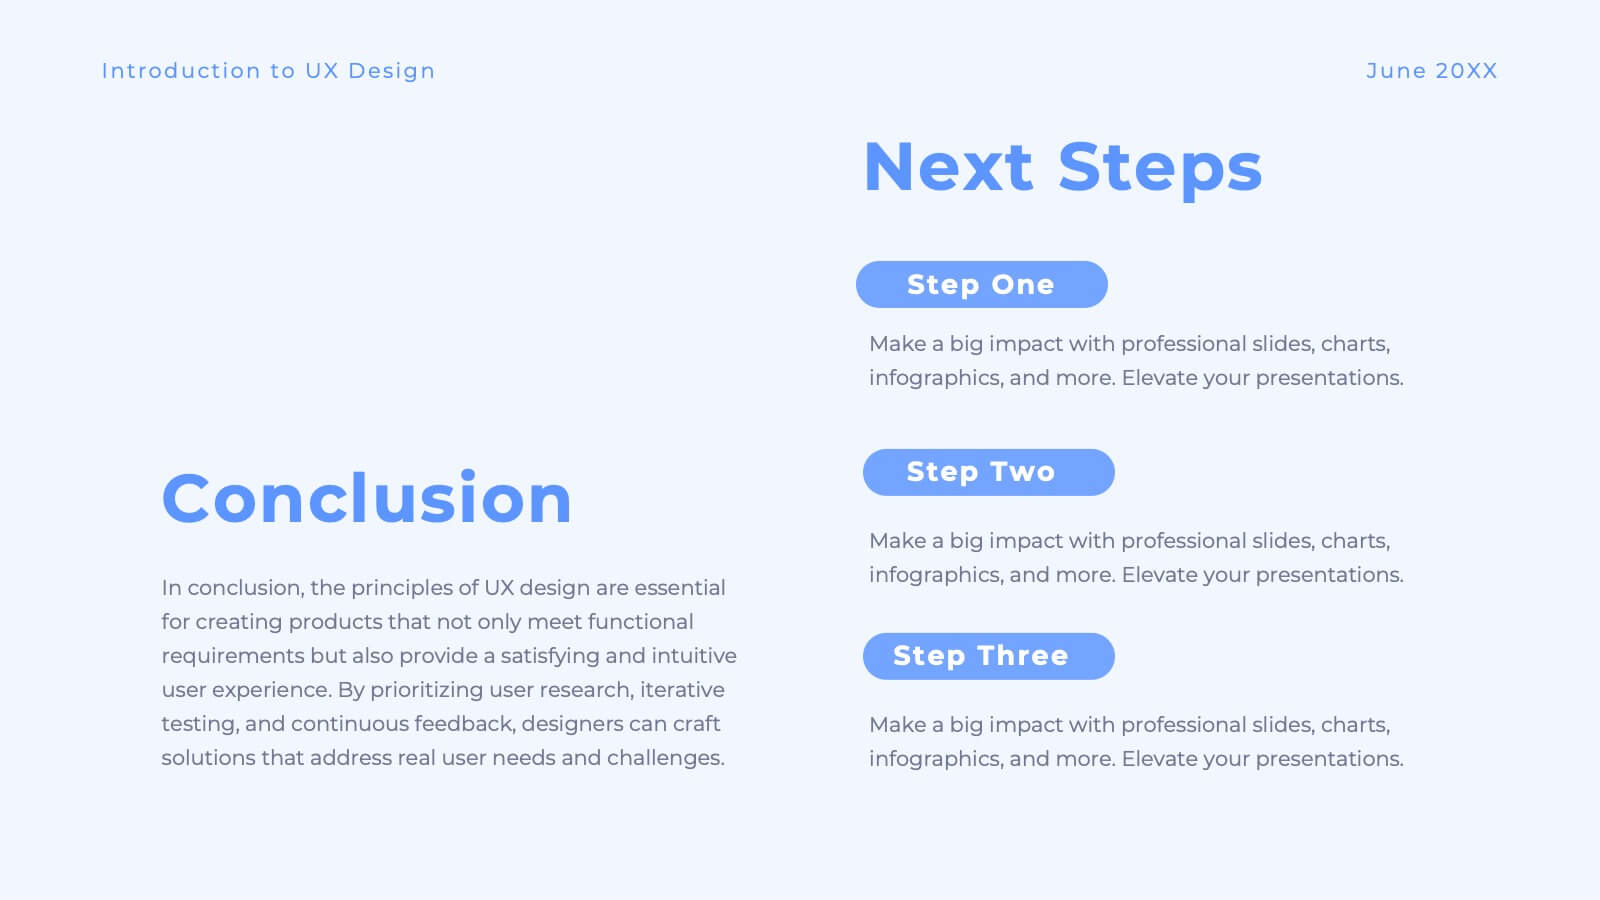
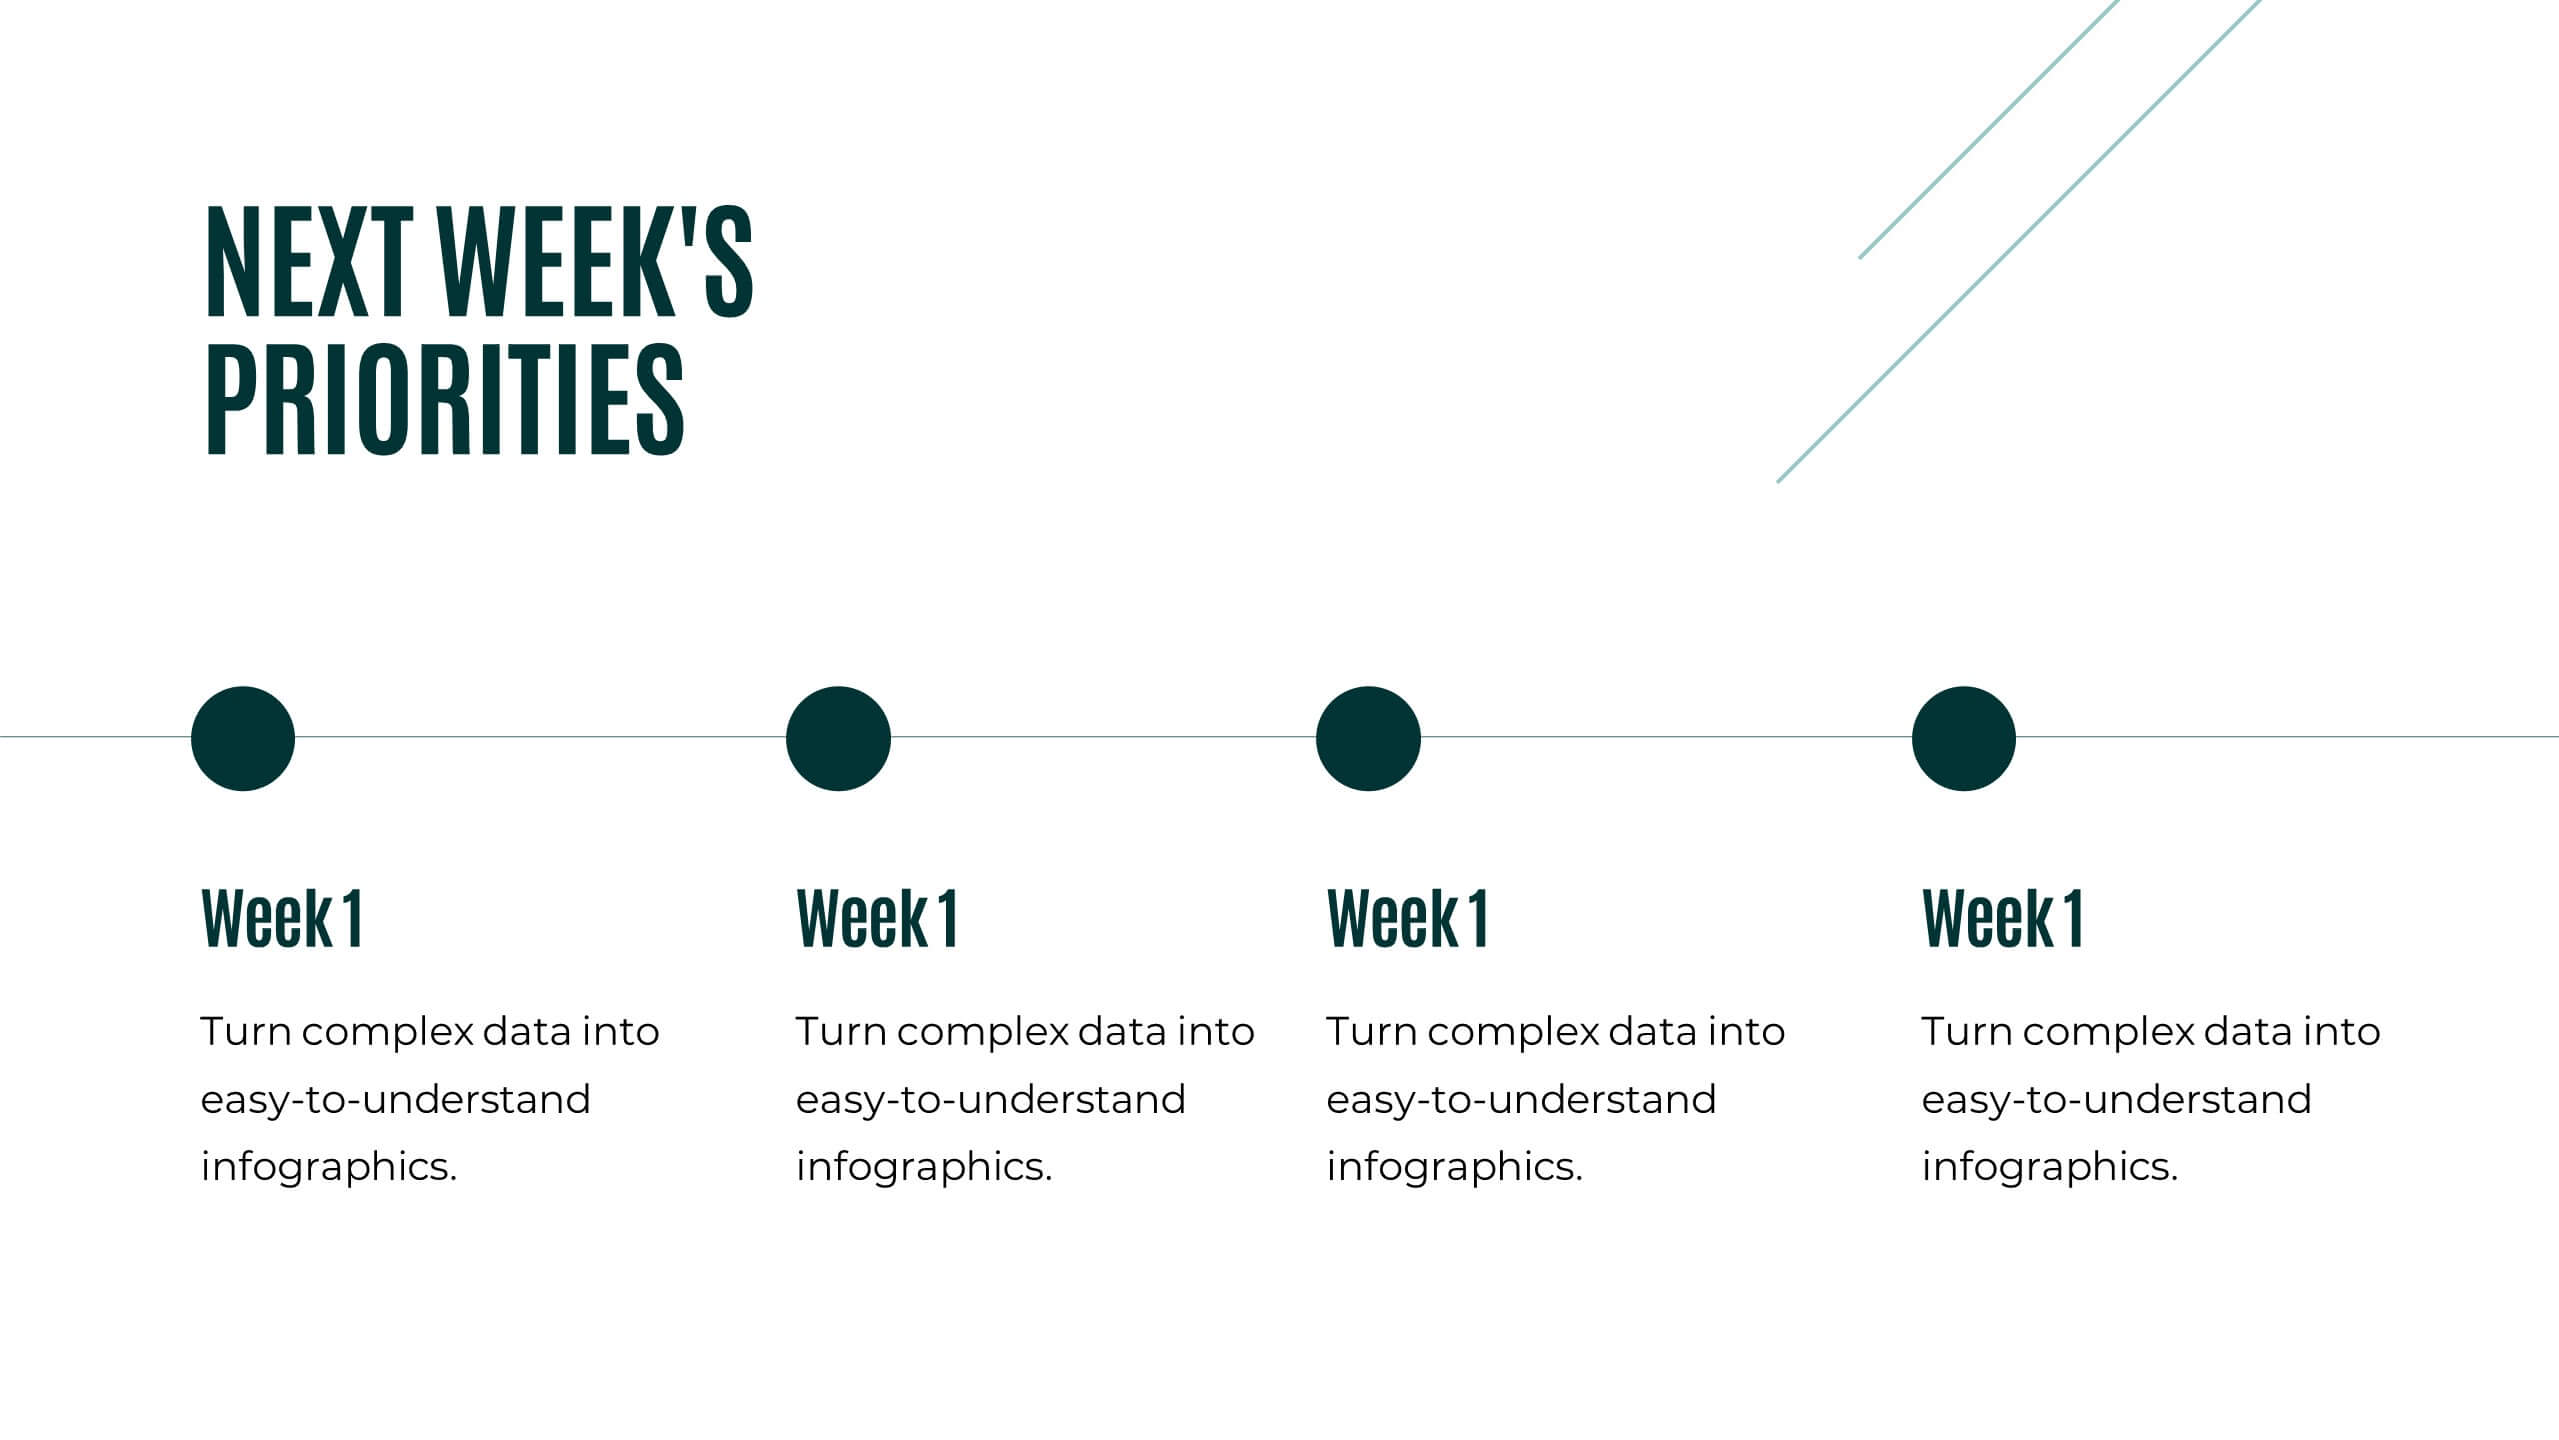
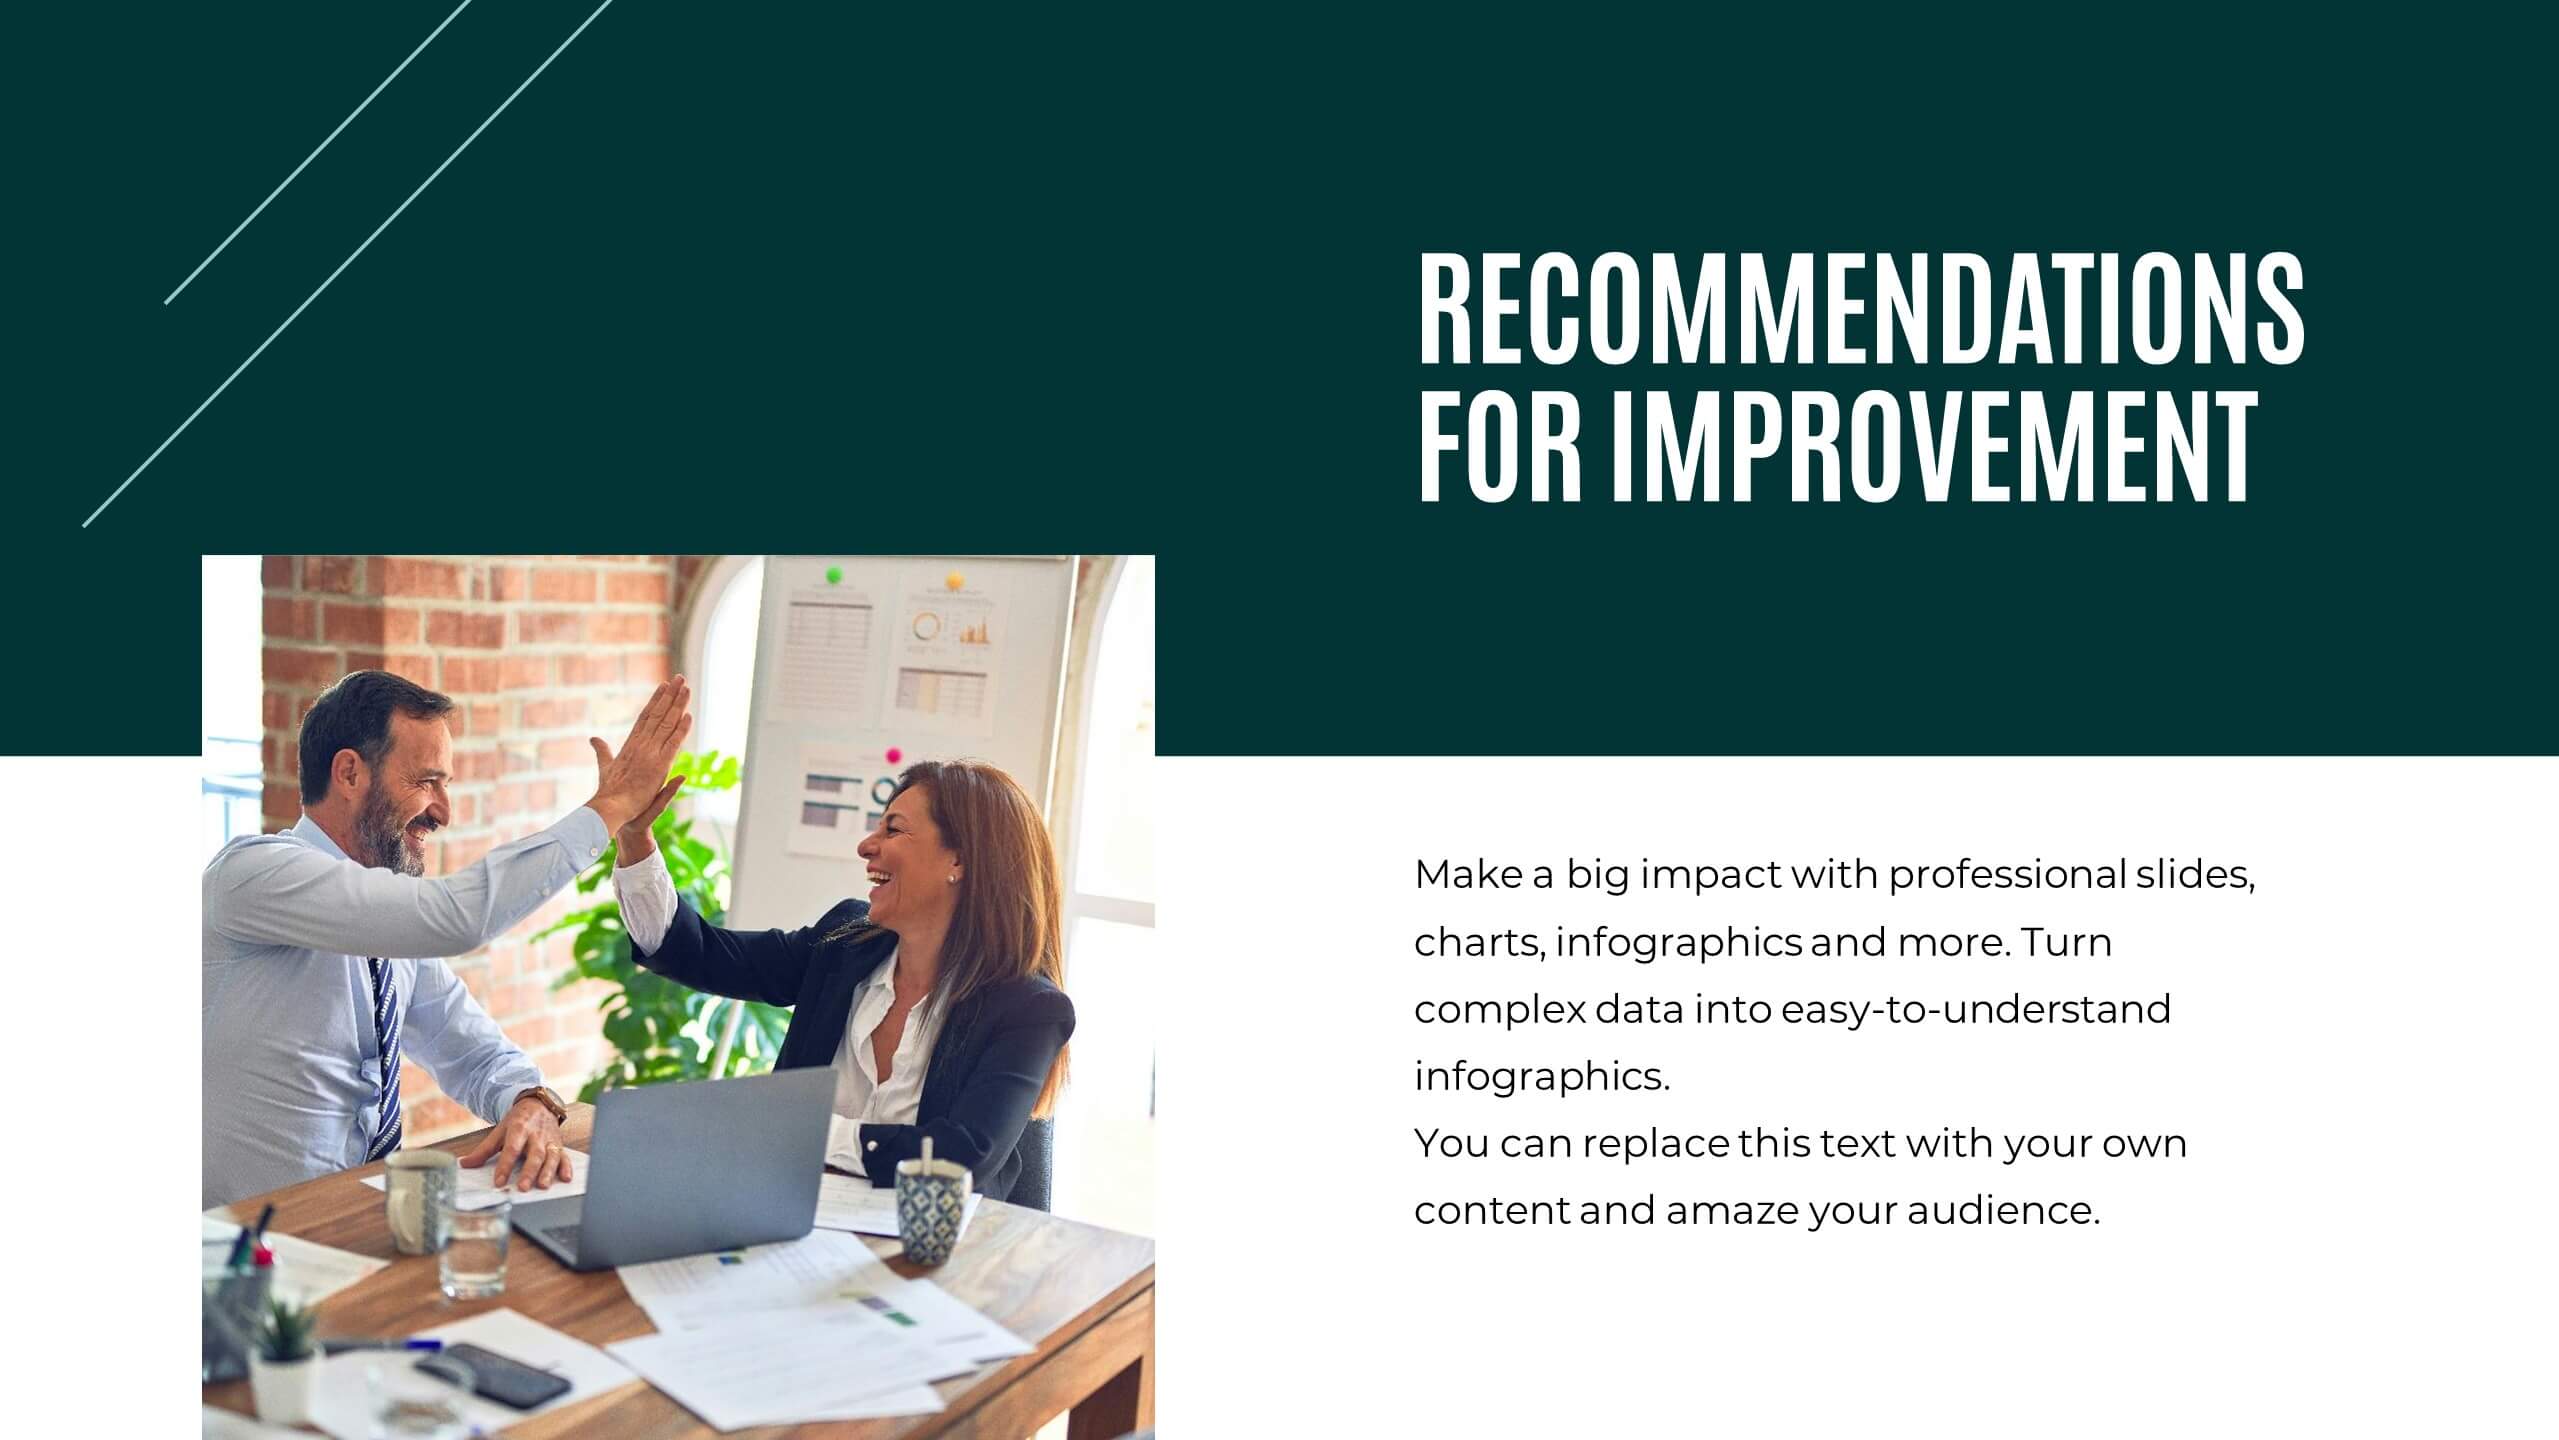
Luster UX Strategy Plan Presentation
Enhance user experience with this comprehensive UX strategy template! Perfect for outlining user research, personas, and design principles. Ideal for UX/UI designers aiming to present their strategies effectively. Compatible with PowerPoint, Keynote, and Google Slides, this template ensures your UX presentations are clear, professional, and impactful. Create exceptional user experiences today!


7 diapositivas
Social Media Engagement Infographic
Social media is the most influential tool in today's world. This infographic template is a great way to share the benefits of your services in an easy-to-read format that's sure to get your audience excited about what you have to offer. Whether you're looking to promote a new product line or simply want to provide information to your customers so they can make informed decisions, this infographic will be perfect for your needs. This infographic will help you understand how to use social media to engage with your audience and drive traffic to your site. Fully customizable and compatible with Powerpoint, Keynote, and Google Slides.


7 diapositivas
Online Meeting Infographic
Online meetings, also known as virtual meetings or web meetings, are gatherings or discussions that take place over the internet, enabling participants to communicate, collaborate, and interact with each other remotely. This infographic template is a great way to streamline the process and enhance the efficiency of virtual meetings. This template aims to provide a comprehensive guide to conducting effective online meetings. Compatible with Powerpoint, Keynote, and Google Slides. Customize the content and design to suit your specific needs and ensure your online meetings are efficient, engaging, and productive.


6 diapositivas
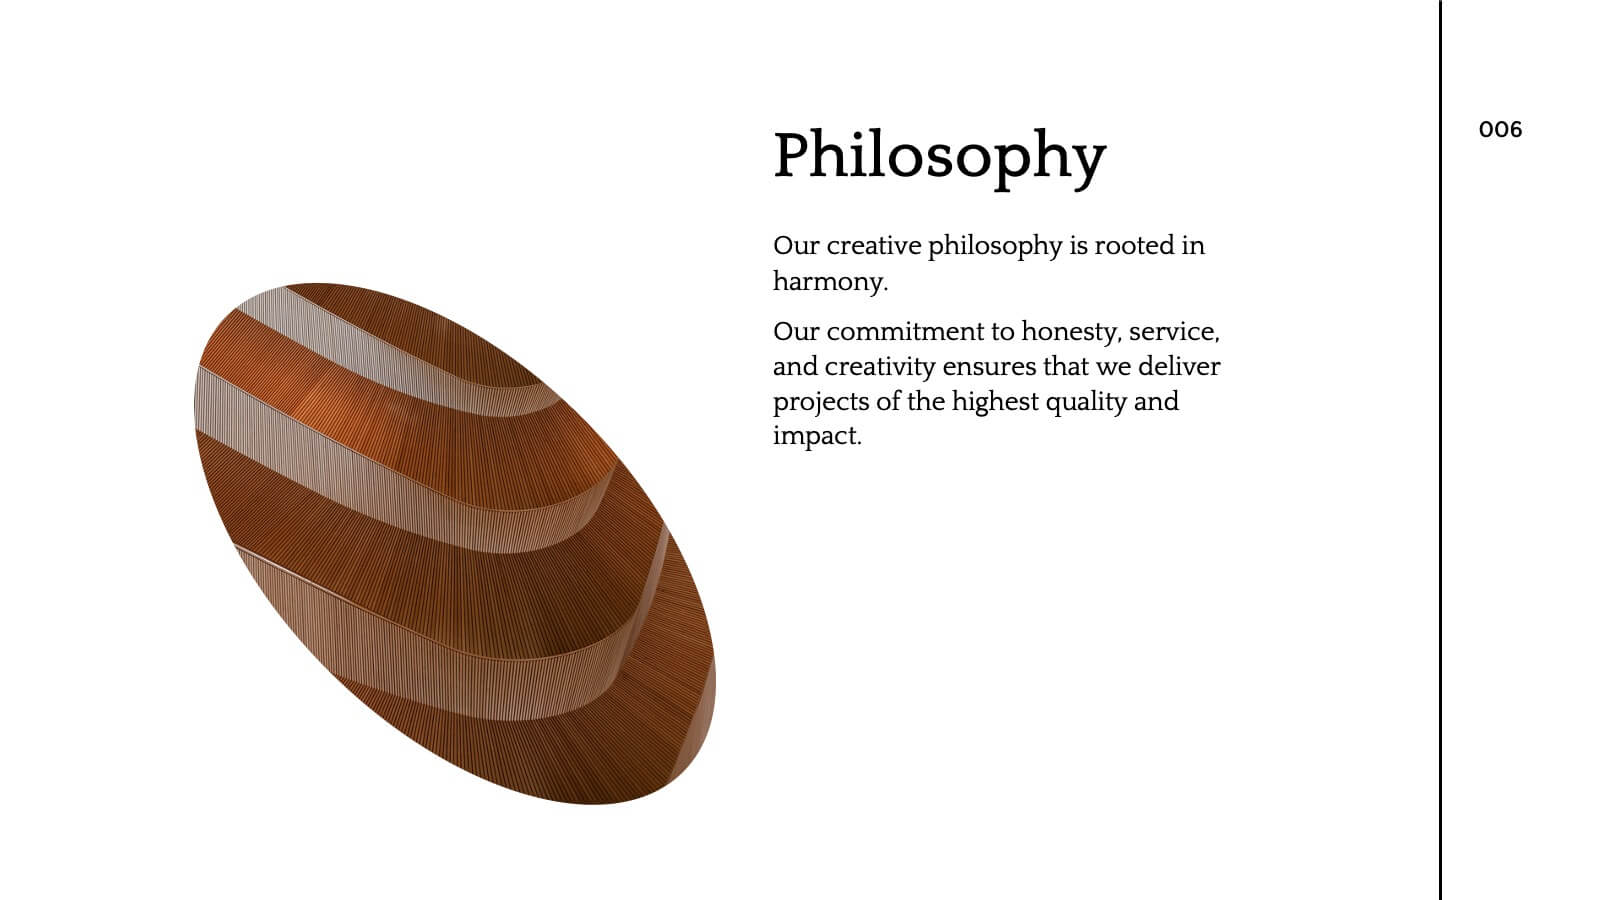
McKinsey 7S Framework
Visualize the interdependent elements of organizational success with this professional McKinsey 7S Framework template. Ideal for strategic planning, change management, or internal assessments, this editable slide highlights structure, systems, style, staff, skills, strategy, and shared values. Fully compatible with PowerPoint, Keynote, and Google Slides.
21 diapositivas
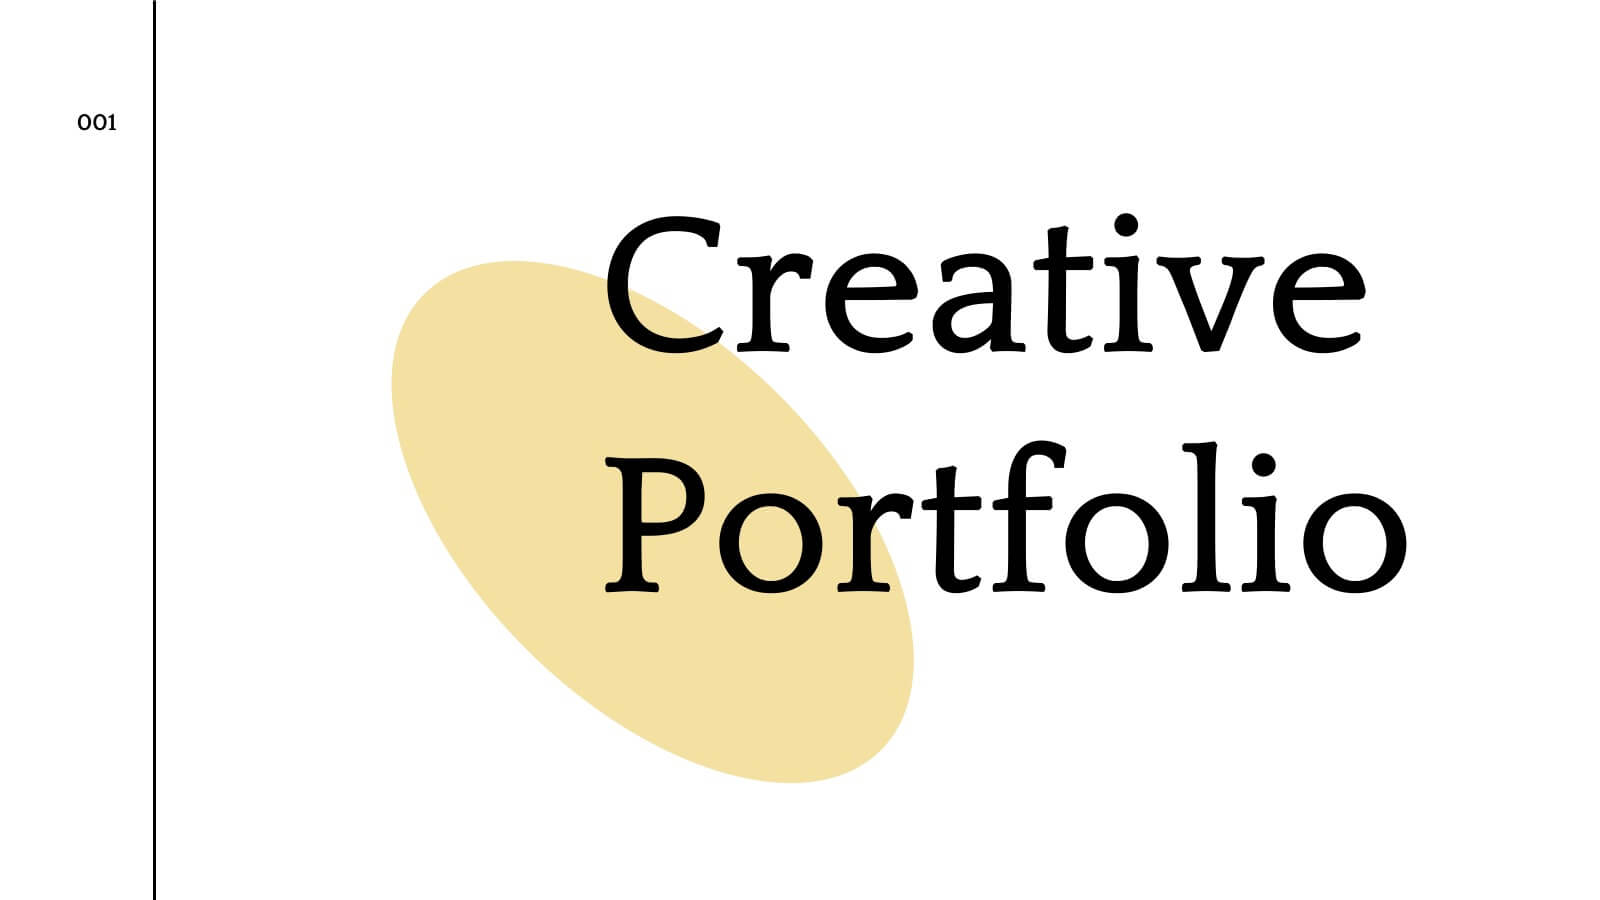
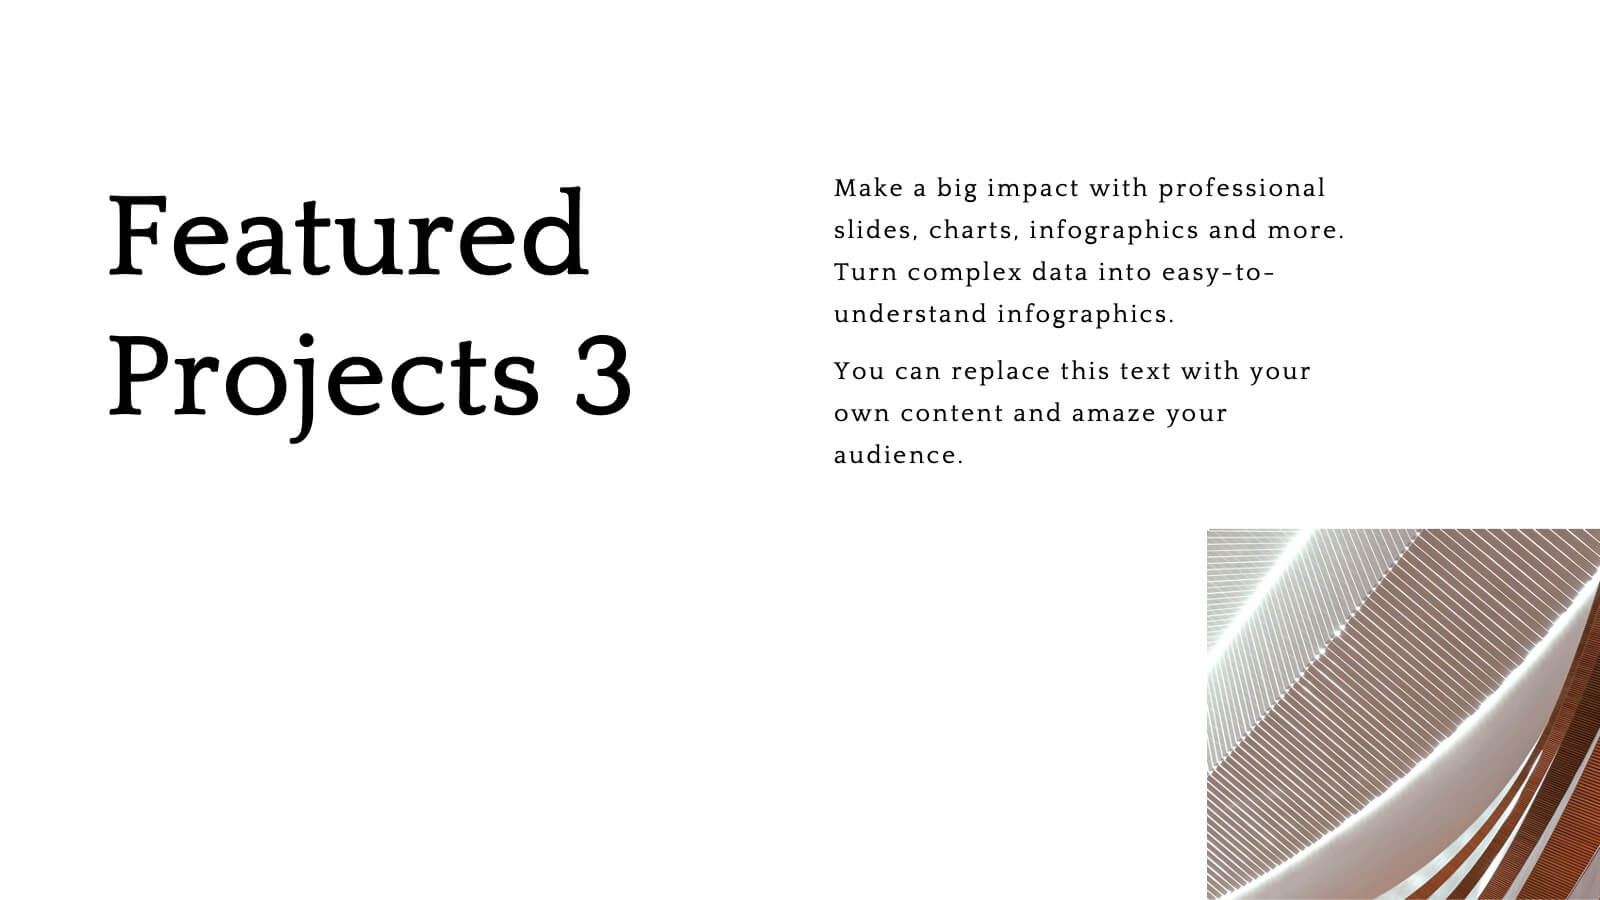
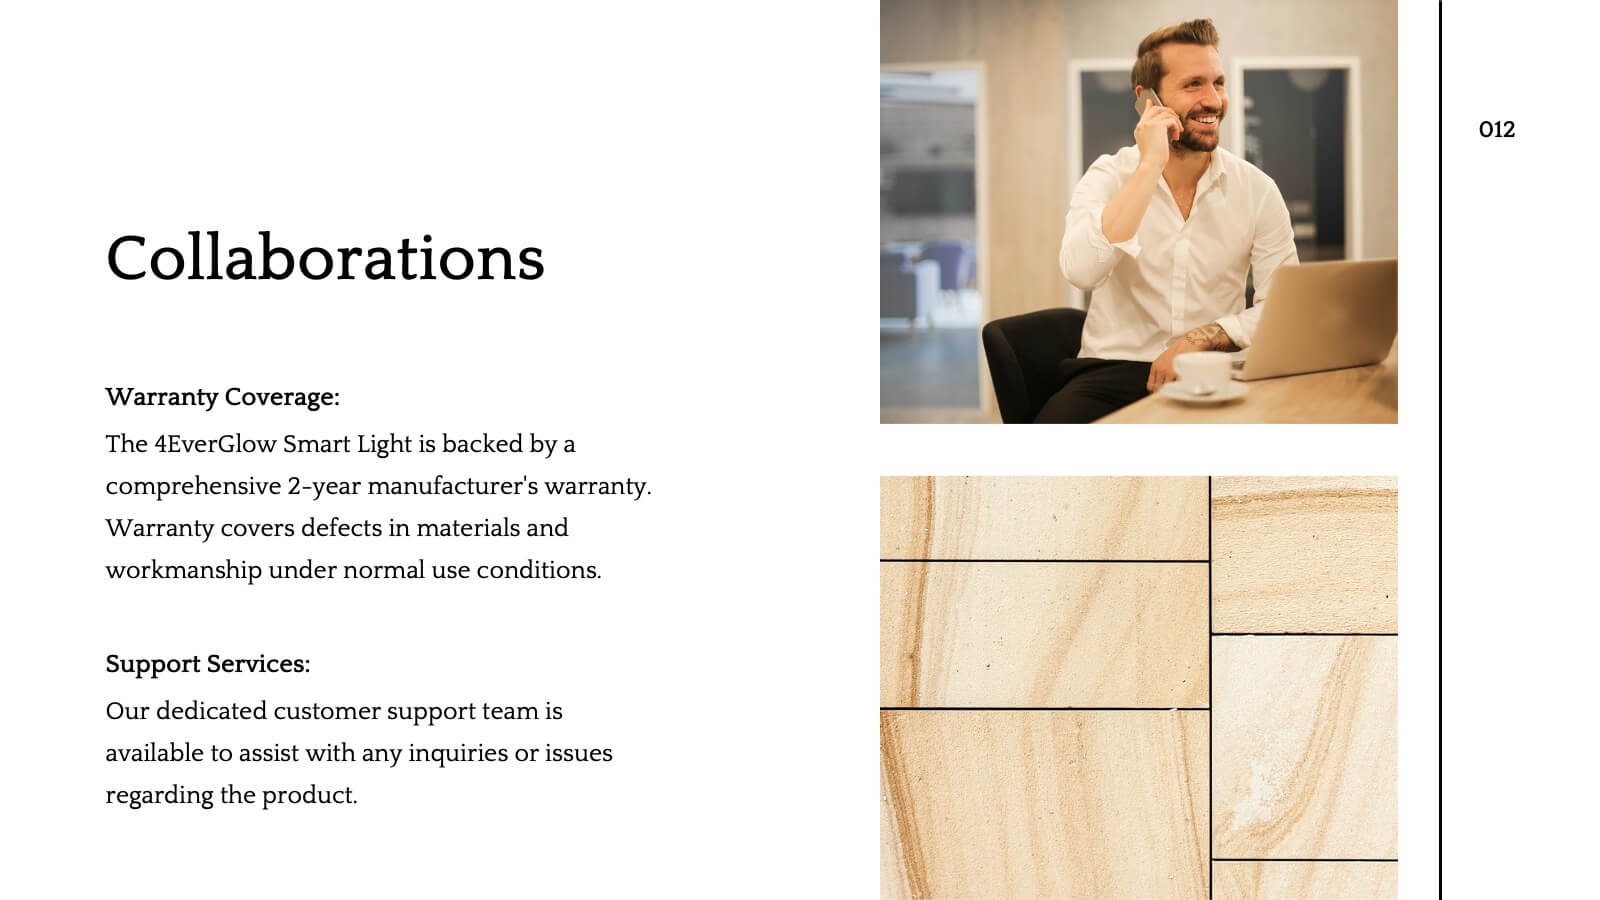
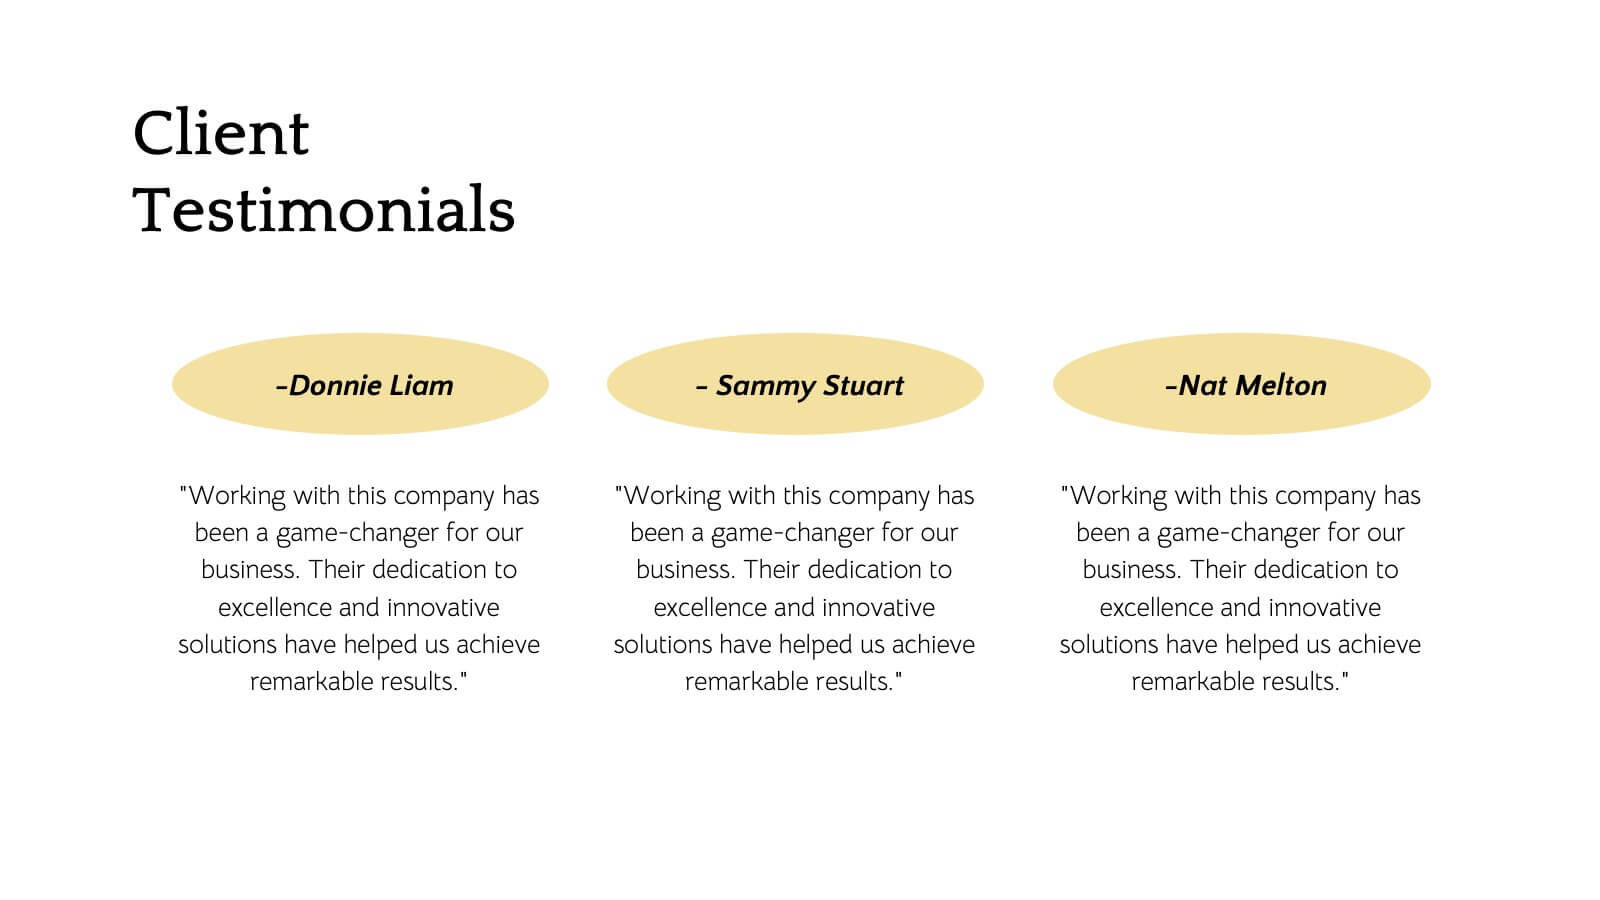
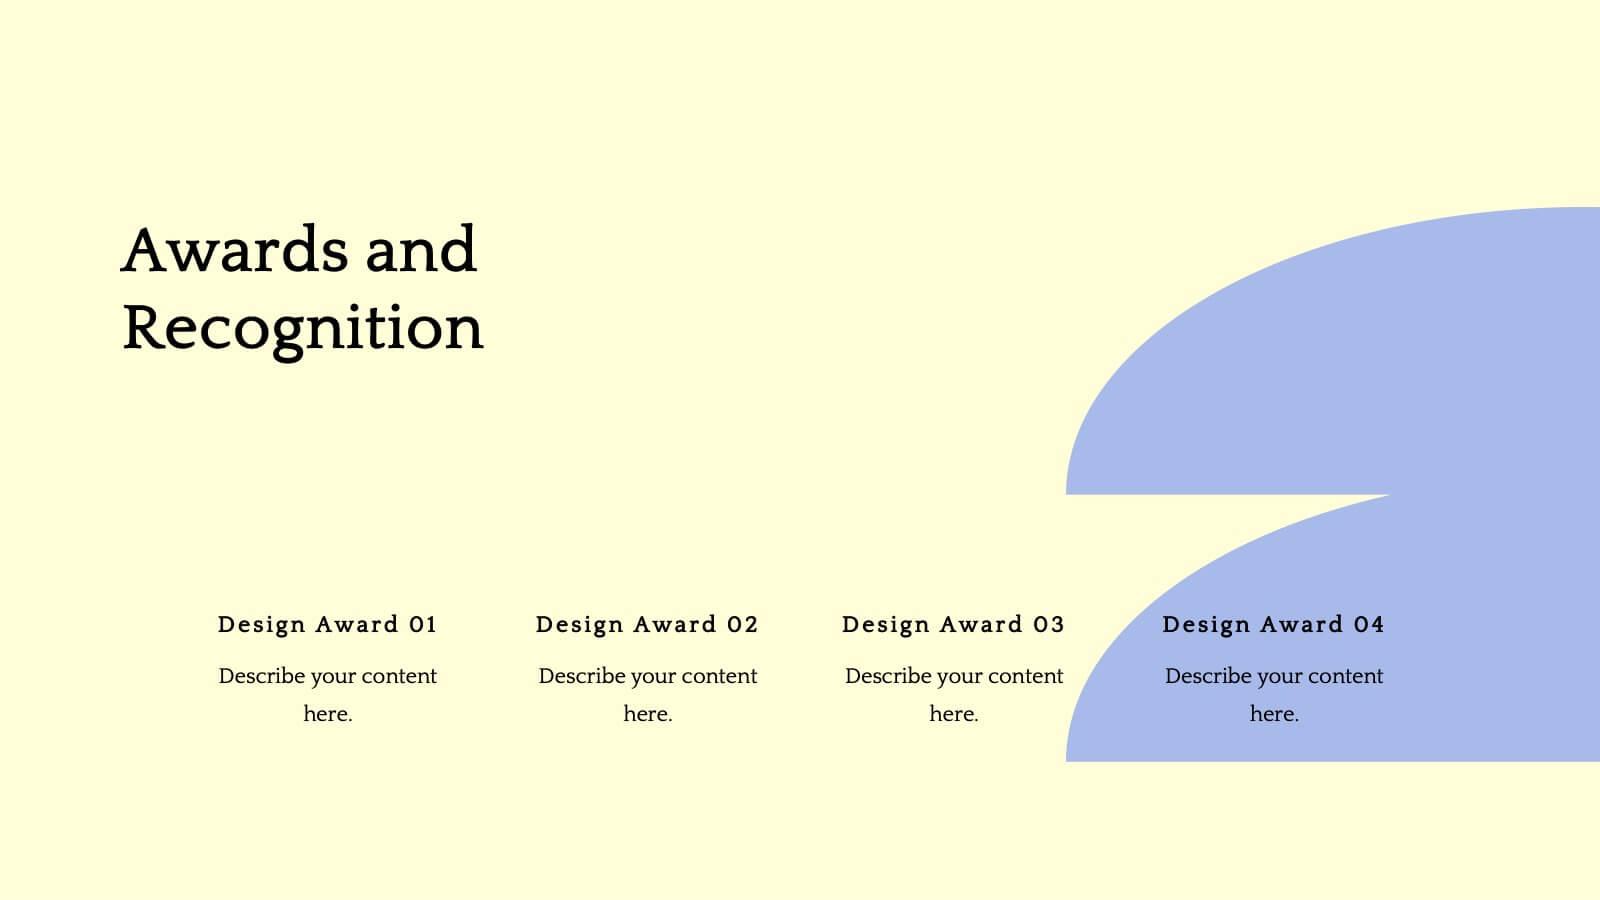
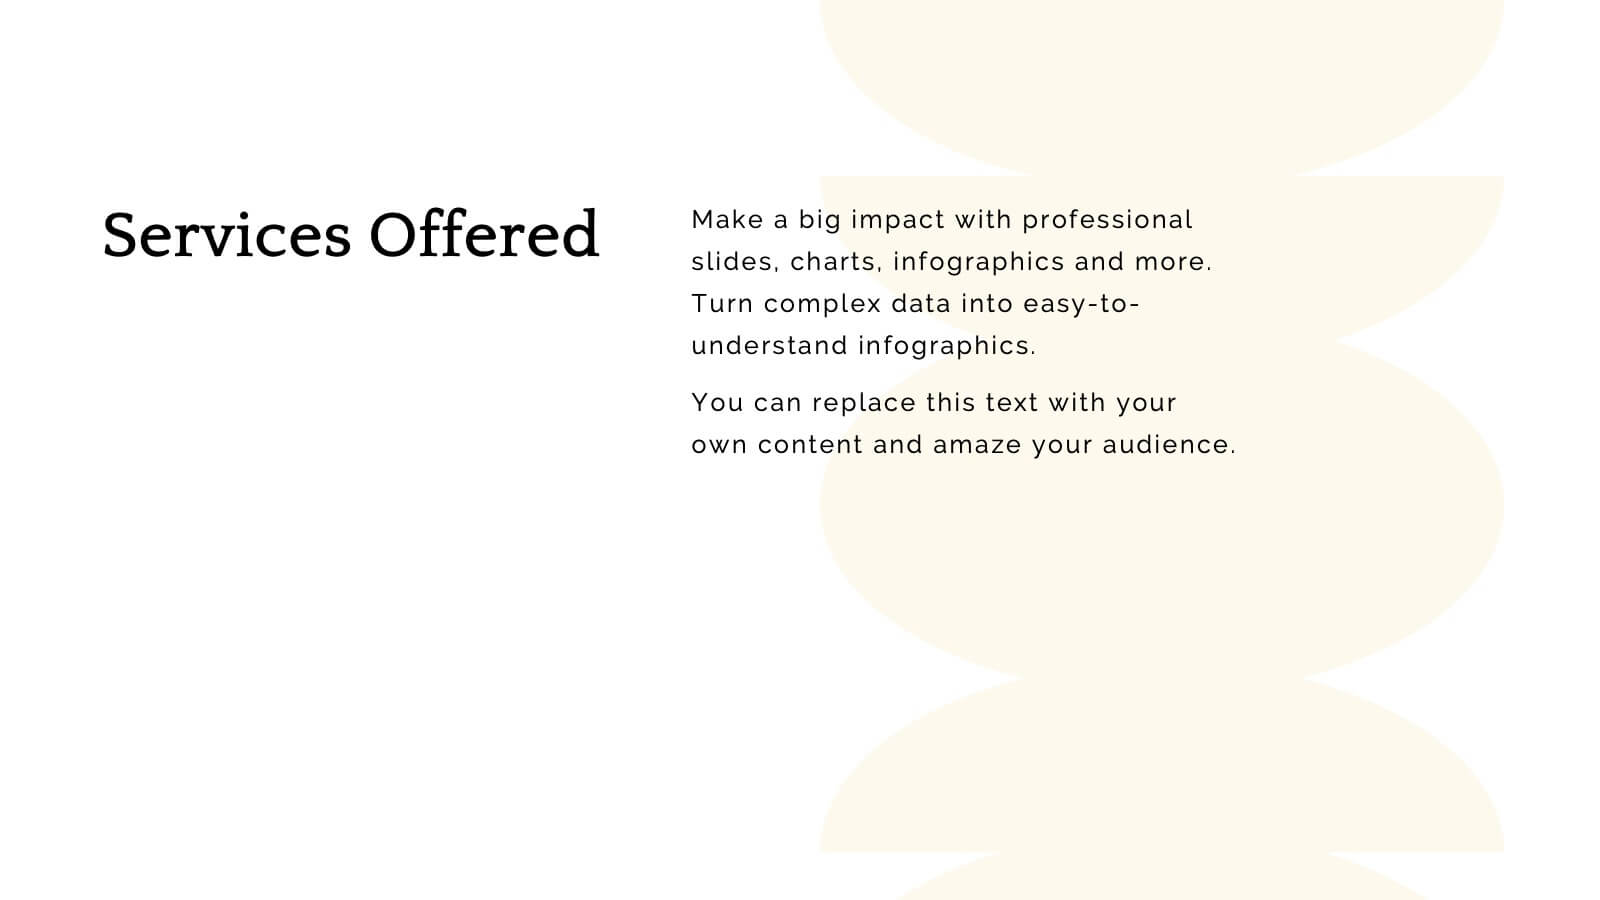
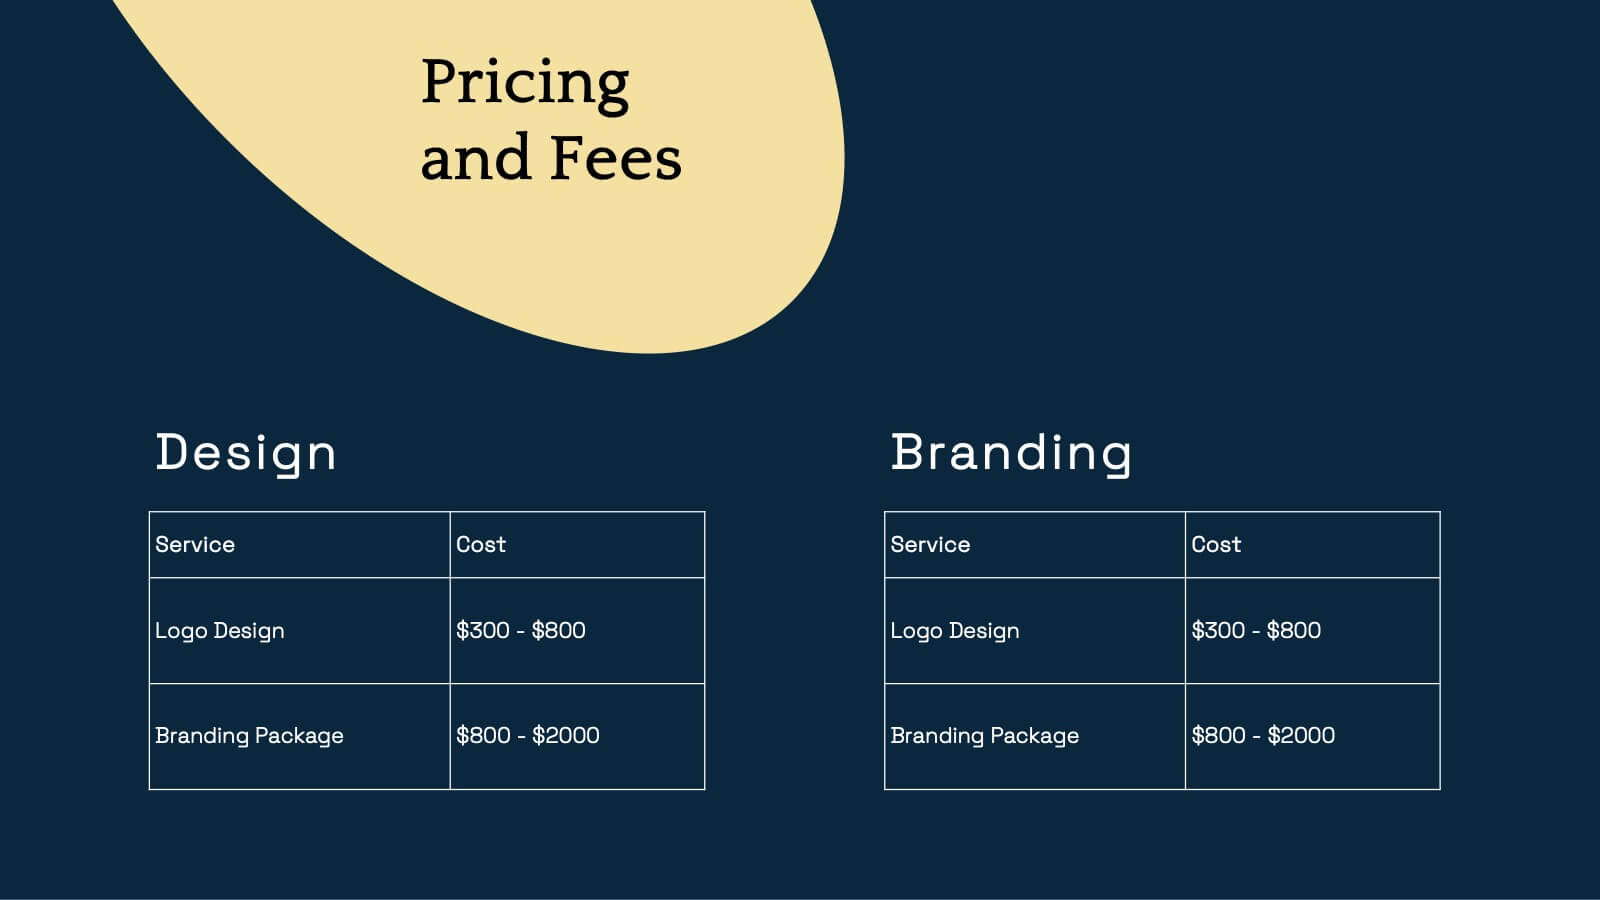
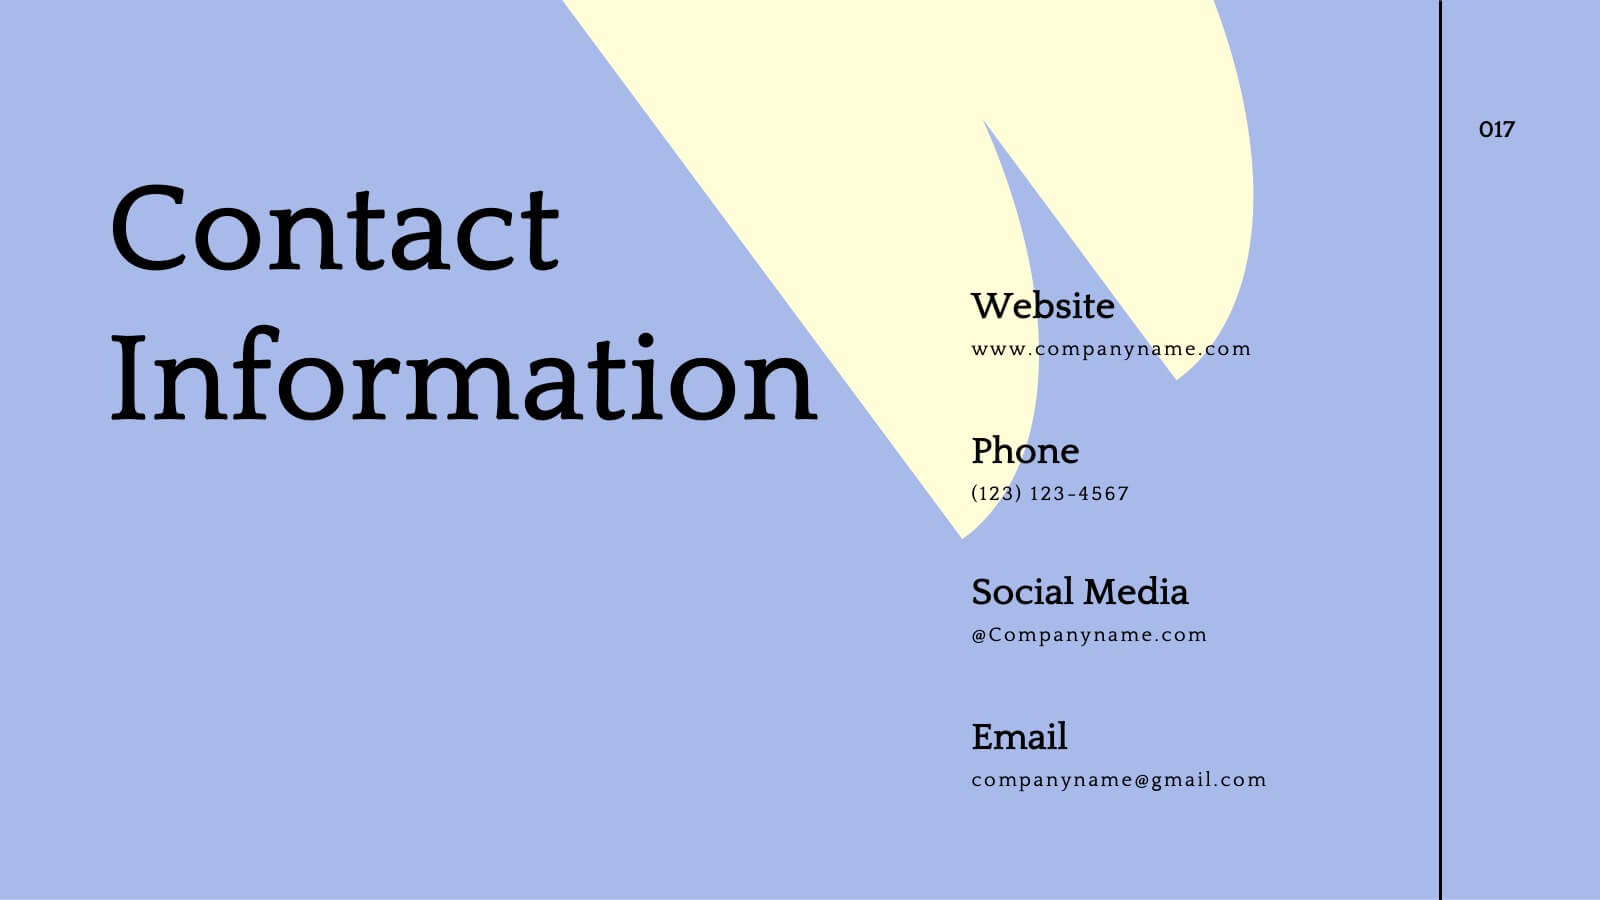
Flare Creative Portfolio Presentation
Showcase your creative work with this elegant portfolio template! Perfect for highlighting projects, client testimonials, and services offered. Ideal for artists, designers, and creatives aiming to impress clients and collaborators. Compatible with PowerPoint, Keynote, and Google Slides, this template ensures your portfolio is clear, professional, and visually stunning. Make your work shine!


5 diapositivas
Editable Mind Mapping Presentation
Clarify complex thoughts with the Editable Mind Mapping Presentation. This sleek template features a central profile design with five branching points to visualize ideas, processes, or strategies. It's perfect for brainstorming sessions, team collaboration, or project planning. Fully customizable and compatible with PowerPoint, Keynote, and Google Slides.


6 diapositivas
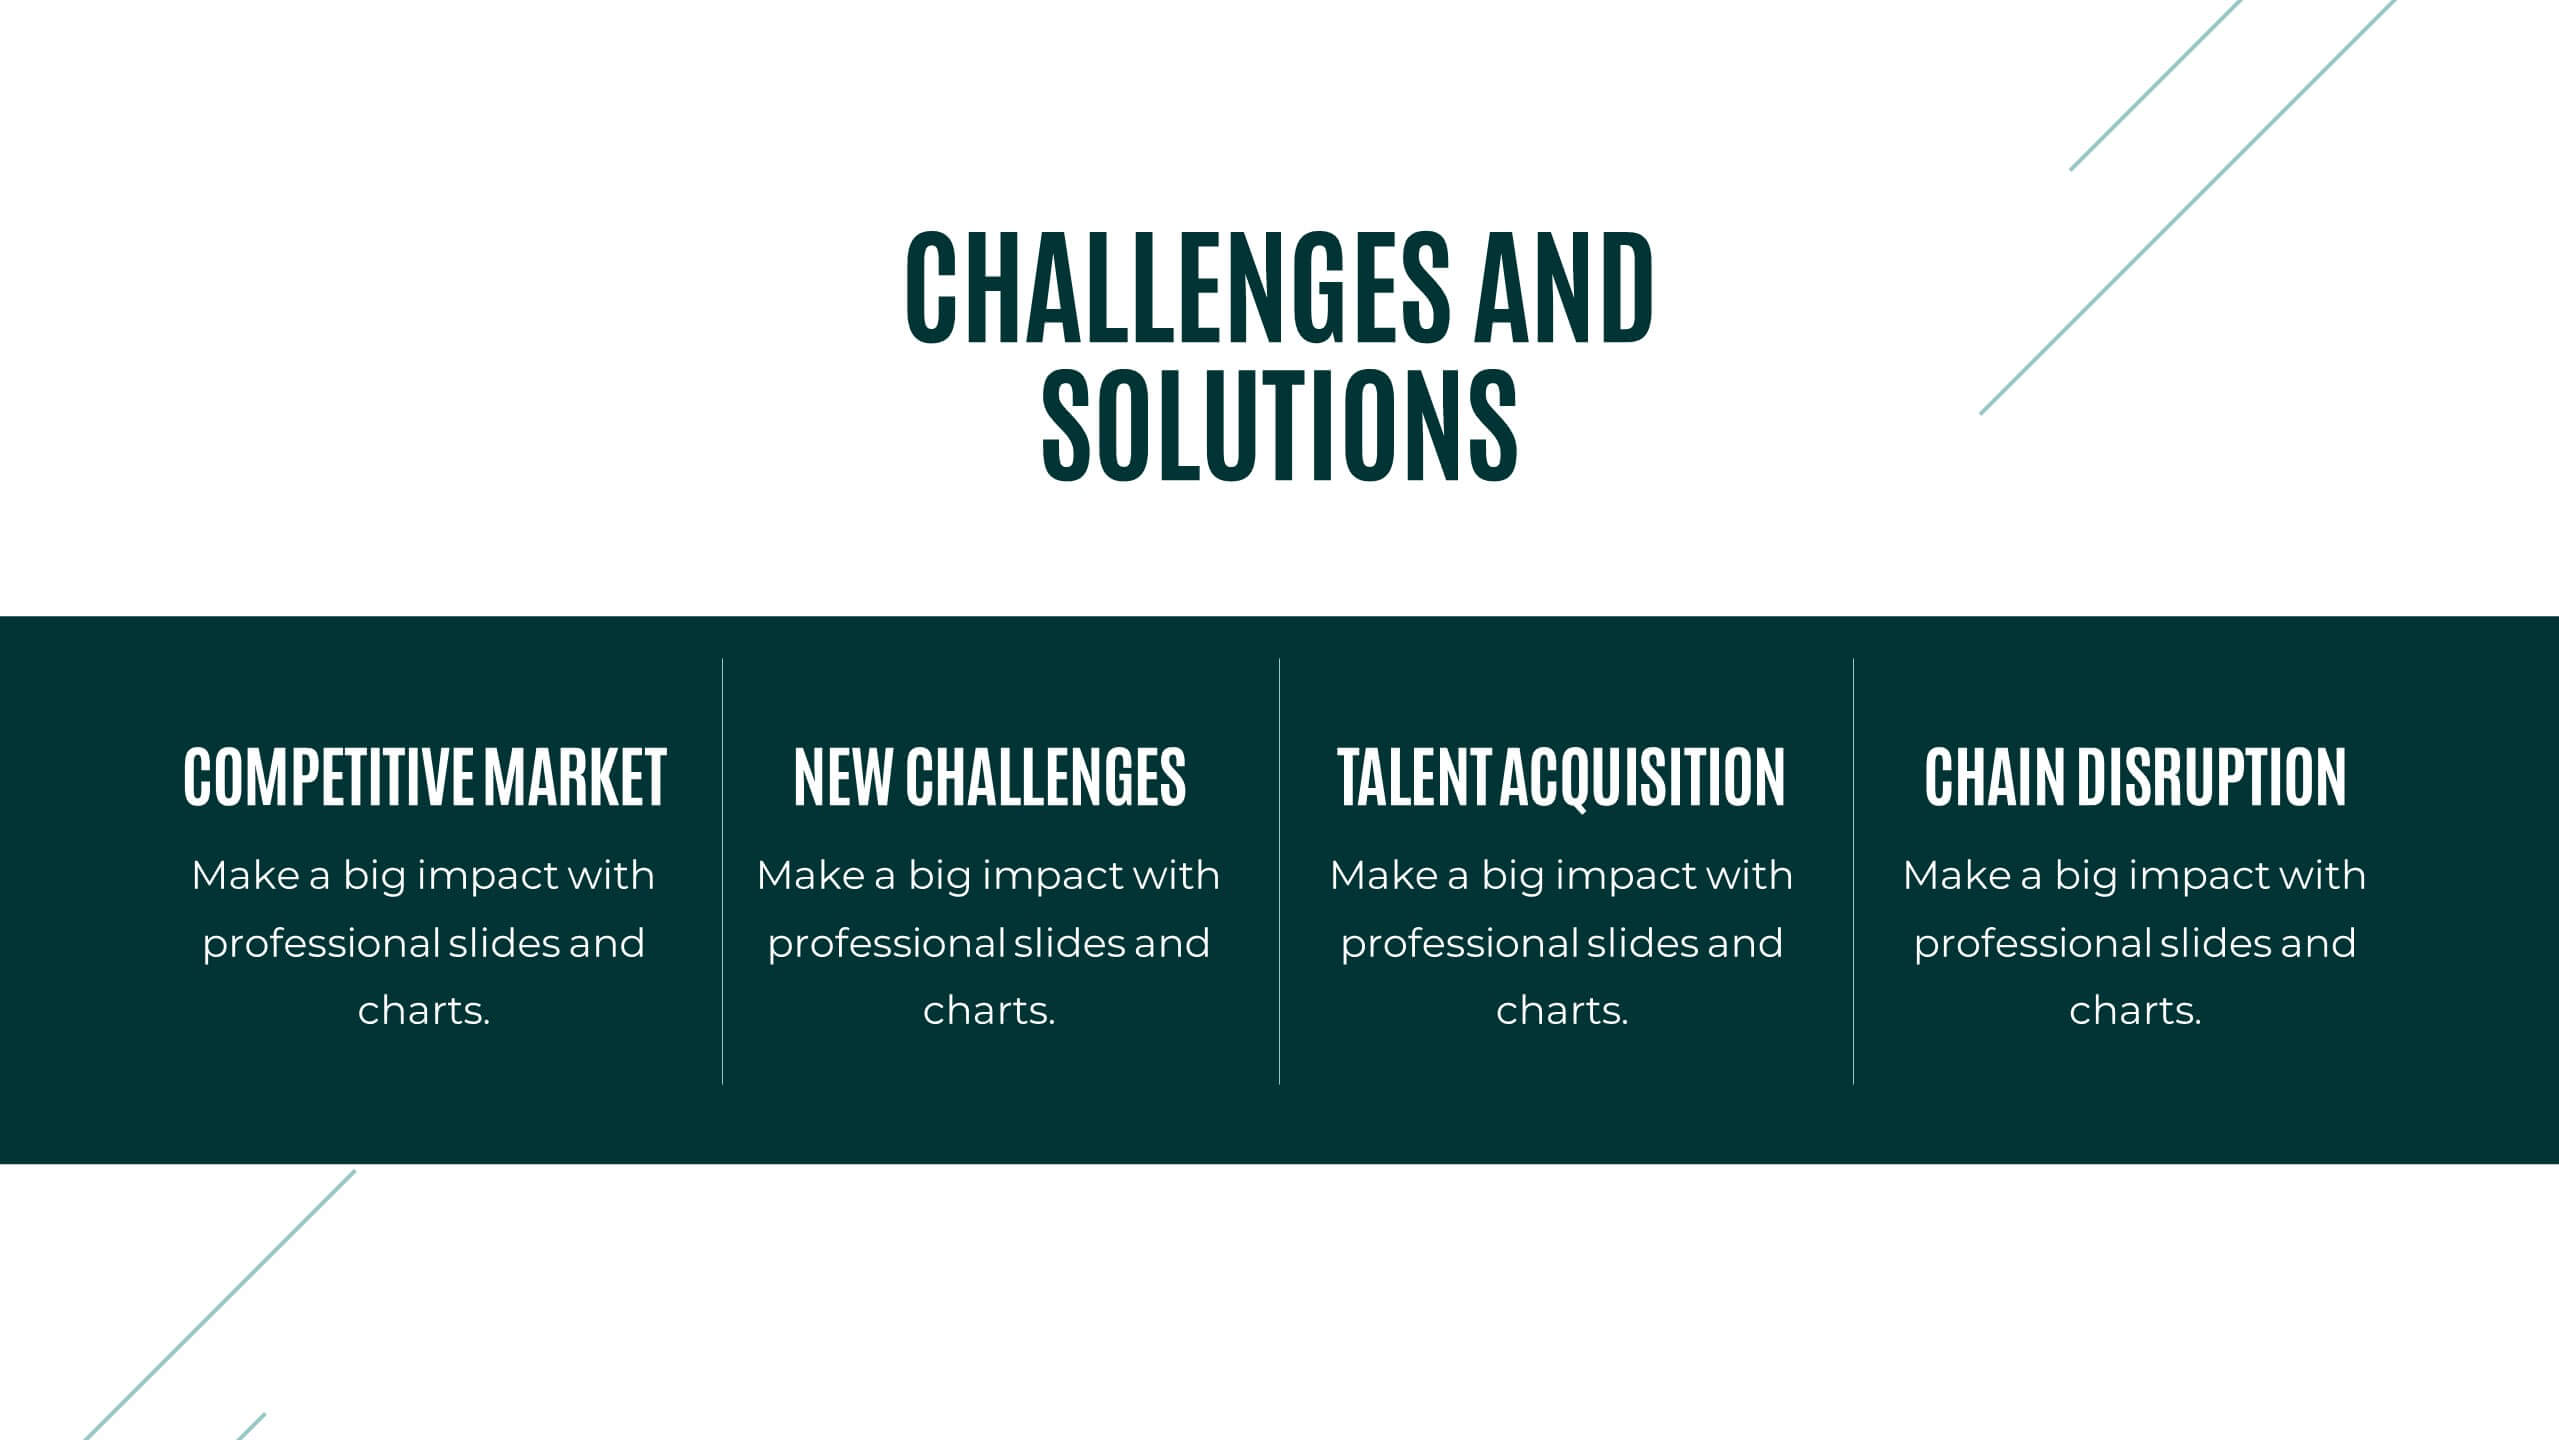
Create Challenge Infographic
Challenges are obstacles, difficulties, or problems that individuals, organizations, or societies face while trying to achieve their goals or navigate through various situations. This infographic template involves visually presenting a specific challenge, its context, and possible solutions in an informative way. Summarize the key takeaways from the infographic, emphasizing the importance of addressing the challenge and implementing the suggested solutions. An effective challenge infographic can be used for educational purposes, presentations, or as a reference guide to help individuals and teams overcome challenges in a structured and informed manner.


22 diapositivas
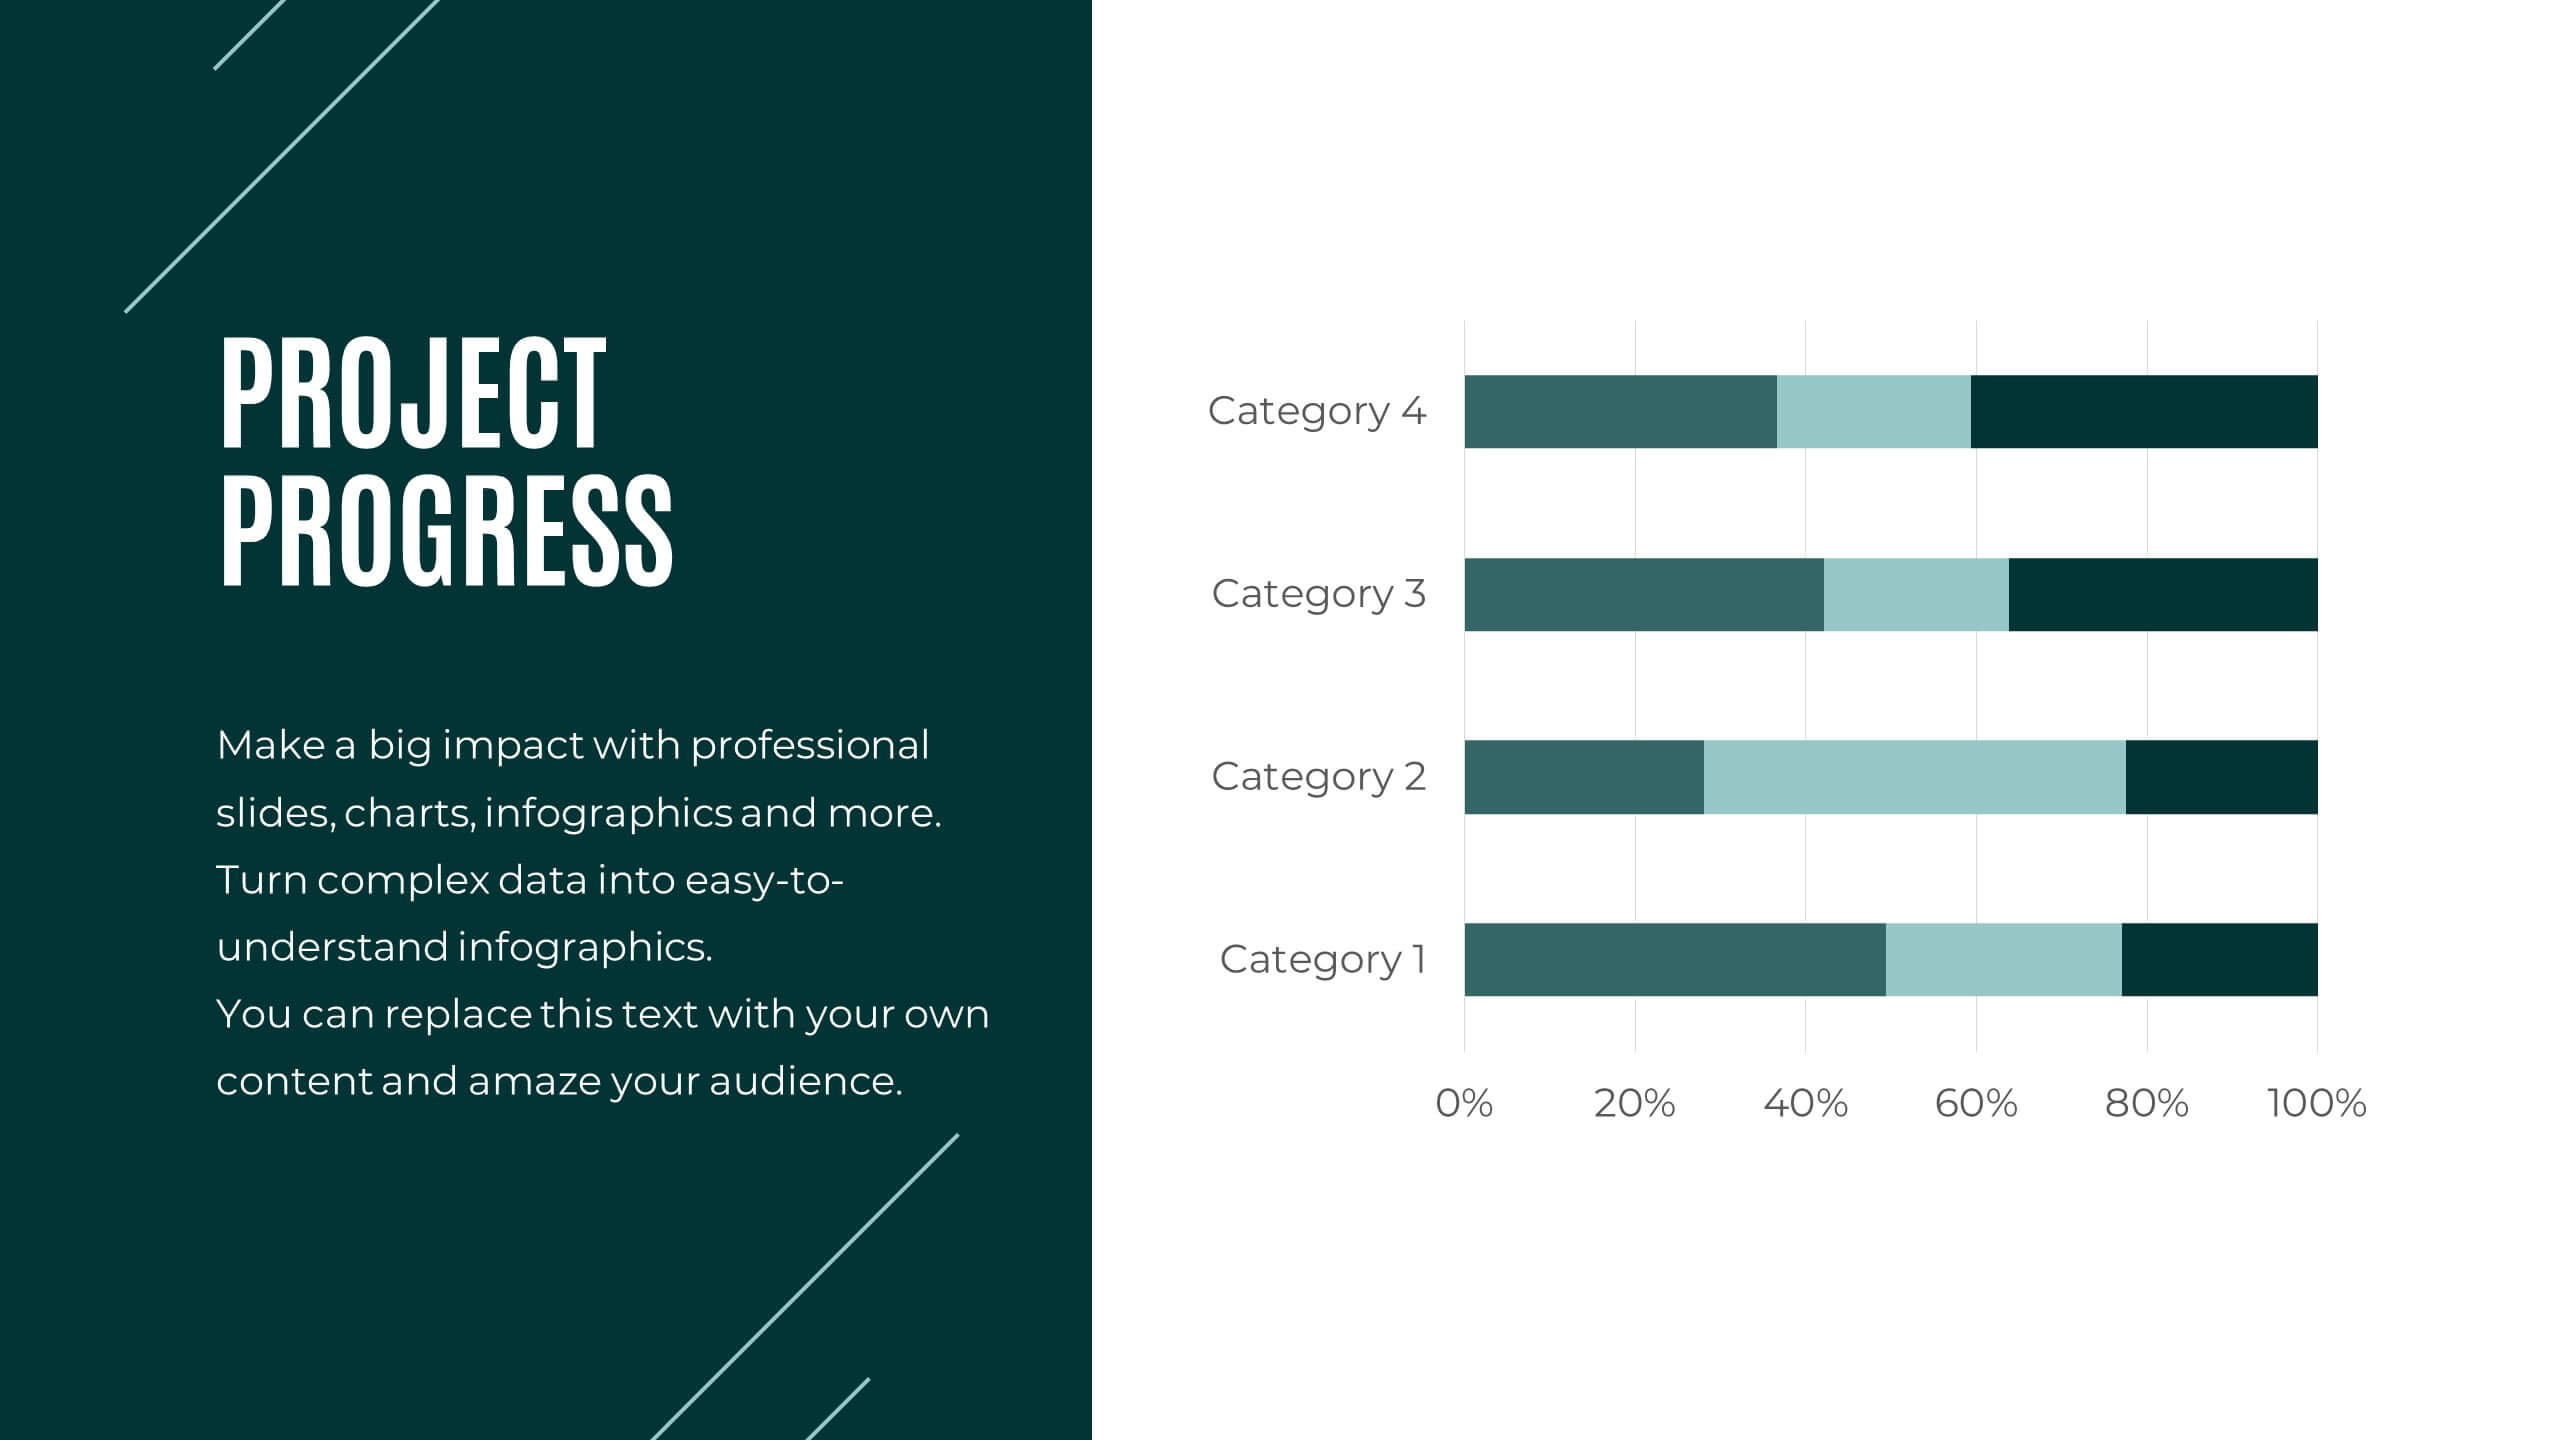
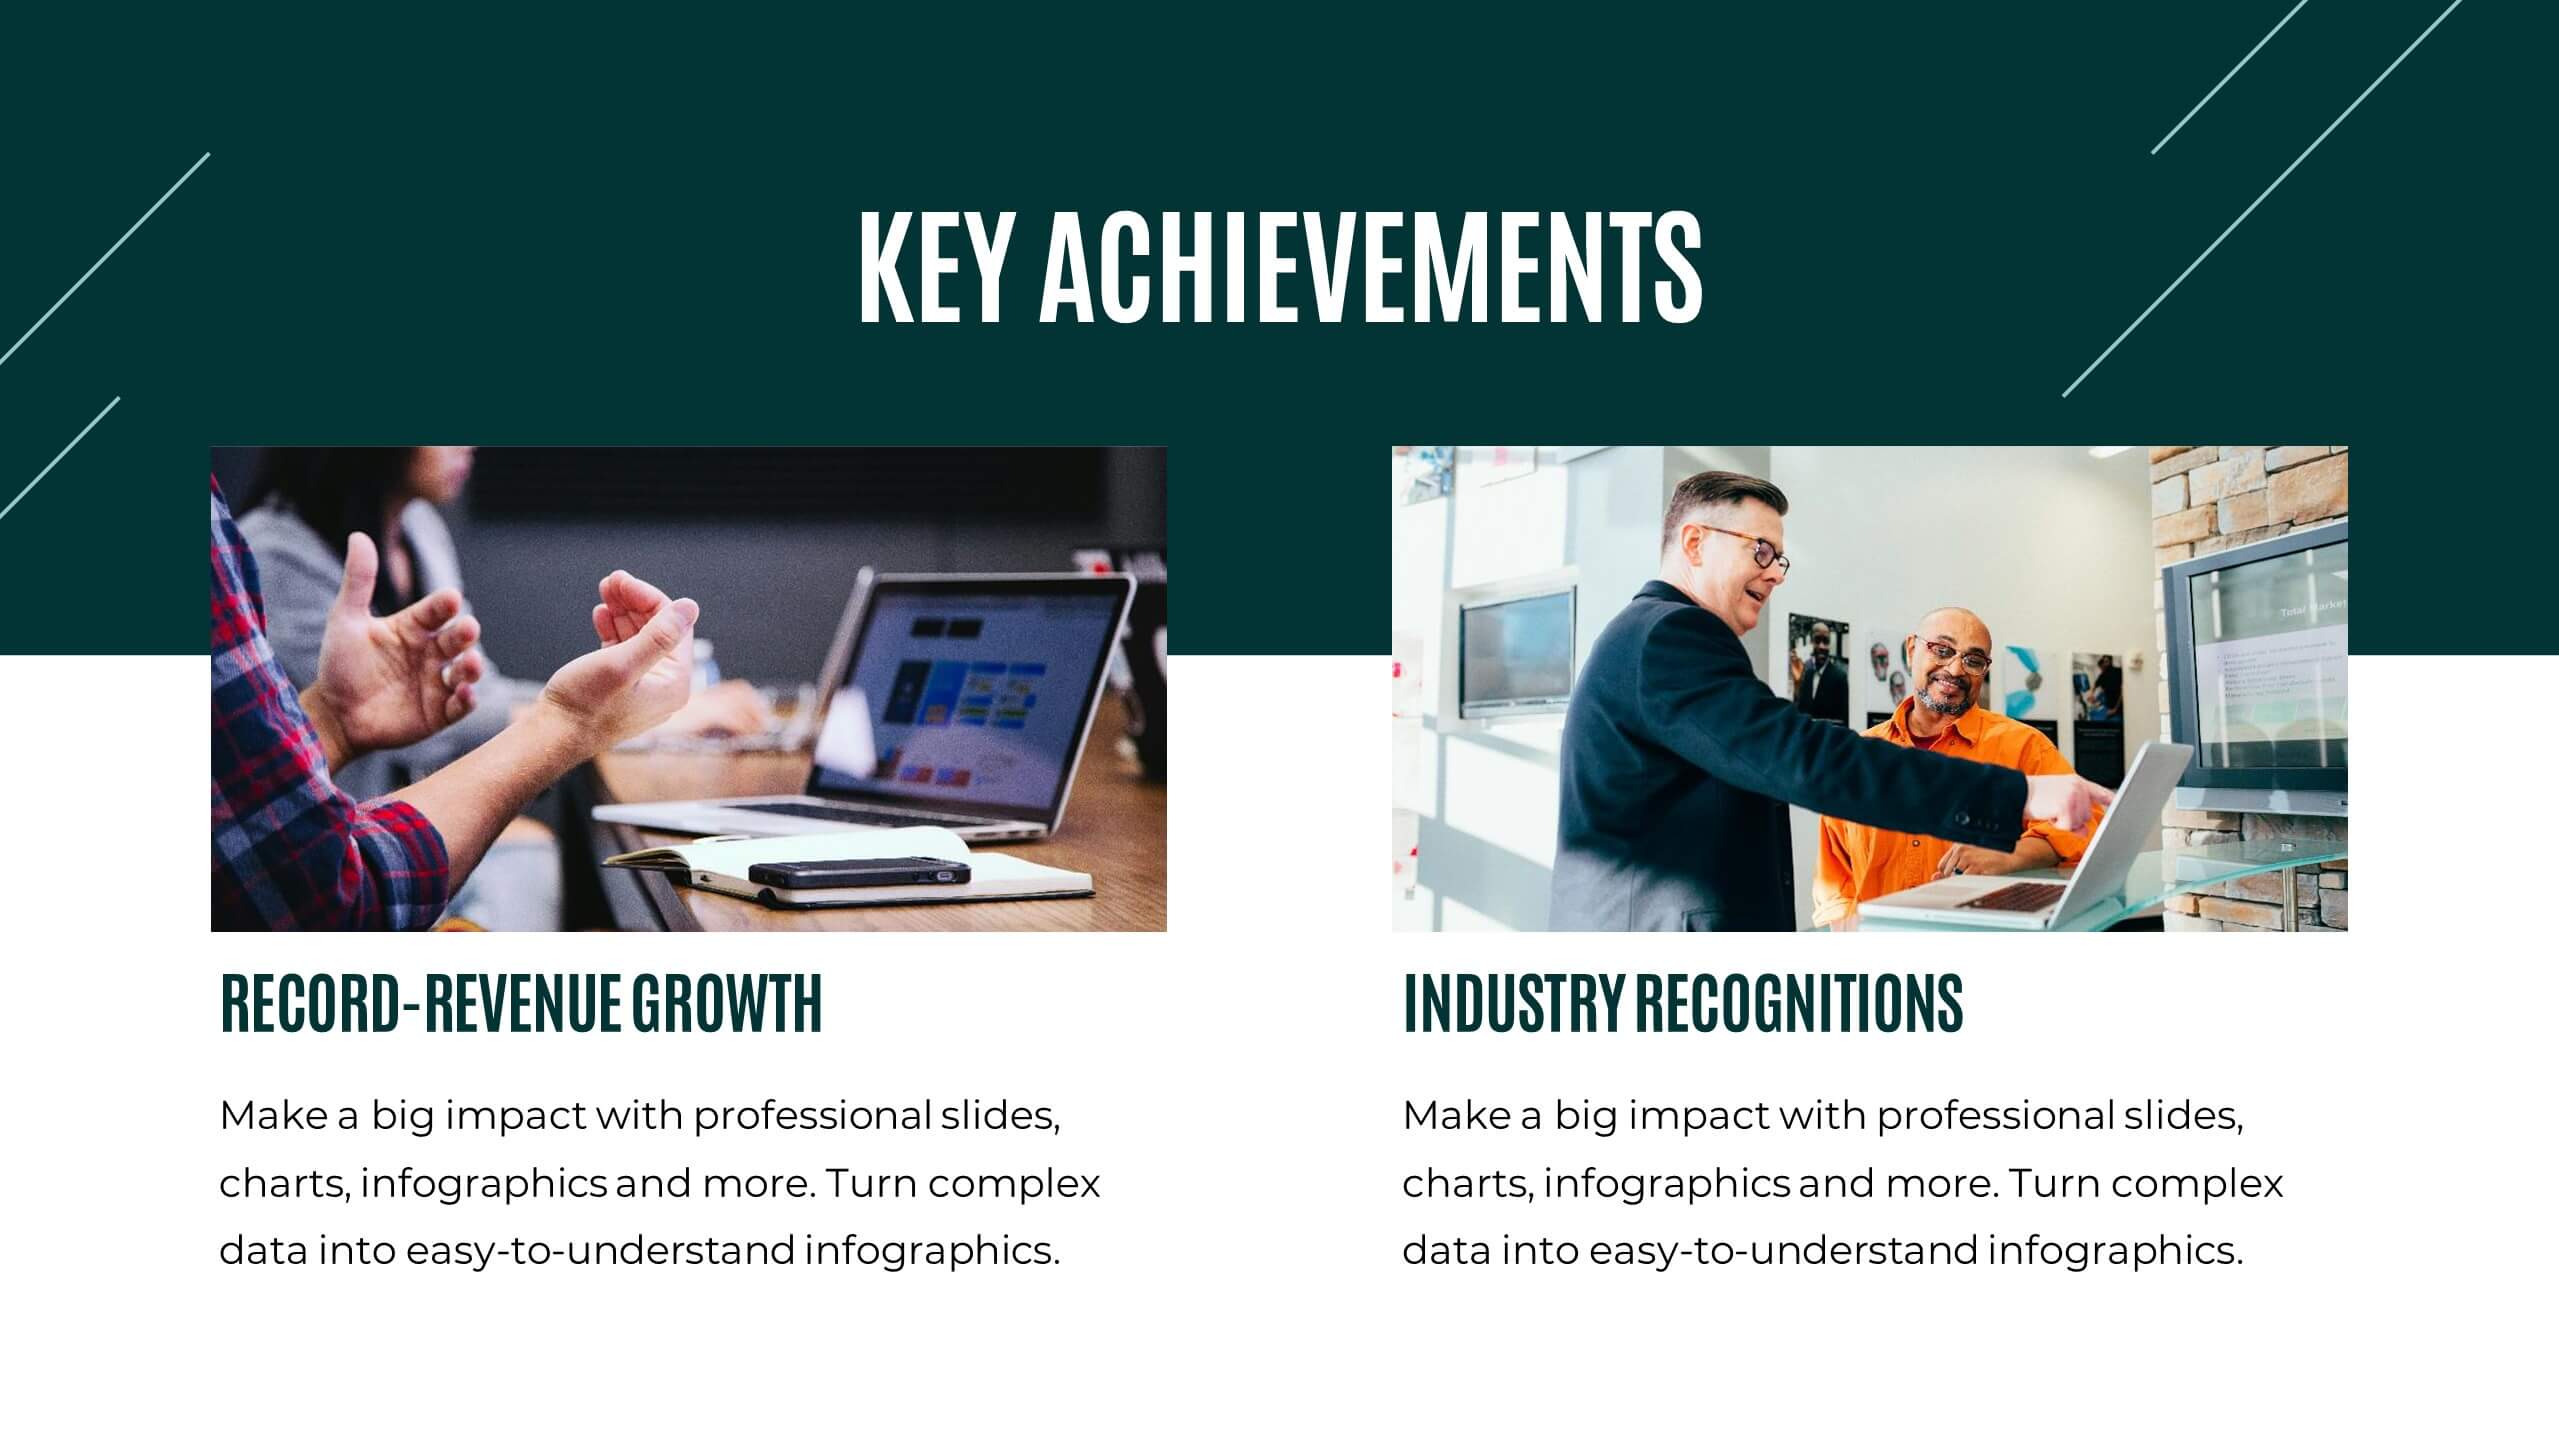
Prism Project Status Report Presentation
Deliver impactful updates with this comprehensive project status report template! Perfect for presenting key highlights, performance metrics, and strategic initiatives. Ideal for project managers aiming to keep stakeholders informed and aligned. Compatible with PowerPoint, Keynote, and Google Slides, this template ensures your reports are clear, professional, and engaging. Keep projects on track!


4 diapositivas
Healthcare Impact on Breast Cancer Day Presentation
Educate and inspire with the Healthcare Impact on Breast Cancer Day Presentation. This thoughtfully designed layout uses meaningful visuals to highlight data, awareness efforts, and key messages around breast cancer healthcare. Ideal for awareness campaigns, health reports, or nonprofit presentations. Fully editable in PowerPoint, Google Slides, Keynote, and Canva.


5 diapositivas
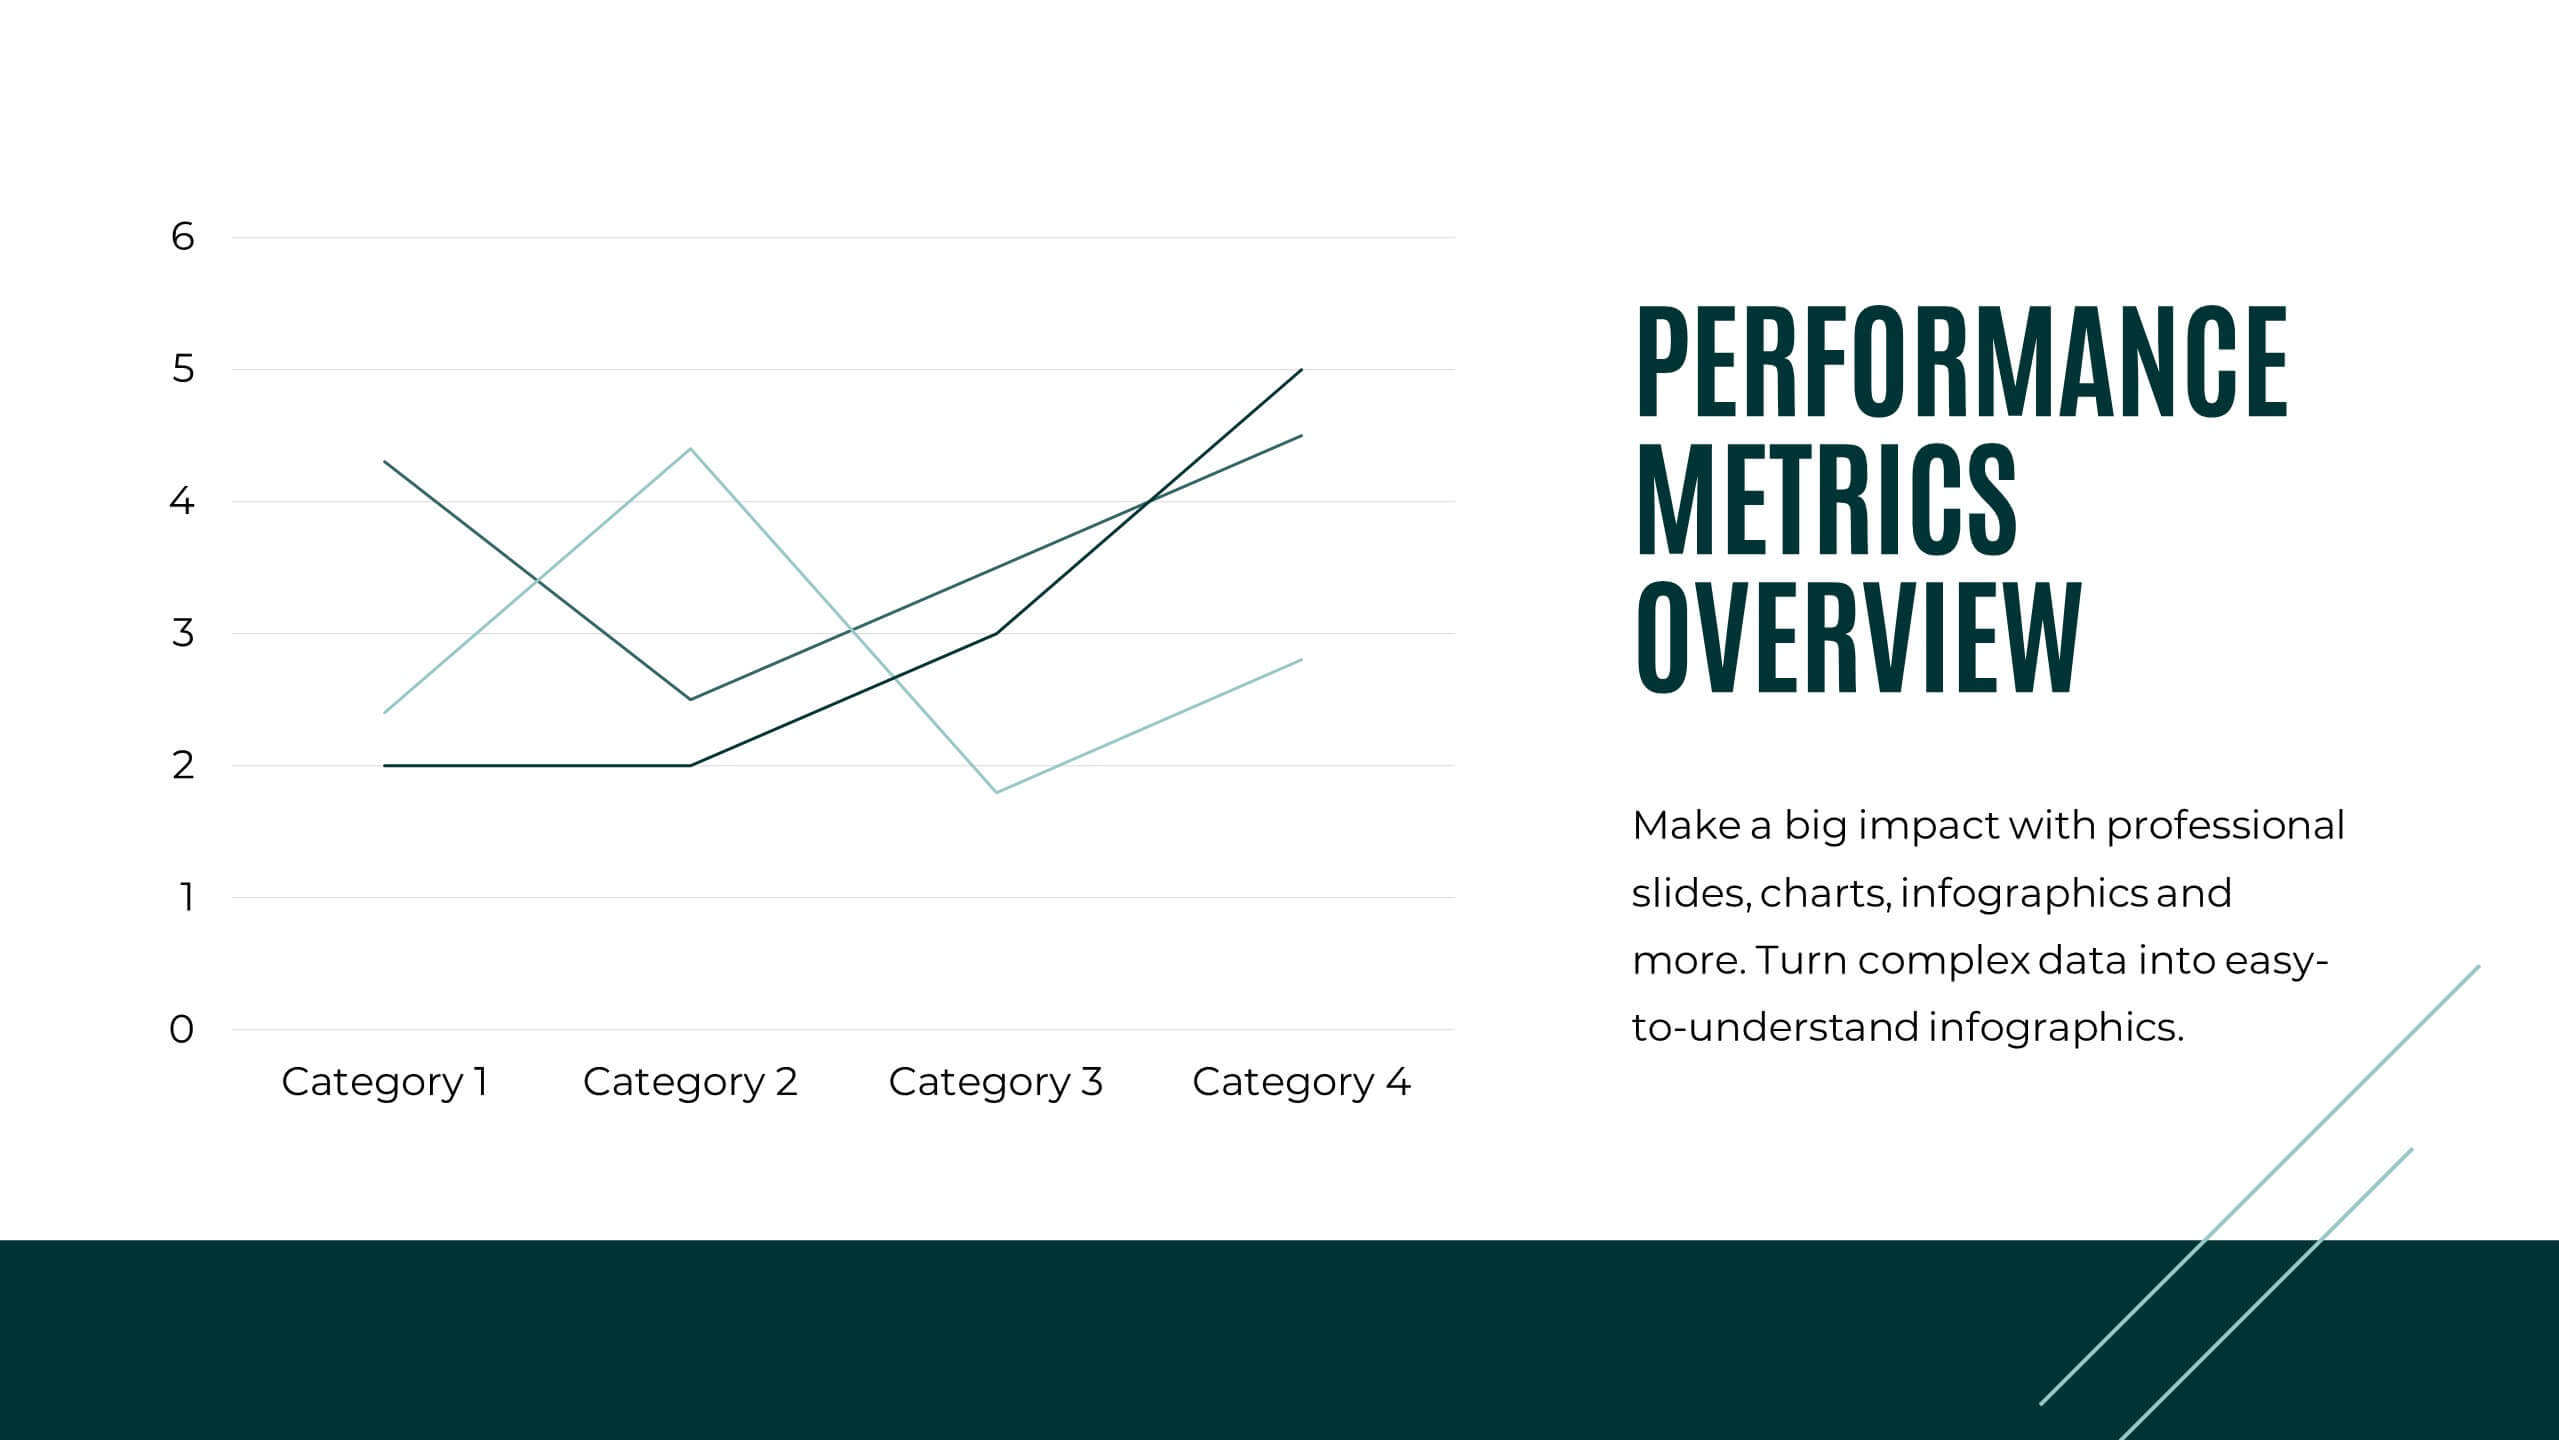
Business KPI Performance Presentation
Bring your business results to life with a clear, modern layout designed to showcase key metrics and performance goals. Perfect for tracking growth, progress, and success indicators, this visual design helps make data easy to understand and engaging. Fully editable in PowerPoint, Keynote, and Google Slides.


5 diapositivas
Strategic Business Pillars Model Presentation
Visualize your core strategies with this vertical pillar infographic slide. Each level represents a key focus area or foundational element essential for business success. Ideal for leadership talks, team alignment, or growth strategies. Fully editable in PowerPoint, Keynote, and Google Slides.


7 diapositivas
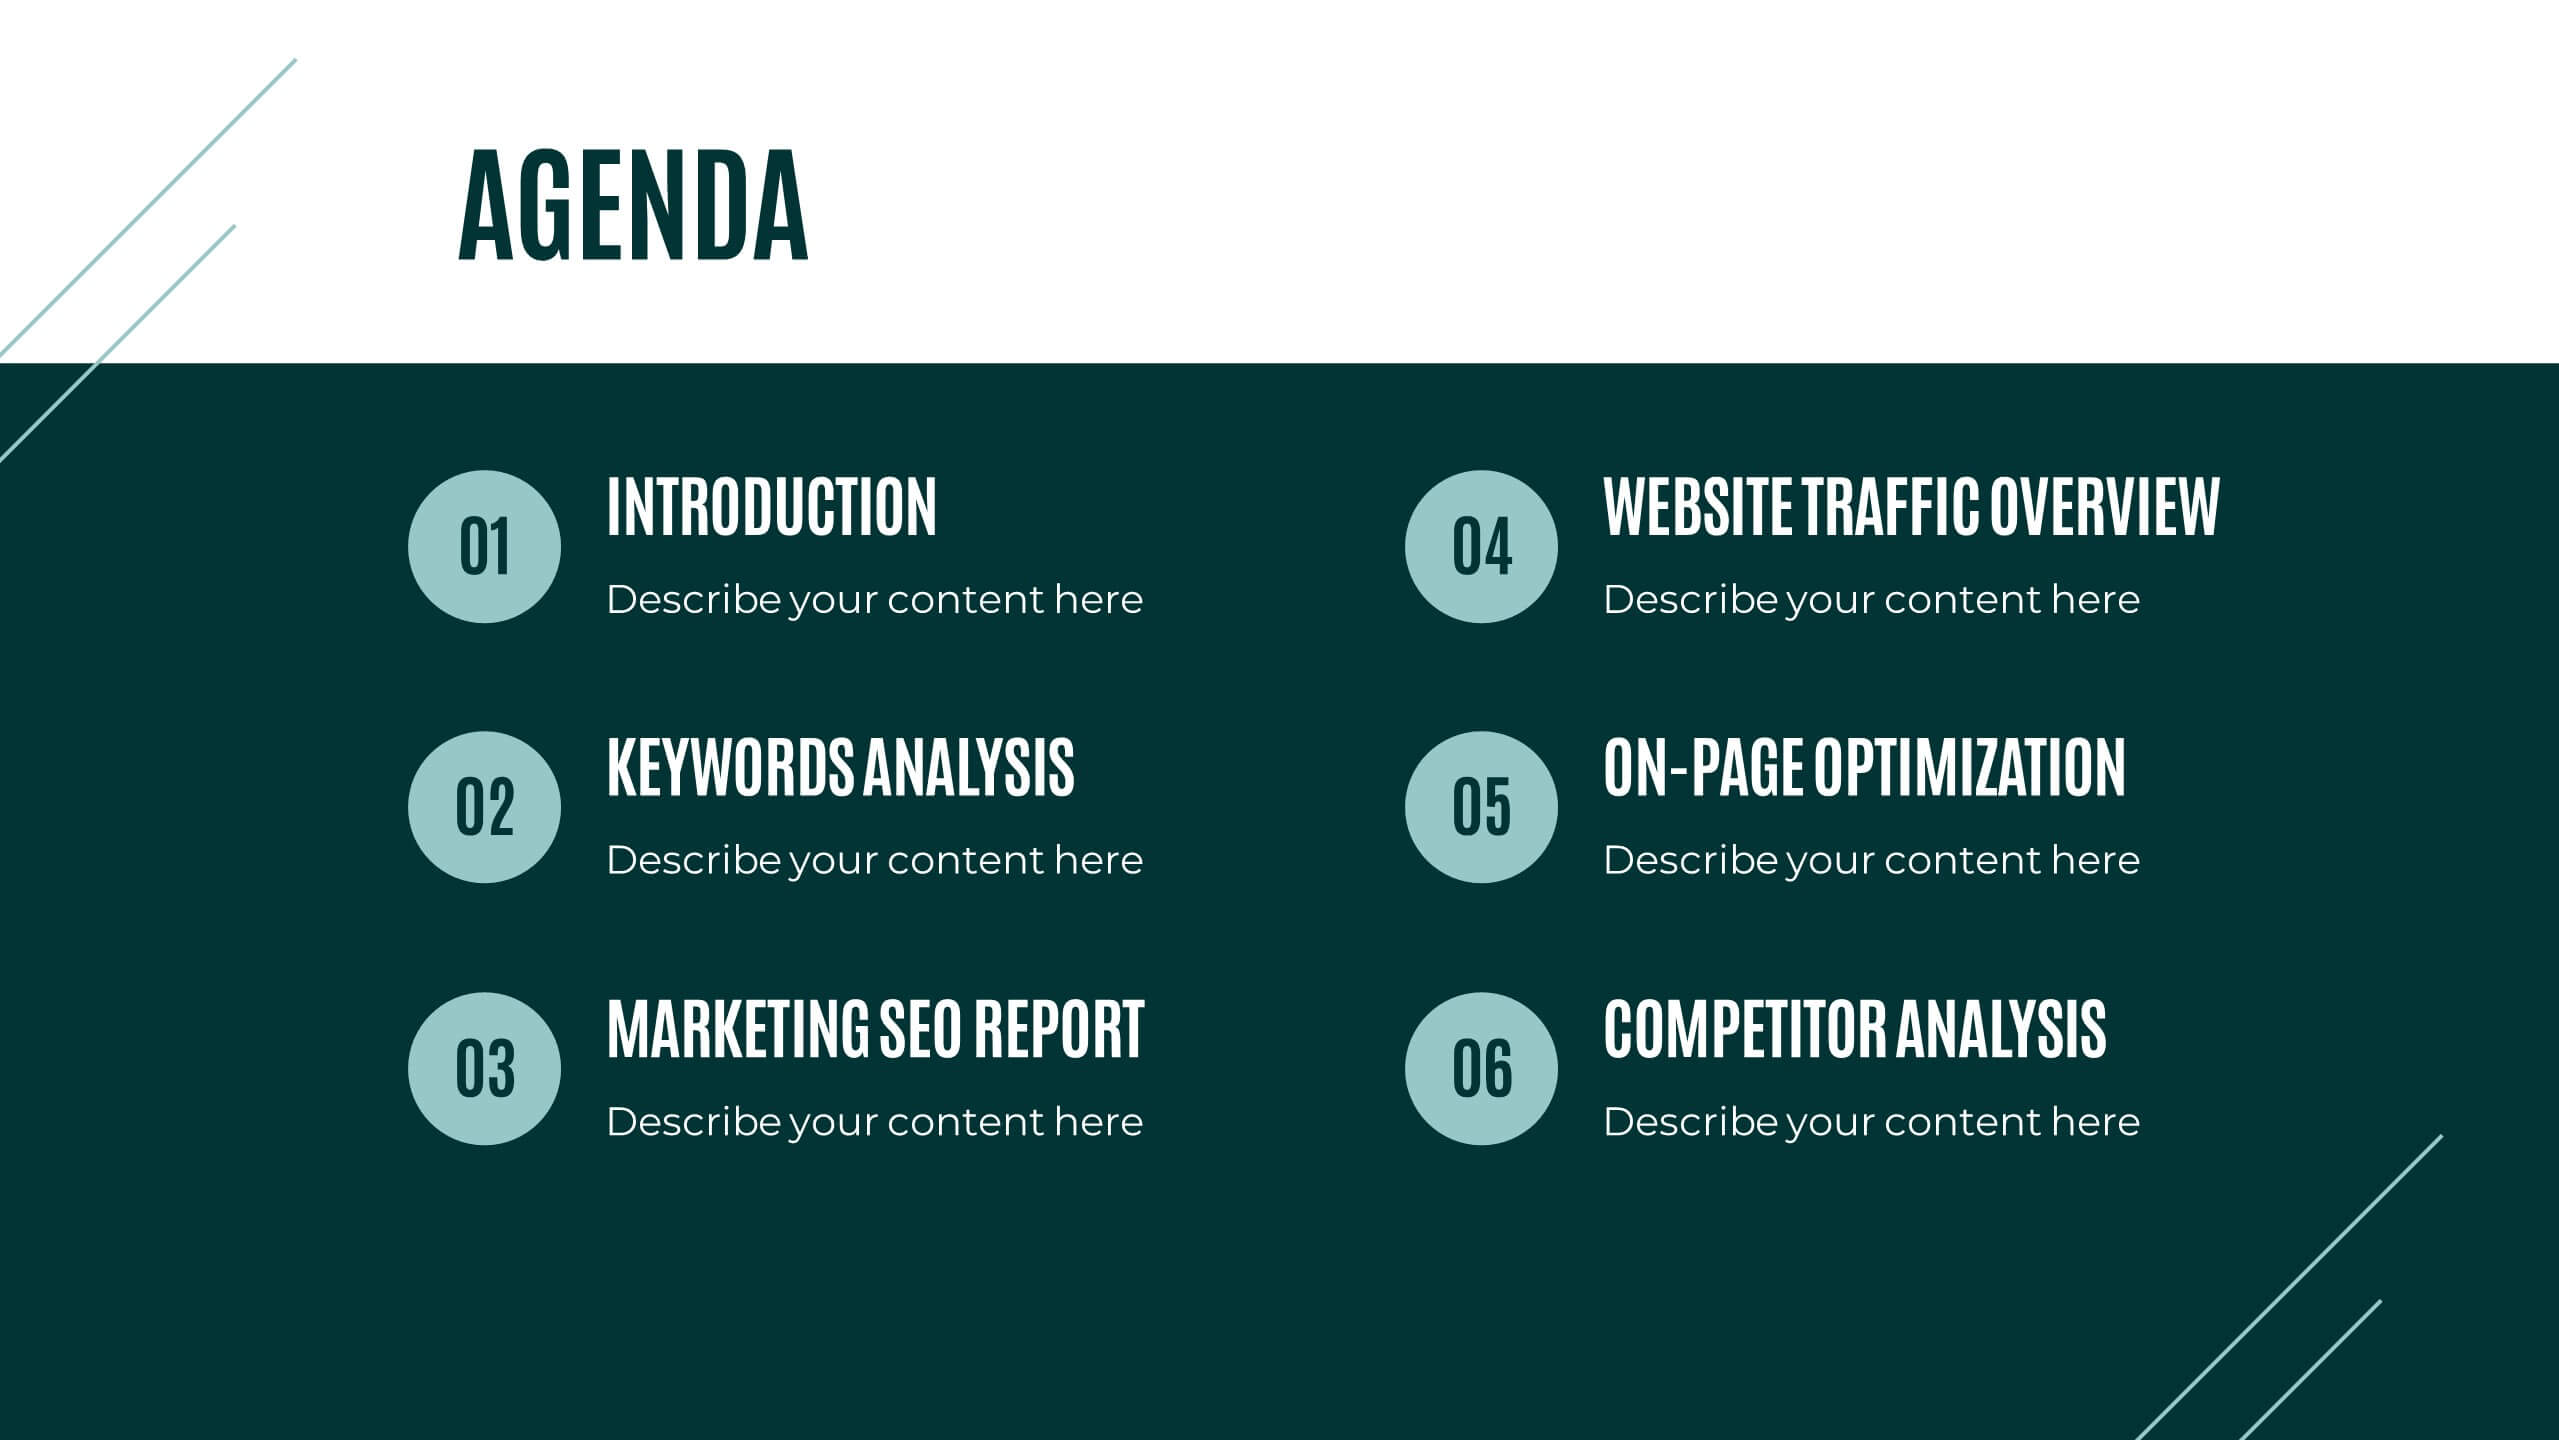
Agenda Company Infographic
Optimize your corporate meetings with our premium collection of company agenda slide templates. Each slide is precisely designed to streamline and enhance the presentation of meeting agendas within a corporate setting. These templates are perfect for laying out the sequence of discussions, key points, and decision-making processes planned for corporate gatherings. The designs range from minimalistic layouts to more detailed ones, incorporating various graphical elements like charts, icons, and timelines to aid in visualizing the meeting’s structure. This not only helps in keeping the meeting on track but also enhances participant engagement by clearly outlining expectations and topics. These agenda slides are fully customizable, enabling adjustments in color schemes, text placement, and design elements to suit your corporate identity and specific meeting needs. Whether it's weekly team meetings, executive briefings, or annual general meetings, these templates provide the necessary structure to conduct efficient and effective corporate discussions.


4 diapositivas
Elegant Watercolor Background Presentation
Add a touch of sophistication to your presentation with soft watercolor textures that create a calming, professional atmosphere. Perfect for creative projects, proposals, or portfolios, this elegant design blends artistry with clarity. Fully compatible with PowerPoint, Keynote, and Google Slides for seamless customization and a refined visual finish.


26 diapositivas
Soren Presentation Template
Soren is a cool, clean, simple easy to use template. This beautiful template is great for all types of businesses and creative projects. The colors are bold and simple to capture the audience needs. Soren is a multipurpose theme that can be used to capture the attention of your clients in a friendly, unique way. This template is a minimalistic design to attract your customers. The simple text, charts and tables make it easy to customize this template to match your brand. Whether you’re in need of a business presentation, newsletter or even social media posts – Soren is the perfect fit for you.
20 diapositivas
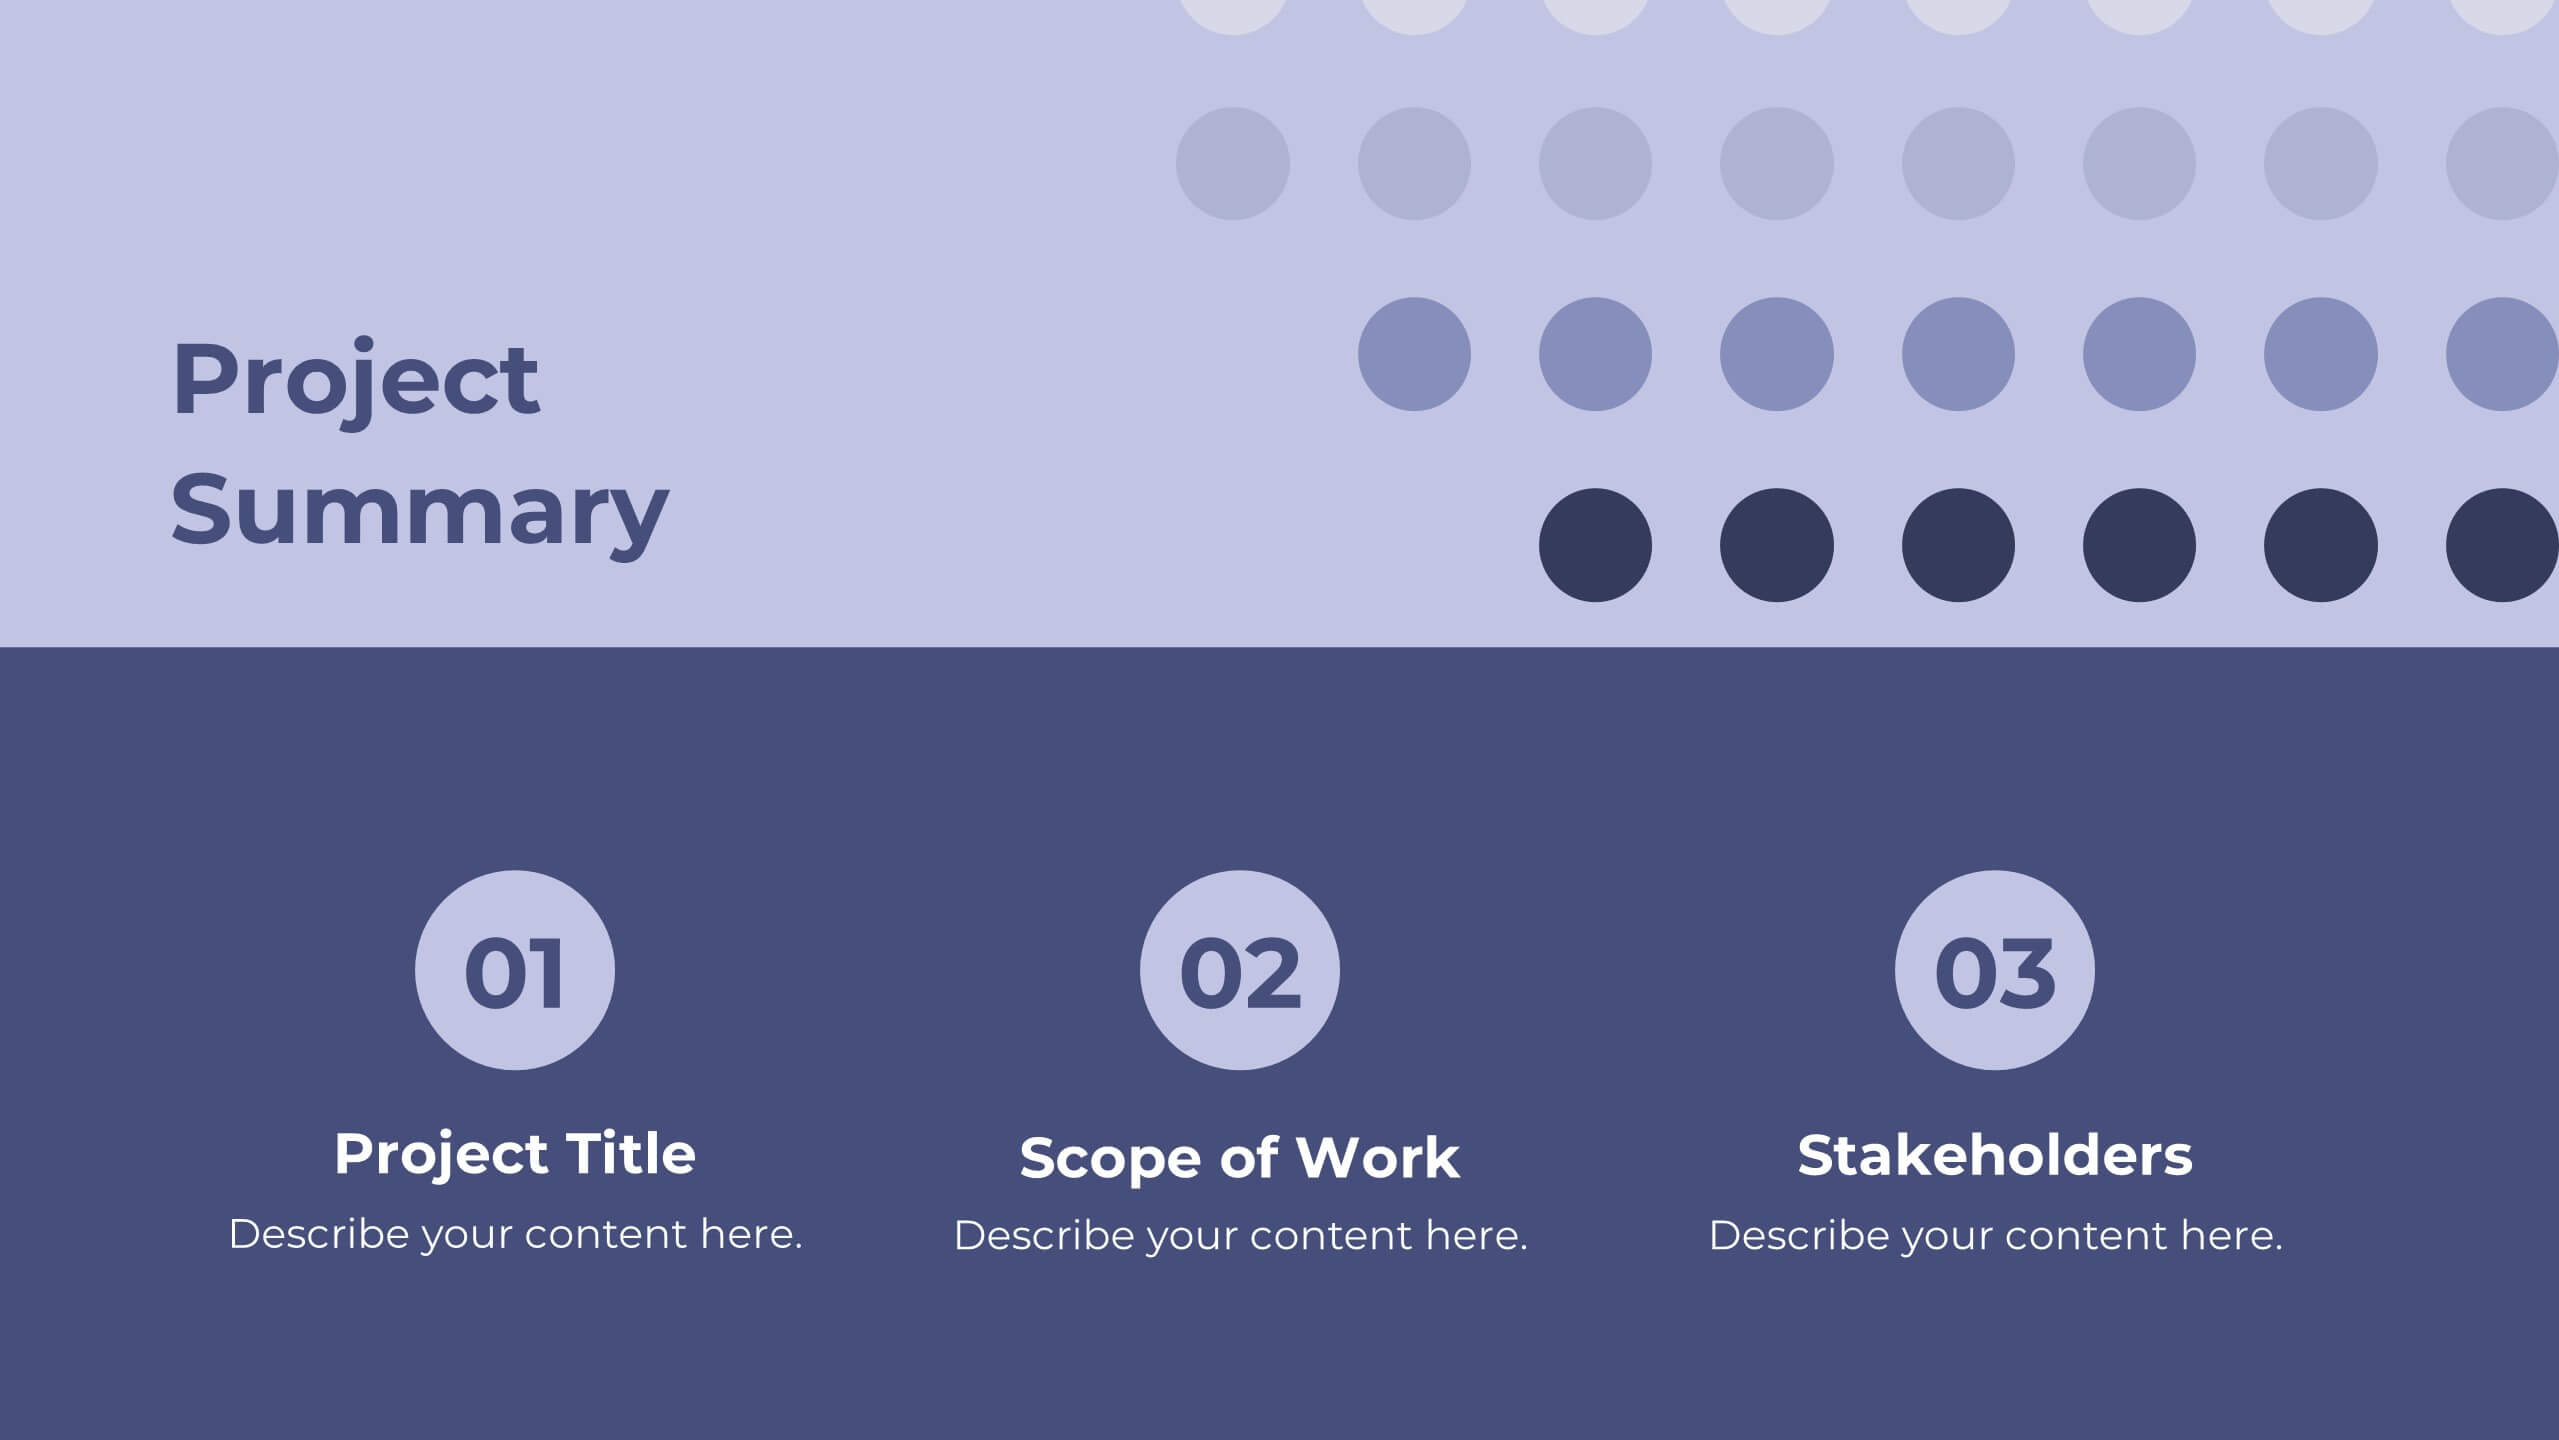
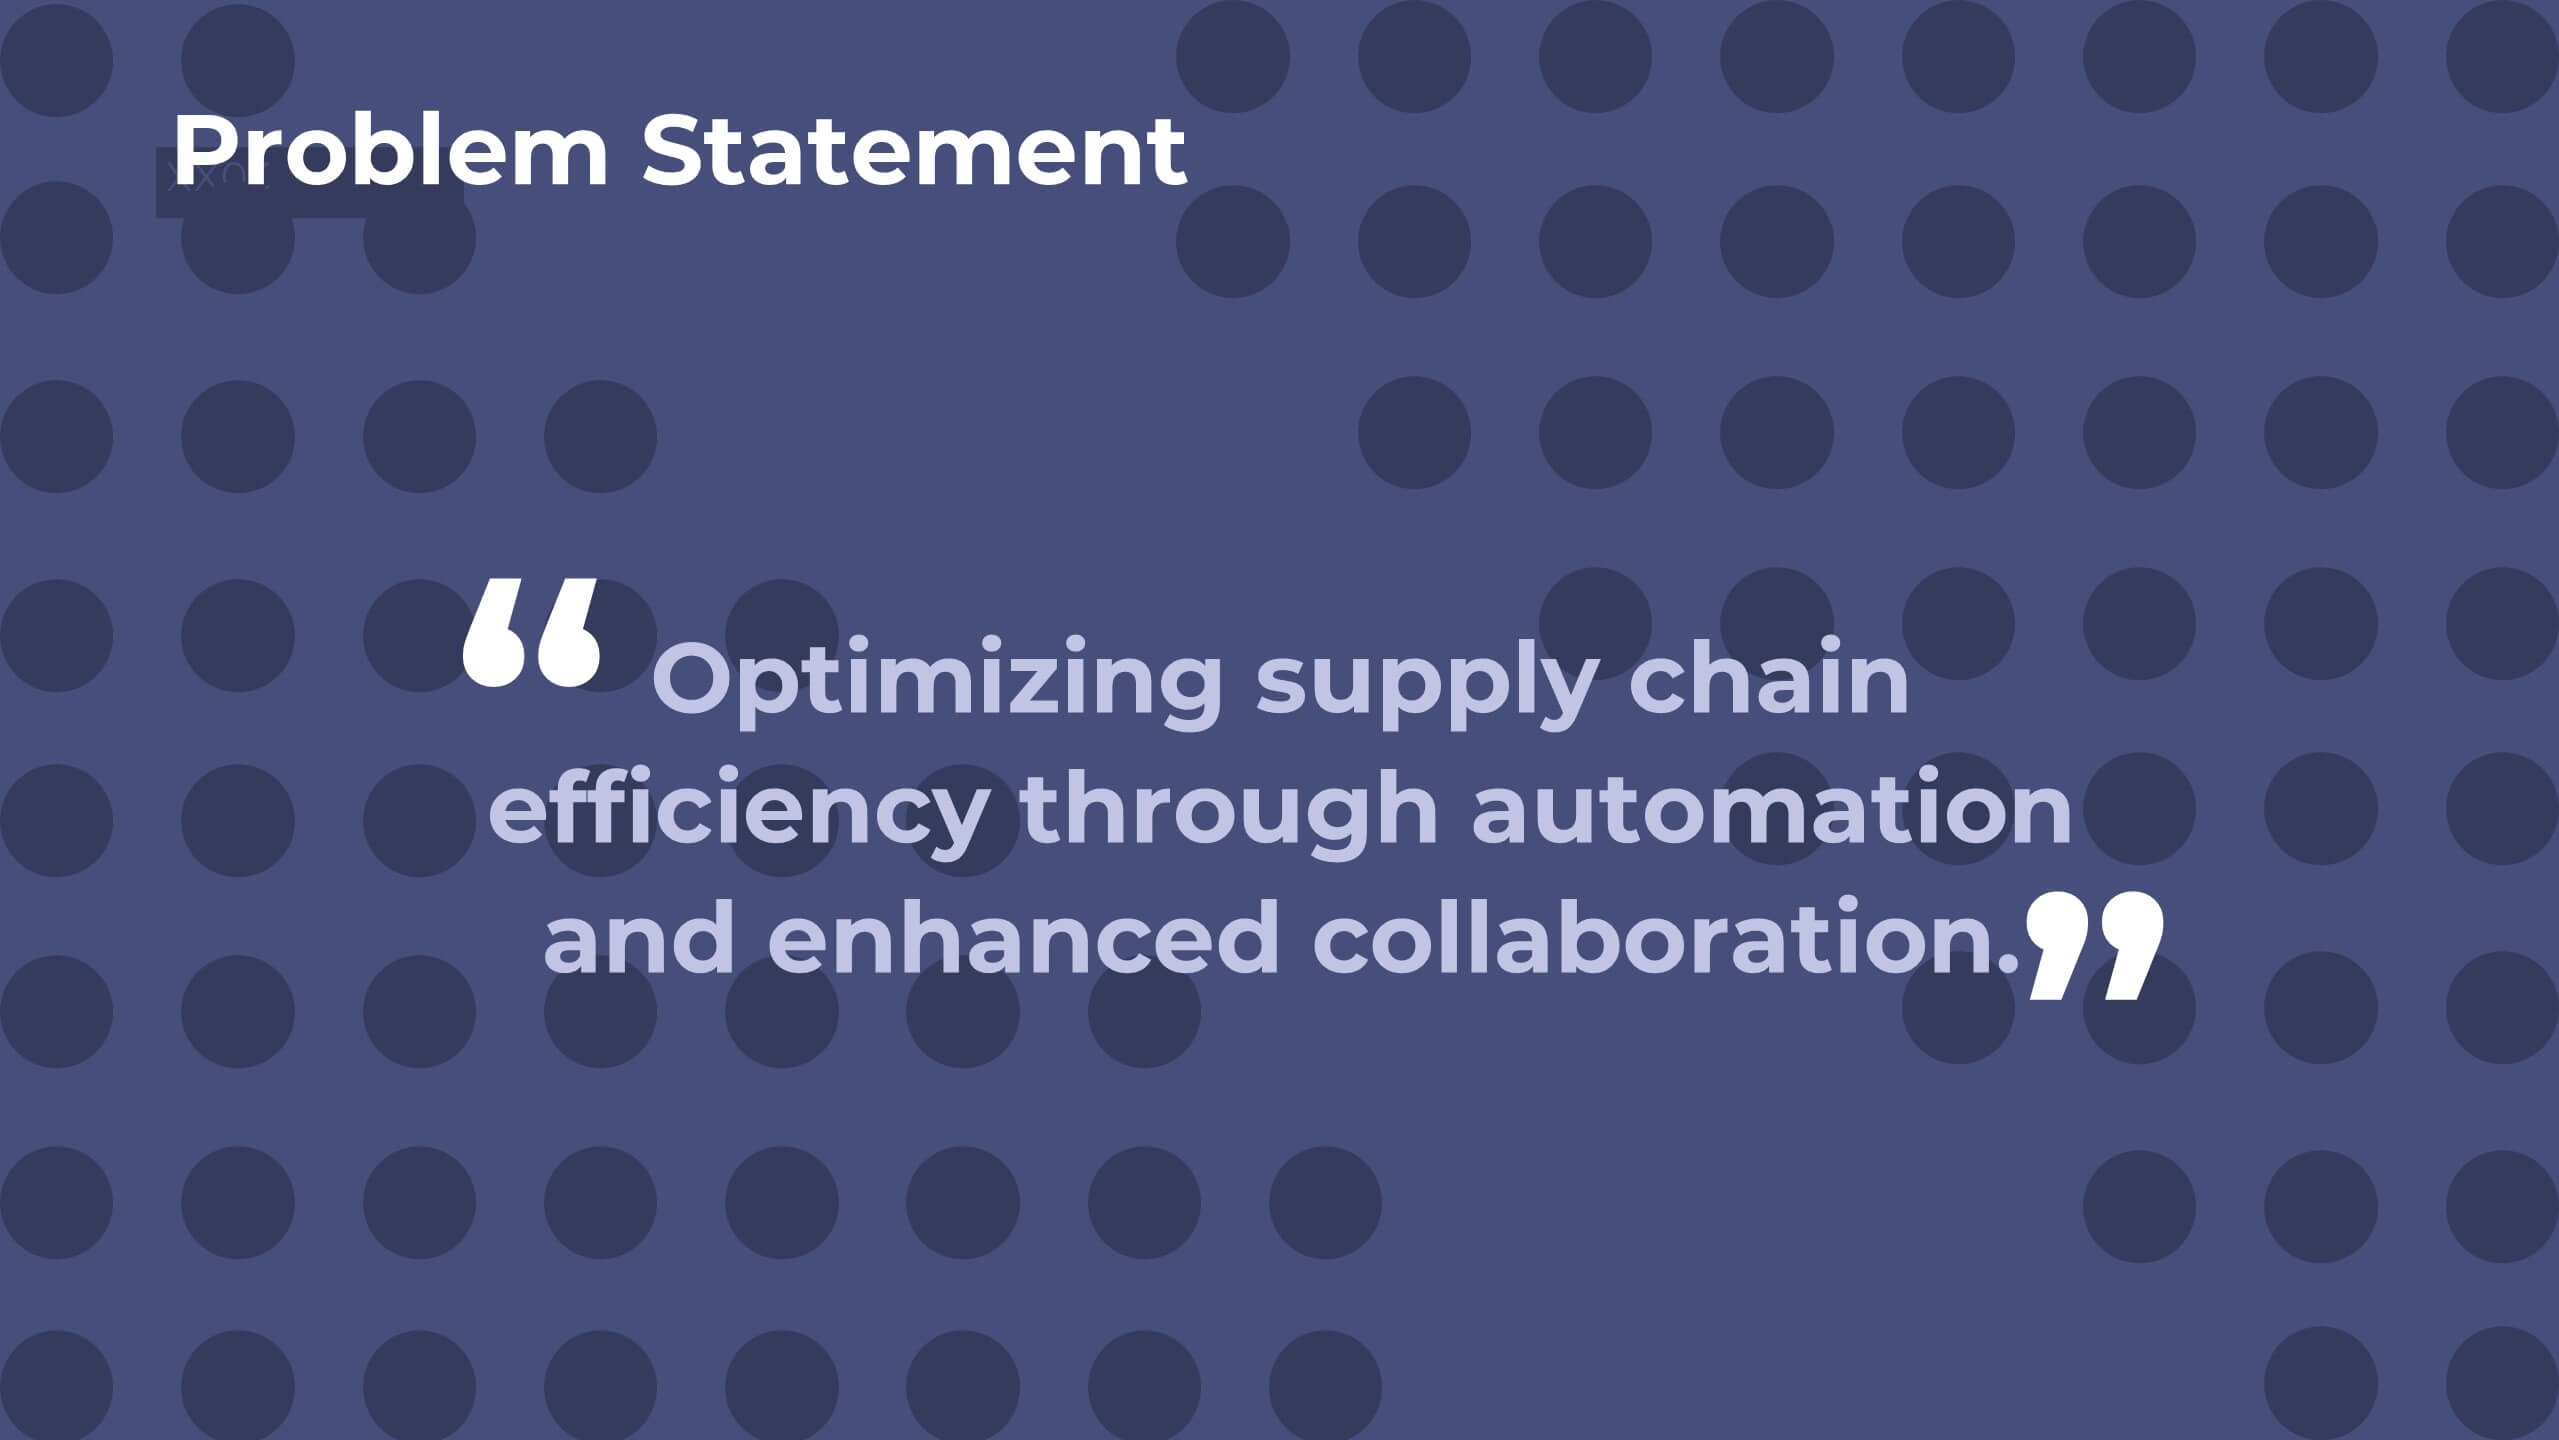
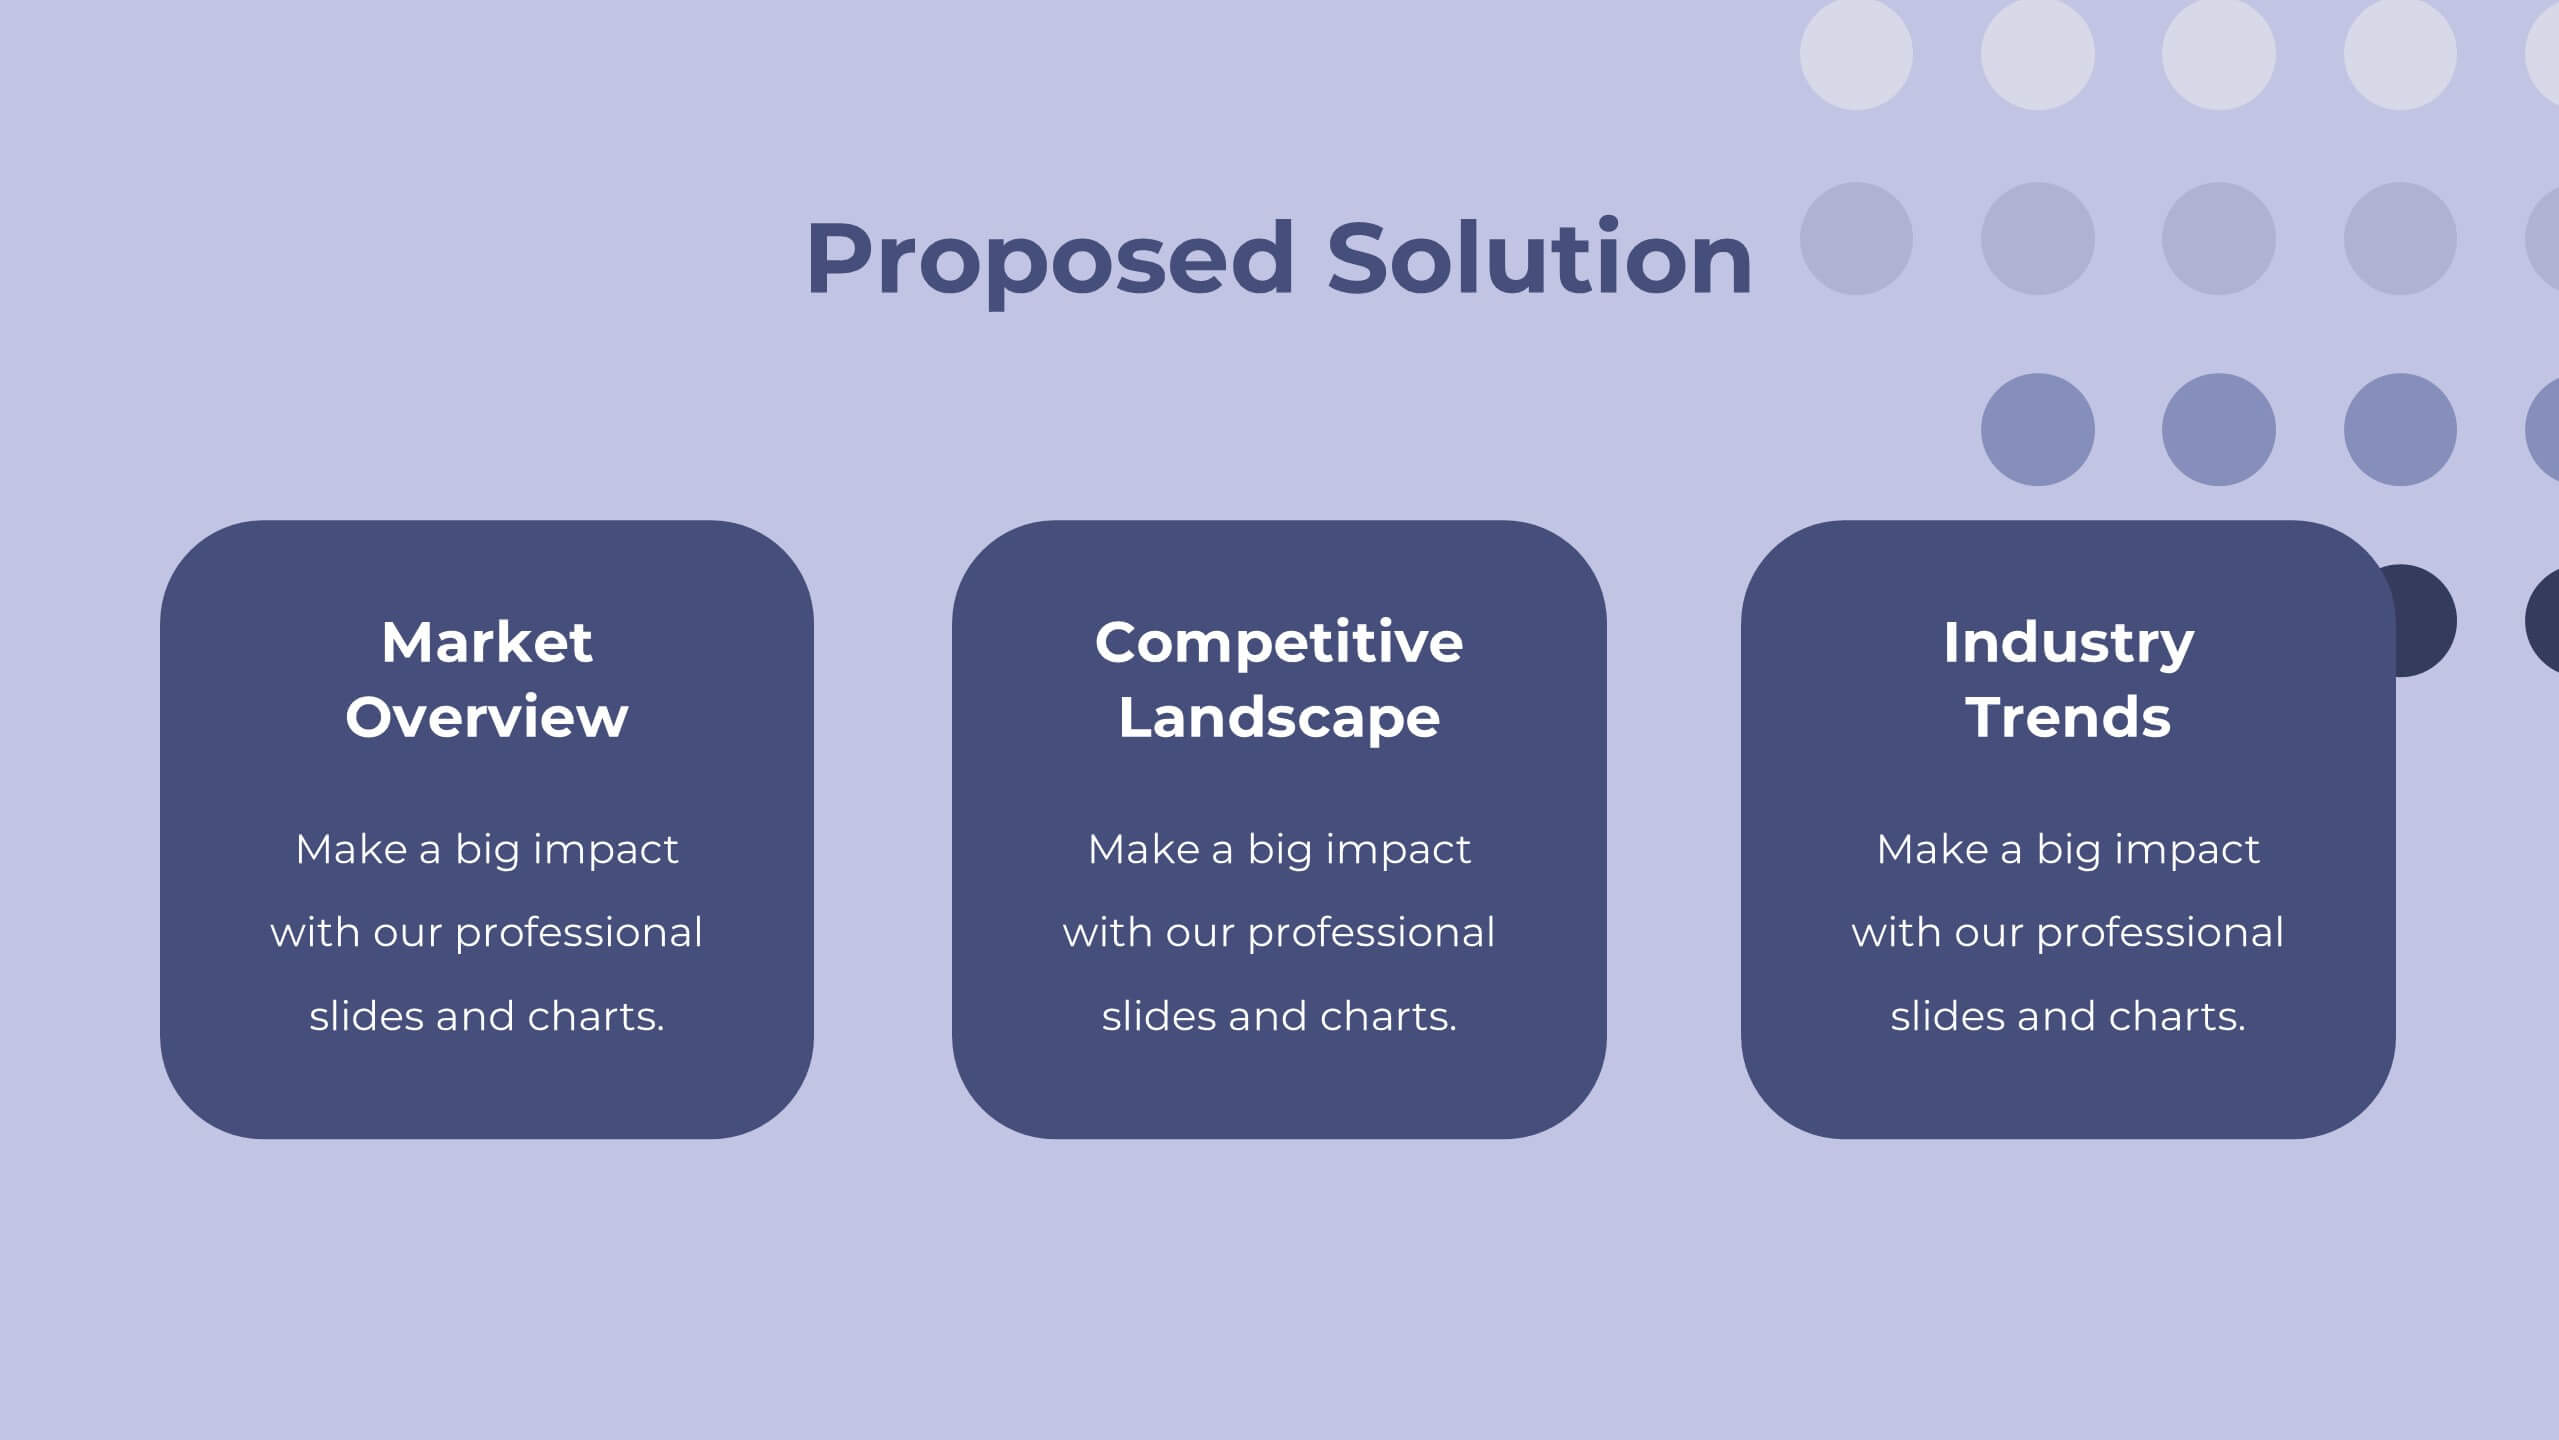
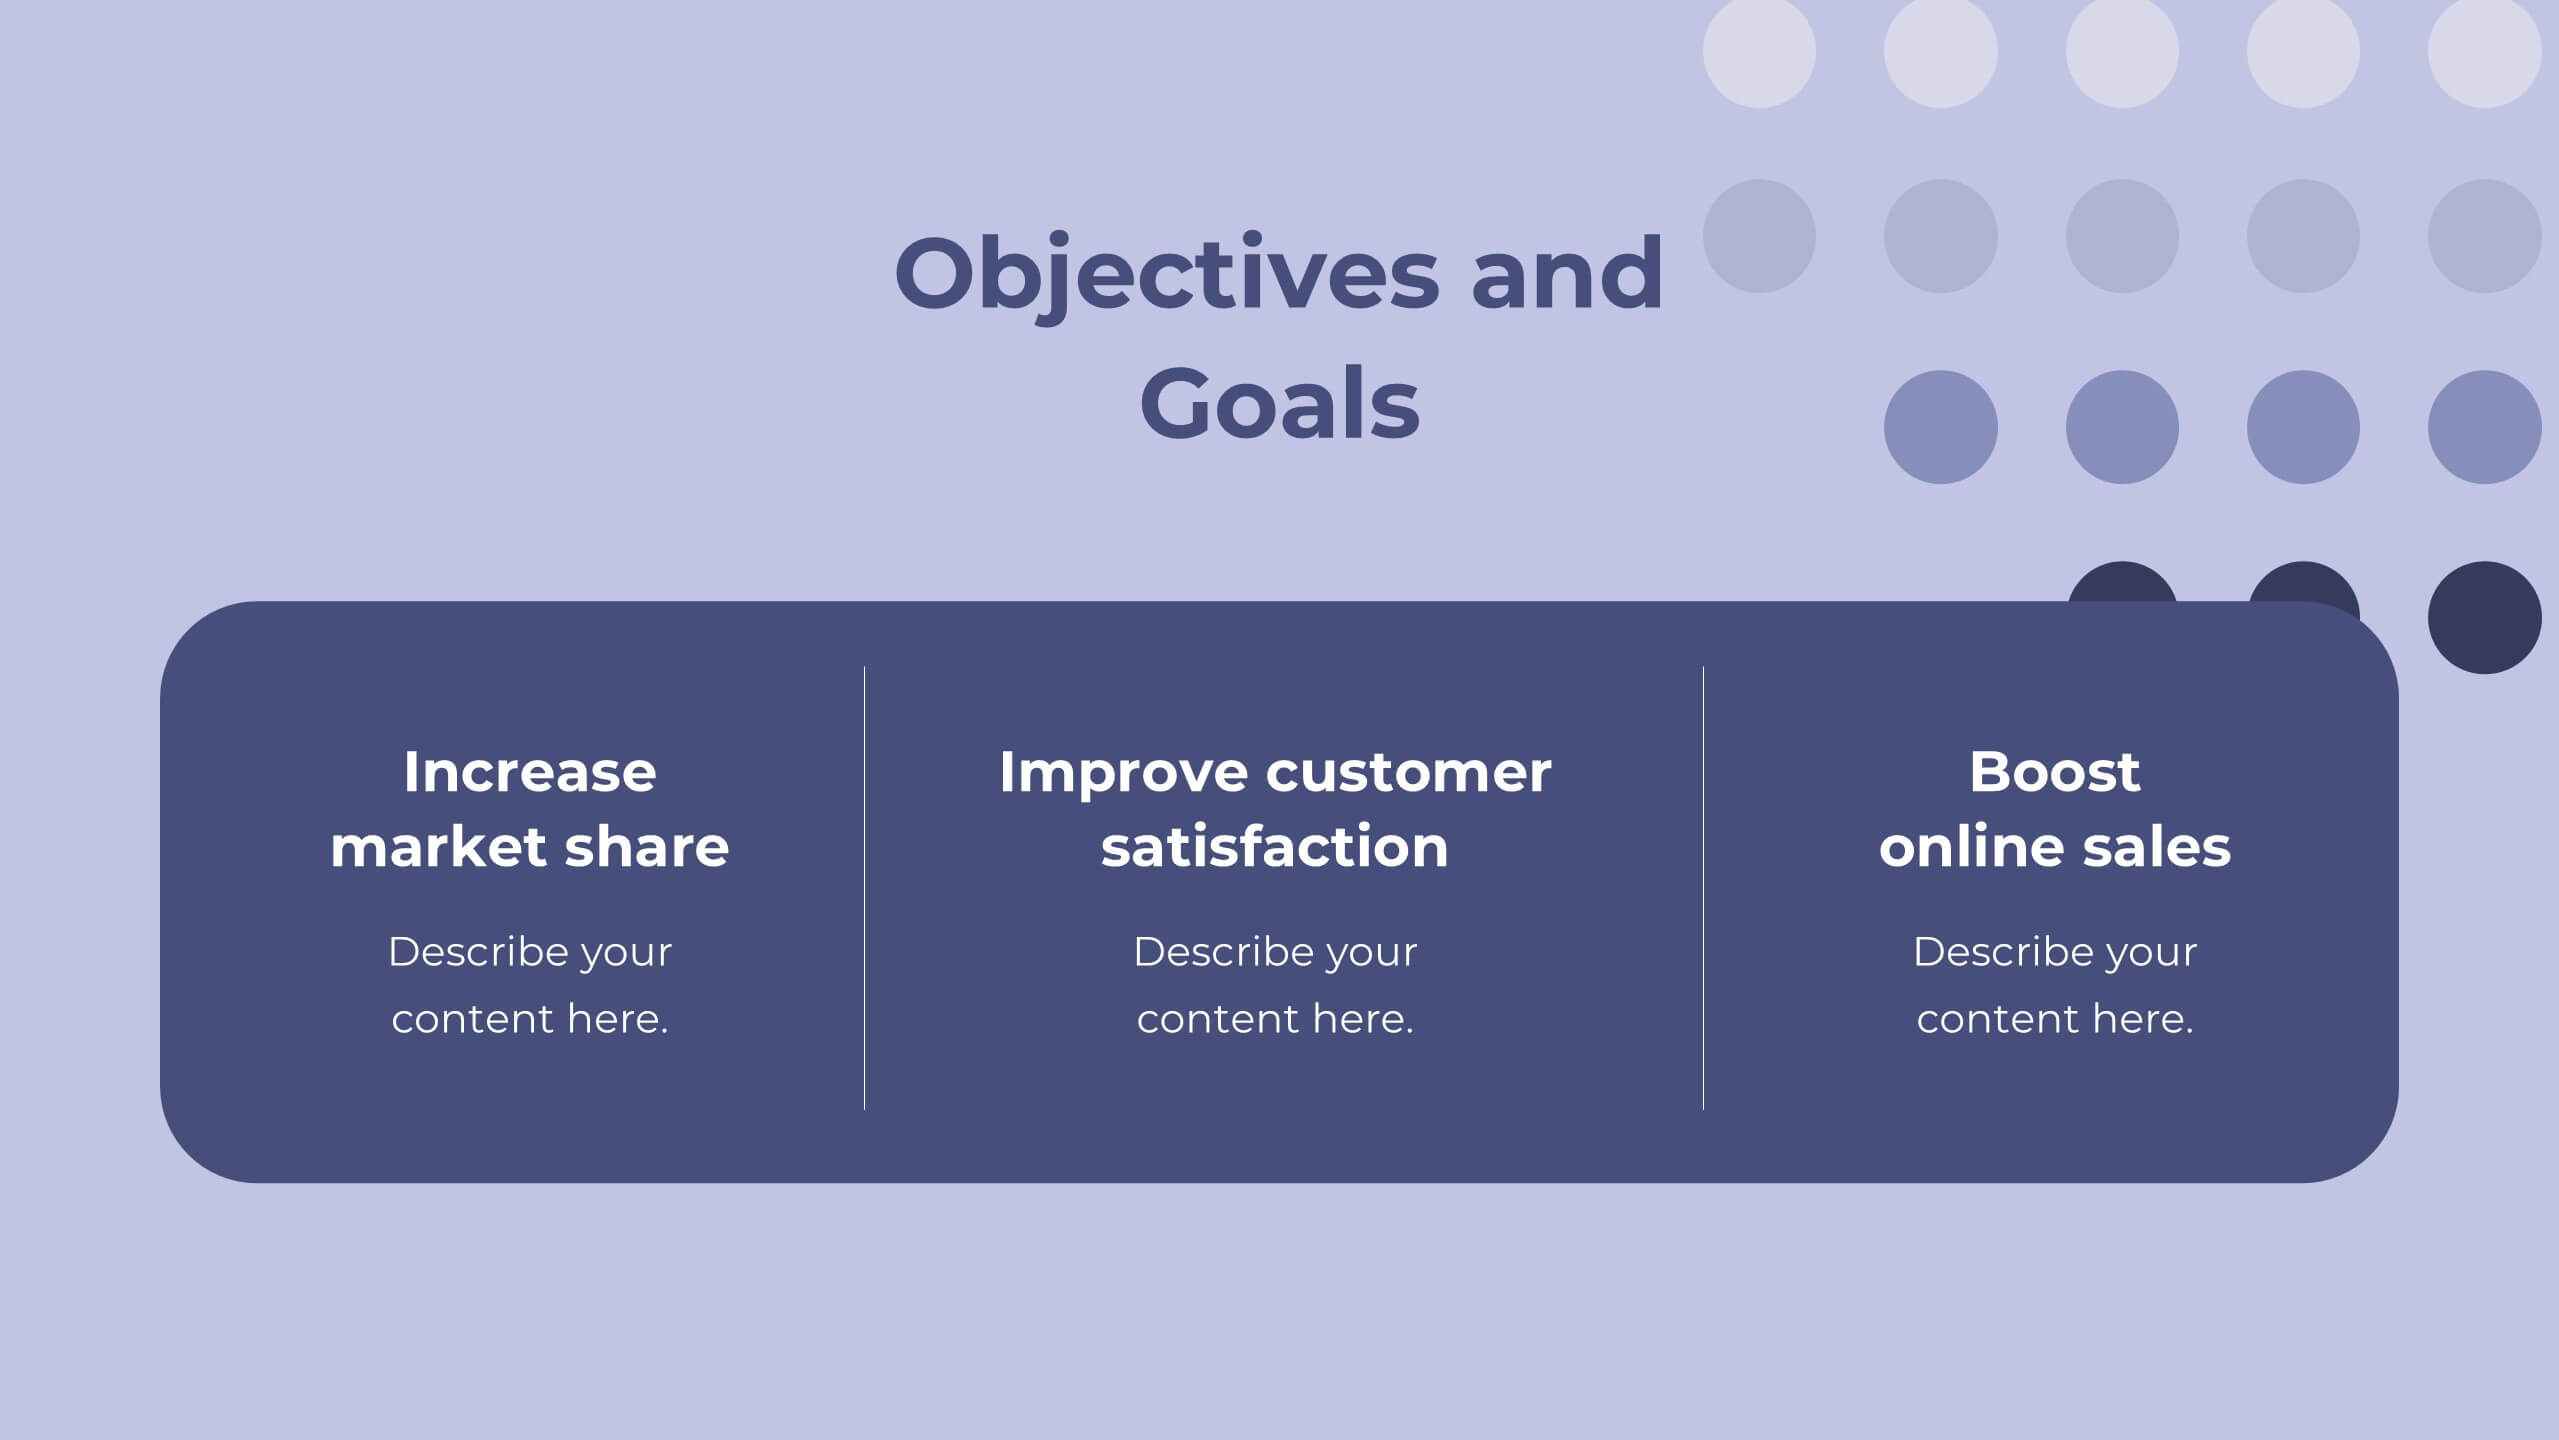
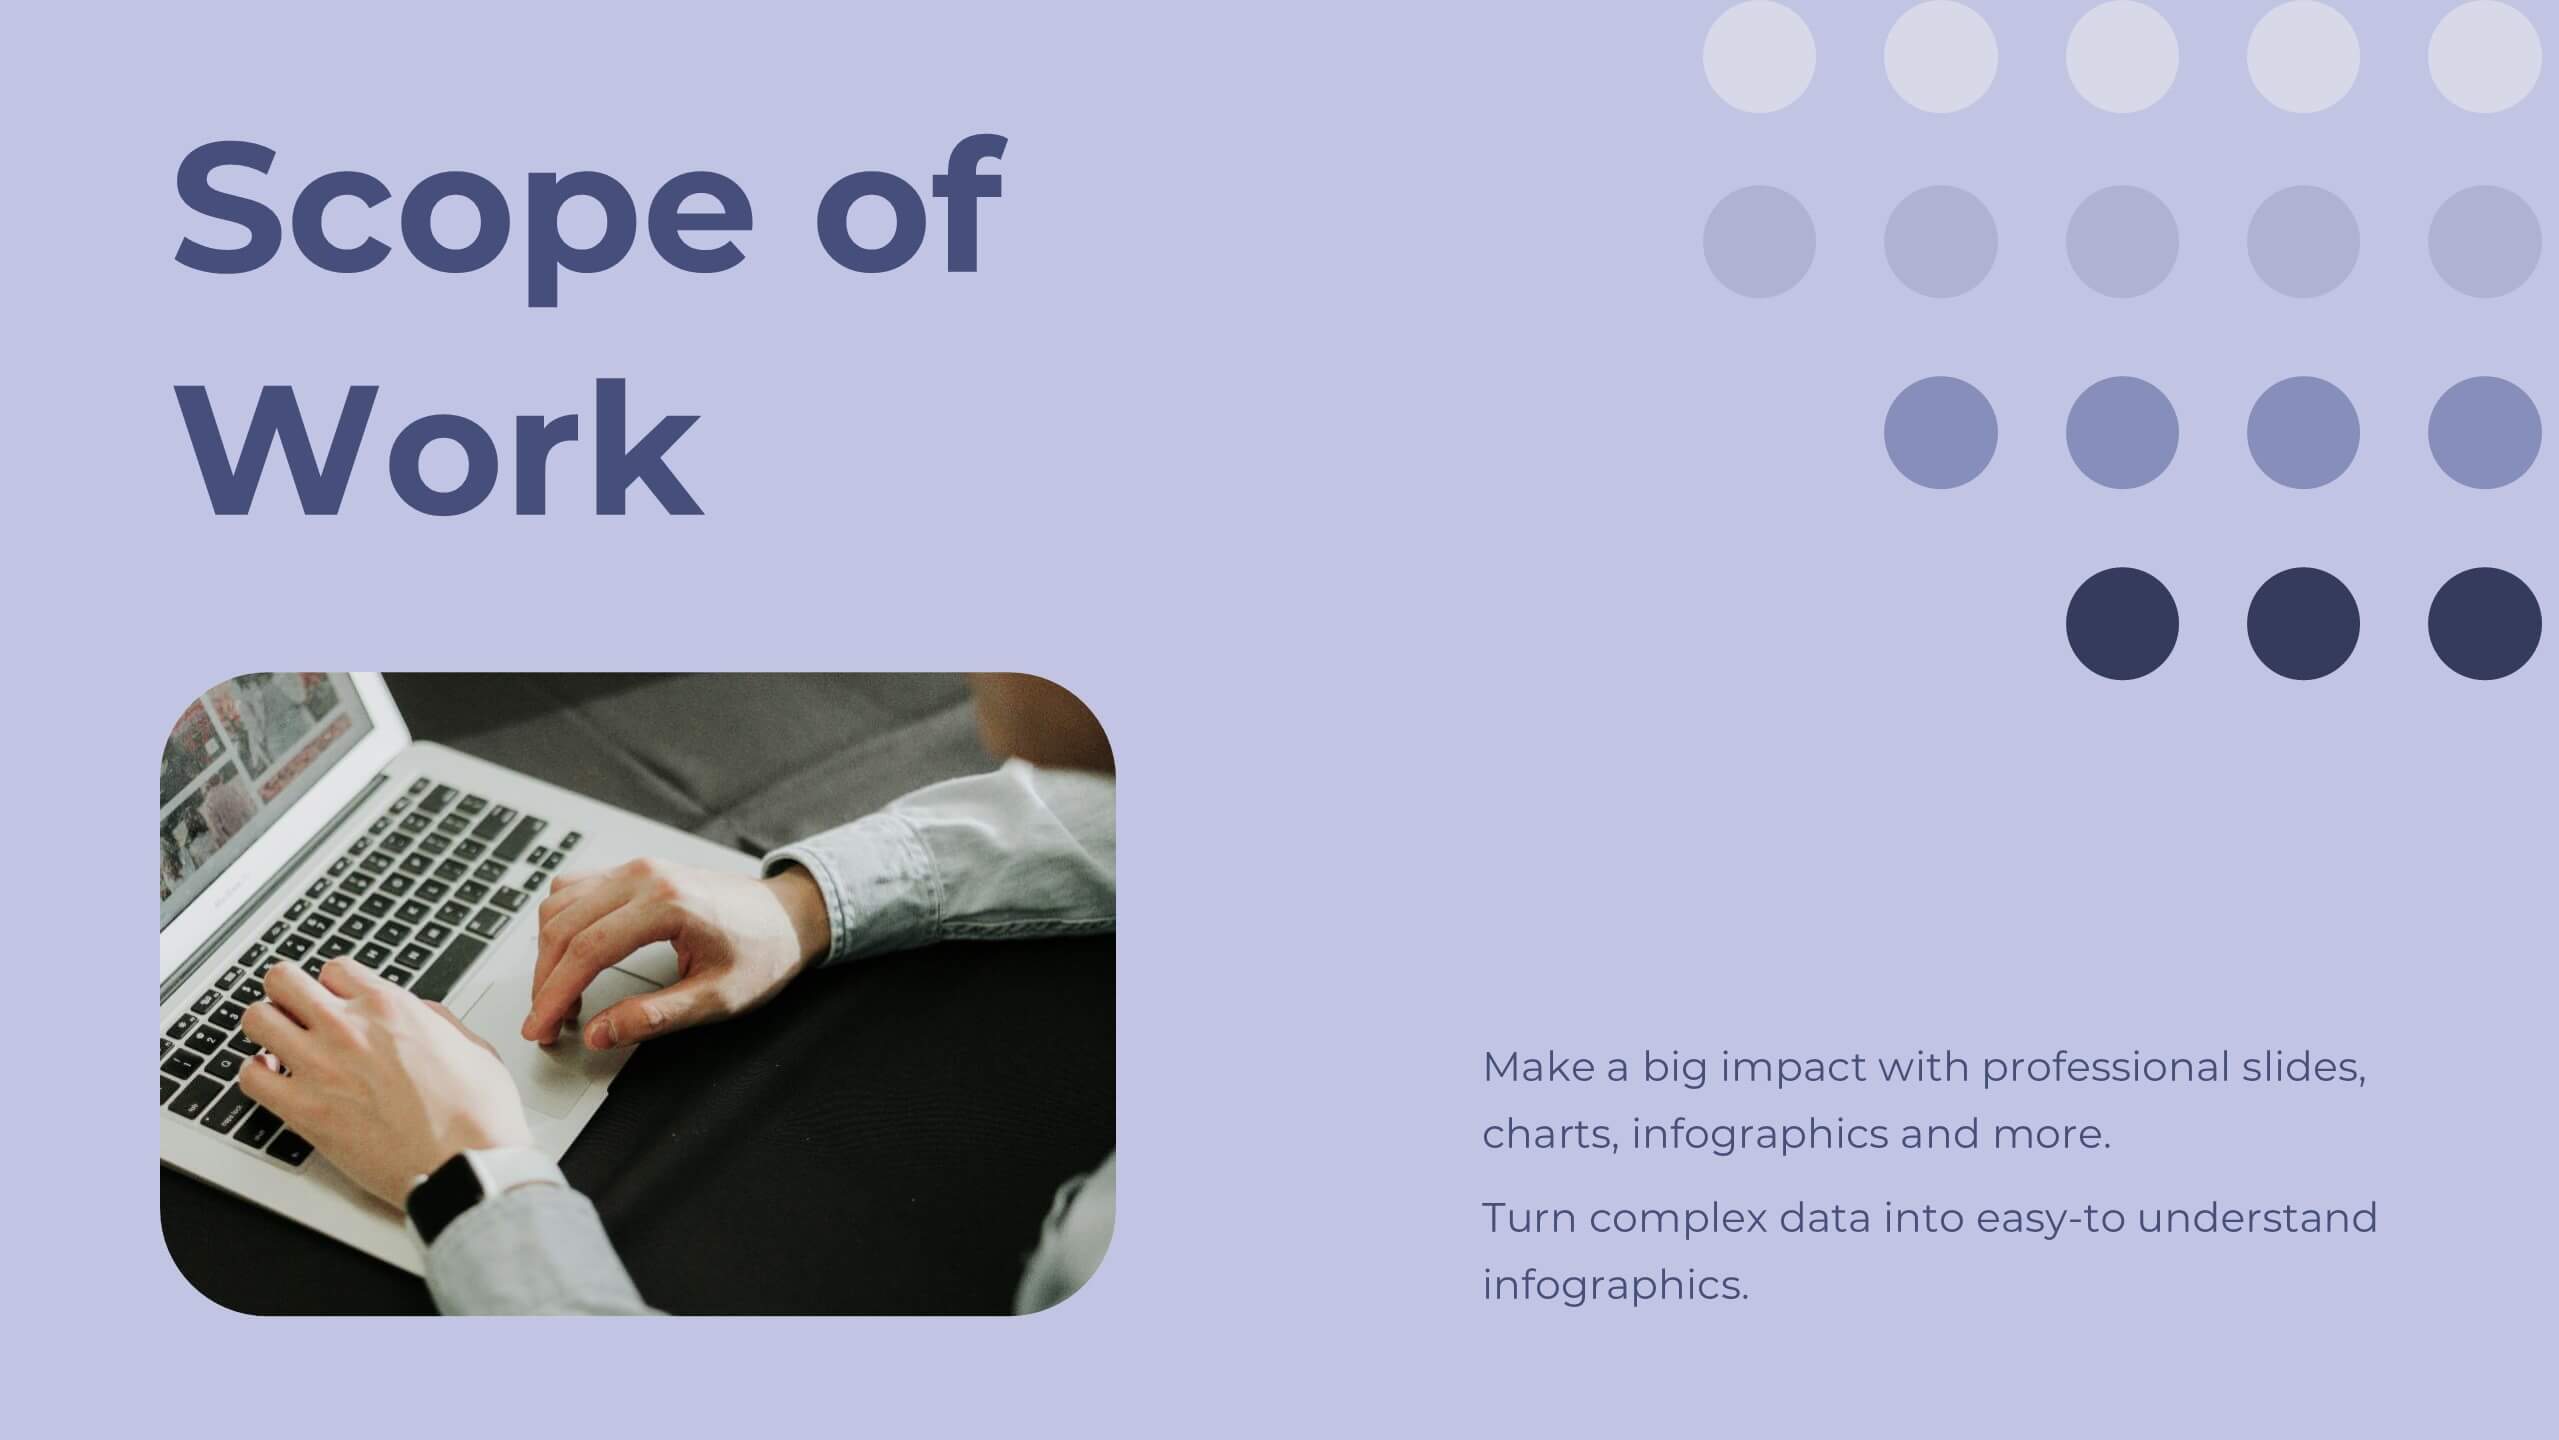
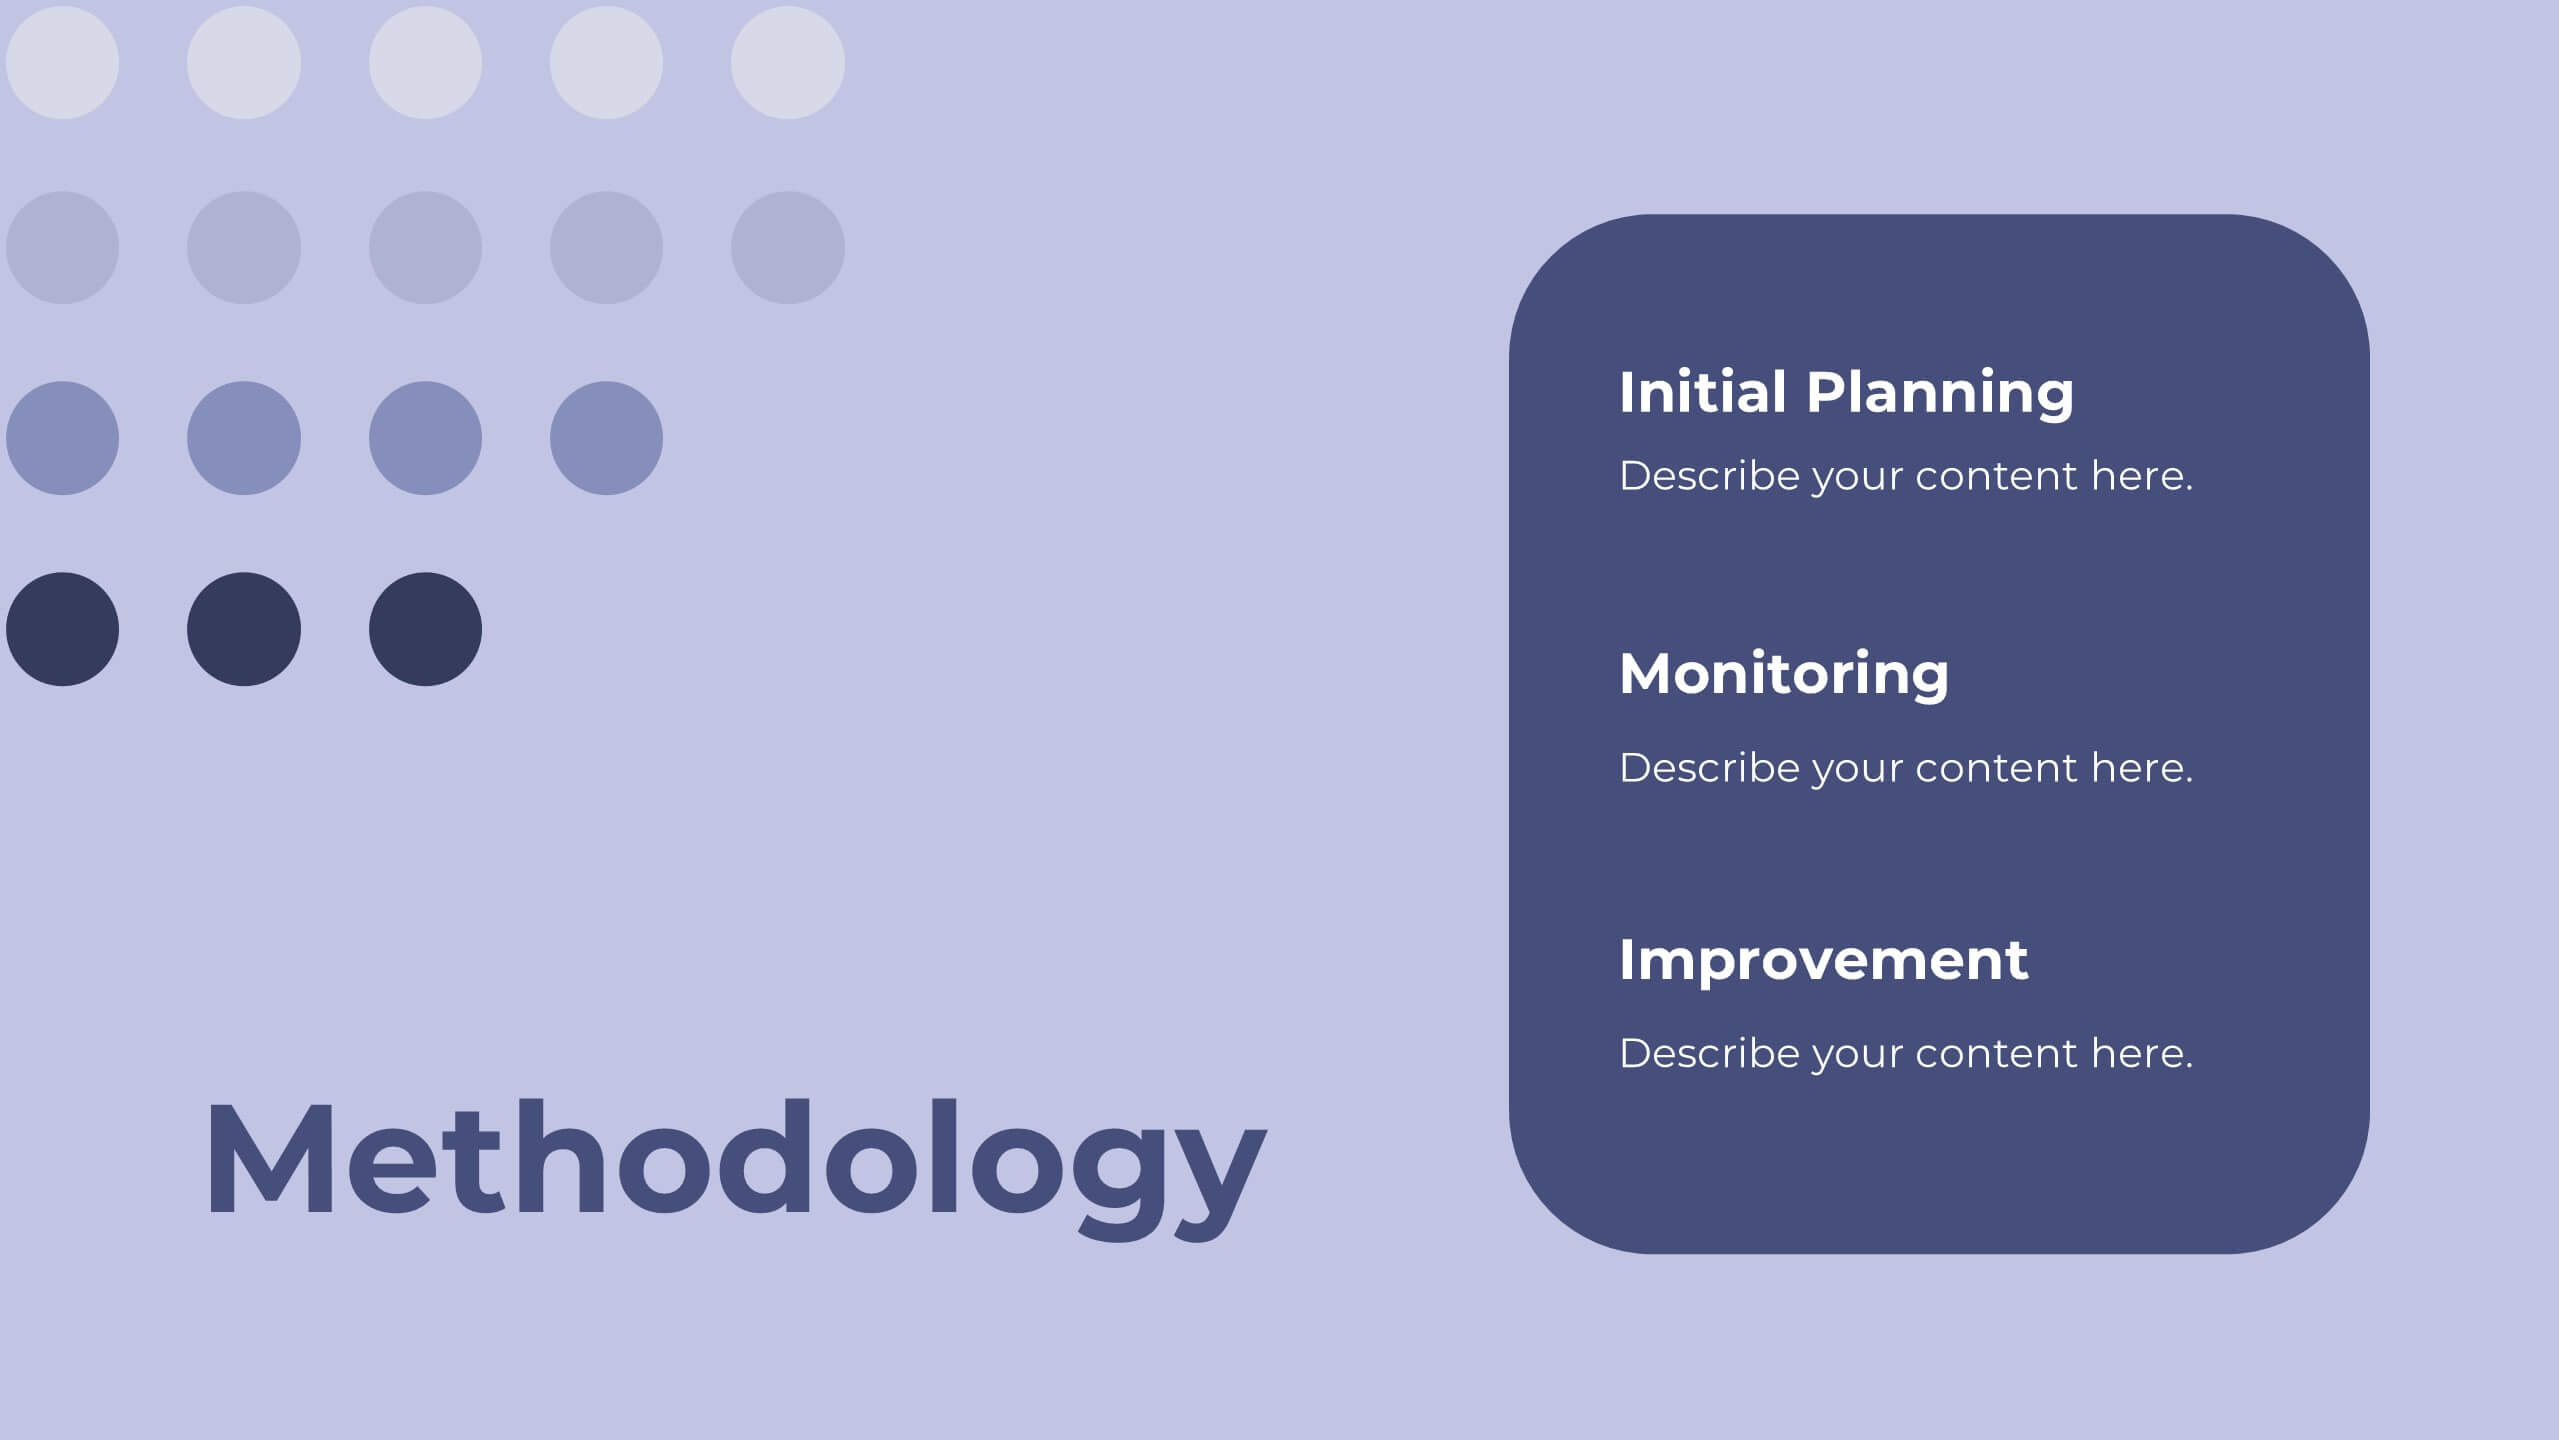
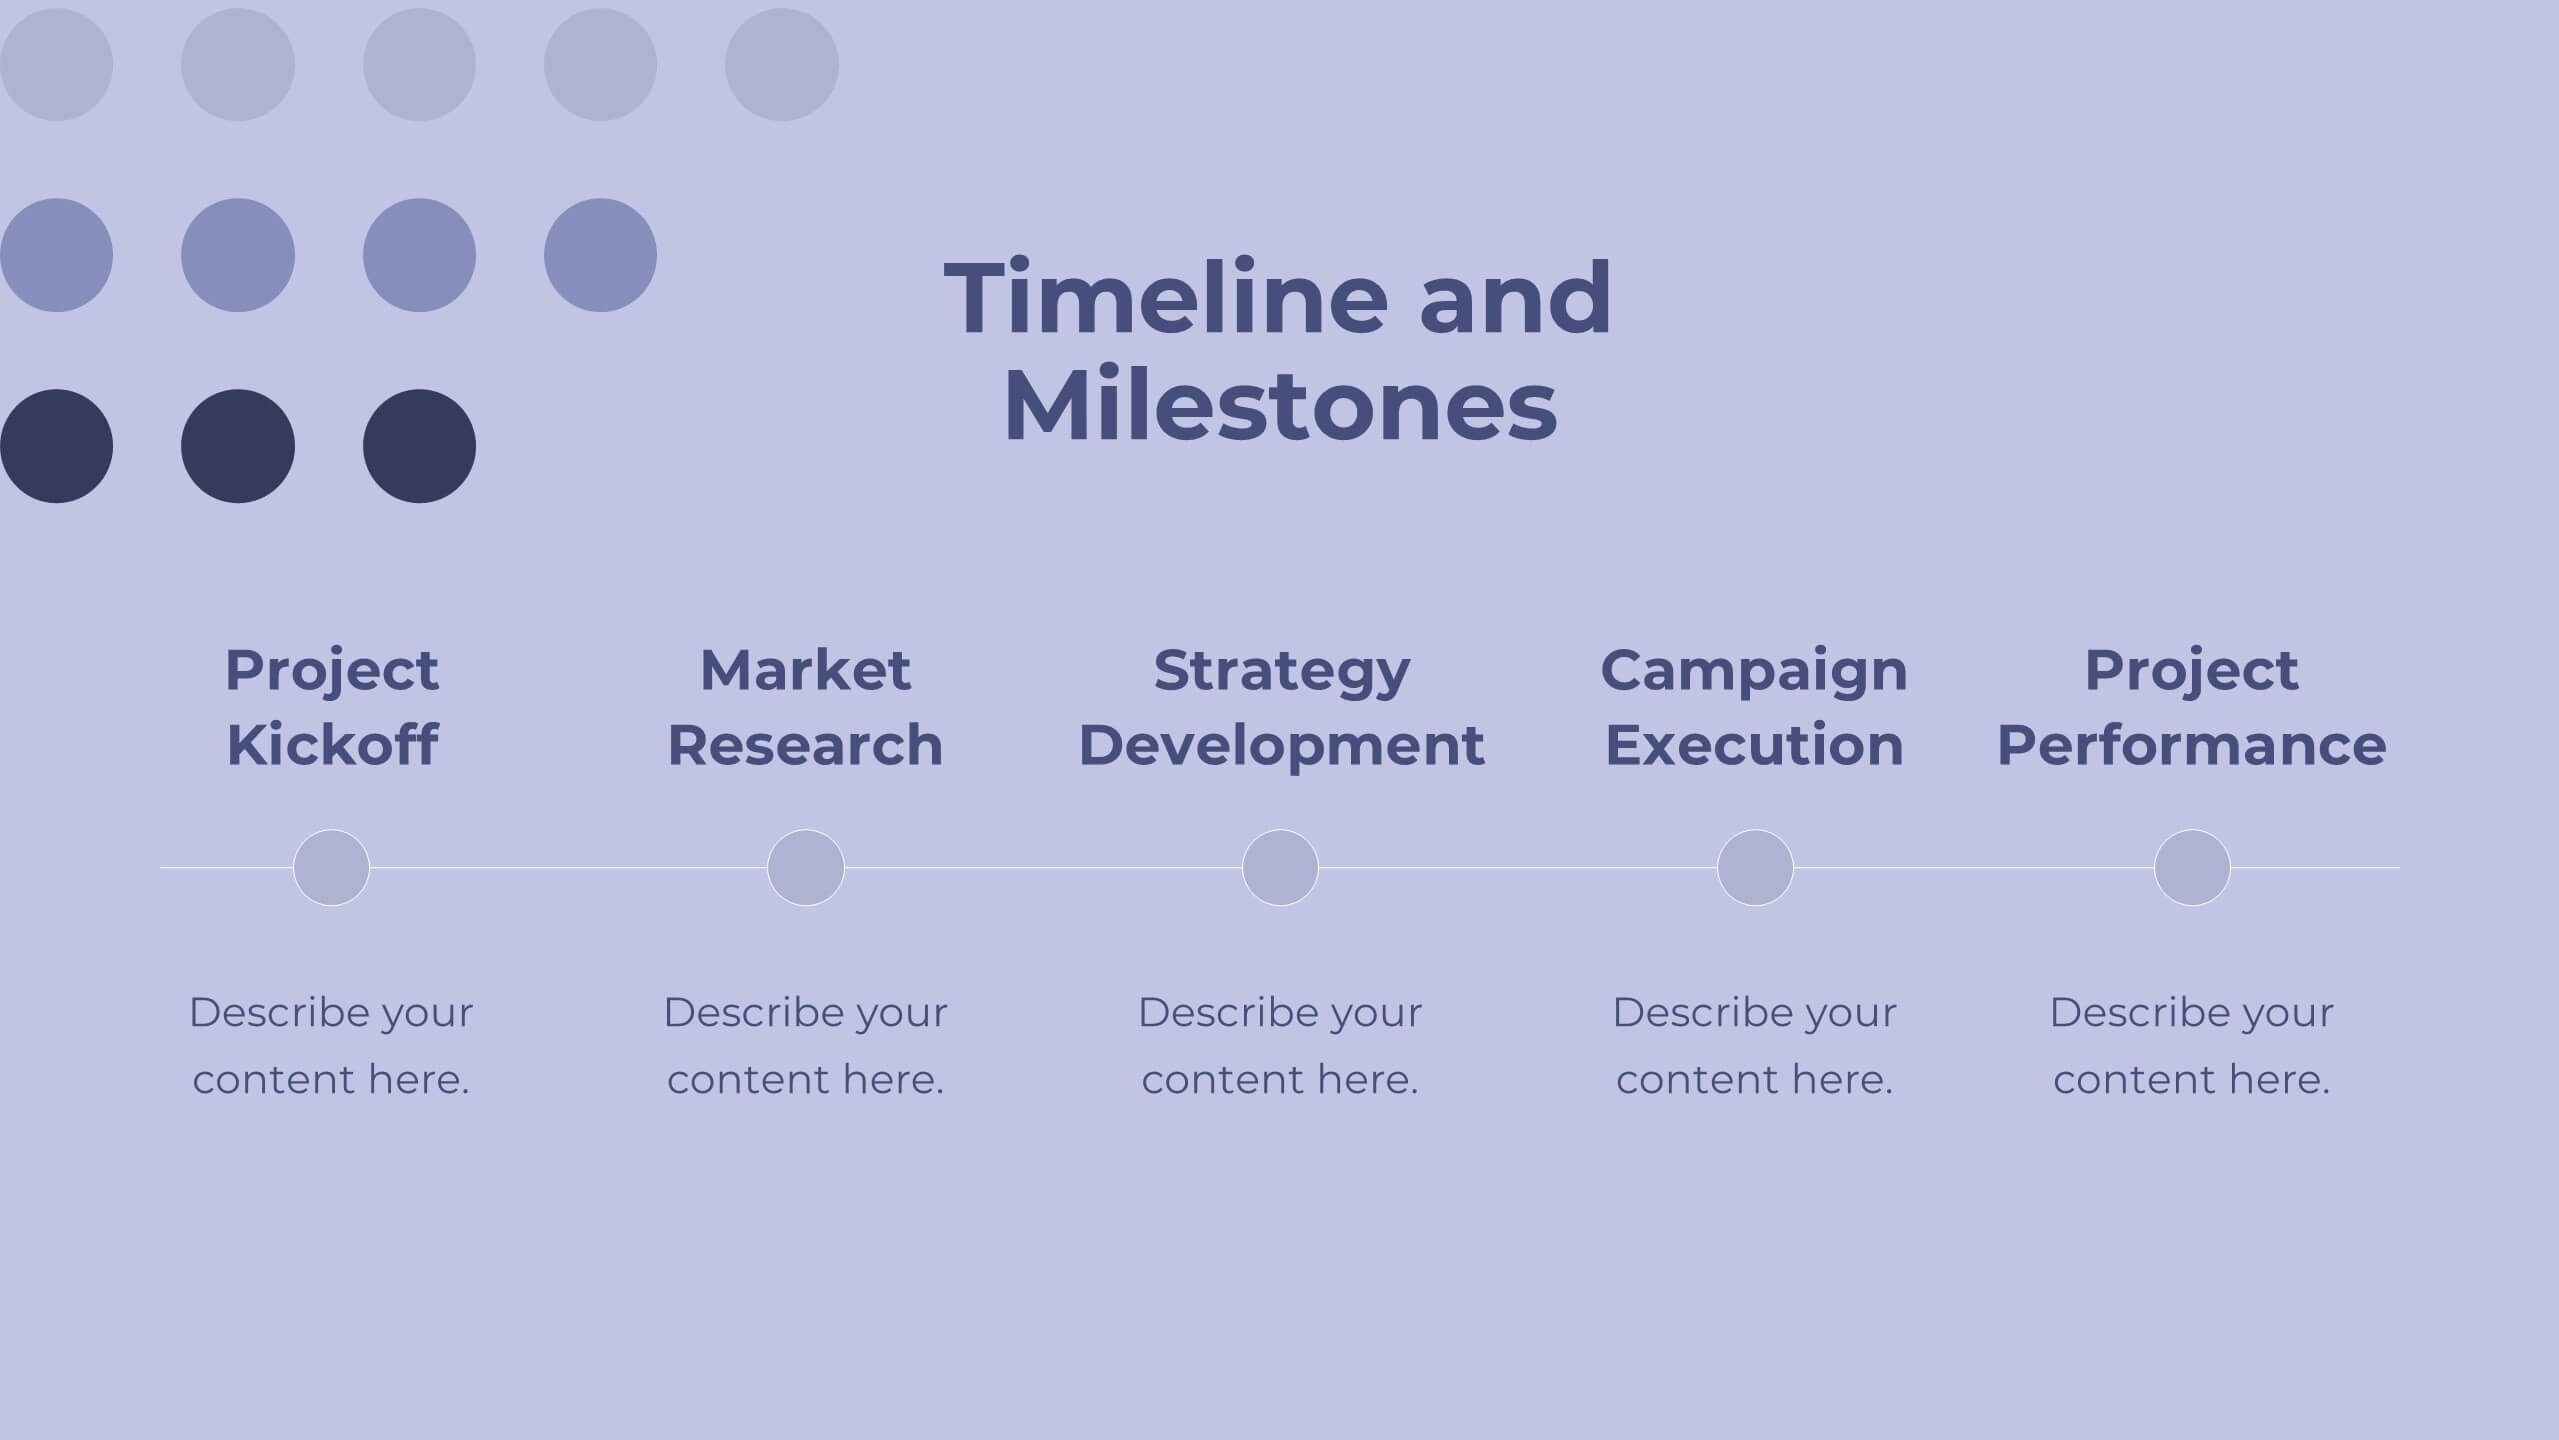
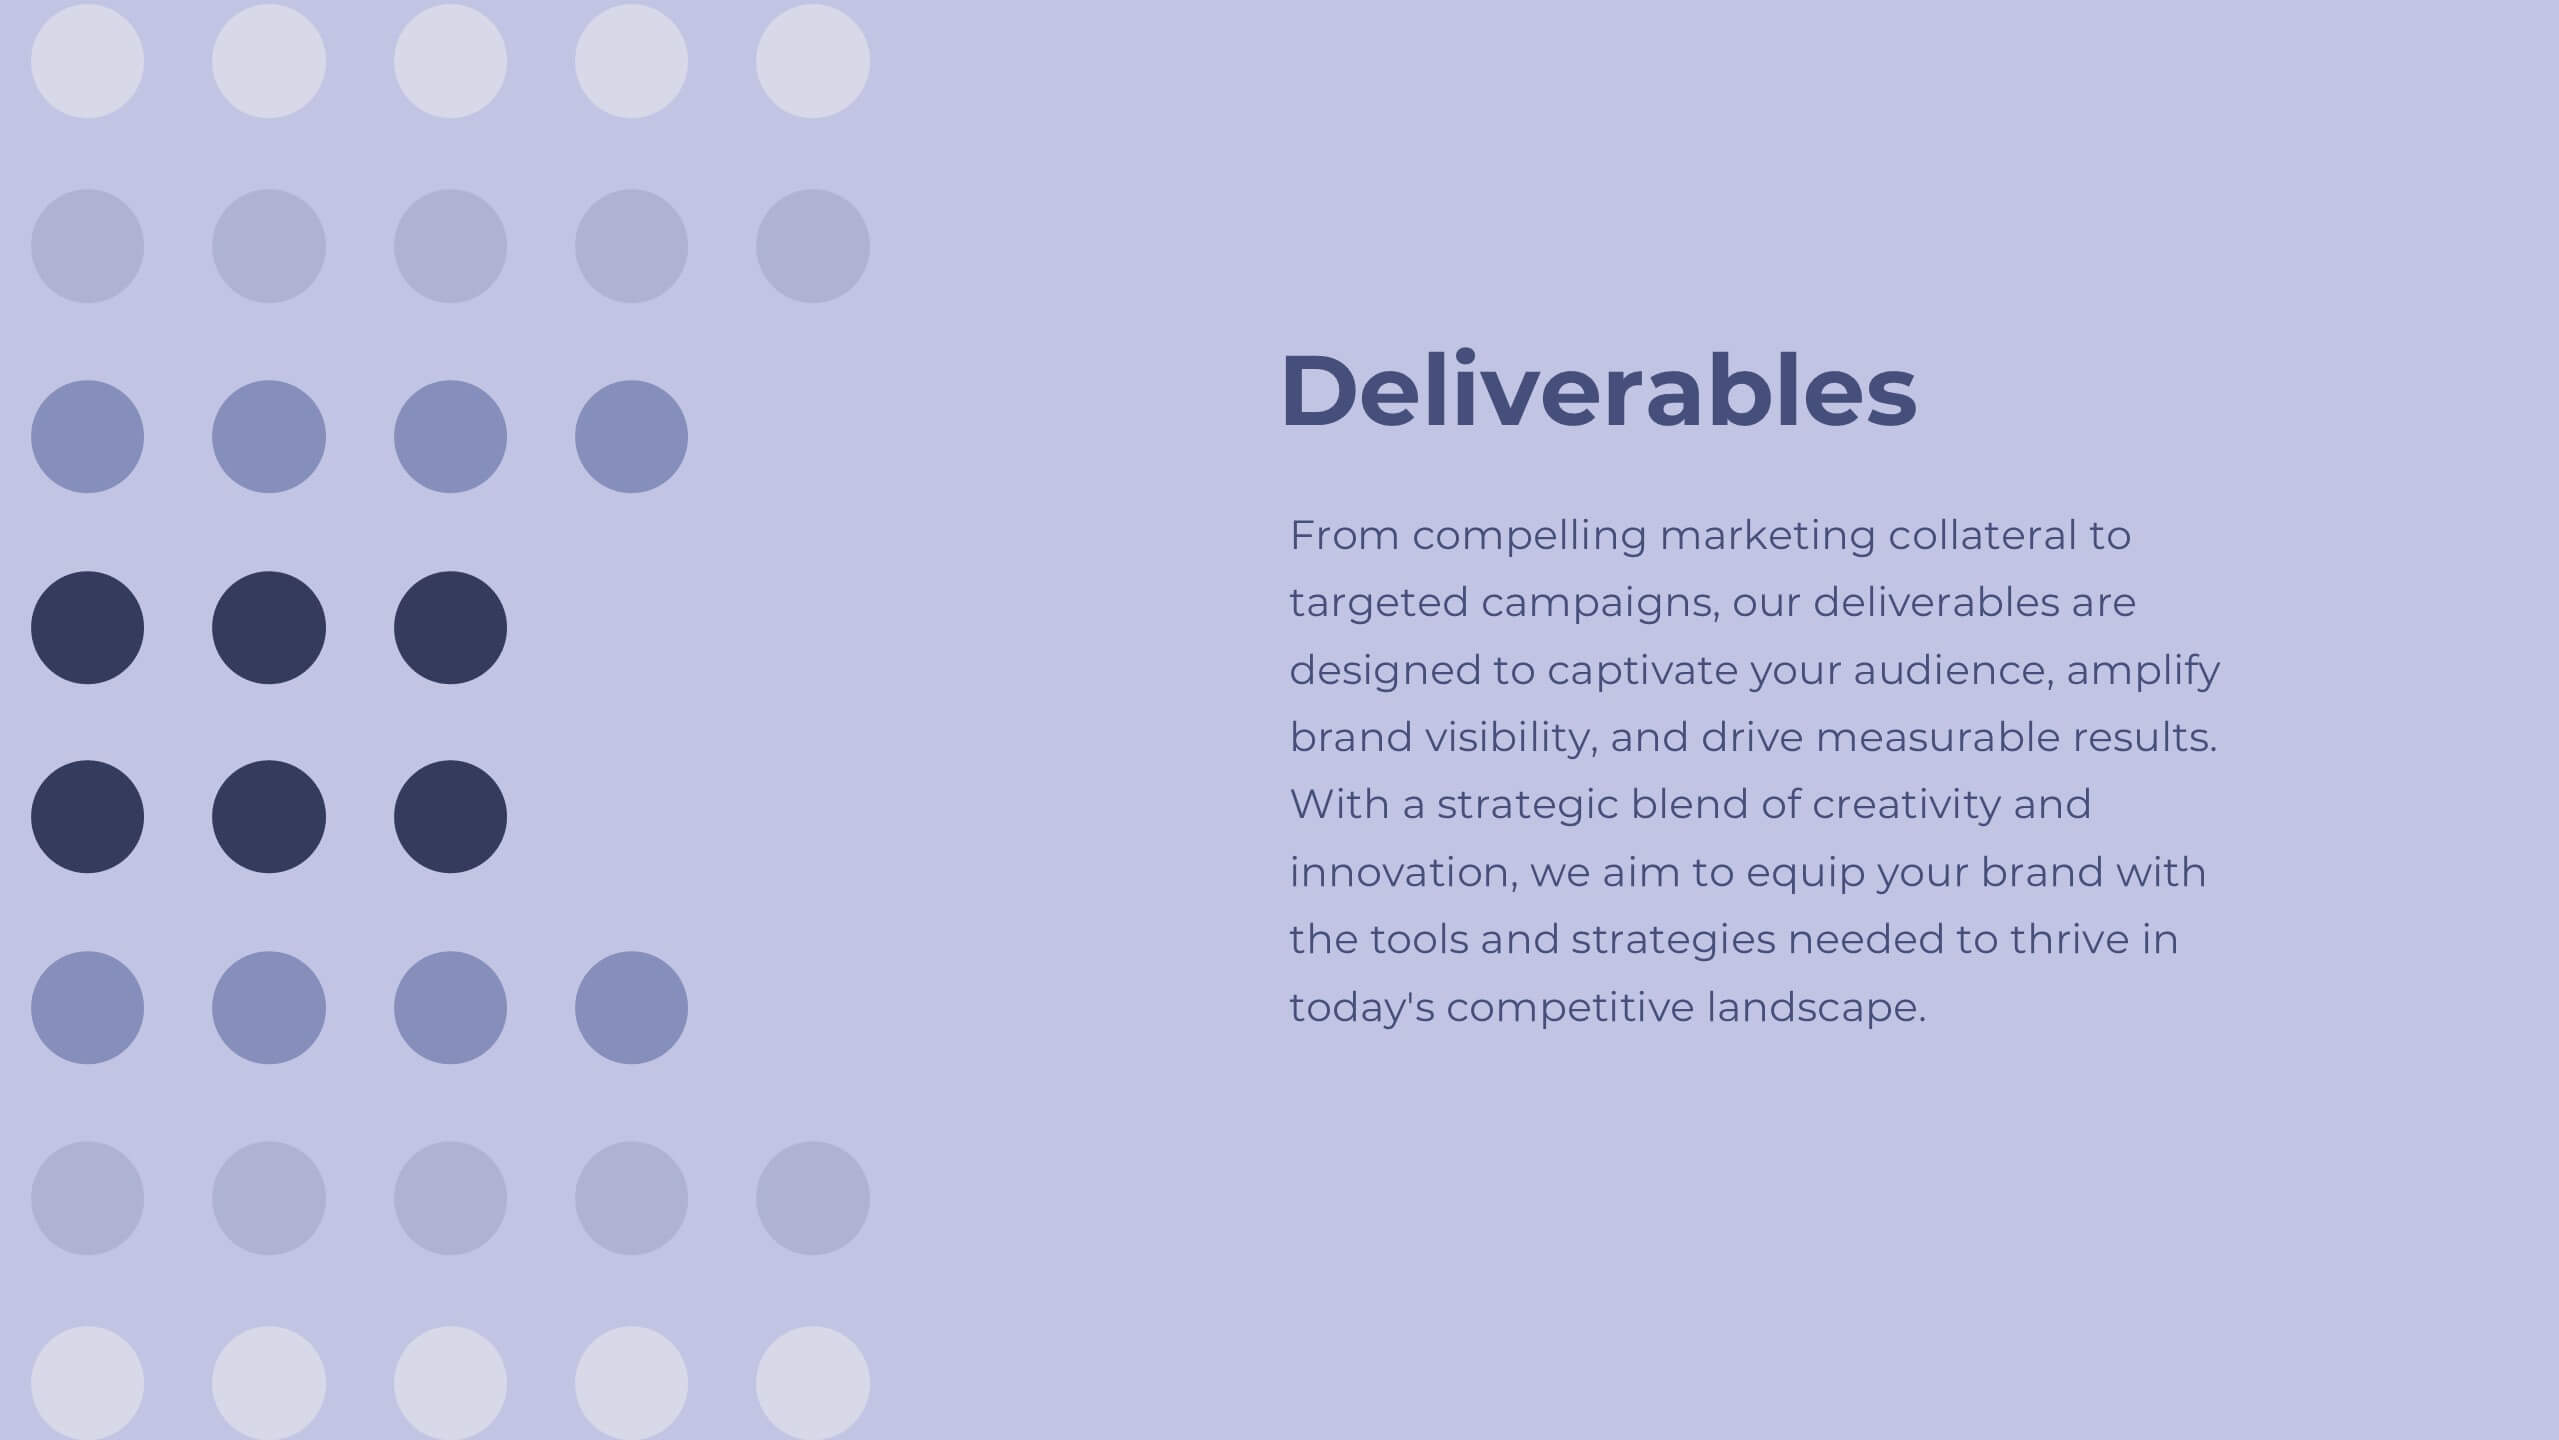
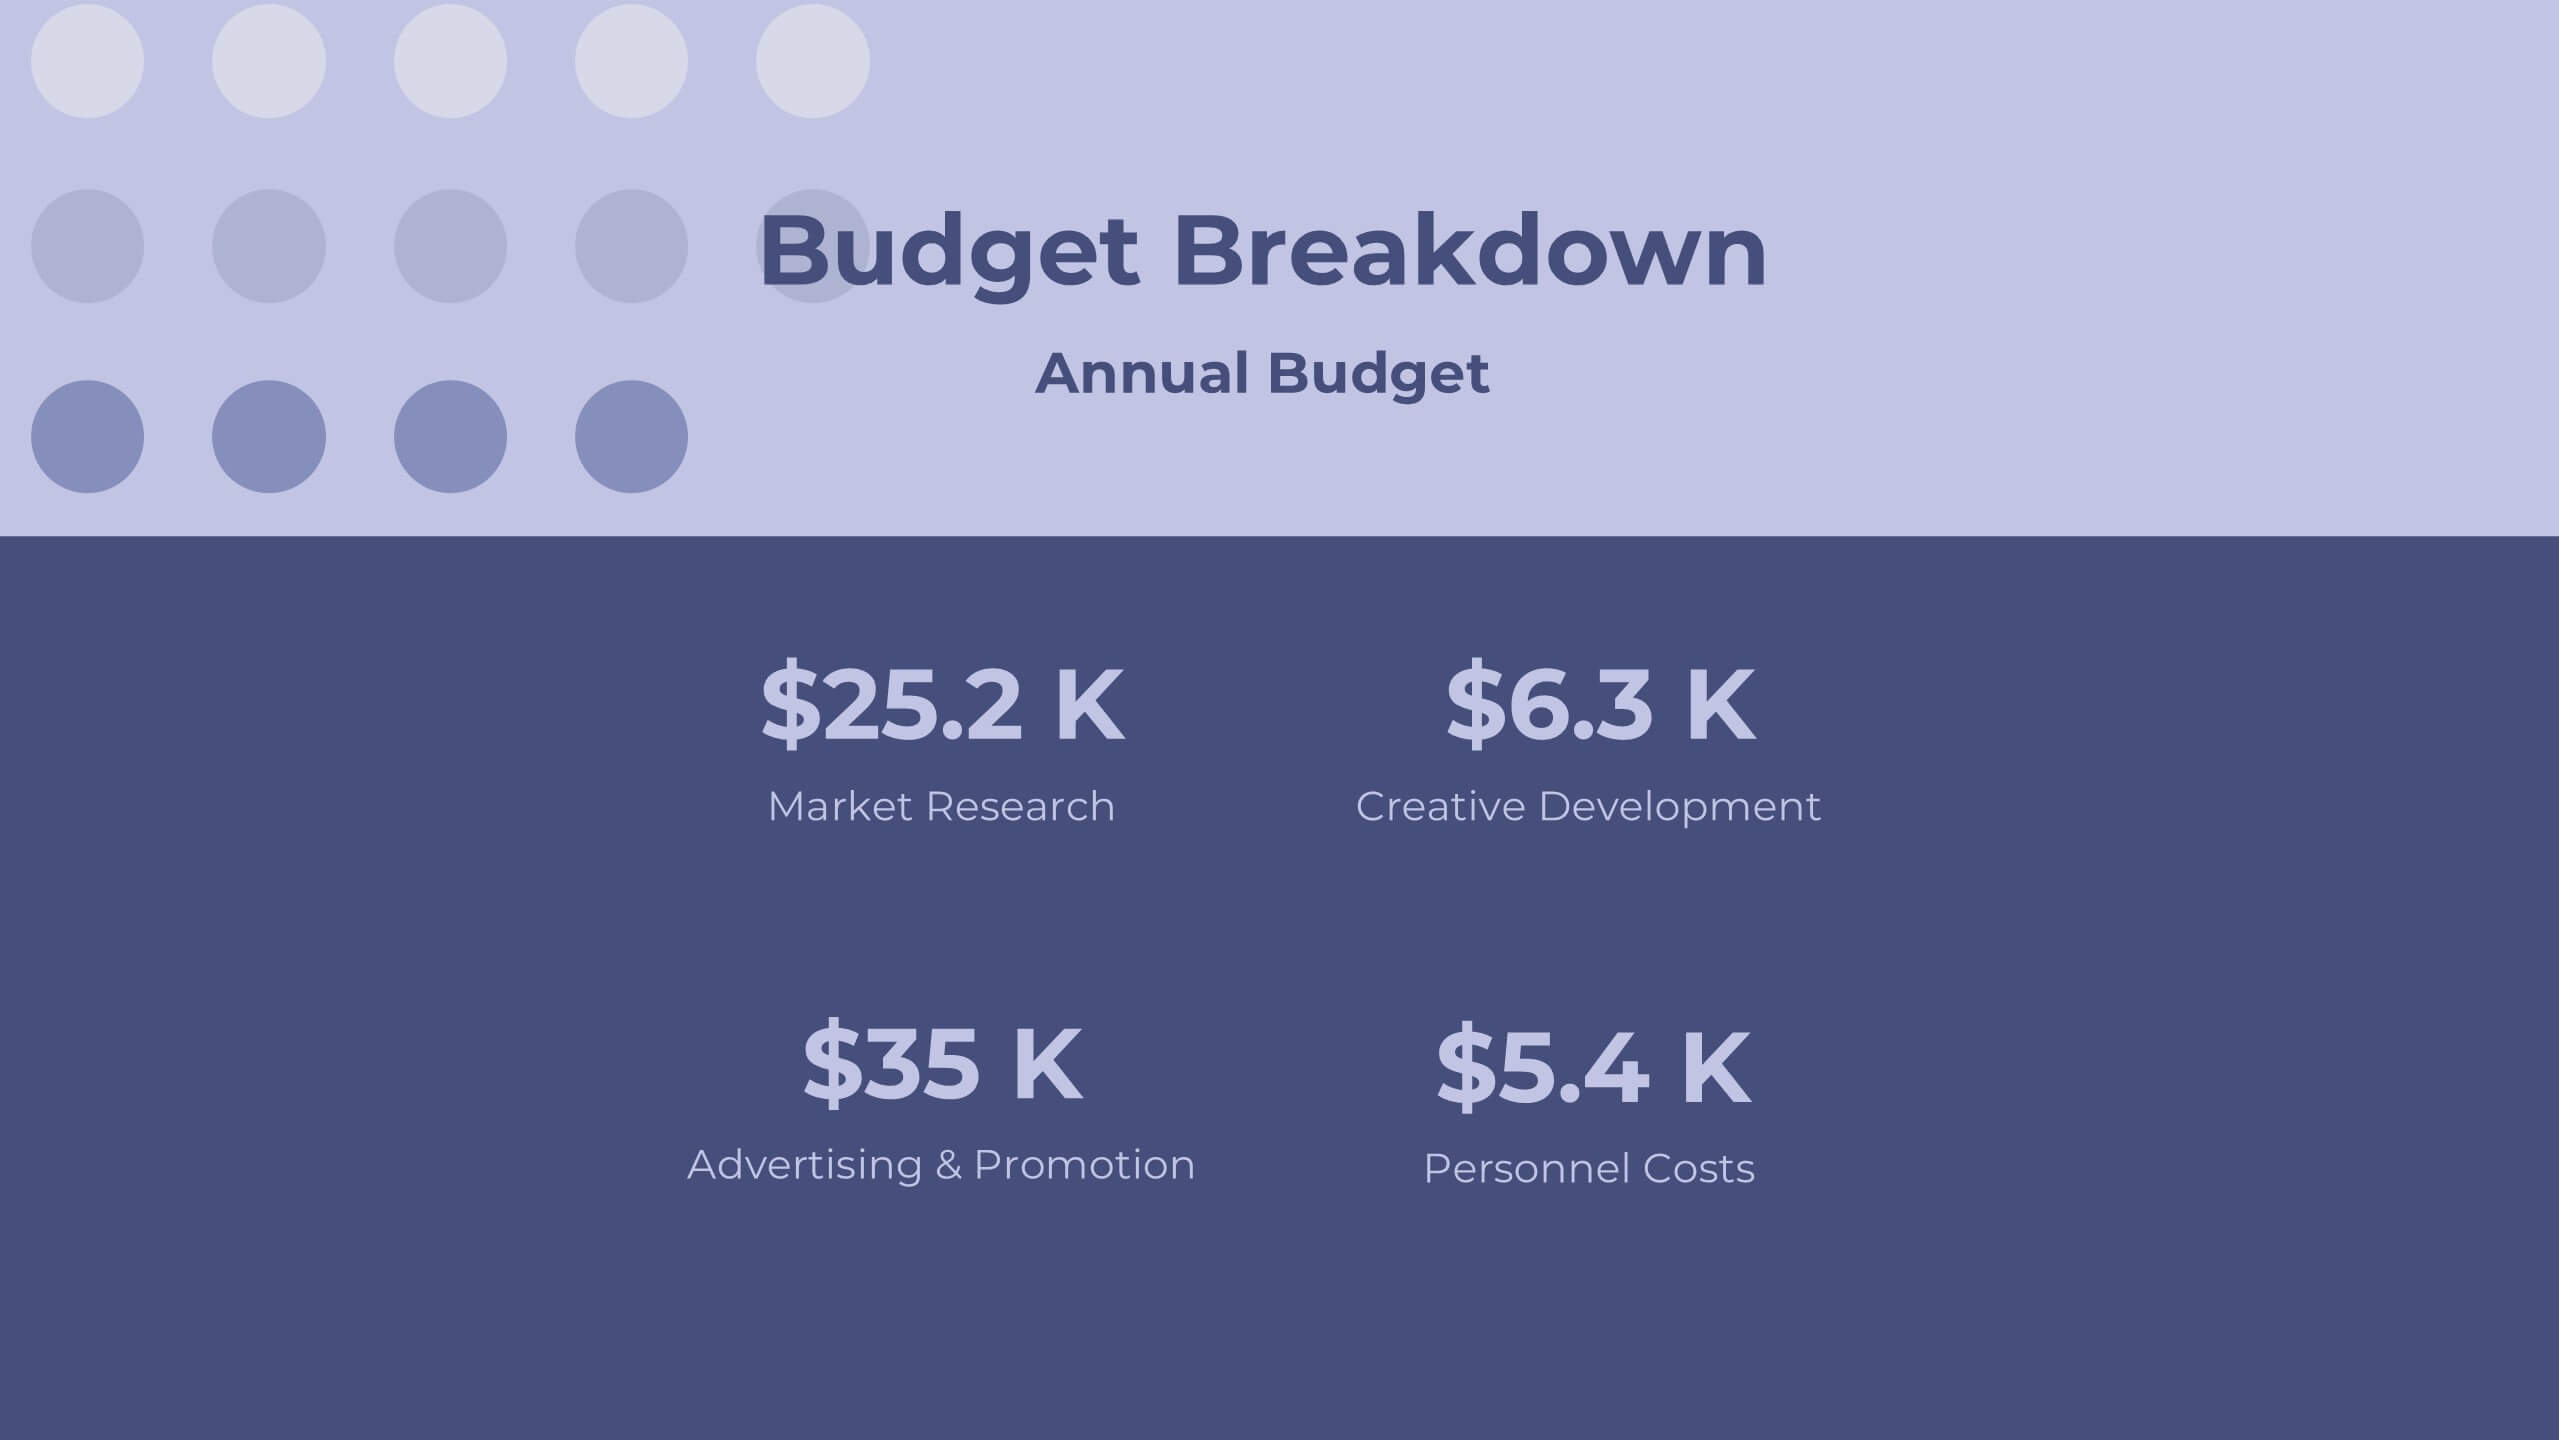
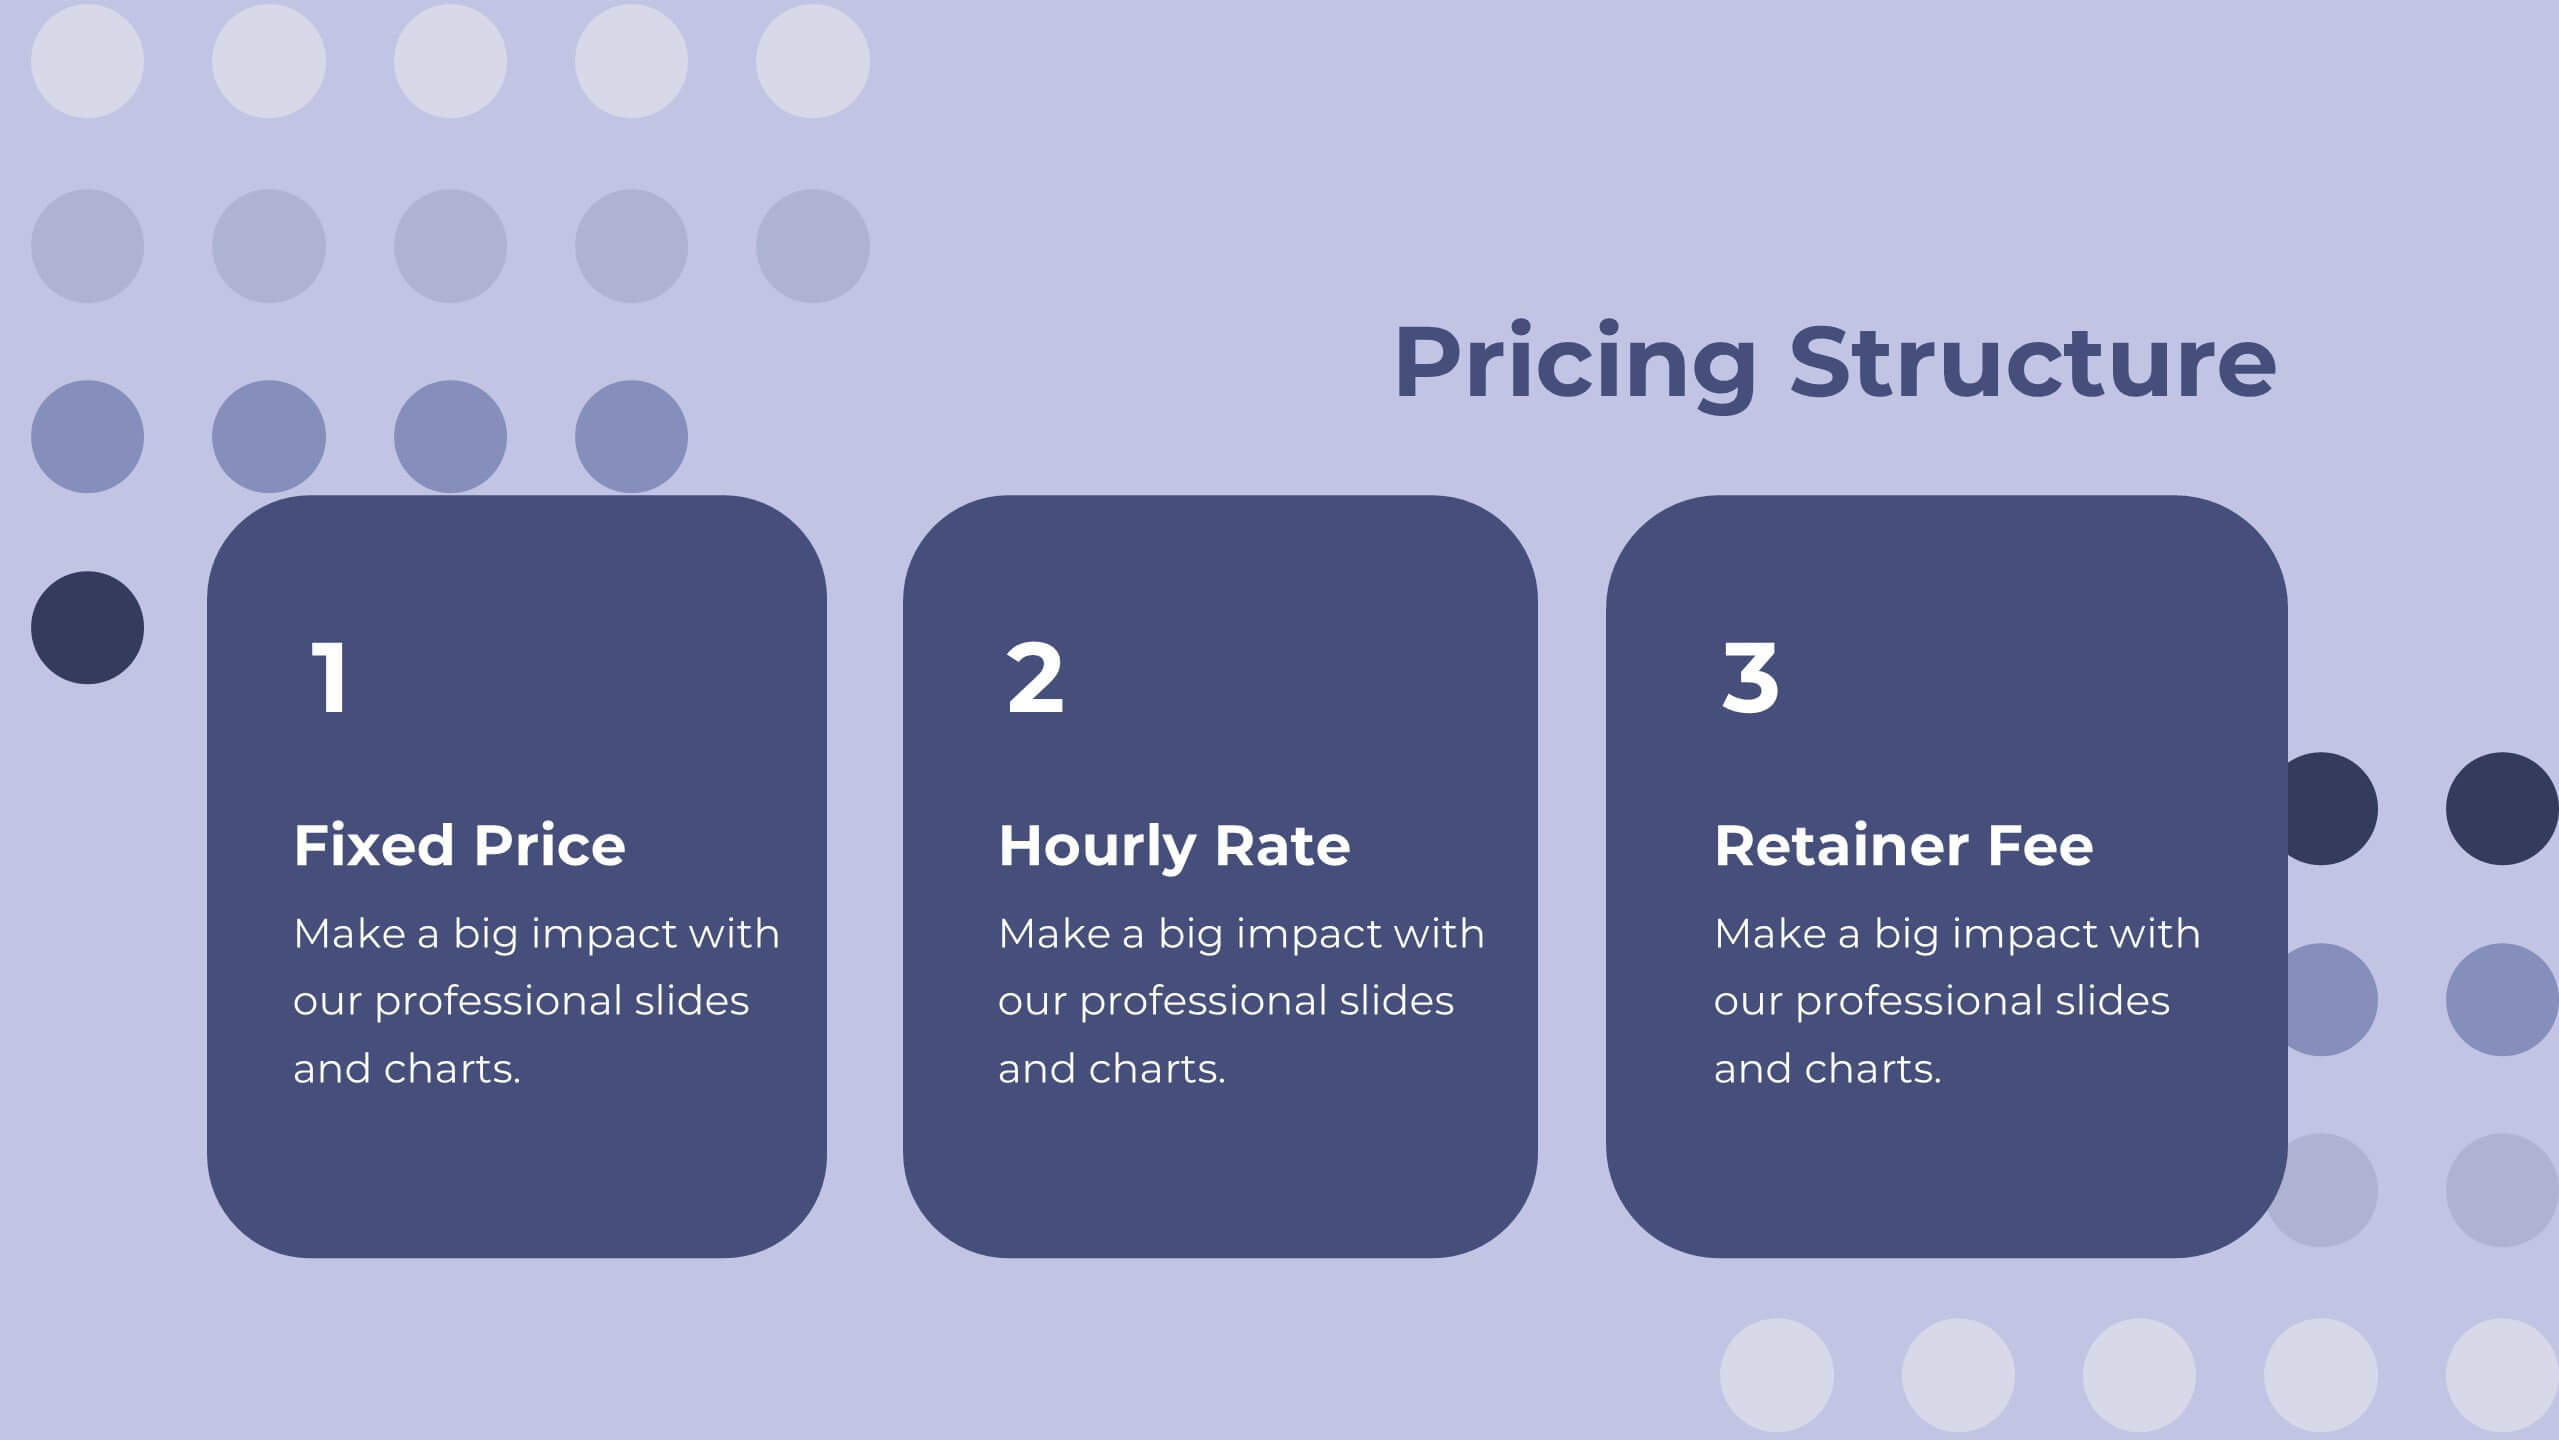
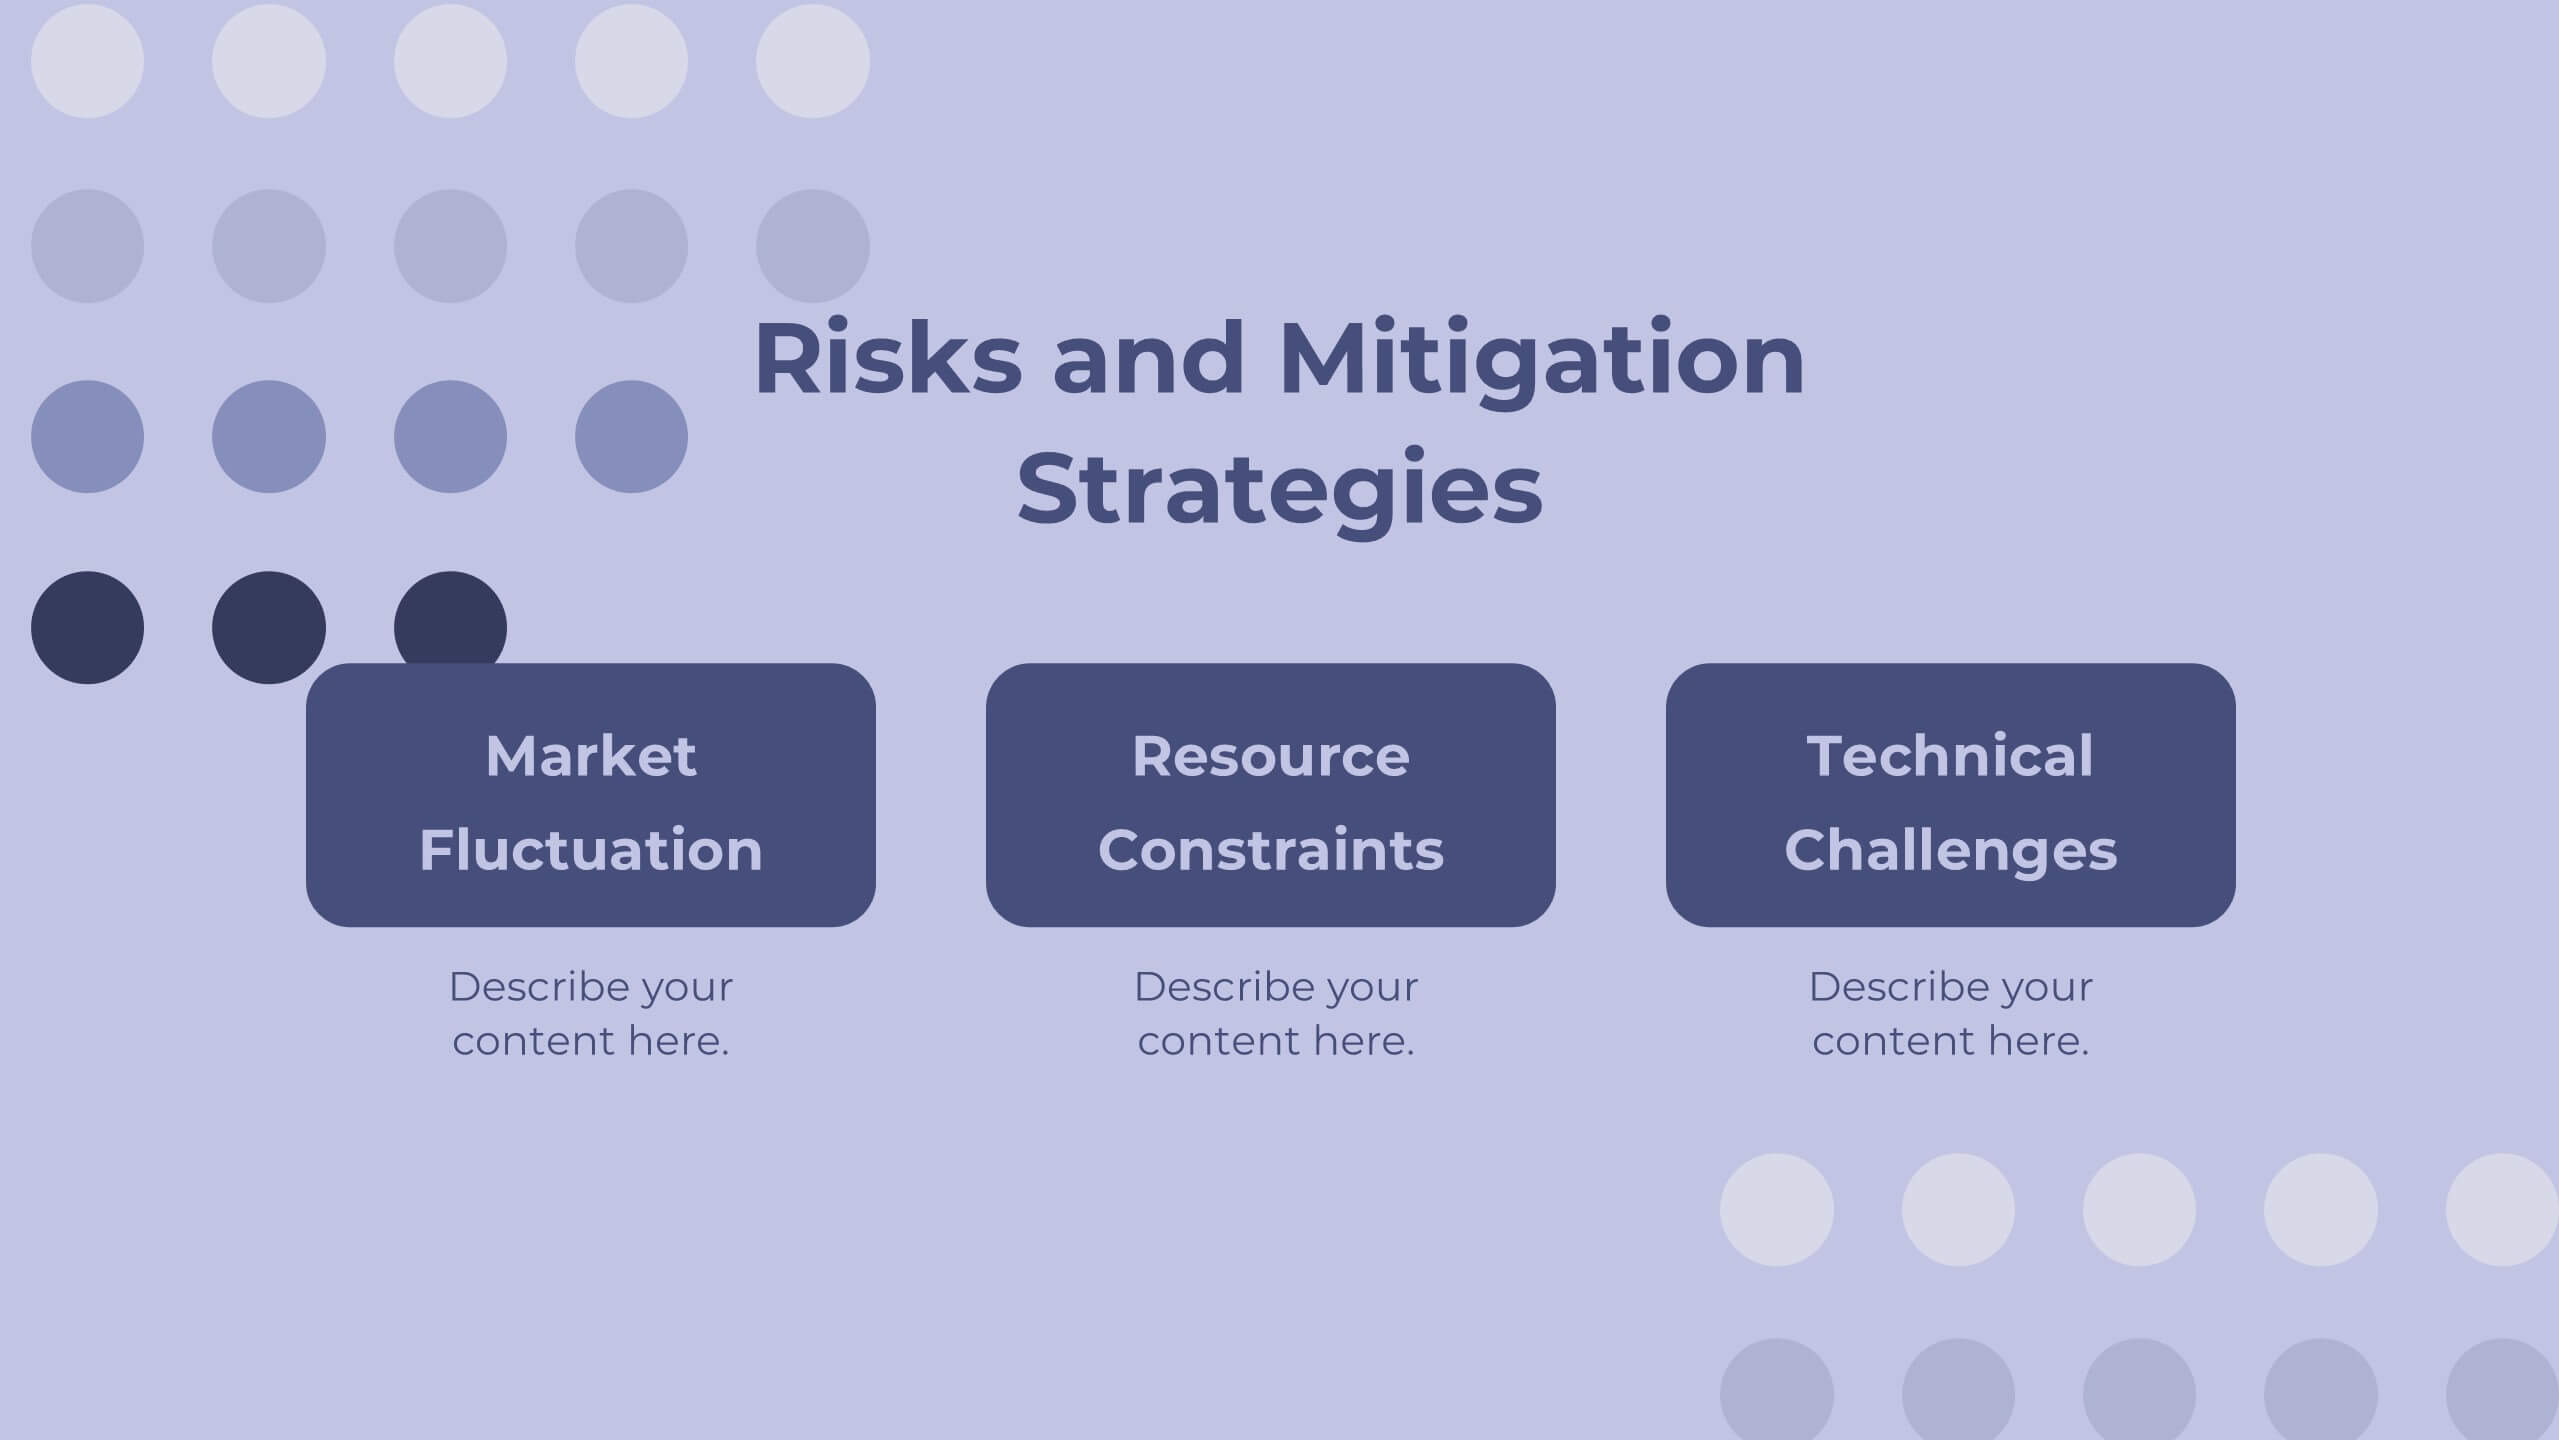
Labyrinth Project Proposal Presentation
Present your project proposal with this clean and professional template! Covering sections such as objectives, scope of work, timeline, and budget breakdown, it helps you convey your plan clearly and effectively. Fully customizable and compatible with PowerPoint, Keynote, and Google Slides, it’s perfect for delivering impactful proposals to clients.


22 diapositivas
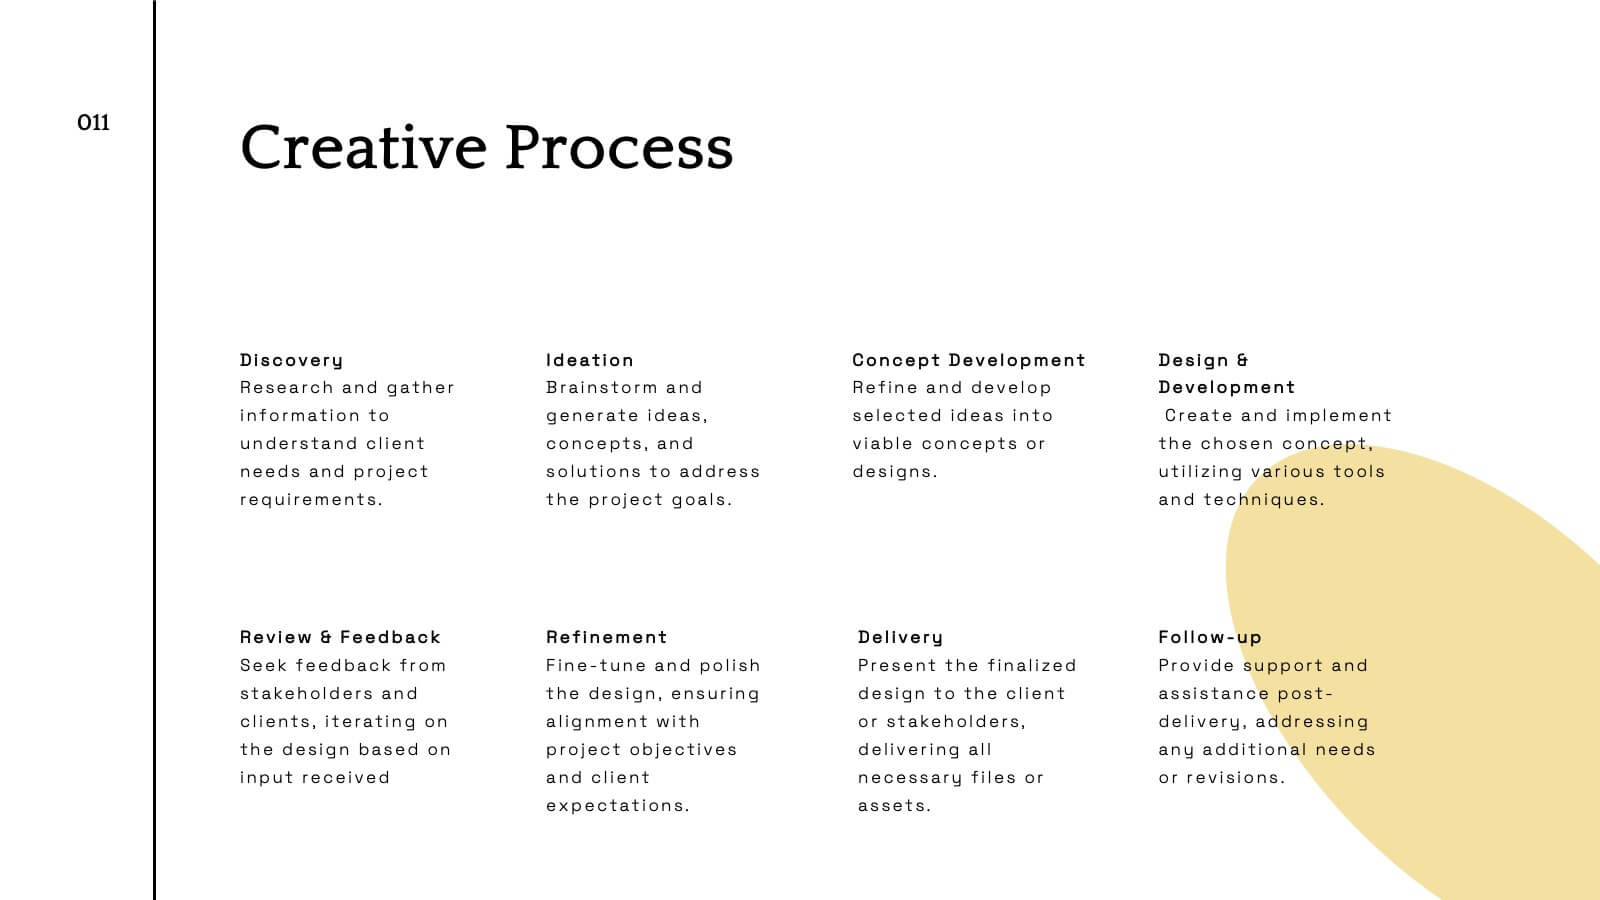
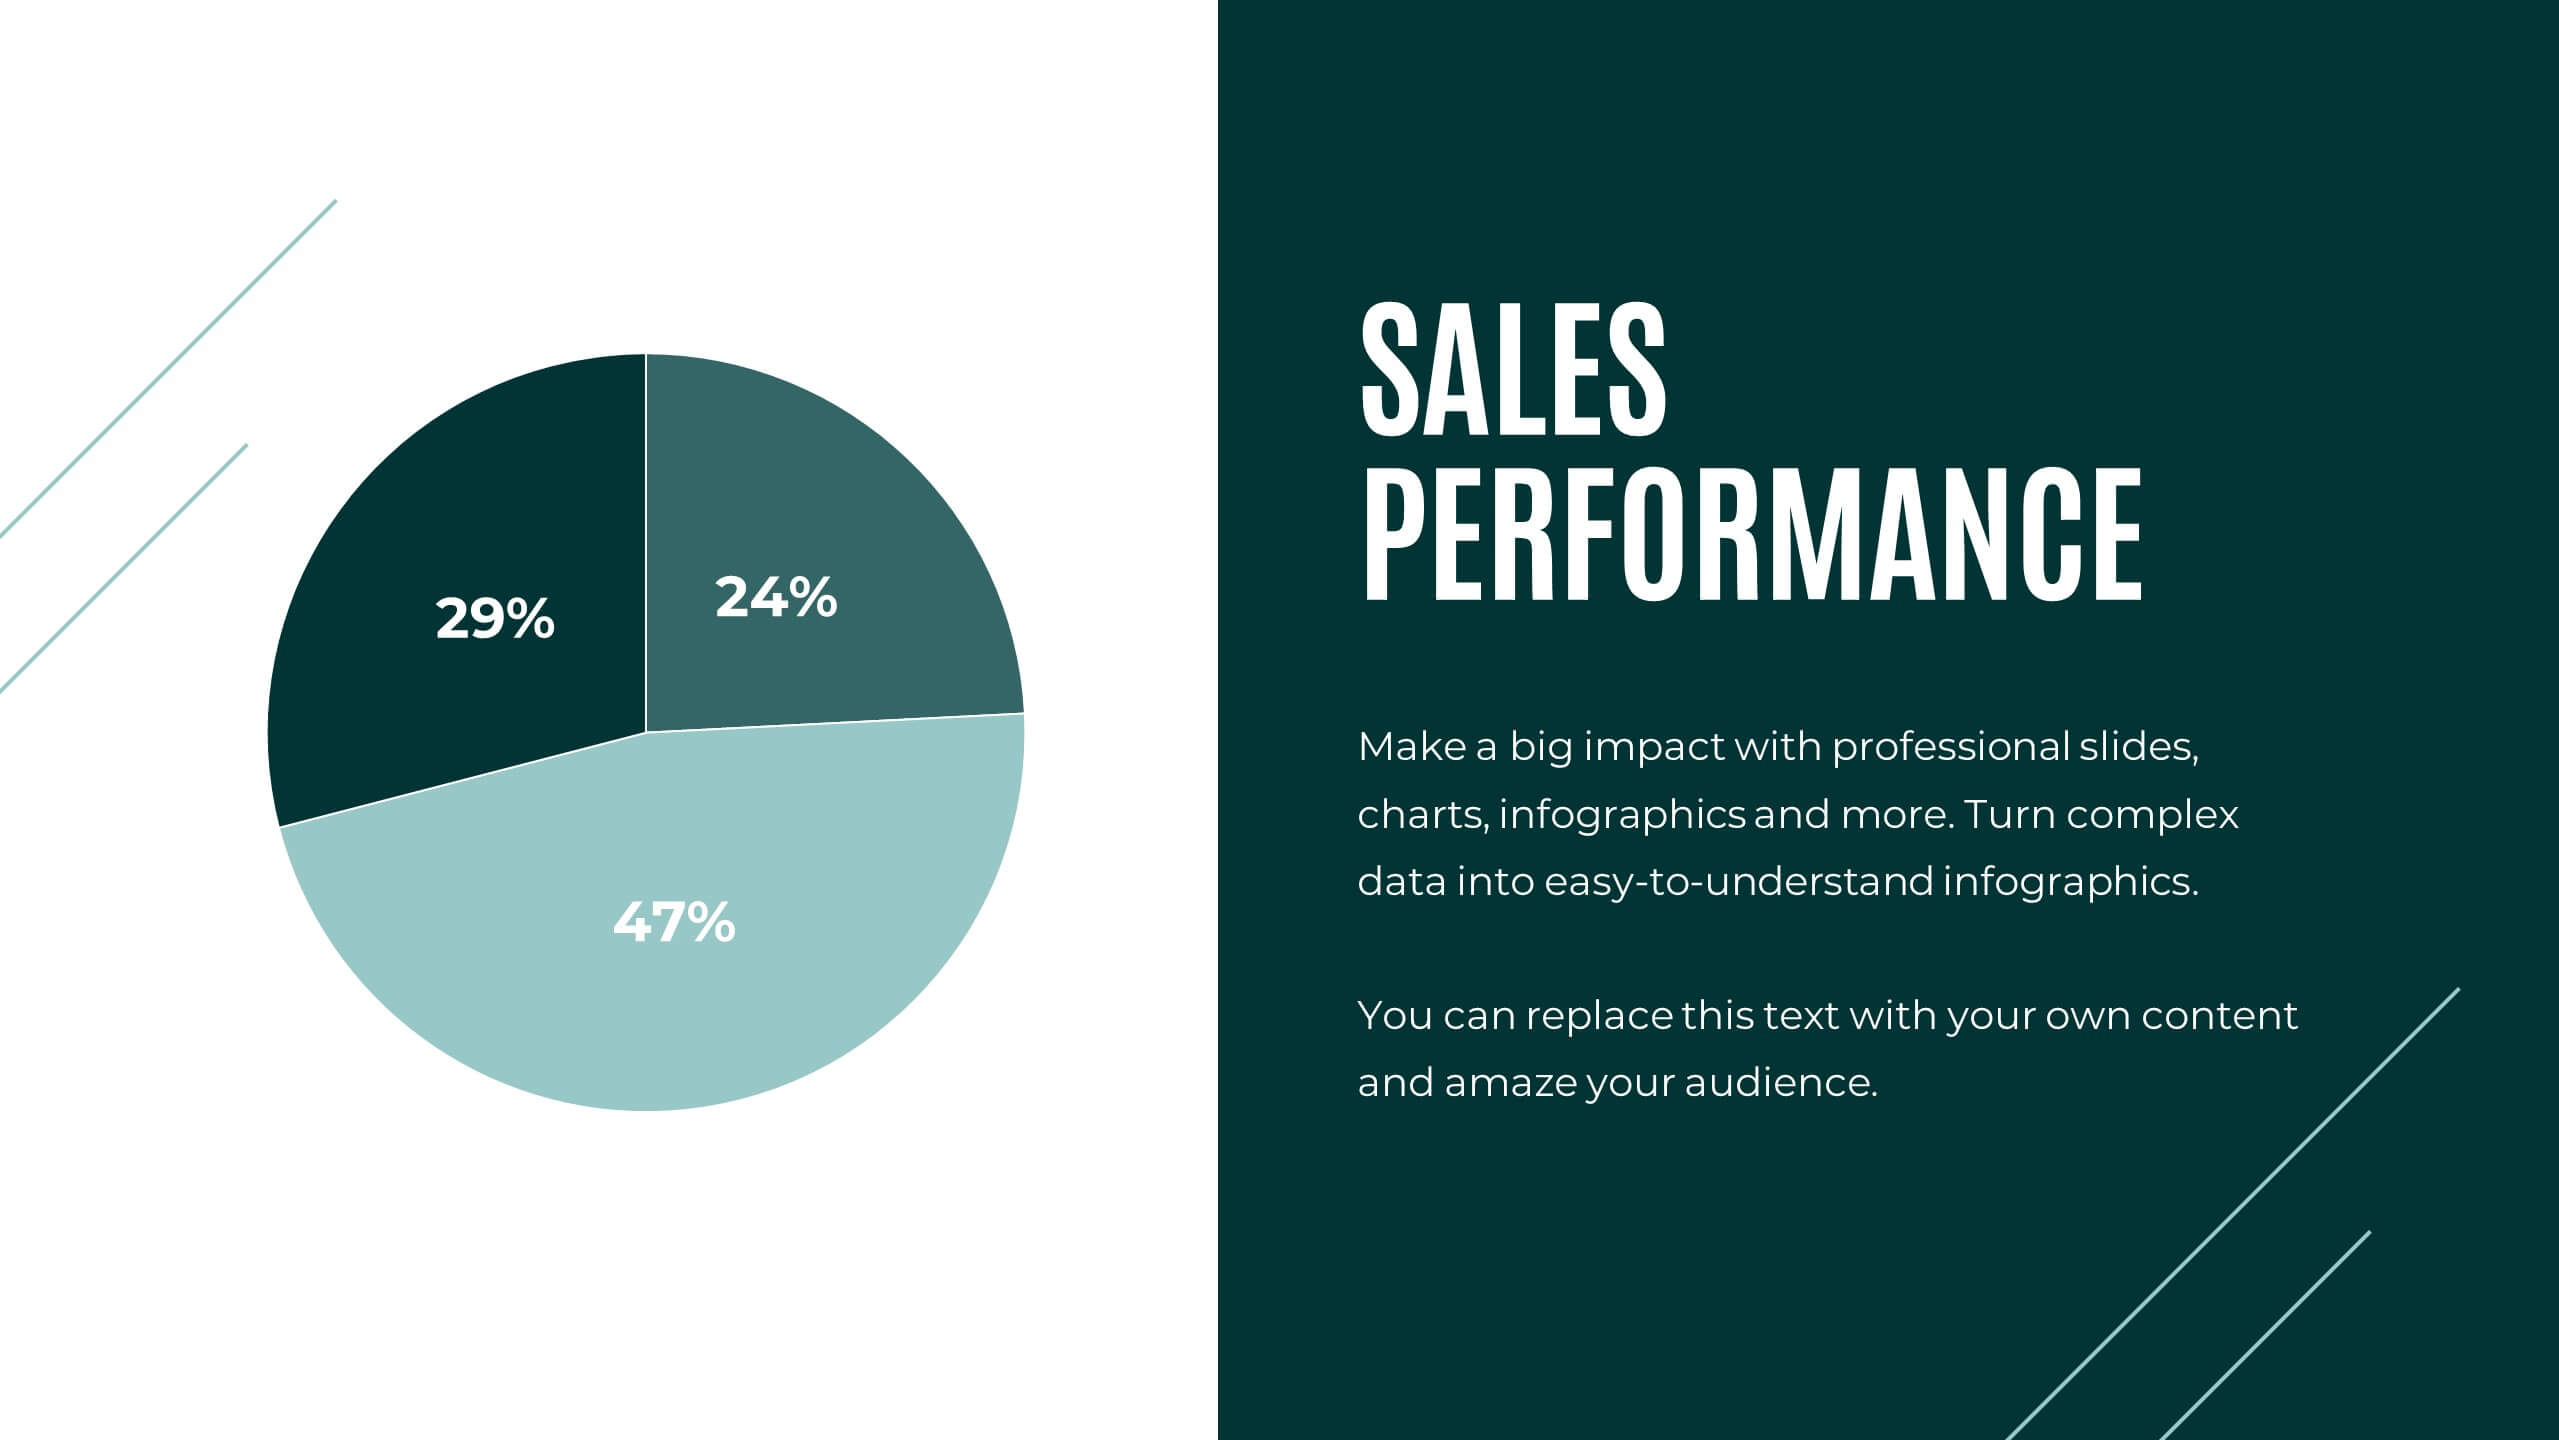
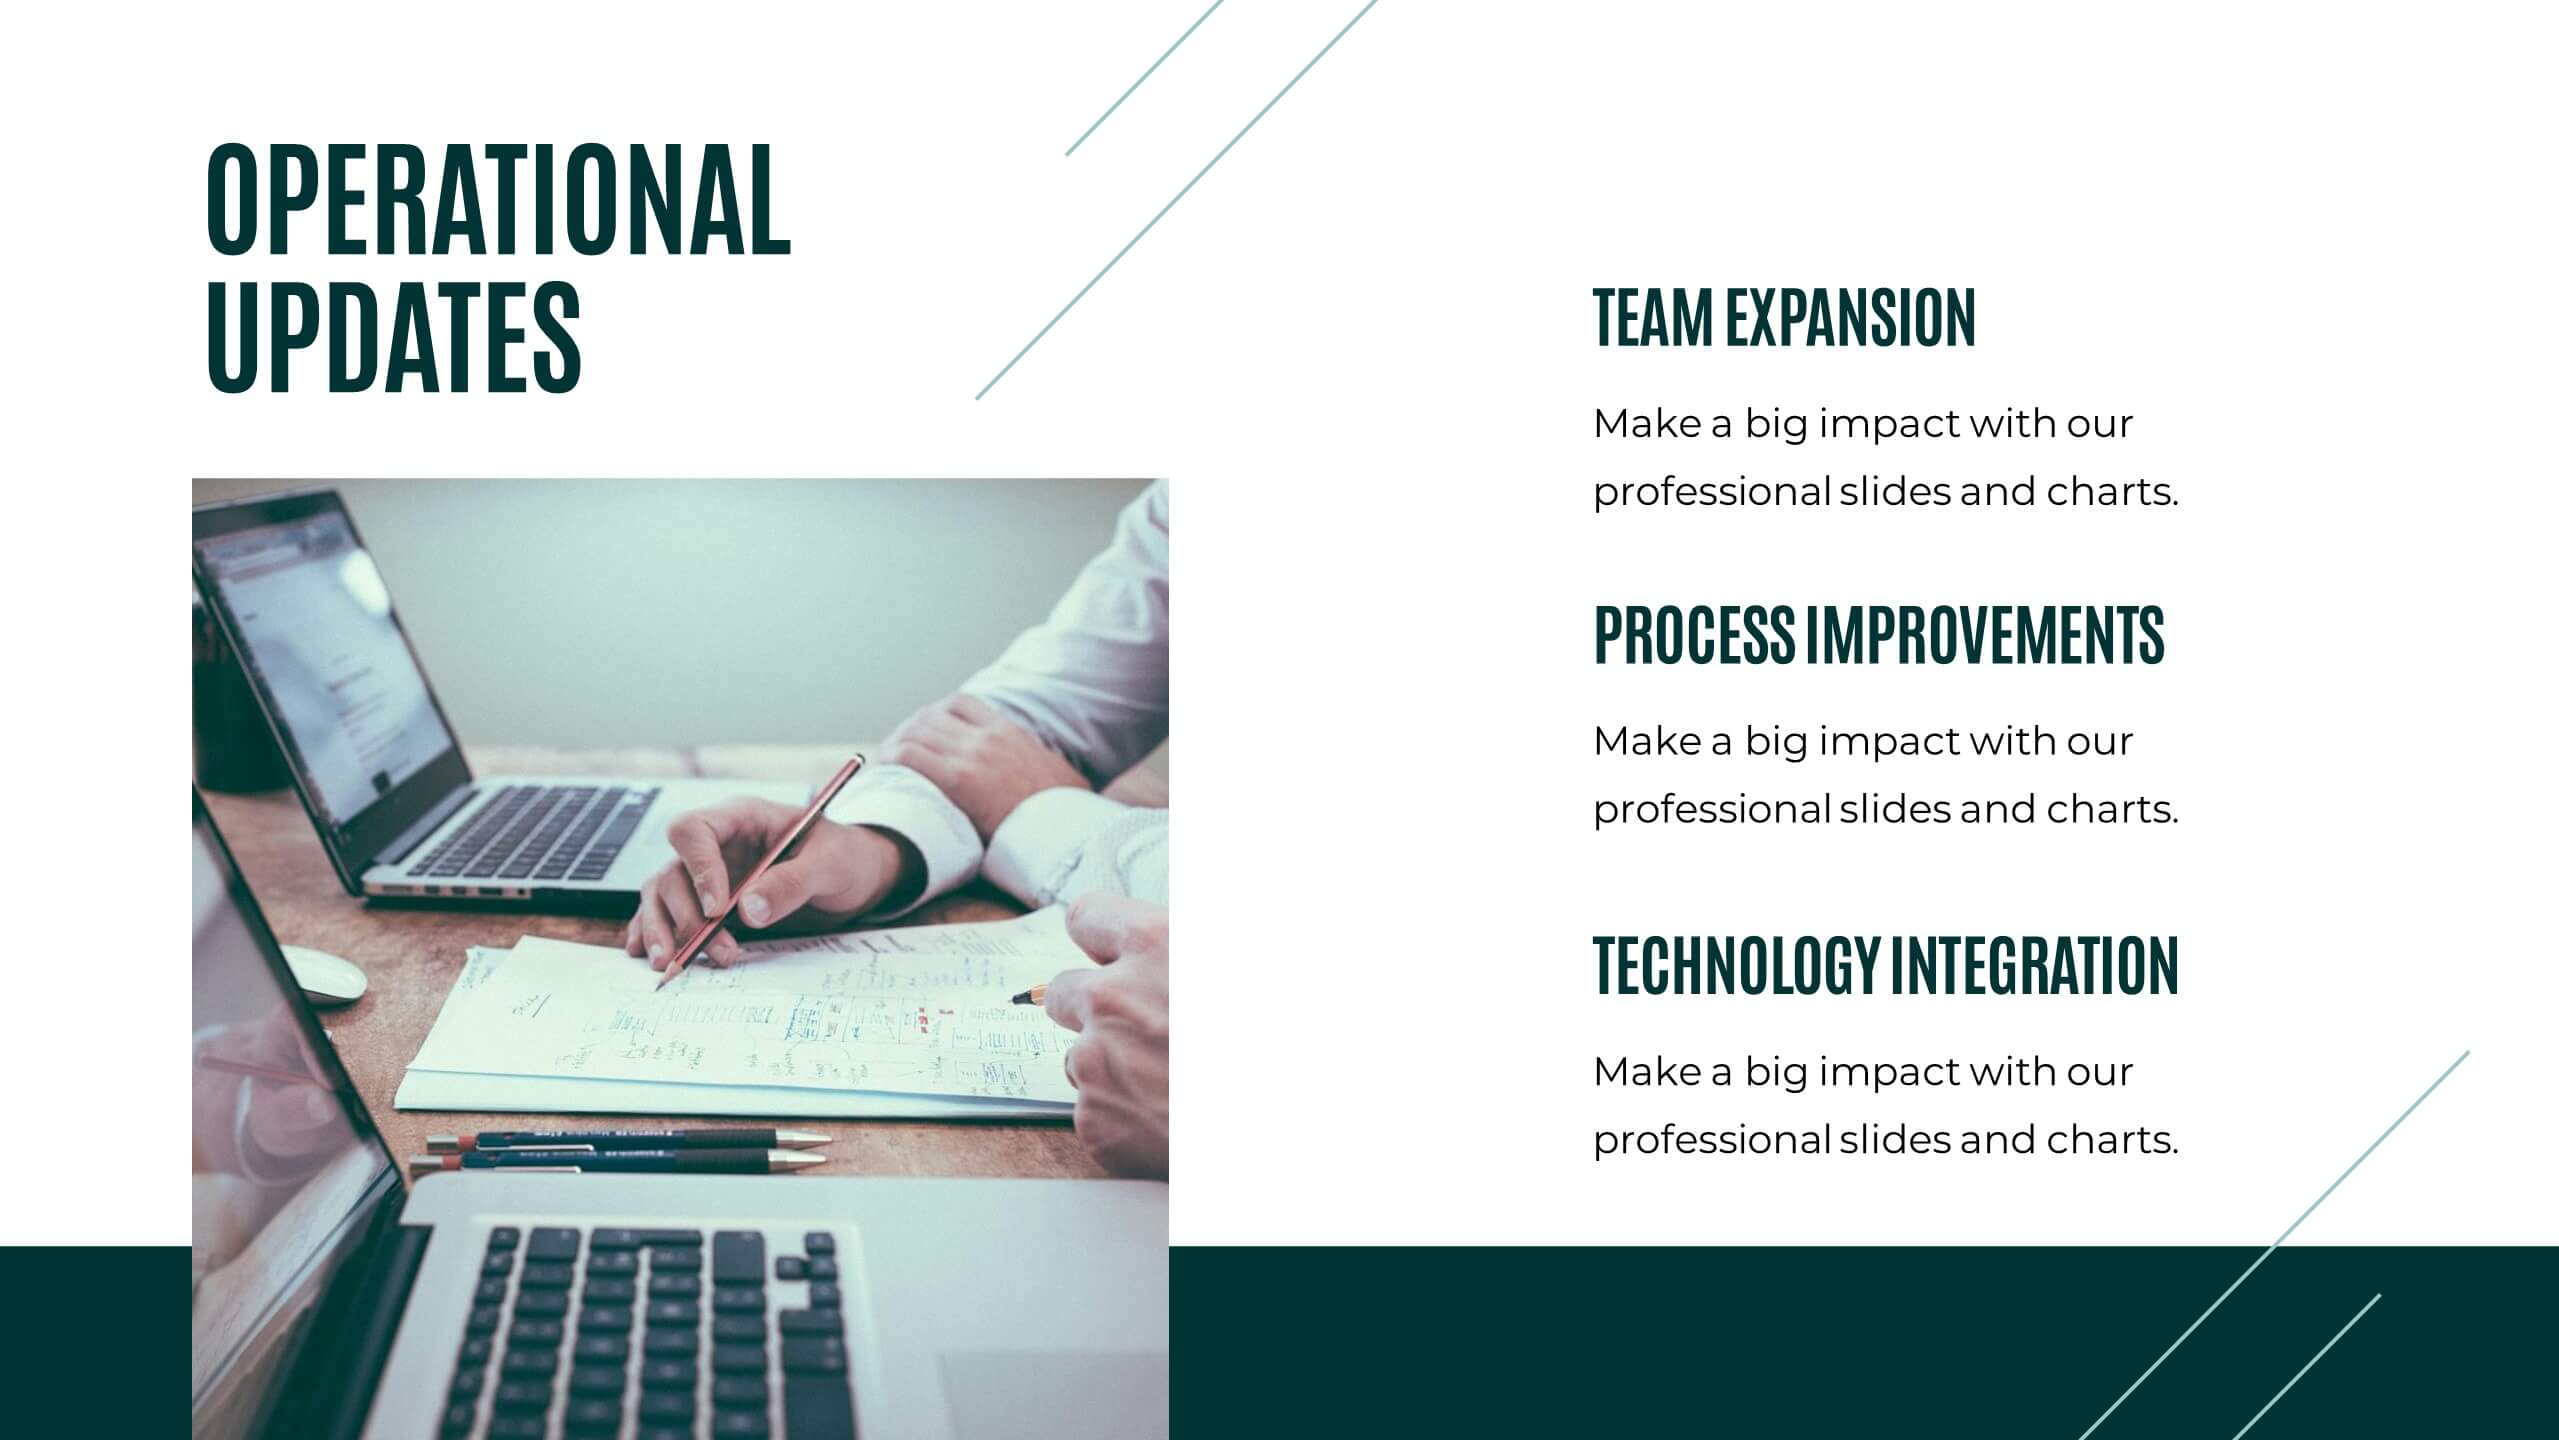
Sublimix Business Operations Plan Presentation
Streamline your company’s workflow with this bold and modern business operations plan presentation. Covering key areas like performance metrics, resource allocation, process improvements, and collaboration opportunities, this template helps you optimize efficiency and strategy. Fully customizable and compatible with PowerPoint, Keynote, and Google Slides for a seamless, professional presentation experience.


6 diapositivas
Network Solution Infographic
Network Solution refers to a system of interconnected components or entities that work together to achieve a specific purpose, whether that's communication, collaboration, or something else. This infographic template can be a powerful way to visually represent various aspects of a network, whether it's a computer network, social network, or any interconnected system. This is fully customizable and compatible with Powerpoint, Keynote, and Google Slides. This allows you to keep the infographic visually appealing, informative, and easy to understand. The goal is to help your audience grasp complex network concepts at a glance.