


Características


¿Tienes alguna pregunta?
Recomendar


6 diapositivas
Risk Management Strategies Infographic
Risk management is the process of identifying, assessing, prioritizing, and mitigating risks in order to minimize their impact on an organization's objectives and projects. This infographic template is designed to convey important information about identifying, assessing, and mitigating risks in various contexts. The icons and symbols are added to represent different stages of risk management, such as identification, assessment, mitigation, and monitoring. This Infographic can effectively communicate the importance of risk management and provide insights into the strategies used to mitigate potential risks in various contexts.


5 diapositivas
Scrum Team Roles Presentation
A clear, engaging layout brings this presentation to life, making it easy to explain how each role contributes to a productive, collaborative workflow. Designed to simplify complex team structures, it helps you communicate responsibilities with confidence and clarity. Fully compatible with PowerPoint, Keynote, and Google Slides.


6 diapositivas
Customer Journey Map Infographic
A customer journey map is a visual representation of the steps and touchpoints that a customer goes through when interacting with a product, service, or brand. This infographic template is designed to illustrate the customer journey and enhance understanding of the customer's experience with a product or service. It offers a comprehensive visualization of the various touchpoints and emotions experienced by customers throughout their interaction. This template illustrates the entire end-to-end experience from the customer's perspective. Each stage is visually represented with icons and brief descriptions to provide a clear understanding of the customer's progression.


5 diapositivas
North America Business Landscape Map Presentation
Explore the business terrain with the "North America Business Landscape Map" template, which delivers a comprehensive visualization of business data across various regions. Designed for strategic presentations, it enables clear communication of market insights and data points, crucial for decision-making. This template is compatible with PowerPoint, Keynote, and Google Slides, enhancing its utility for professionals in diverse fields.


21 diapositivas
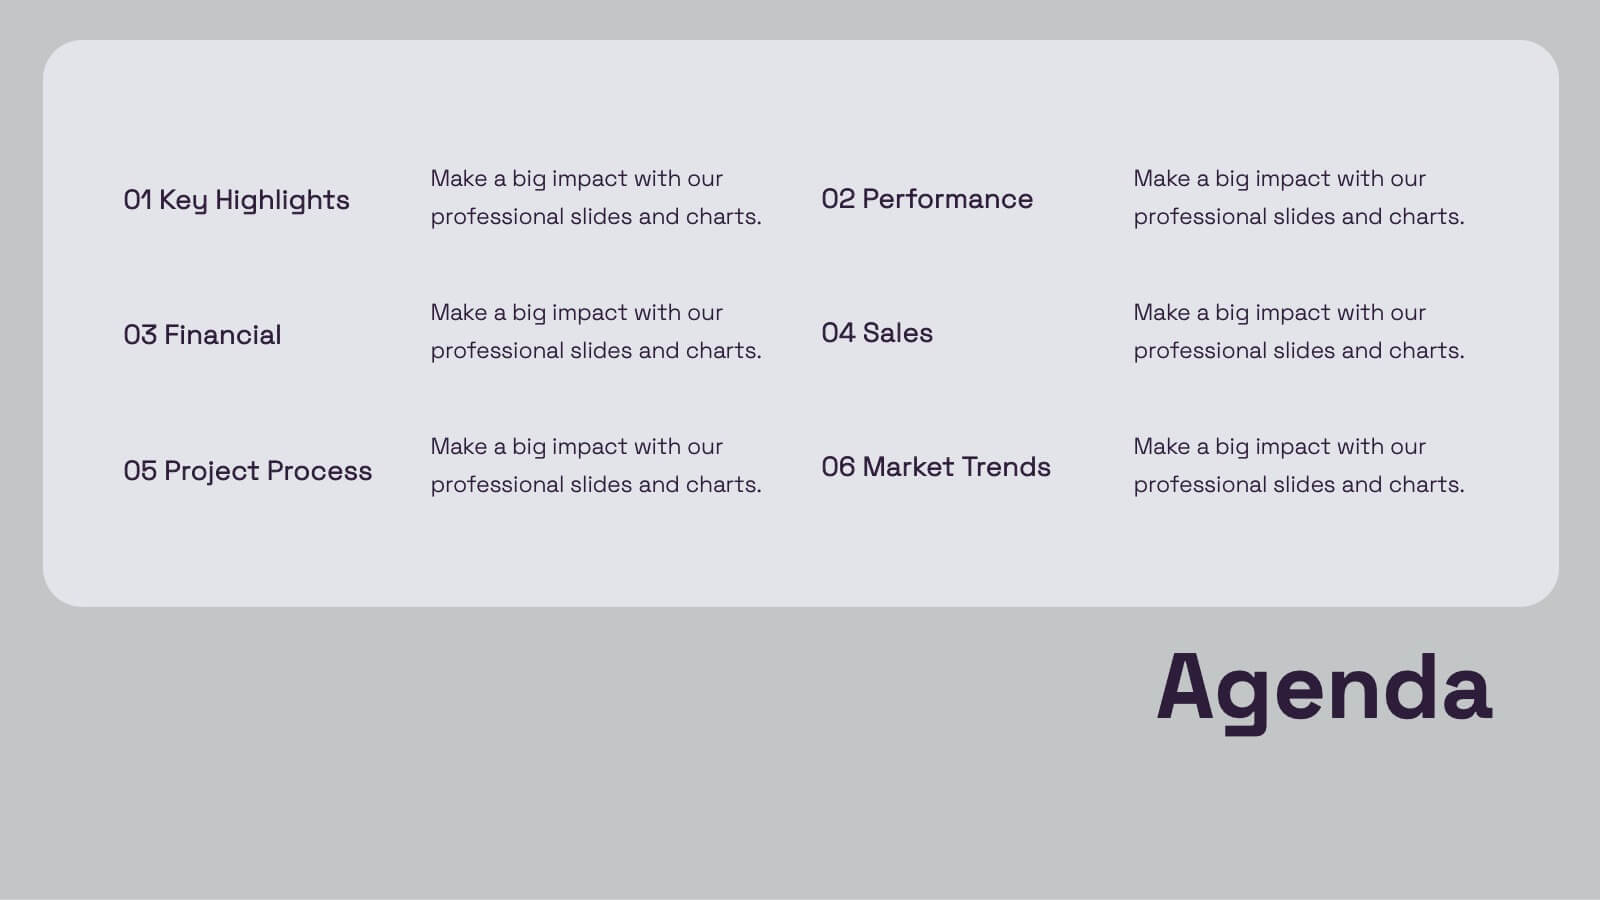
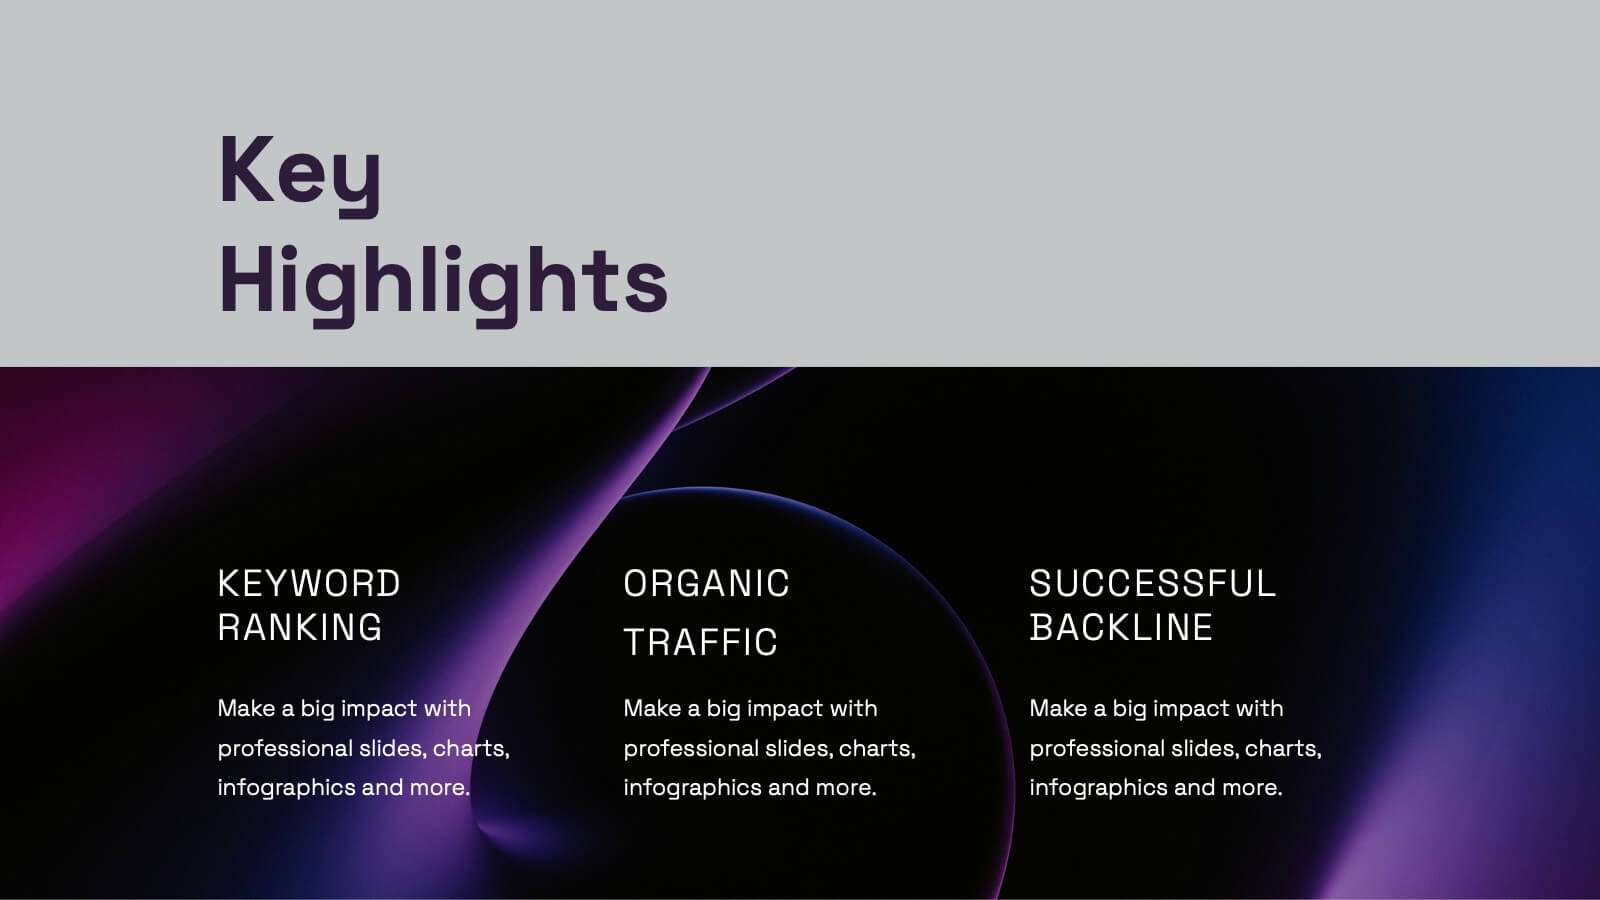
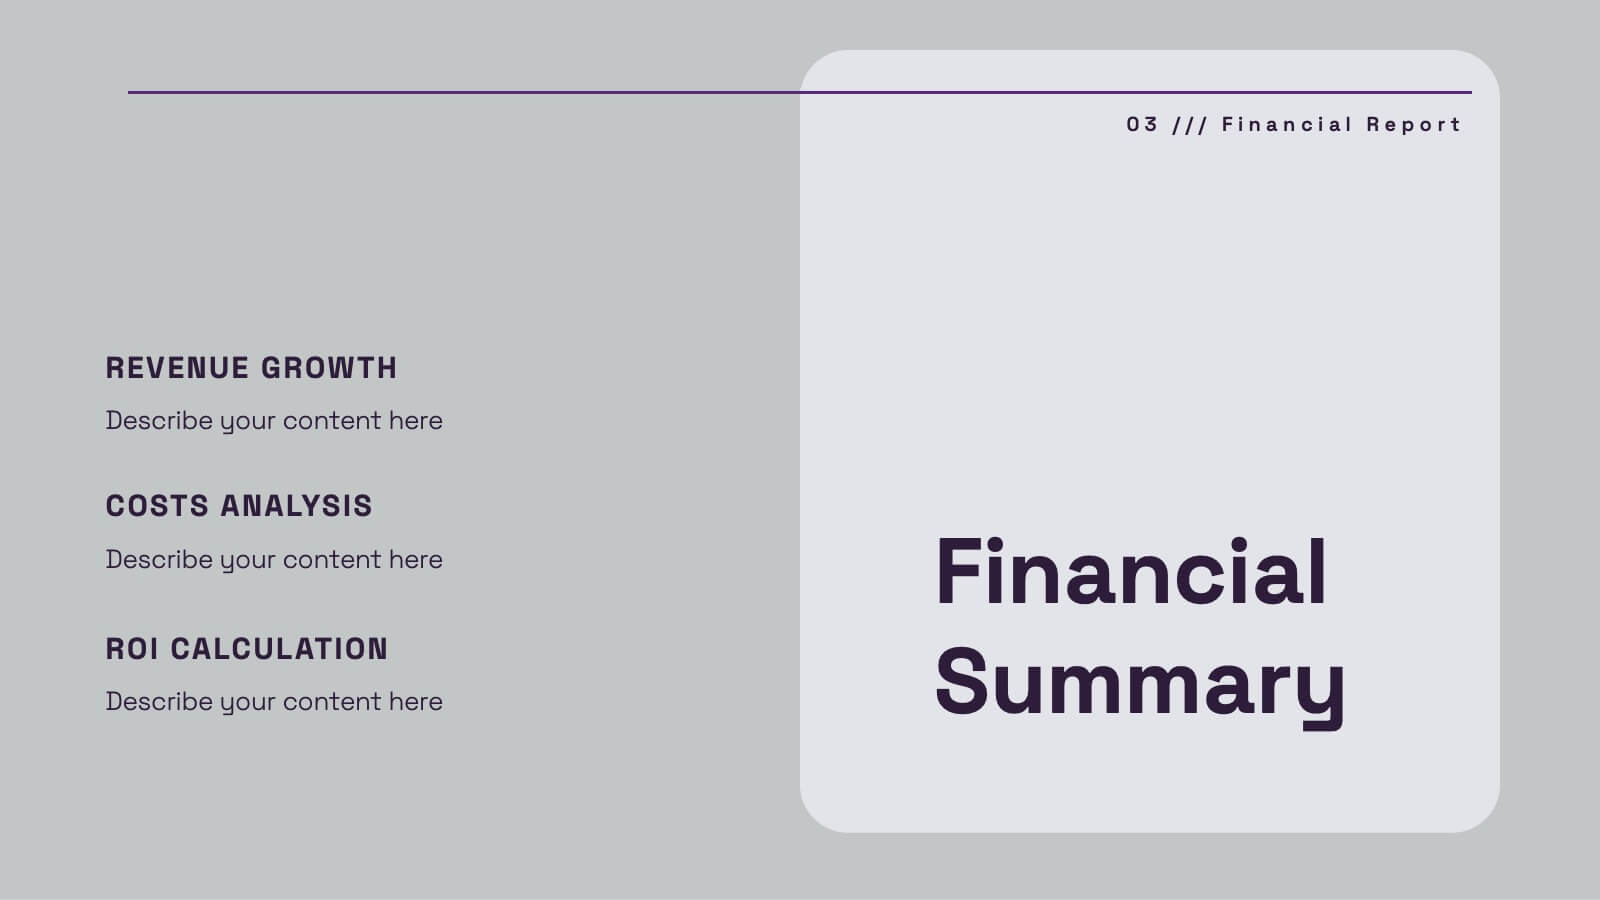
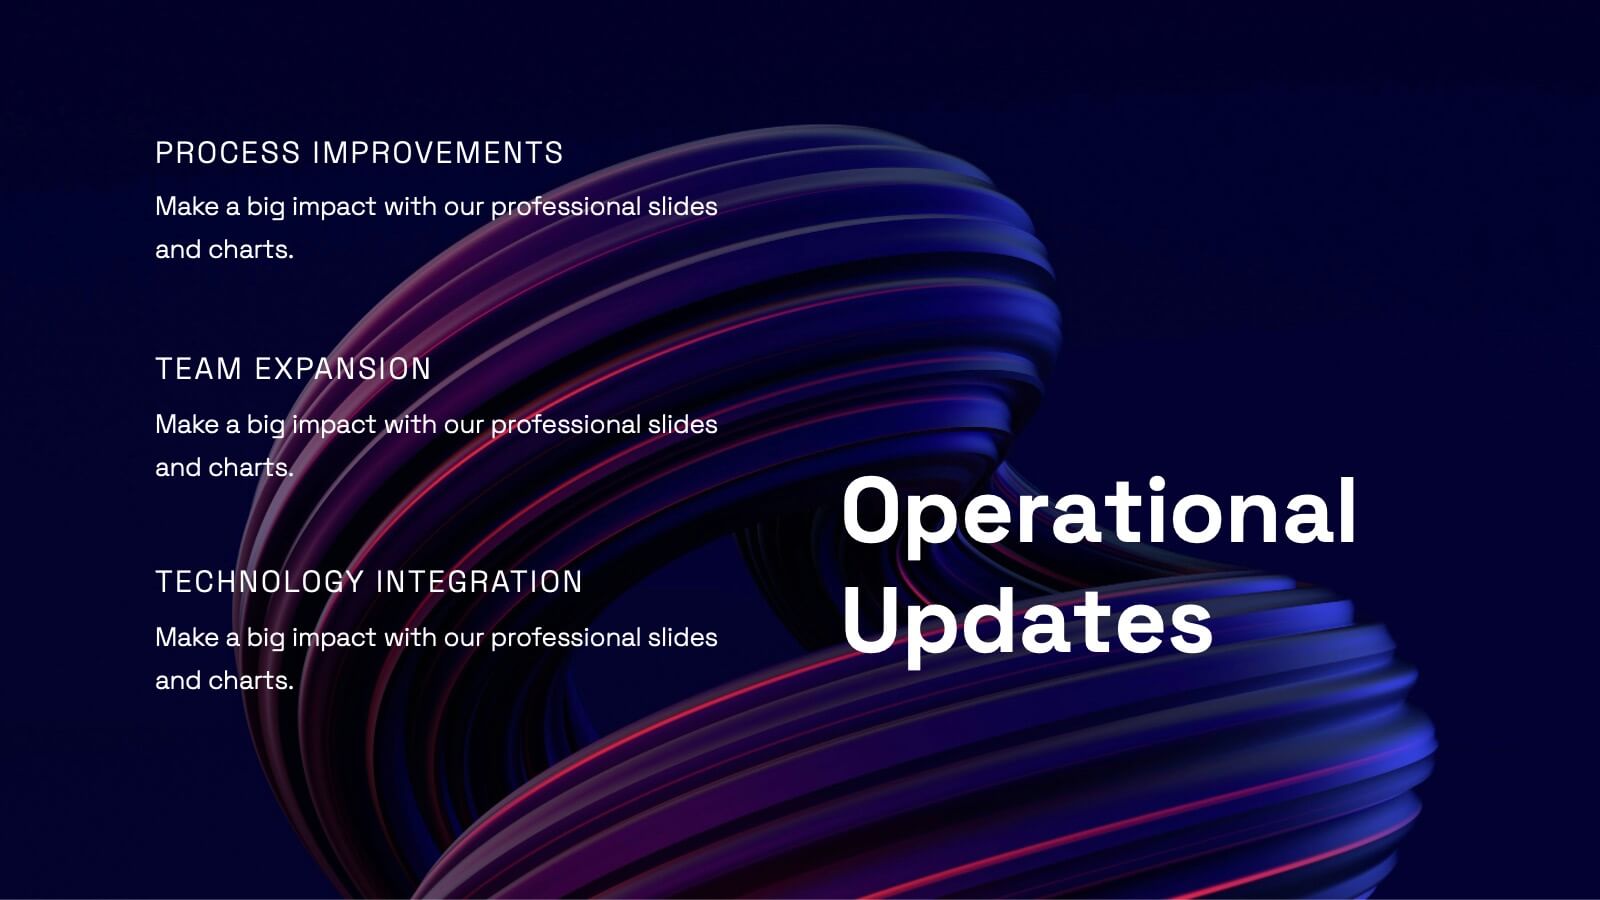
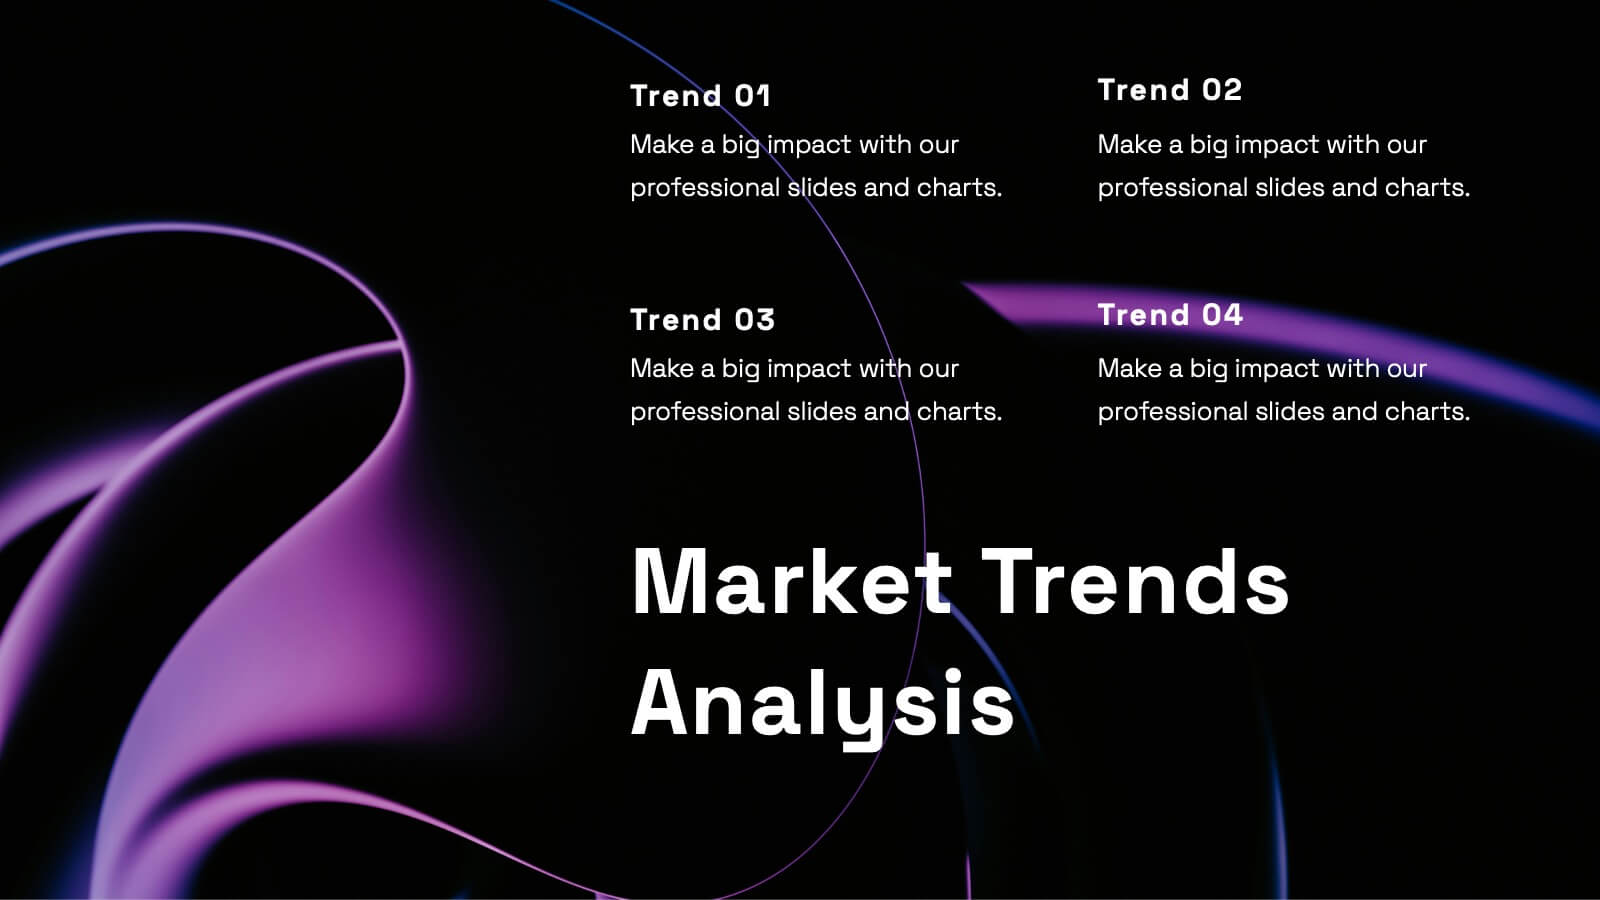
Uplift Financial Report Presentation
Present your financial or business report with this sleek and modern presentation template! It includes essential sections such as performance metrics, financial summaries, project progress, and market trends analysis, ensuring a comprehensive overview. Whether you're discussing key achievements or competitor insights, this template is perfect for delivering a professional and polished report. Compatible with PowerPoint, Keynote, and Google Slides for easy use and customization.


7 diapositivas
McKinsey Business Infographic
The McKinsey 7S Model is a management model developed by consulting company McKinsey & Company. This infographic template offers a framework to analyze and align various internal aspects of an organization to ensure its success and effectiveness. Compatible with Powerpoint, Keynote, and Google Slides. Customize the content, design, and visuals to craft an engaging and informative infographic that showcases McKinsey & Company's global impact and expertise in transforming businesses. This business infographic should serve as a snapshot of McKinsey's core strengths and values.


3 diapositivas
Agriculture Sector Insights Presentation
Bring data to life with a presentation that captures the essence of growth and sustainability. Ideal for showcasing trends, production metrics, or environmental insights, this design blends visual storytelling with professional clarity. Fully editable and compatible with PowerPoint, Keynote, and Google Slides for effortless customization and impactful delivery.


6 diapositivas
North America Weather Map Infographics
Explore our customizable North America Weather Map infographic template, a valuable tool for understanding regional weather patterns. Compatible with PowerPoint, Keynote, and Google Slides, this template simplifies complex data into user-friendly visuals, allowing you to tailor it to your specific requirements. This infographic template offers a foundation for displaying current and historical weather data, temperature trends, precipitation patterns, and more. Whether you're a meteorologist, educator, or just curious, this template provides a versatile platform to create weather-related presentations that suit your unique needs. Impress your audience with this SEO-optimized North America Weather Map infographic template, designed for clarity and ease of use. Customize it to stay informed, plan outdoor activities, and effectively communicate weather information. Get started with your customized infographic today!


4 diapositivas
Project Task Ownership with RACI Chart Presentation
Assign roles clearly with the Project Task Ownership with RACI Chart Presentation. This template simplifies responsibility mapping across tasks using the RACI framework (Responsible, Accountable, Consulted, Informed). With a clean matrix layout, it's perfect for project planning, stakeholder alignment, and workflow transparency. Fully editable in PowerPoint, Canva, and Google Slides.


8 diapositivas
Organizational Hierarchy Tree Diagram Presentation
Streamline Your Organization! The Organizational Hierarchy Tree Diagram Presentation visualizes team structures, reporting relationships, and company workflows. Ideal for corporate presentations, HR planning, and decision-making, it features editable elements for seamless customization. Compatible with PowerPoint, Keynote, and Google Slides, ensuring professional clarity and impact in any business setting.


7 diapositivas
Loves Travel Infographic Presentation
Travel is an opportunity to get out of our comfort zones and be inspired to try new things, it changes our perspective on the world. Use this template to give your audience an overview of a trip and prepare them for what they will be experiencing. This template features an infographic style design, with plenty of room to describe the locations and activities as well as instructions and tips. Build your own infographic with this template, and add it to your presentations. You can easily add your own content in PowerPoint, Keynote, or Google slides and turn it into a fun presentation in minutes.


6 diapositivas
Data-Driven Decision Making with Numbers Presentation
Turn insights into action with this segmented visual template, perfect for showcasing analytics, KPIs, or data-backed strategies. The semi-pie layout organizes information into six labeled sections, making it easy to interpret at a glance. Great for business reports, research summaries, or executive dashboards. Fully editable in PowerPoint, Keynote, and Google Slides.


5 diapositivas
AIDA Steps Infographics
AIDA is a marketing model that is widely used in advertising and promotion. It stands for Awareness, Interest, Desire, and Action. It is a four-stage model that describes the process that a potential customer goes through before making a purchase. This Infographic can help you better understand how you can move your customers through these four stages. This consists of four sections that correspond to each stage of the model. Each section allows you to include a brief explanation of what the stage is, and how it relates to the overall purchase process. With these unique infographics, create an effective marketing strategy that successfully moves your customers through each stage of the AIDA model.
4 diapositivas
Directional Arrow Diagram Slide Presentation
Make your message stand out with a bold visual that points your audience in the right direction. This presentation uses clear directional arrows to highlight steps, options, or key decisions in a way that’s easy to follow and visually compelling. Fully editable and compatible with PowerPoint, Keynote, and Google Slides.


5 diapositivas
Fishbone Diagram for Root Cause Analysis Presentation
Identify and Solve Business Problems with Precision using this Fishbone Diagram for Root Cause Analysis presentation template. Designed to visually map out potential causes, this template enhances problem-solving, decision-making, and process improvement. Featuring a clear fishbone structure, customizable icons, and text placeholders, this template is perfect for business analysts, strategists, and operations teams. Fully editable and compatible with PowerPoint, Keynote, and Google Slides, ensuring a seamless and professional presentation experience.


7 diapositivas
Business Strategy Plan Infographic
A Business Strategy Infographic shows you how to create a business plan that will help you achieve your goals. This infographic is designed to help you understand how your company and competitors are going to win in the marketplace by showing how all of their moves fit together. This template is a beautiful combination of data visualization, charts, and graphics to help you see what's going on in your business. This is the perfect tool for anyone who wants to understand the current state of their operations and make informed decisions about how to move forward. Fully customizable and compatible with Powerpoint, Keynote, and Google Slides.


6 diapositivas
Environmental Policy and Sustainability Plan Presentation
Bring your sustainability message to life with a visual that flows as smoothly as your plan. This infographic presentation template helps explain your environmental goals, action steps, and policy structure using a dynamic, easy-to-follow circular layout. Perfect for eco reports and green strategy briefs. Compatible with PowerPoint, Keynote, and Google Slides.